

Introduction
Against the background of global warming, the variations of glaciers in the Tibetan Plateau (TP) area and their effect on the surrounding environment have drawn great attention (Reference Immerzeel, Van Beeke and BierkensImmerzeel and others, 2010; Reference BolchBolch and others, 2012). Accompanied by a significant temperature increase since the mid-19th century, the majority of glaciers on the TP have retreated (e.g. Reference Yao, Liu, Pu, Shen and LuYao and others, 2004; Reference Sakai, Fujita, Duan, Pu, Nakawo and YaoSakai and others, 2006; Reference Ye, Kang, Chen and WangYe and others, 2006). Numerical studies have shown that glaciers in the TP have retreated with increasingly negative mass balance in recent years (e.g. Reference Shi and LiuShi and Liu, 2000; Reference XiaoXiao and others, 2007; Reference LiLi and others, 2008; Reference BolchBolch and others, 2010). Glacial retreat and significant mass loss may not only cause natural hazards such as landslides and glacier lake outburst floods but also endanger water resources in the longer term (Reference Immerzeel, Van Beeke and BierkensImmerzeel and others, 2010).
Investigations of the relationship between climate and glacier mass balance have been undertaken using various empirical and physical models (e.g. Reference AndreasAndreas, 1987; Reference Braithwaite and OlesenBraithwaite and Olesen, 1990; Reference Kayastha, Ohata and AgetaKayastha and others, 1999; Reference HockHock, 2005). Physical models provide direct estimates of energy-balance components, but detailed observational data are required for validation. Owing to the lack of observational data for the TP, few studies have applied physical models to investigate glacier surface energy and mass balance in the region. Observations of climate and mass balance for Zhadang glacier in the central TP have been conducted since 2005 (Reference KangKang and others, 2009; Reference Zhou, Kang, Gao and ZhangZhou and others, 2010), providing an opportunity to test an energy-balance model for glacier energy and mass balance. Formulating a realistic physically based model of glacier mass balance is critical to predicting future glacier change under different climate projections, especially given that very few such studies have been undertaken in the TP (Reference Takahashi, Ohata and XieTakahashi and others, 1989; Reference Zhang, Yao, Pu, Ohata, Yabuki and FujitaZhang and others, 1996; Reference YangYang and others, 2011).
Field Observations
Zhadang glacier (Fig. 1) is on the northeastern slope of Nyainqentanglha mountain in the central TP (30°28.57′ N, 90°38.71′ E; area 2.0 km2; length 2.2 km). This valley-type glacier faces north-northwest and flows from 6090 to 5515 m a.s.l. It is debris-free and has a fan-shaped terminus (Reference Chen, Kang, Zhang and YouChen and others, 2009). Two automatic weather stations (AWSs) have been operating at Zhadang glacier since May 2005 (AWS1 at 5400 m a.s.l. and AWS3 at 5800 m a.s.l.; Fig. 1). An automatic energy-budget station which provides the data for analysis located in the ablation zone has been operational since May 2009 (AWS2 at 5660 m a.s.l.; Reference MaussionMaussion and others, 2011). AWS2 measures the following data every 10 min for a nearly horizontal glacier surface: incoming and reflected solar radiation, air temperature, relative humidity, air pressure, net radiation (1.8 m above the glacier surface), wind speed and wind direction (2.5 m above the glacier surface) and surface temperature. Surface level of the glacier at AWS2 was measured by a sonic ranging sensor. At the glacier terminus (5580 m a.s.l.), an all-weather rain gauge with a hanging weighing transducer (T200b) has been operating since 21 May 2010 (Fig. 1). Details of the AWSs and rain gauge instruments are listed in Table 1.
Location of Zhadang glacier and the AWSs. Glacier contours are from a 1970 topographic map and the glacier outline is from a Landsat image recorded in 2007.

Overview of AWSs and rain gauge instruments and their specifications
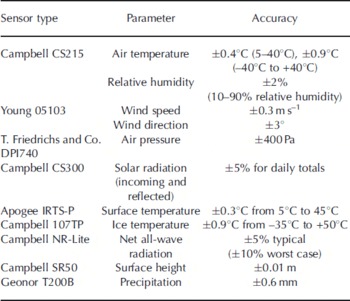
The temperature and relative humidity sensors are in ventilated radiation shields (THIES Clima GmbH). The ventilators are directly connected to two solar panels, which prevent temperature errors introduced by radiation overheating. Relative humidity measurements recorded when temperature was below 0°C and were corrected using the method of Reference Curry and WebsterCurry and Webster (1999). To avoid the effect of a poor cosine response of the radiation sensors at low sun angles, and a possible phase shift due to tilting of the sensor during the daily cycle of incoming solar radiation (Reference Giesen, Andreassen, Van den Broeke and OerlemansGiesen and others, 2009), the albedo (a), defined as the ratio of the reflected to the incident shortwave radiation, was calculated using the accumulated albedo method (Reference Van den Broeke, Van As, Reijmer and Van de WalVan den Broeke and others, 2004).
AWS2 toppled over on 1 July 2009 and rested horizontally on the ice surface until 12 August 2010. For this time interval, only surface height and air pressure data are available from this station. However, a near-linear relationship between the meteorological data of AWS1, AWS2 and an AWS at the Nam Co station (Fig. 1) allowed us to linearly interpolate temperature, relative humidity, wind speed and global radiation for this data gap using data from AWS1 and the Nam Co AWS. Sonic ranging sensor connectivity problems resulted in two gaps in the surface height data in 2011 (22 March–20 April and 21 May–28 June).
Because of the gentle slope and small distance from the gauge site to AWS2, the topographic effects of precipitation were neglected. The data from the rain gauge were used directly as the precipitation amount for the AWS2 site. For the period before the rain gauge was operational, daily precipitation amounts were deduced from sonic ranging data with a snowpack density value of 400 kg m−3 (average observed values from snow pit) during the winter from 4 October 2009 to 20 May 2010 and the densification process of snowpack was not considered here.
Climate Conditions at the Study Site
The Nyainqentanglha mountain region is affected by both the Indian summer monsoon and westerlies during winter (Reference Yatagai and YasunariYatagai and Yasunari, 1998), producing distinct seasonal oscillation of the climate. Summer is associated with intense solar heating and moisture transported by the Indian monsoon. In contrast, low sun elevation and strong westerlies cause cold dry windy winters. Figure 2 shows meteorological parameters for Zhadang glacier for the two mass-balance years that were used as the input data for the model. Daily mean temperature changed markedly with the seasons, with a range of −22.1°C to 5.8°C. From late May to September, daily temperatures generally rose above 0°C at the study site. Relative humidity and precipitation also showed seasonal variation. Because of the high atmospheric transmissivity on the TP, incoming solar radiation can reach 88% of the extraterrestrial solar radiation value. Wind also varied seasonally: in summer, the wind speed never exceeded 10 m s−1 and the wind direction was predominantly from the southeast; whereas in winter, wind was much stronger and came predominantly from the northwest (Fig. 3). From the observation at the Nam Co station, >90% of the precipitation was delivered between May and September in 2005/06 (Reference You, Kang, Li, Li and LiuYou and others, 2007). May to September is considered the wet season and the corresponding dry season is from October to April. The accumulation and ablation seasons of the glacier overlap in summer (Reference KangKang and others, 2009). Glaciers in this region are therefore defined as summer-accumulation-type glaciers (SAT glaciers) (Reference Ageta and HiguchiAgeta and Higuchi, 1984), the mass balance of which is considered to be more sensitive to temperature change than that of winter-accumulation-type glaciers (Reference FujitaFujita, 2008).
Daily mean values of (a) air temperature, (b) wind speed, (c) relative humidity, (d) global solar radiation and (e) precipitation at Zhadang glacier during the study period from 4 October 2009 to 15 September 2011. Dashed line in (d) indicates calculated extraterrestrial solar irradiance. (OND = October to December, etc.)

Wind direction and intensity of half-hourly observational data at AWS2 for summer and winter (summer: 1 May–30 September 2010 and 1 May–15 September 2011; winter: 4 October 2009 to 30 April 2010 and 1 October 2010 to 30 April 2011).

Surface Energy- and Mass-Balance Model
Energy balance at the glacier surface can be expressed as
where S in is incoming shortwave or global radiation, S out is reflected shortwave radiation, L in is incoming longwave radiation, L out is outgoing longwave radiation, H S is turbulent sensible heat flux, H L is turbulent latent heat flux, G is subsurface heat flux and Q is heat flux for melting. Energy fluxes are defined as positive when directed toward the glacier surface and negative when directed away from the surface. Thus Eqn (1) can be expressed as
where S net is net shortwave radiation (S net = S in × (1–a)) and L net is net longwave radiation (L in + L out).
Surface albedo (a = −S out/S in) is a critical factor in the mass balance of a glacier surface (Reference Van de Wal, Oerlemans and Van der HageVan de Wal and others, 1992). Considering their dramatically different effects on albedo, snow and ice surfaces are treated individually in this model. Although there are many methods to quantify snow albedo (Reference Brock, Willis and SharpBrock and others, 2000), most define albedo as a high constant value when significant snowfall occurs and a steadily decreasing value with time after snowfall (e.g. US Army Corps of Engineers, 1956; Reference Oerlemans and KnapOerlemans and Knap, 1998). The problem with this approach is that it yields large discrepancies between measured and modelled albedo during prolonged periods without snowfall (Reference Hock and HolmgrenHock and Holmgren, 2005).
The parameterization of snow-surface albedo in the model used in the present study followed the method of Reference Yamazaki, Kondo, Sakuraoka and NakamuraYamazaki and others (1993), which evaluates surface albedo based on surface snow density, taking into account multiple reflections in the surface snow layer and assuming that each such layer consists of an ice plate and an air layer in the vertical dimension. This parameterization method also considered the influence of water and the progress of compactive viscosity as shown by Reference Fujita and AgetaFujita and Ageta (2000). Ice-surface albedo was assumed to vary as a function of dew-point temperature (Reference Mölg, Cullen, Hardy, Kaser and KlokMölg and others, 2008).
The contribution of incoming longwave radiation to energy balance was calculated using standard meteorological variables. A key point is the parameterization of atmospheric emissivity (Reference Crawford and DuchonCrawford and Duchon, 1999). Reference BrutsaertBrutsaert (1975) developed a physically rigorous formula to express the relationship between atmospheric emissivity (”) and meteorological parameters as
where clf is the ratio of the measured incoming shortwave radiation to the incoming shortwave radiation at the top of the atmosphere, and T and e are the air temperature and vapour pressure, respectively. Reference Sicart, Hock, Ribstein and ChazarinSicart and others (2010) pointed out that the parameterization performed better for daily than for hourly simulations. Therefore, the average daytime clf was used to calculate daily L in. Thus the amount of incoming longwave radiation can be expressed as
where σ is the Stefan–Boltzmann constant.
L out was obtained by the Stefan–Boltzmann law from modelled surface temperature and surface emissivity (being set to 1).
Turbulent sensible (H S) and latent heat fluxes (H L) were calculated by the bulk aerodynamic method. The gradients of mean horizontal wind speed (U), mean air temperature (T) and mean specific humidity (q) were assumed to be equal to the finite difference between the measurement level and the surface. The turbulent fluxes were expressed as
where ρ is air density, CP is the specific heat capacity of air, T is air temperature, T s is surface temperature, q s is specific humidity at the surface, U is wind speed, lf is latent heat of evaporation (2.514 × 10⁶ J kg−1) or sublimation (2.849 × 10⁶ J kg−1), which are used based on surface temperature, and C S and C L are the bulk exchange coefficients for sensible and latent heat, respectively. Constant bulk exchange coefficients (C S = C L = 0.002; Reference Kondo and YamazawaKondo and Yamazawa, 1986) were used to calculate the turbulent heat flux as recommended by Reference Fujita and AgetaFujita and Ageta (2000) and Reference Sakai, Fujita, Nakawo and YaoSakai and others (2009) because surface roughness and wind profiles are unknown over snow and ice in this case.
Total energy flux in the subsurface consists of the energy flux from penetrating shortwave radiation together with conductive heat flux. The former was calculated as an exponential decline of net shortwave radiation with increasing depth from the surface and it is assumed that the extinction coefficient is a constant value (40 m−1) for both snow and ice and independent of snow density, grain size, wavelength or other properties (Reference Fukami, Kojima and AburakawaFukami and others, 1985). Reference Fukami, Kojima and AburakawaFukami and others (1985) pointed out that the thermal influence of solar radiation occurs almost entirely above a depth of 0.1 m in the extinction coefficient range 20–100 m−1. The conductive heat flux in the subsurface was expressed according to the temperature profiles during a given time-span:

where K is thermal conductivity, of which different values are used for snow (K s) and ice (K i). In this model, K s was calculated as a function of snow density following Reference MellorMellor (1977), whereas K i was obtained as a function of ice temperature (Reference HobbsHobbs, 1974).
Surface temperature (T s) is a key variable for the glacier surface energy balance. It is calculated using an iterative procedure from the energy available at the surface (Reference AndreasAndreas, 1987; Reference Fujita and AgetaFujita and Ageta, 2000; Reference Fujita, Ohta and AgetaFujita and others, 2007). If T s exceeds the melting point, it is set to 273.15 K and the remaining flux represents the heat flux for melting (Q).
Refreezing water in the subsurface was also considered. Refreezing may take place in a range of englacial and supraglacial locations. Refreezing takes place in the snow layer when percolating early summer meltwater refreezes in the cold snow layer and in the capillary water stored in snow pore spaces at the end of summer (Reference Braithwaite, Laternser and PfefferBraithwaite and others, 1994; Reference Fujita, Seko, Ageta, Pu and YaoFujita and others, 1996; Reference Schneider and JanssonSchneider and Jansson, 2004). Because of the presence of cold ice below the snow layer, meltwater can also refreeze to form superimposed ice at the interface between snow and ice layers (Reference Marsh and WooMarsh and Woo, 1984; Reference Pfeffer and HumphreyPfeffer and Humphrey, 1996). It was assumed that the snow layer can retain 5% of its volume as water (W retain) (Reference Fujita and AgetaFujita and Ageta, 2000). The amount of refrozen water (RW) was calculated from the temperature profile of snow and ice as follows:

where C i is the specific heat of ice, lf is the latent heat of melting, z is the depth where the energy fluxes become nil, and ρ s and ρi are the density of snow and ice, respectively.
Precipitation at high altitudes occurs as solid (snowfall), liquid (rainfall) and mixed phases (Reference Kayastha, Ohata and AgetaKayastha and others, 1999). The proportion of snowfall versus rain is governed by the wet-bulb temperature T W (Reference YamazakiYamazaki, 2001). The following equations are proposed for the fraction ([0,1]) of snowfall (P s) in the total precipitation (P p):
and the amount of rainfall is expressed as
Wet-bulb temperature, T W, can be calculated as
B = 0.0006336 × p, where T a is air temperature (°C), e is water vapour pressure (hPa) and p is air pressure (hPa).
Validation of the Model
A set of observed daily data (air temperature, relative humidity, wind speed, incoming shortwave radiation and precipitation) from 4 October 2009 to 15 September 2011 was used as input data to run the energy-balance model. The snow thickness and average ice temperature recorded on 4 October 2009 were used as the initial conditions. Validation of the model results against the measured data was undertaken as described below.
Comparisons of observed and calculated variables for AWS2 (Fig. 4) indicate that the modelled surface albedo values are similar to the observed values (Fig. 4a). Since a constant value was used for snow density (mean values of the field observations: 400 kg m−3), the modelled albedo had almost the same value even after a significant snowfall, which caused a small discrepancy between the observed and modelled values. The observed albedo values were both lower than calculated in early June 2010 and early July 2011. This may be due to the deposition of dust in the beginning of the melt season (Reference Fujita and AgetaFujita and Ageta, 2000; Reference FujitaFujita, 2007), which was not considered in the model. However, the results of the modelled snow surface albedo are generally acceptable. In this study, the ice albedo varied as a function of dew-point temperature, which strongly affects ice surface albedo (Reference Mölg, Cullen, Hardy, Kaser and KlokMölg and others, 2008). Since observations of albedo data in summer 2010 are lacking, this method could only be validated through mass-balance results because observed changes of surface level during the period were affected by the data gap. Although L in was not measured directly by AWS2, it was calculated as a residual using data from three of the other four components of net radiation (L out was calculated based on measured surface temperature). The results show a close correlation between the modelled and observed data (Fig. 4b). Figure 4c presents a comparison of observed and calculated surface temperatures. During the data gap in summer 2010, the daily mean air temperature was always above 0°C, and thus the modelled daily surface temperature was 0°C. Variations in snow depth and the amount of melting ice (which has a density of 900 kg m−3) were also validated by observed surface level data (Fig. 4d). The modelled results agree well with the observed values, thereby confirming the low value for ice-surface albedo during the data gap in summer 2010. In general, the model incorporated almost all the energy exchange that took place at the glacier surface and performed well in calculating these variables.
Observed and modelled daily (a) albedo, (b) incoming longwave radiation, (c) surface temperature and (d) height from the sonic ranger sensor to Zhadang glacier surface and their correlation coefficient at the site AWS2 for 4 October 2009 to 15 September 2011. Ice albedo calculated as a function of daily dew-point temperature (T W): −0.0536°C−1 T W + 0.4681, which was gained from the correlation of observed ice albedo and T W during summer 2011. (OND = October to December, etc.)

Results
Energy balance
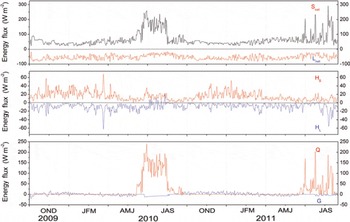
Daily surface energy components of the energy balance are shown in Figure 5. The energy-balance results indicate that S net was highly variable, from a very high average value of 92 W m−2 in summer to a low of 46 W m−2 in winter (Table 2). Aside from seasonal changes in sun elevation, the main reason for the seasonal variability of S net is the varying glacier surface albedo. The average albedo (0.8) indicates that the snow surface reflected most of S in during winter. In contrast, the lower average albedo (0.65) during summer was associated with surface melt. The mean value of L net in summer was −47 W m−2, slightly less than the mean value of −59 W m−2 in winter. This difference is related to variations in L in and L out, the two components of L net. The value of L out, which is governed by glacier surface temperature, exhibited regular seasonal changes during the 2 years of observations. The value of L in, depending on atmospheric temperature, cloud cover and humidity, was high in summer and low in winter (Table 3; Fig. 4). Positive H S indicates heat transfers from the air to the glacier surface throughout the year. The seasonal variation in H S points to a larger temperature gradient in winter than in summer (Table 3). For turbulent H L, a sign shift from negative to positive occurred during summer. The relatively high air temperature and relative humidity (Table 3) leads to a reversal of the humidity gradient and therefore a positive H L for a melting valley glacier (Reference OerlemansOerlemans, 2000). The windy conditions contribute to the larger values of both H S and H L in winter than in summer. The sign of the subsurface heat flux (G), which shifted from positive to negative, is a function of the annual energy cycle. A positive value for G suggests that subsurface cold content accumulated during winter, whereas a negative G implies the release of cold content in summer. As a result of the energy balance, positive melt heat flux (Q), with almost the same oscillation trend as S net, occurred only in summer.
Daily mean values of energy-balance components at site AWS2 for 4 October 2009 to 15 September 2011. S net is net shortwave radiation, L net is net longwave radiation, H S is sensible heat flux, H L is latent heat flux, G is subsurface conductive heat flux and Q is the melting component. (OND = October to December, etc.)
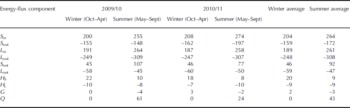
Mean seasonal values of energy-flux components (W m−2)
Seasonal mean values of meteorological variables
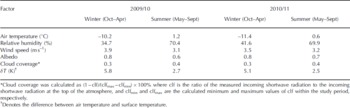
Table 4 lists the contributions of energy-flux components to total heat flux. For the whole period of observation, the radiation heat flux (|S net|+|L net|) accounted for 82% of the total heat flux and was the most important heat-flux component. Turbulent sensible and latent heat flux followed at 10% and 6%, respectively. The subsurface heat flux (2%) contributed little of the energy-flux components to the total heat flux throughout the study. These fluxes exhibited the same order-of-magnitude contribution in both winter and summer. The main seasonal variation in the energy balance during the study period is found in two radiation components: net shortwave radiation and net longwave radiation. During the winter season, L net dominated the radiation heat-flux component, but S net became more important during the summer season.
Seasonal energy fluxes at the glacier surface and proportional contribution of each flux
Glacier mass balance
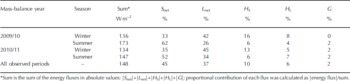
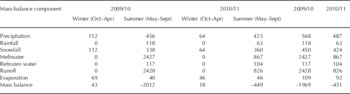
Table 5 lists the calculated mass-balance components at the AWS2 site. The results show that most of the precipitation occurred during summer: 80% and 87% in 2010 and 2011, respectively. The minor part of the precipitation that fell during winter was all in the form of snowfall. During summer, 74% and 85% of the precipitation was in the form of snow in 2010 and 2011, respectively. Because of strong melting in summer, nearly all of the penetration water (rainfall and meltwater) ran off as discharge and only a small amount (117 mm w.e. in 2010 and 104 mm w.e. in 2011) was refrozen as superimposed ice. Seasonal variations in evaporation (sublimation) during the study period were subtle (average value of 100 mm w.e. for the 2 years). Although the mass balance was positive in both winters, the large mass deficits in summer resulted in negative annual mass balances of −1968 and −432 mm w.e., respectively, for the two years at this site.
Calculated annual and seasonal mass-balance components at site AWS2: mass balance = precipitation–runoff–evaporation; runoff = rainfall + meltwater–refrozen water (mm w.e.)
Discussion
Sensitivity of mass balance to meteorological variables
In order to test the sensitivity of mass balance to meteorological variables, test cases were prescribed. Here we altered the air temperature by ±1°C, relative humidity by ±20% and precipitation by ±20% throughout the period. The mass-balance change then reflects its sensitivity to the perturbation of variables. As shown in Figure 6, 2.04 m w.e. more meltwater (an increase of 85%) would run off at the observation site if the air temperature was increased by 1 K, while 0.69 m w.e. (29%) of snow or ice would melt if air temperature was decreased by 1 K. Air temperature, as a key factor, will particularly control when melt commences and how fast the winter snowpack is removed. Since lower ice albedo will amplify ablation (Reference Andreassen, Van den Broeke, Giesen and OerlemansAndreassen and others, 2008), increasing temperature will not only increase ice ablation but also prolong the melt season. Thus mass balance is more affected by an air temperature perturbation of +1 K than by a perturbation of −1 K, especially in the ablation area of the glacier.
The sensitivity of specific mass balance was examined by perturbations of temperature (±1 K), relative humidity (±20%) and precipitation (±20%). The results show that the specific mass balance is more sensitive to changes in precipitation than other variables.

The mass-balance changes for perturbations of relative humidity (RH) are −1.3 mw.e. (55%) and 0.68 m w.e. (29%) for +20% and −20% humidity perturbations, respectively. Previous studies also show the sensitivity of glacier mass balance to changes in moisture (Reference Wagnon, Ribstein, Kaser and BertonWagnon and others, 1999, Reference Wagnon, Ribstein, Francou and Sicart2001; Reference Francou, Vuille, Wagnon, Mendoza and SicartFrancou and others, 2003; Reference Mölg, Georges and KaserMölg and others, 2003). An increase of 20% in precipitation directly influences the amount of accumulation, but also changes the albedo and thus the melting. More snowfall increases surface albedo and reduces the main energy source (net shortwave radiation), leading to less ablation (Reference Mölg, Cullen, Hardy, Kaser and KlokMölg and others, 2008). The sensitivity to a ±20% change in precipitation is higher than for a 1 K change in temperature. The results show that the model is nearly twice as sensitive to a 20% change in precipitation as to a 20% change in relative humidity.
Typical features of the energy and mass balance on Zhadang glacier
Zhadang glacier is subject to particular seasonal climatic conditions that induce seasonal circumstances of energy and mass balance. In winter, negative L net, the dominant radiation component, caused net radiation to be negative. This part of the energy sink was compensated by positive turbulent heat flux (H S +H L) and subsurface heat flux G. Thus, no melting occurred in winter. The sign of H L (negative) indicates that the only mass loss during winter was in the form of sublimation. In summer, positive S net, the most significant heat flux, together with H S, contributed to positive Q for glacier surface melting. The energy released by condensation, positive H L (see Fig. 5), enhanced surface melting during midsummer (Reference OerlemansOerlemans, 2000; Reference Giesen, Van den Broeke, Oerlemans and AndreassenGiesen and others, 2008, Reference Giesen, Andreassen, Van den Broeke and Oerlemans2009). As a result, strong summertime melting occurred on the glacier surface in the ablation zone.
Changes in summer climates and their influence on mass balance
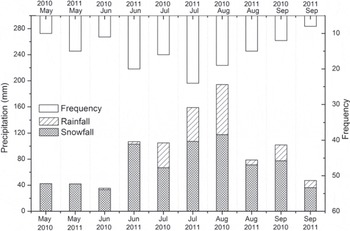
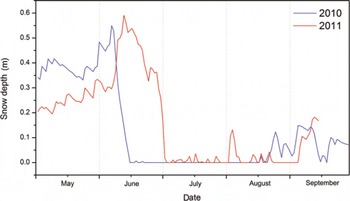
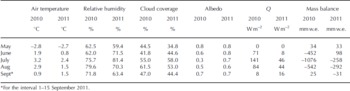
The monthly frequency, total amount and form of precipitation during the summer (May–October) are shown in Figure 7. According to Reference Chang and ChenChang and Chen (1995), the warm wet airflow of the Indian monsoon begins in mid-June, which is thus the beginning of the precipitation season. The precipitation monthly distribution implied that the Indian monsoon started a month later than usual in 2010. In contrast, the precipitation increased dramatically in June 2011, indicating that the Indian monsoon invaded the region. Subsequently, the monsoon became strongest with the highest rate of precipitation in July, followed by a weakening in August. Reference YangYang and others (2011) reported that glacier surface energy- and mass-balance variations were related to the progress of the Indian monsoon during the melting season in southeast Tibet. Monthly mean values of energy-balance components and mass balance are presented in Figure 8 and Table 6, respectively. In May 2010 and 2011, the energy input as net radiation and H S were entirely consumed by H L (sublimation) and G (as cold content release) and therefore no melting occurred. All snowfall contributed to mass accumulation. Thus, positive mass balance was shown on the glacier surface (also shown by the variation in snow depth in Fig. 9). With increasing sun elevation and air temperature in June, positive Q emerged on the glacier surface at the beginning of the melting season. In June 2010, a large amount of net shortwave radiation (71 W m−2) was available for melting on the glacier surface due to early exposure of the ice surface (Fig. 9). In contrast, intense snowfall ensured that the glacier surface was covered with snow (albedo = 0.8) in June 2011. The snow surface reflected most of S in, and as a result only a small amount became melt heat flux Q (8 W m−2). Therefore, distinctly different mass-balance results were found in the two years: −452 mm w.e. in June 2010 and 98 mm w.e. in June 2011. In July 2010, with increasing air temperature, the amount of snowfall was small. Thus, the ice-dominated glacier surface (average albedo of 0.3) absorbed most of S in, and strong melting (Q = 141 W m−2) occurred on the surface, causing a huge mass deficit of −1076 mm w.e. In July 2011, the thin snow layer (α = 0.7) from frequent snowfall kept S net at a low level and resulted in a low melting rate on the surface (Q = 46 W m−2) and a consequent mass-balance result of −258 mm w.e. In August 2010, precipitation reached its highest amount. Although nearly half of the precipitation was rainfall, snowfall still kept the surface at a relatively high albedo (0.5) and resulted in a large amount of S net (S net = 109 W m−2). Cloudy conditions (clf = 61.5%) also enhanced L in and provided a positive effect for melting. Furthermore, the positive H L at the beginning of August (Fig. 5) also made a positive contribution to surface melting. As a result, there was still a large melt heat flux (84 W m−2), which resulted in a mass balance of −542 mm w.e. during August 2010. In August 2011, due to less snowfall, a lowalbedo surface (0.6) absorbed the largest amount of S in (S net = 108 W m−2) compared with former months and also led to the largest net radiation (57 W m−2). However, evaporation was also largest at this time and shared −17 W m−2 of heat flux going into evaporation. The outcome of the energy balance was a 44 W m−2 heat flux available for melting and a mass balance of −292 mm w.e. during August 2011. The small positive mass balance in September marked the end of the melt season for that year.
The monthly amount, form and frequency of precipitation in the summers of 2010 and 2011. Frequency was calculated as the number of daily precipitation events per month.
Monthly mean energy components of the glacier surface for summer (September 2011: for the interval 1–15 September).

Daily snow depth over the glacier ice at AWS2 during the summers of 2010 and 2011.
Monthly mean values of meteorological factors, melt heat flux and mass balance during summer
Although the precipitation sum was almost the same in both summers (456 mm w.e. in 2010 and 423 mm w.e. in 2011) there was a distinct mass-balance difference between the summers of 2010 (−2011 mm w.e.) and 2011 (−449 mm w.e.). Fujita (2000) pointed out that some precipitation (rain) fails to contribute to the accumulation, but snowfall keeps the albedo high and largely limits ablation during the melt season on SAT glaciers. Thus, SAT glaciers are more vulnerable than winter-accumulation-type glaciers. This is because the increase in air temperature causes a decrease in accumulation and a drastic increase in ablation with lowering albedo. This was the situation on Zhadang glacier during the summer of 2010. A study on Glaciar Zongo, Bolivia (Reference Sicart, Hock, Ribstein, Litt and RamirezSicart and others, 2011), suggests that melt is reduced by snowfall during the wet season via the albedo effect during the melt season. We thus conclude that SAT glaciers are very sensitive to variations of precipitation seasonality (or monthly distribution) and form (proportion of snowfall and rainfall) as suggested by previous studies (e.g. Reference KangKang and others, 2009).
Conclusions
A physically based energy-balance model with forcing data including air temperature, humidity, wind speed, global radiation and precipitation was used to calculate the surface energy balance at site AWS2 on Zhadang glacier over 2 years. The calculated surface albedo, incoming longwave radiation, surface temperature and surface height corresponded well with observed values. The results indicate that the model is reliable enough to make robust calculations of surface energy and mass balance. For the whole observation period, the radiation component dominated (82%) the total surface energy heat fluxes. Turbulent sensible (10%) and turbulent latent heat flux (6%) followed. Subsurface heat flux represented a very minor proportion (2%) of the total heat flux. The main seasonal variations in energy fluxes were caused by changes in net shortwave and longwave radiation and these led to different mass-balance results. In winter, dominant negative net longwave radiation resulted in negative net all-wave radiation. This energy sink was offset by positive turbulent and subsurface heat fluxes, and no melt occurred in winter. In summer, net shortwave radiation was the most important radiation component and caused positive net radiation. The positive radiation heat flux, together with positive turbulent heat flux, provided the melt heat flux for surface melting. The dramatic differences in summer mass balance between 2010 and 2011 indicate that the glacier surface mass balance was closely related to precipitation seasonality and form. The present study suggests that glacier mass-balance models that use annual variations as input factors, rather than seasonal or monthly variations, may err significantly in their estimates of mass-balance variability on SAT glaciers. To better describe the evolution of summer-accumulation glacier surface, high time resolution precipitation data are necessary during the calculation of glacier surface mass balance.
Acknowledgements
This work is supported by the Global Change Research Program of China (2010CB951401), the National Natural Science Foundation of China (41190081, 41225002) and the German Research Foundation (DFG) within the Tibetan Plateau Priority Programme (TiP) (SCHE 750/4-1, SCHN 680/3-1 and BU 949/20-1). We thank colleagues working at Nam Co station.


