


Introduction
Bird species occupying open habitats are subject to constant changes in habitat suitability and availability in relation to the speed of forest colonisation and the frequency of disturbance re-opening their habitats (Sirami et al. Reference Sirami, Brotons, Burfield, Fonderflic and Martin2008). Disturbances can be natural, such as wildfires, or human-related with changes in land use and farming practices (Delgado-Artés et al. Reference Delgado-Artés, Garófano-Gómez, Oliver-Villanueva and Rojas-Briales2022). Many species considered specialists of open habitats actually occur along a gradient of human-impacted habitats from mostly natural to intensive farming landscapes (Arlt et al. Reference Arlt, Forslund, Jeppsson and Pärt2008). Populations breeding in intensive farming areas exhibit alarming declines, currently being affected by the impoverishment of food chains, mortality caused by pesticides or nest destruction caused by farming practices (for ground-nesting species) (Rigal et al. Reference Rigal, Dakos, Alonso, Auniš, Benkő and Brotons2023). At the other end of the gradient, the abandonment of agriculture can lead to reduced breeding areas as a natural consequence of habitat closure (Sanderson et al. Reference Sanderson, Kucharz, Jobda and Donald2013; Sirami et al. Reference Sirami, Brotons, Burfield, Fonderflic and Martin2008).
The Laniidae family includes 33 species specialists of open habitats including a varying proportion of farming landscapes according to species (Fuchs et al. Reference Fuchs, Alström, Yosef and Olsson2019). Among the six species of shrike occurring in Europe, all but one – Red-backed Shrike Lanius collurio – are exhibiting a steep decline (Keller et al. Reference Keller, Herrando, Vorisek, Franch, Kipson and Milanesi2020). Several species show rapid range contraction, i.e. Great Grey Shrike L. excubitor, Woodchat Shrike L. senator, Lesser Grey Shrike L. minor, and two are currently Red Listed – Woodchat Shrike (Near Threatened) and Iberian Grey Shrike L. meridionalis (Vulnerable) (BirdLife International 2017). The latter is one of the few bird species endemic to western Europe, being restricted to the north-western side of the Mediterranean basin (Klassert et al. Reference Klassert, Hernández, Campos, Infante, Almeida and Suárez2008; Supplementary material Figure S1).
The Iberian Grey Shrike is undergoing a severe decline in its whole range putatively due to agricultural intensification on the one hand and agricultural abandonment (reduction in grazed areas) causing increased forest cover in more natural habitats over the long term on the other hand (Madroño et al. Reference Madroño, Gonzalez and Atienza2004). This species occurs in a variety of habitats including vineyards, diverse dry crop production with lightly managed field margins and interspersed fallows or extensive pastures, and scrublands of low vegetation height with patches of bare ground (called matorral or garrigue; Madroño et al. Reference Madroño, Gonzalez and Atienza2004). The decline is particularly severe in Spain which is thought to host 95% of the global population: there was a 70% decline at least between 1998 and 2014–2018 (currently 360,000–540,000 individuals; Infante Reference Infante, Molina, Nebreda, Muñoz, Seoane, Real and Bustamante2022). Populations are also declining in Portugal (13–40% between 2004 and 2011) and France (40% between 2000 and 2012) (BirdLife International 2017). It is believed that the current decline is mostly driven by populations breeding in farming habitats. However, dedicated quantitative surveys remain sparse and to what extent those declines are habitat-specific and whether populations occurring in natural habitats are stable, currently remain unknown.
In order to document spatio-temporal trends of the Iberian Grey Shrike in natural scrubland areas in south-eastern France, we designed a multiple-season, site-occupancy monitoring scheme (MacKenzie et al. Reference MacKenzie, Nichols, Royle, Pollock, Bailey and Hines2018). Every other year between 2013 and 2023, a random sample of about 200 25-ha plots was monitored. The plots were surveyed twice a year within the breeding season to account for imperfect detection of this secretive species, by a network of volunteer ornithologists. We further quantified the influence of proxies for habitat openness, resource availability, and human disturbance on the probability of shrike occurrence.
Methods
Study area and species
The study took place in the Bouches-du-Rhône and Vaucluse districts, part of the Provence–Alpes–Côte-d’Azur region in south-eastern France (Figures S1 and S2). There, the Iberian Grey Shrike is mostly a sedentary species, possibly with some females making short-distance movements in winter (Campos and Martín Reference Campos and Martín2010). Breeding territories are readily occupied by both females and males in February. As with other shrikes, the Iberian Grey Shrike is found in both farming (landscapes with various proportions of dry grasslands, vineyards, and cereals) and natural habitats (open scrublands). Here we focused on the natural scrubland habitats, typically restricted to limestone massifs, which host the majority of the population in the region (c.75%; authors’ unpublished data). Such areas were intensively grazed by sheep and goats in the past, but this farming practice has been largely abandoned and contributes only marginally to habitat openness today. This has resulted in a sharp increase of pine-dominated forests (Delgado-Artés et al. Reference Delgado-Artés, Garófano-Gómez, Oliver-Villanueva and Rojas-Briales2022).
Shrike territories are typically scrublands dominated by oak shrubs Quercus coccifera and Q. ilex interspersed with patches of low vegetation (e.g. Brachypodium retusum, Thymus vulgaris) and bare ground where most prey are caught (Figure S3). The Iberian Grey Shrike is a generalist stalking predator whose diet is composed mainly of arthropods alongside small-sized lizards (e.g. Podarcis muralis; authors’ unpublished data) and, more rarely, passerines (Lepley et al. Reference Lepley, Thevenot, Guillaume, Ponel and Bayle2004). In the study area, nests were mainly found in Holm Oak Q. ilex shrub between 0.5 m and 2.1 m in height (68%, N = 132; O. Hameau unpublished data).
Sampling design and field protocol
The survey was conducted six times, every other year, between 2013 and 2023. First, we aggregated 1 × 1 km Universal Transversal Mercator squares to identify 2 × 2 km cells that were visually inspected for broad habitat composition, using orthophoto (BD ORTHO®IGN), from 2011 and 2012 for Bouches-du-Rhône and Vaucluse districts (only the Luberon massif in the south of the latter district), respectively, and were included if covered with ≥50% of scrubland. Each 2 × 2 km cell was then divided into 16 square plots of 0.5 × 0.5 km (25 ha). This scale was chosen to approximately match the species’ average territory size (95% Minimum Convex Polygon: 17–23 ha for two radio-tracked males during the early breeding season in the study area; O. Hameau; unpublished data), such that the monitored area would most likely hold a single shrike territory. Within a year, each plot was systematically visited twice by amateur ornithologist during the early breeding season between 1 March and 10 May with a minimum of seven days between visits. Observations were made from a vantage point (occasionally two in the case of complex topography) maximising coverage of the surveyed plot, for 15 minutes (or 2 × 7.5 minutes) dedicated solely to the search for the shrike. The survey period corresponded to the courtship-display period in southern France, i.e. when shrikes are the most detectable. In the study area, first clutches occurred mainly between the first 10-day period of April and the first 10-day period of May (93%, N = 69), with a peak in the third 10-day period of April (33%; O. Hameau; unpublished data). Volunteer observers were randomly assigned a 2 × 2 km cell (<15 km from their home). They were asked to survey 8 of the 16 0.5 × 0.5 km plots according to a staggered distribution. Each observer was asked to choose from the two possible staggered distributions of 8 among 16 plots the one that contained the highest number of plots covered by ≥50% of scrubland (spatial design shown in Figure S2). The staggered distribution of the surveyed plots reduced the border effect among neighbouring plots and, therefore, minimised the risk of counting the same birds in two different plots (see Appendix 1 for an evaluation of this risk). The study area included 1,504 plots with favourable scrubland habitat, i.e. a total of 376 km².
The total number of plots × year monitored was 1,276. An average of 213 ± 38 of 0.5 × 0.5 km plots were monitored each year, with a total of 555 different plots monitored at least once over the six years of the study among the 1,504 available in the study area (sampling coverage: 37.0%; Figure S2). Note that as plots were randomly chosen every surveyed year, variation in the number of surveyed plots would therefore only affect variance in temporal estimates but not entail any bias in the temporal comparison of occupancy estimates.
Habitat-related explanatory variables
We quantified five proxies for habitat openness, abundance of trophic resources, and degree of disturbance (see Appendix 2 for details on how the variables were calculated).
-
(1) Track length (m). Fire tracks, corresponding to cleared linear paths, with a 25-m wide cleared strip on both sides, to facilitate access for fire-fighting forces, contribute to the opening up of habitats. We extracted the sum of fire track length within each 0.5 × 0.5 km plot.
-
(2) Time since last fire (number of years). Vegetation fires are currently the main factor in habitat opening in the study area. The time elapsed since the last vegetation fire in the plot is a measure of the degree of habitat openness and area of bare ground. The time since the last fire was extracted for each plot from a data set containing the spatial extent and date of all fires that occurred in the study area between 1960 and 2022 (source: DDTM Bouches-du-Rhône and DDT Vaucluse). A fire was considered to have had a significant impact on the degree of habitat openness within a plot if its extent covered at least 25% of the plot.
-
(3) Topography. Mean altitude (m asl) and mean slope (degrees) across the 0.5 × 0.5 km plot were computed from the 25-m resolution Digital Elevation Model (RGE ALTI® IGN).
-
(4) Potential global irradiation (MWh/m²). Potential solar energy received on the ground, which depends mainly on topography and exposure at the scale of the study area, is expected to favour the abundance of arthropods (Uhler et al. Reference Uhler, Redlich, Zhang, Hothorn, Tobisch and Ewald2021), the main food resource for shrikes, particularly during the breeding season (March–June). The mean potential global irradiation for the breeding period per plot was calculated and expressed as MWh/m2.
-
(5) Distance to human infrastructure (m). In order to assess for each plot, each surveyed year, the degree of disturbance of human origin, we extracted from a land-cover database the distance between the plot’s centroid and closest human infrastructures, using the OSO database (Inglada et al. Reference Inglada, Vincent, Arias, Tardy, Morin and Rodes2017).
The distribution was checked for each variable with square-root transformation required for distance to human infrastructure and track length. Summary statistics and histograms for all explanatory variables are presented in Table S2 and Figure S4.
Pearson correlation coefficient between pairs of variables and the Variance Inflation Factors (VIFs) (‘vif’ function from usdm R library, ref) for each variable were calculated to check for collinearity between variables.
Statistical analyses
We modelled the probability of occupancy of the Iberian Grey Shrike across years and in response to habitat characteristics. In order to do that, we used a hierarchical multiple-season, site-occupancy model accounting for imperfect detection (based on two visits conducted in each breeding season; MacKenzie et al. Reference MacKenzie, Nichols, Royle, Pollock, Bailey and Hines2018; Royle and Dorazio, Reference Royle and Dorazio2008). Over the six monitoring occasions between 2013 and 2023, selected plots were monitored 2.3 ± 1.4 times on average (range: 1–6). We tried to account for multiple observations within the same plots over the year by adding the plot as a random effect in a Bayesian framework (function ‘stan_occu’ from the ubms library). However, such a model failed to estimate properly the random effect because of the unbalanced nature of the data (i.e. 38% of the 555 plots was monitored only once) and produced inconsistent estimates of probability of occupancy (i.e. lower than observed proportion of plots with a detection). Therefore, we used the function ‘occu’ from the unmarked library to run site-occupancy models. Repeating measures on a same plot throughout the years induces some level of pseudo-replication, which in turn can produce an underestimation of the variance around the estimates, thus increasing the risk of erroneously detecting a significant effect (type I error). We believe however that this risk is low given the low number of repeated measures and the fact that surveys were conducted every other year on a species with a low annual adult survival rate (<0.6; O. Hameau and A. Millon unpublished results).
The detection part of the hierarchical model accounted for a potential variation in the probability of detecting a shrike given its presence among years. Given the large number of observers involved (N = 135) and the restricted number of replicates per observer, we were not able to model an observer random effect and, therefore, assumed all observers were equally good at detecting a shrike. However, the fact that observers were only asked to record shrikes, and not the whole avian community, certainly limits this source of heterogeneity. Moreover, this between-observer heterogeneity is expected to affect the precision of the estimates, not the accuracy (bias). Regarding the occupancy, we were interested in between-year variation (year treated as a factor) as well as in the effects of habitat-related covariates (see above). In the results, we showed estimates taken from the full model as we were interested in discussing the effects of all the variables included in the model, not solely the significant ones. We also included the interaction between ‘time since last fire’ and ‘potential global irradiation’, hypothesising that the effect of the latter on shrike occupancy would be stronger in plots subject to a recent fire. Finally, we checked for spatial autocorrelation into model residuals that would invalidate the assumption of statistical independence between plots, building a spatial correlogram with the model residuals using the ‘moran.mc’ function from the spdep library (lag = 500 m, weighting type = ‘W’).
All statistical and graphical analyses were conducted in R 4.4.1 (R Core Team 2024) except for the daily potential global irradiation, which was computed using QGIS 3.34.
Results
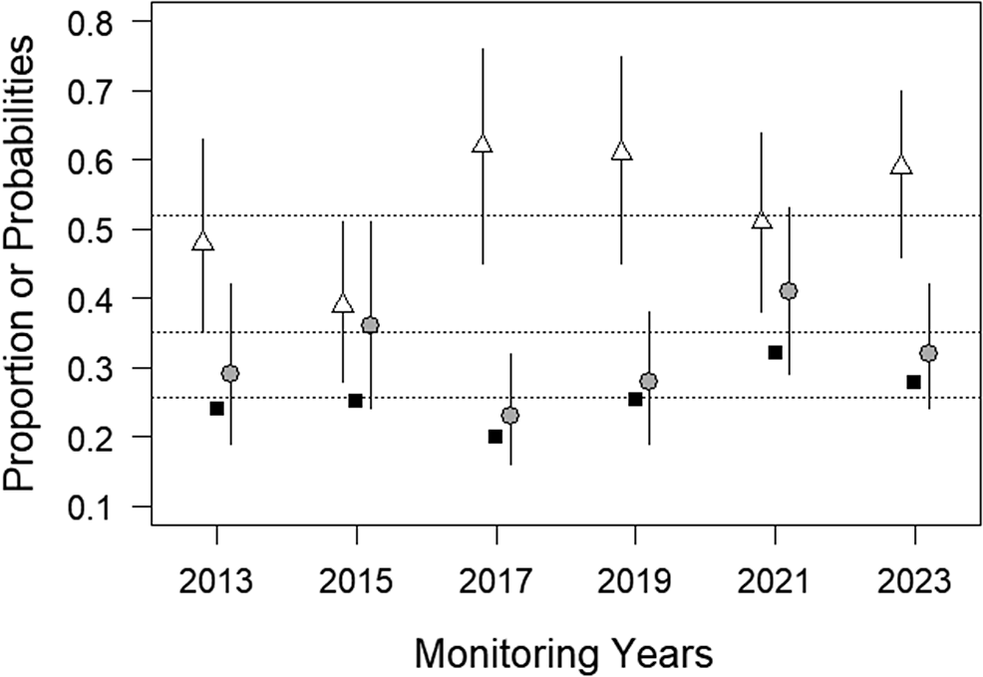
The proportion of plots occupied by at least one shrike averaged 25.7 ± 4.0% and varied from 20.0 in 2019 to 32.1 in 2021 with no obvious temporal trend (Figure 1 and Table S1). Among the 555 plots monitored at least once during the study, 193 hosted a shrike in at least one of the monitored years (34.8%).
Temporal variation in the proportion of plots occupied by the Iberian Grey Shrike in Mediterranean scrublands of south-eastern France: the annual number of plots surveyed (black squares) were 254, 268, 195, 177, 184, and 198 from 2013 to 2023, respectively, and the probabilities of detection (white triangles) and occupancy (grey circles) were estimated by a hierarchical site occupancy model. Error bars are 95% confidence intervals. Mean values across the six years for each variable are indicated with horizontal dashed lines; from the top line down – probabilities of detection, occupancy, and proportion of plots occupied, respectively.

An intercept-only, site-occupancy model produced an average detection probability of 0.52 ± 0.03 per occasion. With two sampling occasions per year of monitoring, the probability of detecting a shrike in an occupied plot reached 0.77. The full model, including all explanatory covariates, showed little among-year variation in terms of detectability. Detection probabilities ranged from 0.39 ± 0.06 in 2015 to 0.62 ± 0.08 in 2017. Confidence intervals largely overlapped among all years indicating no significant difference between any pair of years (Figure 1).
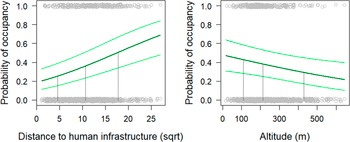
Average occupancy probability over the six years was 0.35 ± 0.02. Modelled annual probabilities of occupancy ranged from 0.23 ± 0.04 in 2017 to 0.41 ± 0.07 in 2021 (Figure 1). As for detectability, there were no significant differences between any pair of years based on confidence intervals overlapping. There was no obvious spatial autocorrelation in model residuals (Figure S5). All explanatory variables, except track length, significantly affected shrike probability of occupancy. Shrikes preferred plots further away from human infrastructures such as buildings or roads (square-root distances: β = 0.084 ± 0.017, P <0.001). In order to realise the effect of each explanatory variable, we chose 2015 as a reference, i.e. the year with the average probability of occupancy closest to the overall average (0.37 vs 0.35, respectively), and all other variables fixed at their mean value (note that given there were no interactions between years and other explanatory variables, the choice of a year as reference has no impact on the effect on logit scale). The probability of occurrence increased from 0.25 ± 0.06 at 21 m to 0.51 ± 0.09 at 314 m (10th–90th percentiles of the distribution of distance to human infrastructures; Figure 2). However, we did not find any effect of track length (square-root distances: β = 0.0009 ± 0.006, P = 0.89). Shrikes were found to prefer low elevations with predicted probability of occurrence of 0.43 ± 0.08 at 110 m asl vs 0.29 ± 0.07 at 438 m asl (10th–90th percentiles of altitude; β = −0.0019 ± 0.0008, P = 0.015; Figure 2).
Variation in the probability of occupancy of the Iberian Grey Shrike in Mediterranean scrublands of south-eastern France in response to plot characteristics, i.e. distance to human infrastructure (left) and altitude (right), as estimated by a site-occupancy model accounting for imperfect detection (prediction from the full model taking the year 2015 as a reference). In each panel, mean predicted values (dark green lines) are shown with 95% confidence intervals (light green lines) together with raw data (grey circles with a slight jitter added, N = 1,276 plot × year). Vertical dashed lines indicate the probability of occupancy for the 10th, 50th (or median), and 90th percentiles of the distribution of each explanatory variable, predicted from the full model and setting the other variables at their mean values.

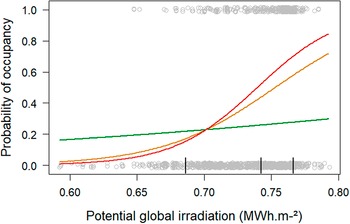
We found a significant interaction between time since last fire and potential global irradiation (β = −0.64 ± 0.19, P <0.001). As expected, the positive effect of plot sun exposure (β = 39.0 ± 6.4, P <0.001) increased in recently burnt plots (time since last fire: β = −0.45 ± 0.14, P = 0.001; Figure 3). In plots subject to a fire 55 years before the survey (90th percentile), shrike occupancy hardly increased from 0.22 ± 0.07 to 0.27 ± 0.08 between poorly and well-exposed plots (10th–90th percentiles of potential global irradiation). In contrast, in plots subject to a fire 11 years before the survey (10th percentile), shrike occupancy increased from 0.15 ± 0.05 to 0.70 ± 0.08 over the same range of exposure. Finally, for a median sun exposure (0.74 MWh/m2), predicted shrike occupancy averaged 0.26 ± 0.07 in a plot subject to a fire 55 years before the survey. Shrike occupancy increased to 0.44 ± 0.08 and 0.52 ± 0.08 in plots subject to a fire 24 years (median value) and 11 years before the survey (10th percentile), respectively (Figure 3).
Variation in the probability of occupancy of the Iberian Grey Shrike in the Mediterranean scrublands of south-eastern France according to plot sun exposure (potential global irradiation). The coloured curves indicate the predicted values for plots subject to a fire 55 years (green), 24 years (orange), and 11 years (red) before the survey. These three values correspond to the 90th, 50th (median), and 10th percentiles of time since the last fire, respectively. The three short vertical lines above the x-axis indicate the same percentiles for potential global irradiation and thus the range of values concentrating 80% of the data. The positive effect of potential global irradiation on shrike occupancy is stronger in plots subject to recent fires.

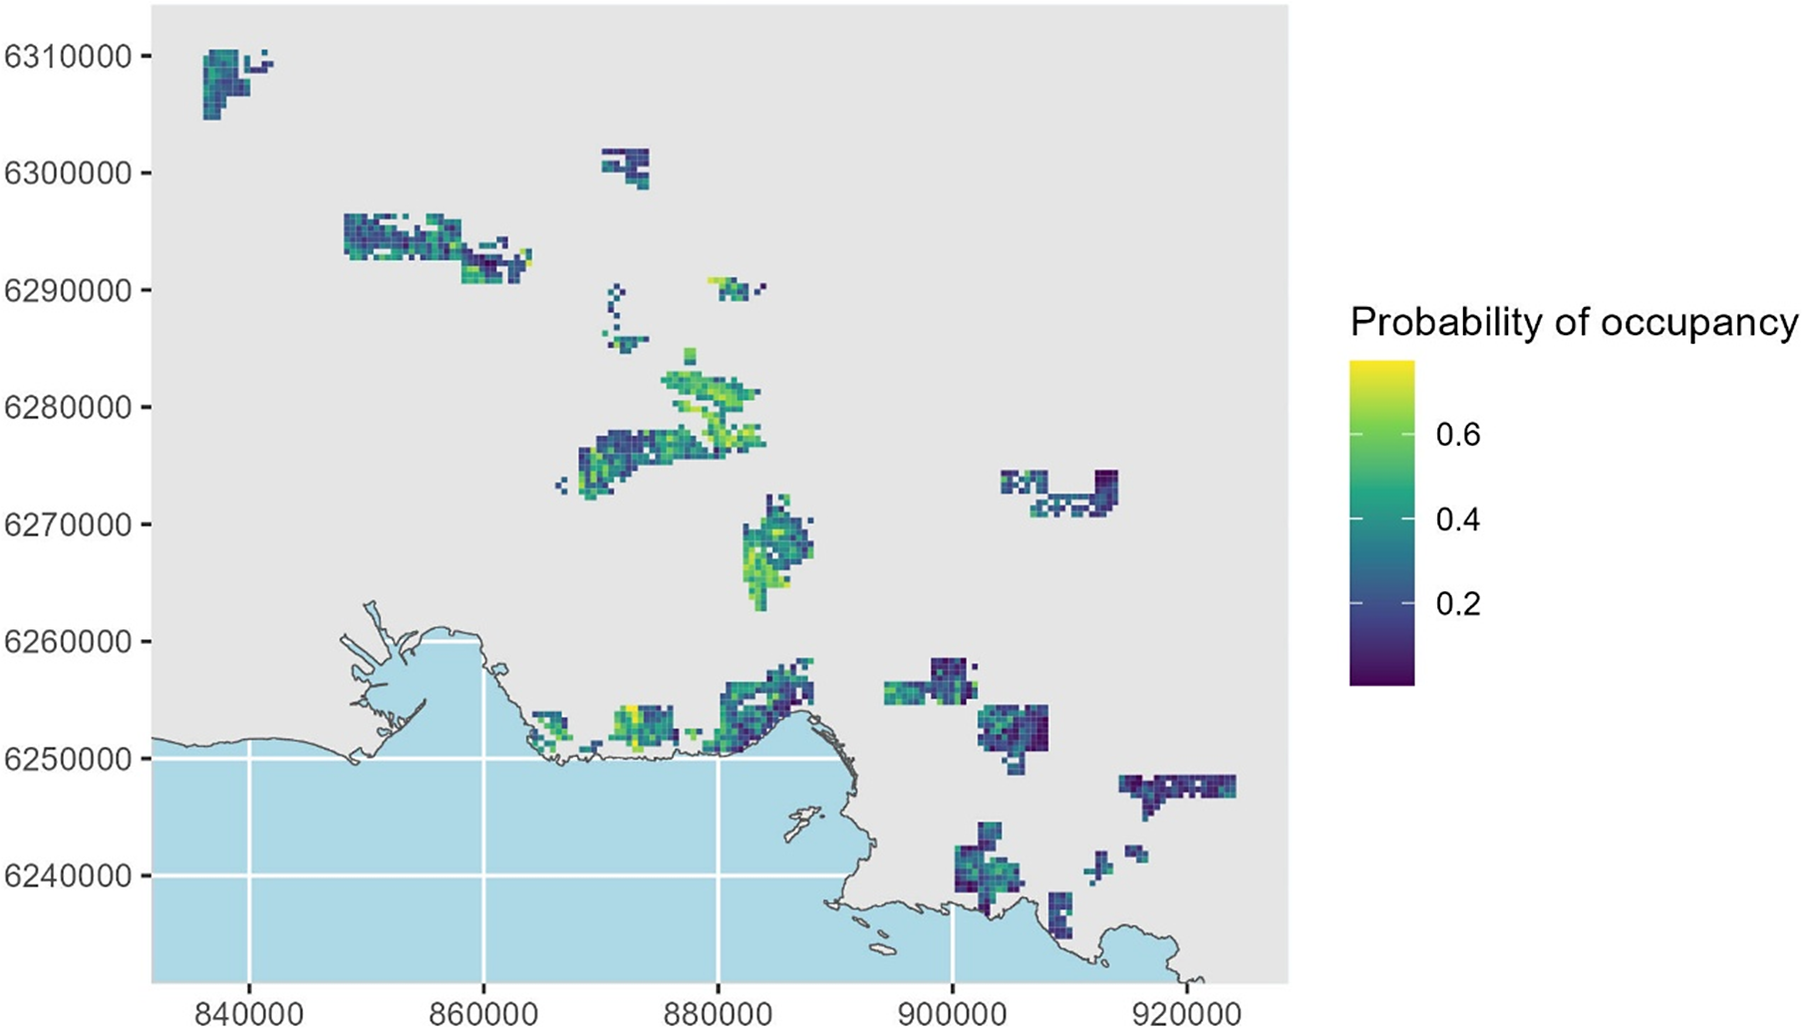
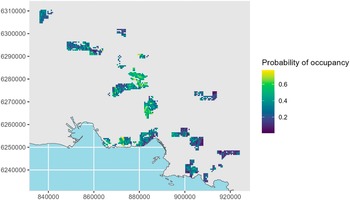
Figure 4 shows the spatial variation in the probability of occupancy over the entire study area (N = 1,504 plots). According to the values for the different explanatory variables measured in 2023, summing the predicted values produced a mean estimate of 474 (95% confidence interval: 331; 647) occupied plots. Among the 1,276 plots × year surveyed, only in five instances were more than two shrikes simultaneously observed in the same plot (0.4%). Therefore, assuming one pair per plot, derived average density was 1.26 pair/km² (0.88; 1.72).
Predicted probability of Iberian Grey Shrike occupancy in the Mediterranean scrubland of south-eastern France. Note that these predictions incorporated the average environmental variation of the year 2023. See Figure S6 for a map showing the standard errors associated with these mean predictions.
Discussion
Based on a multiple-season, site-occupancy model, we documented the probability of occupancy of the Vulnerable and declining Iberian Grey Shrike in the Mediterranean scrubland of south-eastern France. Our results, accounting for imperfect detection, indicated that this population was apparently stable over the 11 years of the study. Environmental variables linked to solar irradiation received at ground level, fire regime, and human disturbance were found to drive the spatial distribution of the species.
We recommend similar surveys to be conducted across the species distribution and the gradient of habitats (from natural to farming-dominated landscapes) to properly assess the current trend of the population over the whole species distribution. We anticipate that populations occupying farming habitats are more prone to decline than the ones occupying more natural habitats, like those we surveyed. The Iberian Grey Shrike is absent from farming habitats (vineyards or mixed crop and pasture) in our study area, except in the remnants of the Crau steppe (sheep-grazing area). Pastureland and agricultural mosaics in Spain, hosting the bulk of the world population, are currently witnessing a significant decline in numbers but also distribution, putatively linked to changing farming practices (Infante Reference Infante, Molina, Nebreda, Muñoz, Seoane, Real and Bustamante2022).
Despite the rigorous protocol imposed, our study demonstrates that site-occupancy surveys can be conducted with the help of a network of amateur ornithologists (30 ± 3 persons involved each year). Site-occupancy protocol includes multiple surveys within a year and is particularly adapted to a secretive species like the Iberian Grey Shrike. With an average probability of detection per occasion of 0.52, we obtained a probability of detecting a shrike in a plot, given it is occupied, over two occasions of 0.77. This value is slightly lower than the recommended value (0.90), and a third occasion would improve the statistical power regarding the effect of environmental covariates (Mackenzie and Royle Reference Mackenzie and Royle2005). Overall, we believe that carefully designed multiple-season, site-occupancy schemes could be deployed more often to assess population size and trend of species threatened with extinction at a reasonable cost, overcoming the limits of opportunistic citizen-science data (Bradter et al. Reference Bradter, Mair, Jönsson, Knape, Singer and Snäll2018; Johnston et al. Reference Johnston, Matechou and Dennis2023; Kamp et al. Reference Kamp, Oppel, Heldbjerg, Nyegaard and Donald2016).
We focused our survey on a priori suitable open habitats excluding, for example, forested areas. Despite this relatively restrictive, stratified sampling strategy, we found substantial effects of four out of five tested environmental covariates, from which we can derive an overall picture of habitat suitability for the Iberian Grey Shrike in Mediterranean scrublands. Interestingly, we found a significant interaction between plot sun exposure (potential solar irradiation) and the time elapsed since the last fire driving the probability of shrike occupancy. Thus, Iberian Grey Shrikes preferred well-exposed areas, where it can be expected that the arthropod biomass and species richness are higher than in poorly exposed plots (Uhler et al. Reference Uhler, Redlich, Zhang, Hothorn, Tobisch and Ewald2021), providing that a recent fire has maintained reduced vegetation cover and patches of bare ground. These open micro-habitats may increase the abundance of arthropod species on the ground by offering patches with higher irradiation but also hunting efficiency of a predator such as the shrike. The response to fire differs greatly among bird species (Brotons et al. Reference Brotons, Pons and Herrando2005; Jacquet and Prodon Reference Jacquet and Prodon2009; Pons and Clavero Reference Pons and Clavero2010). Fire typically increases the area of low vegetation and bare ground (Jacquet and Prodon Reference Jacquet and Prodon2009), thus probably favouring shrike hunting success, since the Iberian Grey Shrike catches its prey mostly on the ground. Iberian Grey Shrike nests at low level above the ground (typically <2 m) in Holm Oaks, whose bushes suitable for nesting are rarely completely eradicated by a fire event at a 25-ha scale. It is noteworthy that some areas burnt 50 years ago were not covered with pine forest in our study area (others were but were excluded from our sample; see Methods). However, such areas became less favourable to shrikes as a likely consequence of change in vegetation density. Further work including high-resolution measures of the proportion of bare ground and vegetation height would be particularly valuable for management of the species. Exploring this aspect of microhabitat heterogeneity could also be useful in gaining a better understanding of the ecological preferences of other species found in Mediterranean scrublands. The link between arthropod biomass and temperature described by Uhler et al. (Reference Uhler, Redlich, Zhang, Hothorn, Tobisch and Ewald2021) in Germany also deserves to be investigated in a variety of habitats and climate, including Mediterranean ones where restricted rainfall could also play a significant role. Also related to the thermal process is the slight but significant negative effect of altitude on the probability of occupancy.
We did not find an effect of the length of fire tracks on the probability of occupancy, possibly because of antagonistic effects associated with this feature. On one hand, safely cleared strips on both sides may provide areas of bare ground suitable for hunting, and nests have even been found alongside those tracks. On the other hand, such tracks favour human activities that may repel shrikes (Bötsch et al. Reference Bötsch, Tablado and Jenni2017). The human usage of tracks is highly variable in the area and related data are not currently available to test this hypothesis. The escape distance of the Iberian Grey Shrike is surprisingly large for a small-sized bird (authors’ personal observations). It results in a relatively low probability of detection. Unsurprisingly, the probability of occupancy also decreased sharply in the vicinity of human infrastructures, including roads, scattered in natural scrublands (Concepción et al. Reference Concepción, Obrist, Moretti, Altermatt, Baur and Nobis2016; Palomino and Carrascal Reference Palomino and Carrascal2007).
Overall, the Iberian Grey Shrike population in the natural scrublands of south-eastern France was apparently stable between 2013 and 2023, and most of the population decline may originate in more human-impacted areas such as vineyards and other mixed farming landscapes where the species occurs. A genuine quantitative comparison of temporal trends between the main habitats of the species would be particularly insightful. Milder winters linked to climate change may also favour this sedentary species found in Provence in the northern edge of its distribution, but the effect of climate on shrike dynamics remains to be tested. Average density derived from occupancy data fell within the range of values observed in the species’ core distribution in Spain (1.26 vs 0.7–3.0; Madroño et al. Reference Madroño, Gonzalez and Atienza2004). Conservation actions may be targeted on such areas, although our findings also highlight that care should be taken so that natural scrubland habitats are kept free from scattered human infrastructures and associated disturbance. A rising threat related to this process is the development of solar photovoltaic energy production (Gómez‐Catasús et al. Reference Gómez‐Catasús, Morales, Giralt, González del Portillo, Manzano-Rubio and Solé-Bujalance2024). Natural processes, such as wildfires favouring open habitats and overall landscape heterogeneity, should be maintained. Their potential positive impacts on biodiversity should be more explicitly recognised and incorporated into fire control/suppression strategies in highly anthropic fire-prone regions like the Mediterranean area (Brotons et al. Reference Brotons, Aquilué, De Cáceres, Fortin and Fall2013). A management option such as prescribed burning may bring mutual benefits in this context by maintaining open scrublands while reducing the occurrence and/or severity of uncontrolled fires (Boer et al. Reference Boer, Sadler, Wittkuhn, McCaw and Grierson2009).
Supplementary material
The supplementary material for this article can be found at http://doi.org/10.1017/S0959270926100483.
Acknowledgements
We thank the 135 ornithologists who took part in the survey over a decade and IUCN for granting access to the Red List assessments of the Laniidae family. M. Alphand, A. Charbonneau, and C. Martin helped with the radio-tracking survey. LPO PACA (OH) was partly funded by DREAL PACA, Département des Bouches-du-Rhône and the Métropole Aix-Marseille-Provence. Wildfire data were provided by Direction Départementale des Territoires et de la Mer Bouches-du-Rhône.


 Open access

