
17.1 Subsurface Biomes and Their Inhabitants
When we ponder the existence of life extending deep into Earth, a phrase from the movie Jurassic Park is often used: that “life finds a way.” Numerous investigations into the continental and marine subsurface have shown that life indeed finds a way to exist deep into the subsurface, provided that physical influences, particularly heat, allow for the existence of biomolecules. In this chapter, we will review what is known about the biogeography, ecology, and evolution of deep life, acknowledging along the way that this field is rapidly developing with every new set of experiments and continued exploration.
The subsurface biosphere is loosely defined as the habitable region beneath the soil and sediments where the limits of habitability are typically defined by some physical process (also see Chapter 19, this volume). Current estimates of the habitable volume of the subsurface range from ~2.0 to 2.3 × 10⁹ km3, or roughly twice the volume of our oceans (Table 17.1). This large biosphere is estimated to hold ~70% of all bacterial and archaeal cells (Figures 17.1 and 17.2) and potentially over 80% all bacterial and archaeal species (for a review, see Reference Magnabosco, Lin, Dong, Bomberg, Ghiorse and Stan-Lotter1). A variety of habitats and sampling techniques to study the subsurface biosphere have been explored by scientists for nearly a century and are further described throughout this chapter (Sections 17.1.1–17.1.5; also see Figure 16.1 in Chapter 16, this volume).
| Biome | Volume (km3) | Definition | Refs. |
|---|---|---|---|
| Continental subsurface | 7 × 10⁸ | ≤85°C isotherm | (Reference Magnabosco, Lin, Dong, Bomberg, Ghiorse and Stan-Lotter1) |
| Continental subsurface | 1 × 10⁹ | ≤122°C isotherm | (Reference Magnabosco, Lin, Dong, Bomberg, Ghiorse and Stan-Lotter1) |
| Groundwater | 2 × 10⁷ | ≤2 km depth | (Reference Gleeson, Befus, Jasechko, Luijendijk and Cardenas2) |
| Sub-seafloor sediments | 3 × 10⁸ | All sediments (Reference Divins3–Reference Whittaker, Goncharov, Williams, Müller and Leitchenkov5) | (Reference LaRowe, Burwicz, Arndt, Dale and Amend6) |
| Marine sediment porewater | 8 × 10⁷ | All sediments (Reference Divins3–Reference Whittaker, Goncharov, Williams, Müller and Leitchenkov5) | (Reference LaRowe, Burwicz, Arndt, Dale and Amend6) |
| Marine crust | ~109 | ≤120°C isotherm | (Reference Heberling, Lowell, Liu and Fisk7) |
| All subsurface | ~2.0–2.3 × 10⁹ | ||
| Oceans | 1 × 10⁹ | All oceans | (Reference Heberling, Lowell, Liu and Fisk7) |
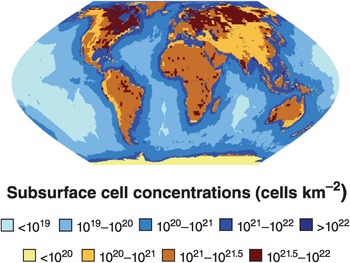
Map of sub-seafloor sediment and continental subsurface cell numbers. The distributions of bacterial and archaeal cells in sub-seafloor sediments (blues; adapted from Kallmeyer et al. (Reference Kallmeyer, Pockalny, Adhikari, Smith and D’Hondt8)) and the continental subsurface (browns; adapted from Magnabosco et al. (Reference Magnabosco, Lin, Dong, Bomberg, Ghiorse and Stan-Lotter1)) are shown. Uncertainties in cellular estimates of the marine crust (Reference Magnabosco, Lin, Dong, Bomberg, Ghiorse and Stan-Lotter1,Reference Heberling, Lowell, Liu and Fisk7,Reference Bar-On, Phillips and Milo9) prevent mapping the distribution of cells throughout the marine crust at this time.

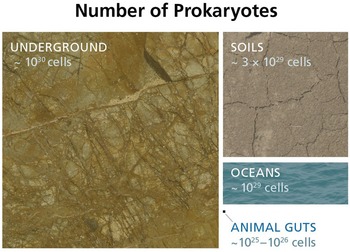
Estimated numbers of bacteria and archaea throughout various biomes. Cellular estimates for the subsurface (Reference Magnabosco, Lin, Dong, Bomberg, Ghiorse and Stan-Lotter1,Reference Kallmeyer, Pockalny, Adhikari, Smith and D’Hondt8–Reference Parkes, Cragg, Roussel, Webster, Weightman and Sass10), soils (Reference Whitman, Coleman and Wiebe11), oceans (Reference Bar-On, Phillips and Milo9,Reference Whitman, Coleman and Wiebe11), and animal guts (Reference Bar-On, Phillips and Milo9,Reference Kieft and Simmons12) are illustrated to show the relative sizes of each biome.

17.1.1 Continental Subsurface
The earliest investigations into the deep subsurface biosphere were performed in oil fields and coal beds within the continental subsurface in the mid-1920s (Reference Bastin, Greer, Merritt and Moulton13–Reference Lipman15; for a review on the history of continental subsurface research, see Reference Onstott16). Since then, many different deep continental biomes have been explored, including (but not limited to) groundwater and deep aquifers, oil and gas reservoirs, deep bedrock, evaporite deposits, and subglacial ecosystems (Figure 17.1). Early reviews on the microorganisms inhabiting these subsurface biomes focused on cell numbers (Reference Onstott, Phelps, Kieft, Colwell, Balkwill and Fredrickson17,Reference Pedersen and Ekendahl18), cultivation-based measurements of activity (Reference Onstott, Phelps, Kieft, Colwell, Balkwill and Fredrickson17,Reference Pedersen and Ekendahl18), and/or large collections of clone libraries from amplified regions of the 16S rRNA gene (Reference Fredrickson and Balkwill19,Reference Gihring, Moser, Lin, Davidson, Onstott and Morgan20).
Over the past decade, the applications of metagenomics and next-generation sequencing have allowed researchers to further examine the identities and lifestyles of organisms residing in the continental subsurface. The first deep subsurface metagenome was generated from DNA extracted from the fracture fluids of a 2.8‑km deep borehole in South Africa (Reference Chivian, Brodie, Alm, Culley, Dehal and DeSantis21) and revealed a “single-species ecosystem” containing a population of chemoautotrophic Firmicutes, “Candidatus Desulforudis audaxviator,” capable of performing sulfate reduction and fixing nitrogen and carbon (further discussion in Chapter 18, this volume). Although the number of species observed in this early investigation and other subsurface clone libraries (Reference Fredrickson and Balkwill19,Reference Gihring, Moser, Lin, Davidson, Onstott and Morgan20) was low, next-generation sequencing has revealed that single-species continental subsurface ecosystems are an exception to an otherwise highly diverse subsurface biosphere (for a review, see 1). A large part of the increased α-diversity is due to the observation of many low-abundance taxa in next-generation sequencing data sets. These low-abundance microorganisms, generally termed the “rare biosphere” (Reference Sogin, Morrison, Huber, Mark Welch, Huse and Neal22), are now accepted as a common feature of environmental microbial communities and may persist in order to preserve a diverse collection of metabolic strategies for survival in changing environments.
Within the continental subsurface, natural fluctuations in fluid chemistries are just beginning to be understood (Reference Magnabosco, Timmers, Lau, Borgonie, Linage-Alvarez and Kuloyo23); however, large disruptions to subsurface environments through human activities have been reported to dramatically alter continental subsurface communities (Reference O’Mullan, Dueker, Clauson, Yang, Umemoto and Zakharova24–Reference Rajala, Carpén, Vepsäläinen, Raulio, Sohlberg and Bomberg29). Events that have been shown to increase the overall salinity of deep fluids such as hydraulic fracturing (fracking) (Reference Waldron, Petsch, Martini and Nüsslein30–Reference Akob, Cozzarelli, Dunlap, Rowan and Lorah36) and drilling (Reference Dong, Kumar, Chia, Kim, Miller and Price37) are often associated with decreases in α-diversity and increases in halo-tolerant bacteria. More recently, an in-depth analysis of the metabolic potential for 31 unique metagenome-assembled genomes (MAGs) showed that the persisting halo-tolerant bacteria and archaea were capable of fermenting chemical additives brought in during the injection process (Reference Daly, Borton, Wilkins, Hoyt, Kountz and Wolfe26). A similar trend has been reported in the oil wells of the Enermark Field (Alberta, Canada). There, native oil phases support low-diversity communities of methanogens and acetogens (Reference Magot, Ollivier and Patel38), while emergent aqueous phases (oil + water) exhibit bursts in populations of sulfate-reducing Deltaproteobacteria that change the overall subsurface community composition (Reference Kryachko, Dong, Sensen and Voordouw39,Reference Zhang, She, Chai, Banat, Zhang and Shu40). These “blooms” of sulfate-reducing bacteria (SRB) in water-flooded reservoirs can dramatically raise concentrations of hydrogen sulfide (H2S) due to their consumption of hydrocarbons coupled to the reduction of sulfate. Commonly referred to as reservoir souring, this microbial by-product can lead to corrosion of pipelines, plugging of oil-bearing rock, and contamination of the extracted oil (Reference Singh, Van Hamme, Kuhad, Parmar and Ward41), but it can be controlled via the addition of higher-energy electron acceptors such as nitrate (Reference Voordouw42). On the other hand, the increased SRB activity and growth observed after H2 injection in the Opalinus clay (Switzerland) has been proposed as a way to control H2 generated in underground nuclear waste repositories (Reference Bagnoud, Chourey, Hettich, De Bruijn, Andersson and Leupin25).
In many of the aforementioned examples, it is difficult to determine whether or not the changes in community composition are driven by the introduction of foreign organisms or the expansion of a native member. Long-term monitoring of subsurface fluids in “underground labs” is beginning to reveal how these ecosystems change over time (Reference Magnabosco, Timmers, Lau, Borgonie, Linage-Alvarez and Kuloyo23) and the variations between the attached and planktonic members of the microbial community (Reference Momper, Reese, Zinke, Wanger, Osburn and Moser43). After nearly a century of research into life beneath the continents, it is now apparent that the continental subsurface is home to a wide variety of fluid chemistries and lithologies (Reference Magnabosco, Ryan, Lau, Kuloyo, Lollar and Kieft44–Reference Osburn, LaRowe, Momper and Amend46). A comparison of 326 bacterial and archaeal 16S rRNA gene surveys from a variety of continental subsurface environments revealed a correlation between community composition and sample lithology (Reference Magnabosco, Lin, Dong, Bomberg, Ghiorse and Stan-Lotter1), yet the variety of microbial metabolisms encountered beneath the continents (e.g. 44,47–51), how these metabolisms arose, and the interactions between these organisms (Reference Lau, Kieft, Kuloyo, Linage-Alvarez, Van Heerden and Lindsay52), viruses (Reference Eydal, Jägevall, Hermansson and Pedersen53,Reference Kyle, Eydal, Ferris and Pedersen54), and the environment are just beginning to be understood.
17.1.2 Sub-seafloor Sediments
Early work on sub-seafloor sediments mainly focused on continental margins and quickly recognized a wide distribution of bacteria and archaea and an importance of heterotrophic metabolisms (Reference D’Hondt, Jørgensen, Miller, Batzke, Blake and Cragg55; as described in Chapter 16, this volume). In deeply buried sediments sampled through the scientific drilling program – currently the International Ocean Discovery Program (IODP) – microbes are responsible for large-scale geochemical shifts, including consumption of methane and sulfate (Reference D’Hondt, Jørgensen, Miller, Batzke, Blake and Cragg55–Reference Parkes, Webster, Cragg, Weightman, Newberry and Ferdelman57). Further investigations have shown that below oceanic gyres, the deep biosphere may be an oxic environment and interact with deep hydrothermal recharging (Reference Yanagawa, Breuker, Schippers, Nishizawa, Ijiri and Hirai58,Reference Orcutt, Wheat, Rouxel, Hulme, Edwards and Bach59). With the noted impacts of deep life on processes relating to global biogeochemistry, continued work is focusing on constraining the rates and limits of these processes (for further discussion on this topic, see Chapter 19, this volume).
Marine sediments are a heterogeneous environment and record Earth history along with the modern life that may be living in situ. Tremendous advances were made through the first drilling expedition to focus solely on the marine deep biosphere, Ocean Drilling Program Leg 201, which visited the Peru Margin in 2002. This expedition showed that cells increased in areas of potential geochemical energy (Reference D’Hondt, Jørgensen, Miller, Batzke, Blake and Cragg55), that archaeal cells were active and heterotrophic throughout the sediment column (Reference Orcutt, Wheat, Rouxel, Hulme, Edwards and Bach59; Chapter 16, this volume), and that the metagenomic signature of sediments was distinct from any other sampled environment up to that time (Reference Biddle, Fitz-Gibbon, Schuster, Brenchley and House60). This expedition also yielded the first metatranscriptome of marine sediments, which showed dominant transcripts for fermentation (Reference Orsi, Edgcomb, Christman and Biddle61) and that SRB may invest in different cellular strategies based on energy availability (Reference Orsi, Barker Jørgensen and Biddle62). Investigations on the Gulf of Mexico (Reference Biddle, White, Teske and House63), Nankai Trough (Reference Newberry, Webster, Cragg, Parkes, Weightman and Fry64,Reference Inagaki, Nunoura, Nakagawa, Teske, Lever and Lauer65), Guaymas Basin (Reference Biddle, Cardman, Mendlovitz, Albert, Lloyd and Boetius66,Reference Teske, Callaghan and LaRowe67), Baltic Sea (Reference Marshall, Karst, Nielsen and Jørgensen68), and Shimokita Peninsula (Reference Inagaki, Hinrichs, Kubo, Bowles, Heuer and Hong69), among others, have shown that sub-seafloor microbial life is found wherever it can exist. The interplay of bacteria and archaea is still being investigated, as areas of the Andaman Sea contain no detectable archaea (Reference Briggs, Inagaki, Morono, Futagami, Huguet and Rosell-Mele70).
The establishment and propagation of the sediment-hosted deep biosphere is still under investigation, but likely includes a combination of selection from the surface environment (Reference Walsh, Kirkpatrick, Rutherford, Smith, Sogin and D’Hondt71) and persistence of cells with depth (Reference Starnawski, Bataillon, Ettema, Jochum, Schreiber and Chen72). What stimulates the deep biosphere, in addition to chemical interfaces, may include the continued influence of depositional conditions (Reference Marshall, Karst, Nielsen and Jørgensen68), tectonic activity (Reference Riedinger, Strasser, Harris, Klockgether, Lyons and Screaton73), geological shifts under pressure (Reference Arndt, Brumsack and Wirtz74), and the internal heating of Earth (Reference Parkes, Wellsbury, Mather, Cobb, Cragg and Hornibrook75). It is still unknown exactly how the community in deep sediment responds to the stress of sedimentation. It is theorized that necromass (Reference Lomstein, Langerhuus, D’Hondt, Jørgensen and Spivack76) or radiolysis (Reference Contreras, Meister, Liu, Prieto-Mollar, Hinrichs and Khalili77; Chapter 19, this volume) may help support deep communities. Evidence of subsurface acclimation to changing surface conditions exists, showing that the marine deep biosphere is responsive and may be capable of more activity than expected (Reference Contreras, Meister, Liu, Prieto-Mollar, Hinrichs and Khalili77). Life in the deep marine biosphere has been reviewed extensively (Reference Orcutt, Sylvan, Knab and Edwards78–Reference Baross, Wilcock, Kelley, DeLong and Craig Cary81), and with new investigations underway, discoveries are still abundant.
17.1.3 Oceanic Crust
Despite the larger volume of the basaltic crust environment relative to marine sediments (Table 17.1), relatively little is known about the abundance and extent of microbial biomass in the deep oceanic basement because it is heterogeneous and largely inaccessible (Reference Baross, Wilcock, Kelley, DeLong and Craig Cary81). Early investigations into microbial activity in the oceanic crust focused on the presence of microchannels and alteration patterns associated with DNA (e.g. 71,72), as the colocation of nucleic acids and unique microtextures (Reference Fisk and McLoughlin82) are taken together to represent biogenic alteration in basaltic rock. Overall, most biogenic alteration is restricted to the upper 250 m of the oceanic crust, corresponding to a predicted temperature range of 15–80°C (Reference Heberling, Lowell, Liu and Fisk7). Sulfur and iron isotopic information suggests that the oxidation of basaltic crust mainly occurs in the relatively young ridge flank (<20 million years old) (Reference Bach and Edwards83). Combined, these observations have directed more recent and current IODP drilling expeditions to focus on searching for microbial life in relatively young oceanic crust.
17.1.3.1 Warm Anoxic Basement
The first investigation of the sediment-buried seafloor biosphere was conducted in 1998 by collecting fluids from an undersea Circulation Obviation Retrofit Kit (CORK) observatory in the 3.5-million-year-old basaltic crust of the Northwest Pacific Ocean’s Juan de Fuca Ridge (JdFR) flank (Reference Jungbluth, Glavina Del Rio, Tringe, Stepanauskas and Rappé84). In this pilot investigation, warm (65°C) fluids originating from hundreds of meters below the seafloor were collected for gene cloning and sequencing and revealed a low-diversity environment with bacteria and archaea (no Eukarya) that was dominated by a Firmicute lineage later shown to be a close genomic relative of the terrestrial subsurface lineage “Ca. Desulforudis audaxviator” (Reference Chivian, Brodie, Alm, Culley, Dehal and DeSantis21,Reference Jungbluth, Glavina Del Rio, Tringe, Stepanauskas and Rappé84). Eight years after the initial CORK installation in the JdFR, scientists sampled a black rust scraping exposed to reducing fluids from the CORK observatory (Reference Nakagawa, Inagaki, Suzuki, Steinsbu, Lever and Takai85) and fluids emanating from an exposed rocky outcrop near the CORK observatory (Reference Jungbluth, Glavina Del Rio, Tringe, Stepanauskas and Rappé84) and discovered an abundance of thermophilic lineages, indicating that the deep crustal biosphere is, at least in part, adapted to life at relatively high temperatures.
A new generation of borehole observatories equipped with microbiologically friendly sampling materials (Reference Baquiran, Ramírez, Haddad, Toner, Hulme and Wheat86) was installed near the original JdFR CORK observatory in 2004. A 3-year sampling campaign at the JdFR identified low microbial cellular abundances (~104 cells mL–1) and revealed a microbial community whose major lineages changed each year (Reference Jungbluth, Grote, Lin, Cowen and Rappé87). This dynamic subsurface community contrasts with deep marine sediment communities, which are stable on longer timescales and are more similar to communities observed at deep continental sites. In parallel to (Reference Jungbluth, Grote, Lin, Cowen and Rappé87), the first successful retrieval of basement rocks for molecular microbiology analysis was recovered from JdFR (Reference Lever, Rouxel, Alt, Shimizu, Ono and Coggon88) and identified methane- and sulfur-cycling bacteria and archaea that were most related to uncultivated marine sediment lineages. Incubations of rocks surrounding the CORK observatories (Reference Smith, Popa, Fisk, Nielsen, Wheat and Jannasch89,Reference Orcutt, Bach, Becker, Fisher, Hentscher and Toner90) revealed colonization of previously sterilized minerals by lineages that were more similar to the microorganisms identified in the crustal fluids than in collected rocks and consistent with a capacity for iron, nitrogen, and sulfur cycling. An incubation of mineral chips at the seafloor was less successful in reproducing the thermophilic and anoxic conditions found at depth, highlighting the difficulty of working in an extreme deep-sea sub-seafloor reducing environment (Reference Baquiran, Ramírez, Haddad, Toner, Hulme and Wheat86).
In 2010, scientists sampled two boreholes separated by ~67 km to investigate the temporal and spatial dynamics of microorganisms residing in JdFR basement fluids. Crustal fluids were retrieved from the location of the original CORK observatory and, for the first time, from younger (1.2 million years) and cooler (39°C) ocean crust. Gene cloning and sequencing revealed that the original CORK observatory was compromised in its ability to produce clean samples (Reference Jungbluth, Lin, Cowen, Glazer and Rappé91); this is perhaps expected given the 10+ years of corrosion that has occurred on the CORK parts exposed to both a reducing and oxic environment since installation (Reference Cowen, Giovannoni, Kenig, Johnson, Butterfield and Rappé92). In contrast, samples collected from the cooler basement location contained evidence for Deltaproteobacteria involved in sulfur cycling and Clostridia related to “Ca. Desulforudis.” The identification of “Ca. Desulforudis” in the cooler oceanic basement fluids suggests that relatives of “Ca. Desulforudis audaxiator” inhabit a wider range of habitats than one might expect given its prevalence in the South African subsurface (Section 17.1.1). Combined with sulfate reduction rate measurements (Reference Robador, Jungbluth, LaRowe, Bowers, Rappé, Amend and Cowen93), these results indicate that anaerobic processes may play a major role in the degradation of organic matter in the upper oceanic crust.
Third-generation borehole observatories went online in JdFR in 2011, featuring the most microbiology-friendly components yet adapted. 16S rRNA amplicon sequencing of samples recovered from these observatories revealed an abundance of new lineages within Archaeoglobi, Aminicenantes, and Acetothermia that had not previously been identified in the oceanic crust (Reference Robador, Jungbluth, LaRowe, Bowers, Rappé, Amend and Cowen93,Reference Jungbluth, Bowers, Lin, Cowen and Rappé94) and were later confirmed by metagenome sequencing and genome binning (Reference Jungbluth, Amend and Rappé95). From a functional perspective, microbial communities in the deep sub-seafloor appear similar to those found in terrestrial hot springs. Together, this work has helped to identify novel microbial diversity and stable members in the deep, warm, anoxic basement biosphere.
Although the JdFR is a popular location to study the warm, anoxic basement crust, a CORK observatory on the Costa Rica margin has been sampled for deep basement microbiology. Warm fluids (58°C) collected from the CORK observatory revealed novel lineages of sulfur-oxidizing bacteria; however, little overlap was found between the Costa Rica site and JdFR (Reference Nigro, Harris, Orcutt, Hyde, Clayton-Luce and Becker96), and this may, in part, be due to differences in fluid flow and organic matter delivery rates. Further experimentation and sampling from additional locations will be required to constrain the biogeographic patterns and to elucidate the ecology of microorganisms living in the ocean crust.
17.1.3.2 Cold, Oxic Basement
Exploration of the warm, anoxic deep basement biosphere has led the way in understanding the oceanic crust; however, the cold (<20°C) and oxic basement rock is the more abundant of the sub-seafloor igneous biomes, and therefore of critical global biogeochemical importance. To this end, several CORK observatories were installed at North Pond, a sediment pond on the western flank of the Mid-Atlantic Ridge that overlies a hydrologically active ocean crust of ~8 Ma (Reference Edwards, Bach and Kalus97). When multiple depth horizons were sampled within the igneous basement, distinctive heterotrophic and autotrophic microbial communities largely composed of Proteobacteria were identified (Reference Meyer, Jaekel, Tully, Glazer, Wheat and Lin98). Metagenomic sequencing and subsequent genome binning were used to identify members of the microbial community that were capable of exploiting hypoxic or anoxic conditions (Reference Tully, Wheat, Glazer and Huber99). Interestingly, enrichment cultures concocted with additions of nitrate and ammonia stimulated the microbial community, which together provide evidence for a heterogeneous functional population in the cold, oxic basement (Reference Zhang, Fang, Bach, Edwards, Orcutt and Wang100,Reference Zhang, Feng and Wang101). Additional investigations surveying a range of seafloor environment types (e.g. crustal ages, mineralogy, redox states, etc.) are needed to further refine global estimates of primary production in the oceanic crust.
17.1.4 Ultra-basic Sites
Serpentinization is a subsurface geochemical process that results in ultra-basic fluids (pH > 10) and abiotically produces methane and small-chain hydrocarbons through Fischer–Tropsch-type synthesis (Reference Charlou, Donval, Fouquet, Jean-Baptiste and Holm102–Reference McCollom105). The hydrogen, methane, and abiotically generated organic molecules produced by serpentinization can serve as energy for microbial metabolisms in the otherwise energy-limited deep biosphere. One caveat, however, is that serpentinite fluids are depleted in electron acceptors (relative to electron donors) (Reference Schrenk, Brazelton and Lang106), meaning that this potential energy source may not be bioavailable in some environmental settings.
In the marine setting, the limitation of electron acceptors is alleviated as end-member serpentinite fluids emanating from hydrothermal vents mix with surrounding seawater. At the Lost City hydrothermal field (LCHF), vent fluids exhibit moderate temperature, high pH, and millimolar concentrations of hydrogen and methane (Reference Proskurowski, Lilley, Seewald, Früh-Green, Olson and Lupton104,Reference Kelley, Karson, Blackman, Früh-Green, Butterfield and Lilley107–Reference Lang, Butterfield, Schulte, Kelley and Lilley109). Actively venting carbonate chimneys are dominated by a single taxon of methane-cycling archaea in the anoxic chimney interiors (Reference Schrenk, Kelley, Bolton and Baross110) and by methanotrophic and sulfur-oxidizing bacteria in the chimney exteriors (Reference Brazelton, Schrenk, Kelley and Baross111). The older, inactive chimneys are much more diverse, hosting many bacterial taxa as well as anaerobic methane-oxidizing archaea (ANME) (Reference Brazelton, Schrenk, Kelley and Baross111,Reference Brazelton, Ludwig, Sogin, Andreishcheva, Kelley and Shen112). The microbial communities at LCHF are likely stimulated by, if not entirely dependent on, the H2, methane, and other carbon sources produced by serpentinization (Reference Brazelton, Mehta, Kelley and Baross113). Another site of marine serpentinization, Prony is a shallow marine hydrothermal vent located near New Caledonia that vents fluids elevated in hydrogen and methane (Reference Quesnel, Gautier, Boulvais, Cathelineau, Maurizot and Cluzel114). Both the pH 11 fluids and chimneys from Prony exhibit similarly low archaeal diversity; however, they have a greater diversity of bacteria than Lost City, including the taxa Chloroflexi, Deinococcus-Thermus, Firmicutes, and Proteobacteria (Reference Quéméneur, Bes, Postec, Mei, Hamelin and Monnin115,Reference Postec, Quéméneur, Bes, Mei, Benaïssa and Payri116).
In the continental setting, serpentinization can take place underground in ophiolite complexes. Sampling of these subsurface processes often takes place at springs or pools, where the subsurface fluids come naturally to the surface. Various studies have used chemical proxies to differentiate subsurface, surface, and mixing-zone fluids (Reference Morrill, Kuenen, Johnson, Suzuki, Rietze and Sessions117,Reference Szponar, Brazelton, Schrenk, Bower, Steele and Morrill118) and found consistent trends in the microbial communities of these different zones. The oxic/anoxic mixing zone of continental serpentinite sites is often dominated by a single Betaproteobacterium (Reference Schrenk, Brazelton and Lang106). Early diversity studies identified this organism as Hydrogenophaga (Reference Brazelton, Nelson and Schrenk119–Reference Suzuki, Ishii, Wu, Cheung, Tenney and Wanger122). This bacterium was recently isolated from the Cedars, an ultra-basic site in northern California, resulting in a proposed name change to “Ca. Serpentinomonas” (Reference Suzuki, Kuenen, Schipper, Van Der Velde, Ishii and Wu123). Multiple studies have shown that the Hydrogenophaga/“Ca. Serpentinomonas” organisms from serpentinite sites have 99–100% sequence identity (Reference Suzuki, Kuenen, Schipper, Van Der Velde, Ishii and Wu123–Reference Opatkiewicz, Butterfield and Baross125). The Hydrogenophaga/“Ca. Serpentinomonas” strains that dominate serpentine systems are alkaliphilic (optimum pH of 11) and autotrophic with growth on hydrogen, oxygen, and calcium carbonate (Reference Twing, Brazelton, Kubo, Hyer, Cardace and Hoehler124). The more end-member serpentinite fluids tend to be host slightly higher diversity and contain anaerobes from the phyla Firmicutes (Reference Schrenk, Brazelton and Lang106,Reference Brazelton, Morrill, Szponar and Schrenk120–Reference Suzuki, Ishii, Wu, Cheung, Tenney and Wanger122,Reference Twing, Brazelton, Kubo, Hyer, Cardace and Hoehler124,Reference Niemann, Lösekann, De Beer, Elvert, Nadalig and Knittel126) and Chloroflexi (Reference Suzuki, Ishii, Wu, Cheung, Tenney and Wanger122) and the candidate division Parcubacteria (Reference Suzuki, Ishii, Wu, Cheung, Tenney and Wanger122,Reference Niemann, Lösekann, De Beer, Elvert, Nadalig and Knittel126). These strong similarities in the community composition of these geographically distinct sites suggest that these organisms may be specially adapted to withstand the challenging conditions of the serpentinite environment.
Given the importance of methane-cycling microorganisms to marine serpentinite ecosystems (Reference Brazelton, Schrenk, Kelley and Baross111,Reference Brazelton, Mehta, Kelley and Baross113,Reference Ruff, Biddle, Teske, Knittel, Boetius and Ramette127), scientists have wondered whether methane is of similar importance in continental settings. Previous diversity studies based on 16S rRNA gene amplicon data have suggested the presence of putative methane-cycling organisms at continental serpentinite sites (Reference Tiago and Veríssimo121,Reference Suzuki, Ishii, Wu, Cheung, Tenney and Wanger122,Reference Niemann, Lösekann, De Beer, Elvert, Nadalig and Knittel126,Reference Quéméneur, Palvadeau, Postec, Monnin, Chavagnac and Ollivier128). More recently, metagenomic methods have been employed to look more deeply into this question (Reference Brazelton, Thornton, Hyer, Twing, Longino and Lang129,Reference Crespo-Medina, Twing, Sánchez-Murillo, Brazelton, McCollom and Schrenk130). Both metagenomic and experimental evidence for methanogenesis by members of the Methanobacteriaceae and methanotrophy by members of the Methylococcaceae were found in extremely low-biomass sample from the Ligurian ophiolite in Italy (Reference Brazelton, Thornton, Hyer, Twing, Longino and Lang129). At the Santa Elena ophiolite in Costa Rica, all of the genes for diverse methanogenesis pathways were present (e.g. acetoclastic, hydrogenotrophic, and from formate) in metagenomes from a pH 11 serpentinite spring (Reference Crespo-Medina, Twing, Sánchez-Murillo, Brazelton, McCollom and Schrenk130).
The aforementioned studies were conducted by sampling the surface expression of a subsurface process through natural springs or pools. These features grant access to an otherwise inaccessible environment, but they represent opportunistic sampling at locations where the subsurface environment interacts with the surface. The Coast Range Ophiolite Microbial Observatory (CROMO) was established in northern California by drilling wells into the actively serpentinizing subsurface environment to access end-member fluids directly (Reference Cardace, Hoehler, McCollom, Schrenk, Carnevale and Kubo131). A comparison of microbial communities from a wide range of geochemical gradients at CROMO found that the dominant taxa in the system were strongly correlated with pH and the concentrations of methane and carbon monoxide (Reference Twing, Brazelton, Kubo, Hyer, Cardace and Hoehler124).
Studies have recently demonstrated that subsurface fluids and subsurface rocks from the same site exhibit differences in microbial community structure (Reference Momper, Reese, Zinke, Wanger, Osburn and Moser43). To date, little research on serpentinite rocks has been published, save a study at the Leka ophiolite in Norway, which found that serpentinite groundwaters were dominated by the hydrogen-oxidizing Betaproteobacterium Hydrogenophaga (a close relative of the aforementioned “Ca. Serpentimonas”), while mineral-associated communities contained microbes involved in nitrite, iron, manganese, and ammonium oxidation (Reference Daae, Økland, Dahle, Jørgensen, Thorseth and Pedersen132). At the Ligurian ophiolite in Italy, surface-exposed travertine deposits at serpentinite springs were investigated and archaeal species putatively involved in methane cycling and diverse bacterial species putatively involved in hydrogen oxidation were found, suggesting that these surface organisms could be fueled by deep serpentinization below (Reference Quéméneur, Palvadeau, Postec, Monnin, Chavagnac and Ollivier128). Additional studies are currently underway to investigate the microbial ecology of serpentinite rocks at continental (Reference Cardace, Hoehler, McCollom, Schrenk, Carnevale and Kubo131,133) and marine (Reference Früh-Green, Orcutt, Green, Cotterill, Morgan and Akizawa134) sites of serpentinization. These studies, combined with those investigating the microbial ecology of serpentinite fluids, will give us a more complete understanding of life in the ultra-basic subsurface environment.
17.1.5 Other Subsurface Environments
Submarine volcanoes like the Suiyo (Reference Higashi, Sunamura, Kitamura, Nakamura, Kurusu and Ishibashi135) and Axial (Reference Opatkiewicz, Butterfield and Baross136) Seamounts emit fluids that are at a lower pH than their surrounding seawater. These localities contain high amounts of H2S and often harbor large populations of sulfur-oxidizing Epsilonproteobacteria. On the other hand, submarine mud volcanoes and cold methane seeps release large amounts of methane that fuel sizeable populations of ANME (Reference Opatkiewicz, Butterfield and Baross125–Reference Ruff, Biddle, Teske, Knittel, Boetius and Ramette127). On the continents, the Rio Tinto in Spain (Reference Fernández-Remolar, Prieto-Ballesteros, Rodríguez, Gómez, Amils and Gómez-Elvira137) is an acidic environment for which the subsurface microbial communities were investigated. The Mars Astrobiology Research and Technology Experiment (MARTE) project identified three zones within the Rio Tinto’s subsurface: (1) a near-surface to ~30 m below sea level (mbsl) zone that supports fungal populations and is primarily driven by heterotrophy and aerobic respiration with seasonal rainfall; (2) a 30–43‑mbls zone in which iron and sulfur oxidation of sulfide minerals occurs under aerobic conditions by aerobic iron and sulfur oxidizers; and (3) an anaerobic deep zone (>43 mbsl) that contains organisms inferred to be carrying out anaerobic iron and sulfur oxidation, with SRB potentially producing H2S and thence pyrite by reaction with host rocks.
While a diverse array of subsurface environments exists on our planet, it is important to consider the implications of the adaptations and lifestyles of subsurface organisms for the habitability of extraterrestrial subsurface environments. The surface of Mars is inhospitable today on account of desiccation, ultraviolet and ionizing radiation, and oxidants (Reference Carrier138), yet the subsurface may have been more habitable throughout Martian history (Reference Michalski, Cuadros, Niles, Parnell, Rogers and Wright139). In the outer solar system, the detection of hydrogen and silica in fluids ejected from the south polar of Saturn’s icy moon Enceladus suggests fluid–rock interaction within that moon, showing that deep subsurface rock–water interactions on Earth may provide analogous insights into the limits of habitability of these environments (Reference Waite, Glein, Perryman, Teolis, Magee and Miller140). While the constraints on the fluid compositions of these extraterrestrial environments are poor, the lack of a connection to a surface photosynthetic biosphere means that these environments are likely to be carbon poor and that the primary available redox couples are chemolithotrophic.
All extraterrestrial environments receive an infall of meteoritic material, such as cometary or carbonaceous chrondrite material as well as endogenous reduced organic material. A crude calculation estimates the infall of unaltered carbon on Mars to be ~16 g of unaltered carbon km–2 year–1 (Reference Flynn, Rickman and Valtonen141), although much of this is in recalcitrant polycyclic aromatic hydrocarbon material. Compared to the estimated net primary productivity on Earth (~2 × 10⁸ g km–2; Reference Field, Behrenfeld, Randerson and Falkowski142), about seven orders of magnitude more carbon is available to ultimately make its way into the deep subsurface of Earth than of Mars. However, as in Earth’s deep subsurface, radiolysis, serpentinization, and reduced volcanic gases may provide H2 as an electron donor largely independent of carbon availability (Reference Sherwood Lollar, Voglesonger, Lin, Lacrampe-Couloume, Telling and Abrajano143). In the case of icy moons, the quantity of exogenous carbon that is recirculated into the subsurface oceans is unknown (e.g. Reference Kattenhorn and Prockter144), although detection of low- and high-molecular-weight carbon compounds in the fluids of Enceladus (Reference Waite, Combi, Ip, Cravens, McNutt and Kasprzak145) could suggest an endogenous source of carbon, such as from a core with a chondritic composition. Although there is much to be learned about extraterrestrial deep subsurface environments, it is clear that a growing knowledge of the physicochemical conditions in the terrestrial deep subsurface and how they restrict life (Section 17.3.1), as well as the role of the carbon cycle in constraining energy availability (Chapter 19, this volume), provides a foundation not only for understanding extraterrestrial environments, but also for prioritizing the measurements required to better constrain their habitability.
17.2 Global Trends in Subsurface Microbiology
While the previous section focused on the distribution of life throughout the subsurface, this section provides a more comprehensive overview of the organisms residing within the deep subsurface and their interactions between one another.
17.2.1 Archaea and Bacteria
The deep ocean is typically enriched in archaeal cells, but nearly all other marine environments show a dominance of bacterial lineages (Reference Karner, DeLong and Karl146). This was initially challenged by observations on the Peru Margin, which showed active archaeal cells in dominant abundances (Reference Biddle, Lipp, Lever, Lloyd, Sørensen and Anderson147). Further investigation of archaeal intact polar lipids showed that archaeal lipid dominance tracked with organic carbon content in sediments (Reference Lipp, Morono, Inagaki and Hinrichs148); however, it was later shown that these lipid profiles may be problematic due to long-lived phospholipids (Reference Schouten, Middelburg, Hopmans and Sinninghe Damsté149) and that initial measurements should be revised. Subsequent work and methodological clarifications (Reference Lloyd, May, Kevorkian and Steen150) have suggested that archaea and bacteria may have equal abundances in some sediments, yet a range of conditions persist, particularly in locations where no archaea have been found (Reference Briggs, Inagaki, Morono, Futagami, Huguet and Rosell-Mele70). Recent evidence suggests that initial bioturbation may be one of the most significant impacts on archaeal versus bacterial dominance in sediments (Reference Chen, Andersen, Morono, Inagaki, Jørgensen and Lever151).
Under the continents, the majority of sample sites show a dominance of chemotrophic bacterial lineages (Reference Magnabosco, Lin, Dong, Bomberg, Ghiorse and Stan-Lotter1). Despite small numbers, hydrogenotrophic methanogens are frequently detected, and there is an important link between the available dissolved inorganic C pool and the larger bacterial community (Reference Katayama, Yoshioka, Muramoto, Usami, Fujiwara and Yoshida152,Reference Simkus, Slater, Lollar, Wilkie, Kieft and Magnabosco153). In the Olkiluoto underground laboratory (Finland), populations of methane-oxidizing archaea become the dominant members of the microbial community within a sulfate–methane mixing zone located around 250–350 mbsl (Reference Bomberg, Nyyssönen, Pitkänen, Lehtinen and Itävaara45). Although subsurface methanogens and ANME have been relatively well characterized, other members of the continental subsurface archaeal communities are less understood. Targeted analysis on archaeal bins and single-cell genomes recovered from the continental subsurface are providing a new, in-depth look at archaea that were previously recognized only by their 16S rRNA gene sequences (for more details, see Chapter 18, this volume).
A notable example is the recent effort to characterize members of the South African Gold Mine Miscellaneous Euryarchaeal Group (SAGMEG) that are frequently reported in both marine and continental subsurface 16S rRNA gene surveys (Reference Baker, Saw, Lind, Lazar, Hinrichs and Teske154). The genomes of four SAGMEGs were recovered from diverse environmental samples and compared, revealing that these organisms most likely derive energy through the oxidation of carbon monoxide coupled to water or nitrite reduction. The comparative analysis also improved the phylogenetic placement of SAGMEG, resulting in a proposed reclassification of SAGMEG to a new group, “Hadesarchaea.” The prevalence of “Hadesarchaea” and other candidate phyla (Reference Brown, Hug, Thomas, Sharon, Castelle and Singh155) within subsurface environments is rapidly expanding our understanding of microbial diversity and changing the way we view the tree of life (Reference Hug, Baker, Anantharaman, Brown, Probst and Castelle156).
17.2.2 Subsurface Isolates and Interactions
While the number of novel taxa identified through DNA sequencing continues to grow at a rapid rate, the isolation and study of subsurface taxa lag behind. An important by-product of the isolation of subsurface microorganisms is the ability to test bacterial and archaeal responses to extreme temperature, pressure, pH, and salinity (see further discussion in Section 17.3), and also sense their contributions to carbon cycling in the deep subsurface (Chapter 18, this volume). A notable example is the isolation and study of the thermoacidophilic archaeon, Aciduliprofundum boonei, which was isolated from the hydrothermal fluids of the East Pacific Rise and Eastern Lau spreading center (Reference Reysenbach, Liu, Banta, Beveridge, Kirshtein and Schouten157). A. boonei is capable of growing in fluids as acidic as pH 3.3 and temperatures as high as 75°C. Due to its prevalence in hydrothermal vent 16S rRNA gene surveys, the isolation and study of A. boonei has been particularly informative to the study of thermoacidophilic archaea and sulfur and iron reduction in the subsurface.
While isolates provide tremendous insights into the physiology of microorganisms, the syntrophic and symbiotic relationships between microorganisms are ignored. Syntrophic interactions and interconnected metabolisms, however, are commonly cited as important components of subsurface ecology (Reference Anantharaman, Brown, Hug, Sharon, Castelle and Probst47,Reference Lau, Kieft, Kuloyo, Linage-Alvarez, Van Heerden and Lindsay52). One of the most well-studied examples of subsurface syntrophy is the partnership between ANME and SRB (Reference Lau, Kieft, Kuloyo, Linage-Alvarez, Van Heerden and Lindsay52,Reference Knittel and Boetius158,Reference Skennerton, Chourey, Iyer, Hettich, Tyson and Orphan159) (for more details, see Chapter 18, this volume). Other examples include methogens and ANME (Reference Lau, Kieft, Kuloyo, Linage-Alvarez, Van Heerden and Lindsay52), methanogens and H2 producers like Thermococcus paralvinellae (Reference Topçuoğlu, Stewart, Morrison, Butterfield, Huber and Holden160), and sulfur oxidizers and SRB (Reference Lau, Kieft, Kuloyo, Linage-Alvarez, Van Heerden and Lindsay52). In the oceanic crust, a spatial–temporal comparison of MAGs assembled from the fluids of North Pond on the Mid-Atlantic Ridge revealed a high degree of functional redundancy despite changes in community membership, suggesting that a consistent and stable set of metabolic interactions is necessary for life to succeed in North Pond (Reference Tully, Wheat, Glazer and Huber99). On the other hand, subsurface symbionts are less understood; however, symbiotic relationships between nanoarchaea and autrophic “Ca. Altiarchaeaum sp.” in the subsurface fluids of Crystal Geyser, Utah, were recently proposed due to co-occurrence patterns observed from metagenomic data (Reference Probst, Ladd, Jarett, Geller-McGrath, Sieber and Emerson161).
17.2.3 Subsurface Eukaryotes
The discovery of the nematode, Halicephalobus mephisto, within the South African subsurface revealed that complex, multicellular organisms are able to withstand the pressure, isolation, and temperature of the subsurface over 1 km underground (Reference Borgonie, García-Moyano, Litthauer, Bert, Bester and van Heerden162). A recent effort to sequence the genome of H. mephisto revealed that an expanded repertoire of 70‑kDa heat-shock protein (Hsp70) may be an important attribute of the H. mephisto genome, aiding in the nematode’s tolerance to elevated temperatures at depth (Reference Allen163). Following the discovery of subsurface Nematoda, other multicellular eukaryotes including Platyhelminthes, Rotifers, Annelids, and Arthropoda and unicellular Protozoa and Fungi have been identified at depth in the South African subsurface (Reference Borgonie, Linage-Alvarez, Ojo, Mundle, Freese and Van Rooyen164). Recent efforts to identify the source and transport of these eukaryotes underground point to freshwater sources and seismic activity (Reference Borgonie, Magnabosco, Garcia-Moyano, Linage-Alvarez, Ojo and Freese165).
While only a handful of subsurface sites have identified viable multicellular life, several continental (Reference Borgonie, Linage-Alvarez, Ojo, Mundle, Freese and Van Rooyen164,Reference Pedersen166–Reference Sohlberg, Bomberg, Miettinen, Nyyssönen, Salavirta and Vikman170) and marine subsurface (Reference Sinclair and Ghiorse171–Reference Ivarsson, Bengtson, Skogby, Lazor, Broman, Belivanova and Marone175) localities have identified diverse populations of fungi through sequencing and isolation. While the means of survival for subsurface fungi are still unknown, many believe subsurface fungi play a role in the degradation and recycling of nutrients in the subsurface via fermentation. It has been proposed that hydrogenosome-containing anaerobic fungi may produce H2 during carbohydrate degradation and subsequently form syntrophic interactions with methanogens and/or SRB (Reference Ivarsson, Schnürer, Bengtson and Neubeck176,Reference Drake, Ivarsson, Bengtson, Heim, Siljeström and Whitehouse177).
17.2.4 Subsurface Viruses
Viruses in the open ocean are now recognized as important players in marine biogeochemical cycles, initiating an estimated 1023 viral infections a second (Reference Suttle178) and delivering up to 150 Gt of C to the photic zone each year through cell lysis (Reference Suttle179). The role of viruses and their interactions with subsurface life, however, are less understood (for reviews dedicated to the topic of subsurface viruses, see Reference Anderson, Brazelton and Baross180–Reference Jørgensen and Marshall182). Many of the earliest investigations into subsurface viruses focused on enumeration-based methods such as virus particle-to-cell ratios (Reference Kyle, Eydal, Ferris and Pedersen54,Reference Bird, Juniper, Ricciardi-Rigault, Martineu, Prairie and Calvert183–Reference Engelhardt, Kallmeyer, Cypionka and Engelen185). In the marine environment, viruses are ~2–25 times more abundant than marine bacteria (Reference Knowles, Silveira, Bailey, Barott, Cantu and Cobián-Güemes186), but in subsurface settings, this ratio can be as large as 225:1 (Reference Engelhardt, Kallmeyer, Cypionka and Engelen185).
Different hypotheses have been proposed to explain the elevated virus-to-cell ratios in the subsurface, and many have suggested that viral predation is an active process in the subsurface (Reference Anderson, Brazelton and Baross180,Reference Jørgensen and Marshall182). Evidence of viable lytic viruses (Reference Eydal, Jägevall, Hermansson and Pedersen53), active infections via single-cell sequencing (Reference Labonté, Field, Lau, Chivian, Van Heerden and Wommack187), and acquired viral immunity via CRISPR have been reported (Reference Chivian, Brodie, Alm, Culley, Dehal and DeSantis21,Reference Daly, Borton, Wilkins, Hoyt, Kountz and Wolfe26,Reference Engelhardt, Sahlberg, Cypionka and Engelen188). On the other hand, long-term preservation of viral particles and low to no rates of viral infections in diffusion-limited marine sediments like the South Pacific Gyre have been proposed to explain elevated virus-to-cell ratios in the subsurface (Reference Engelhardt, Kallmeyer, Cypionka and Engelen185).
Although there has been some experimental work to characterize the host range and infection frequency of subsurface viruses (Reference Eydal, Jägevall, Hermansson and Pedersen53,Reference Engelhardt, Sahlberg, Cypionka and Engelen188), the majority of these viruses are still uncharacterized (Reference Nigro, Jungbluth, Lin, Hsieh, Miranda and Schvarcz189). Advances in sampling procedures and sequencing technologies are improving the genetic characterization of viruses through (meta)genomics (Reference Labonte, Lever, Edward and Orcutt190) and metatranscriptomics (Reference Nigro, Jungbluth, Lin, Hsieh, Miranda and Schvarcz189). As we continue to learn more about subsurface viruses, an important question will be how viruses influence the evolution of life in the subsurface.
17.3 Subsurface Ecology and Evolution
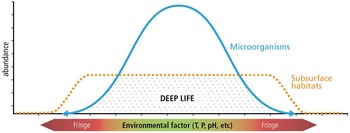
The abundance and diversity of life in surface environments are constrained by physical and chemical extremes such as temperature, pressure, salinity, and pH (Figure 17.3). As only a few subsurface sites have been sampled near these extremes, documented examples of correlations between these extremes and subsurface life are limited. However, numerous experiments and models have provided additional insights into the physical pressures of life underground.
Schematic of the distribution of microbial life throughout the subsurface. An illustration of the abundance of microorganisms (blue) and subsurface habitats across a gradient of environmental factors (x-axis; green = habitable, red = uninhabitable) is shown. The overlap of the two curves represents the abundance and distribution of deep life.

17.3.1 Physical Extremes in the Deep Subsurface
17.3.1.1 Diffusivity
As a first-order problem, some subsurface environments may be physically restrictive to organisms. Low porosity has been hypothesized to be a limit to life in some environments, an example being the low-porosity Clay Mesa shales that exhibit lower cellular abundances than the adjoining sandstones (Reference Fredrickson, McKinley, Bjornstad, Long, Ringelberg and White191). At sufficient depth, high pressures and small particle sizes (~1 μm or less) are likely to limit physical space and fluid movement (Reference Rebata-Landa and Santamarina192). In cases where fracturing of deep subsurface substrates has occurred, these restrictions may be overcome. Cockell et al. (Reference Cockell, Voytek, Gronstal, Finster, Kirshtein and Howard193) report an increase in cell abundance in the deep subsurface of the Chesapeake Bay meteorite impact structure and suggest that increases in porosity and fracturing of the rock in the impact-derived suevite layer increase both pore space and potentially fluid flow for microbial growth (Reference Cockell, Voytek, Gronstal, Finster, Kirshtein and Howard193). When sufficient porosity is available, many subsurface environments are found to be energy restricted (for an in-depth discussion of the energy limitation problem, see Chapter 19, this volume).
Among the early successes in understanding how diffusivity influences microbial diversity are the microbial transport experiments performed at the US Department of Energy’s field site in Oyster, Virginia (for a review on this topic, see Reference Scheibe, Hubbard, Onstott and DeFlaun194). Experiments at the South Oyster Site highlighted the variability in attachment rate of microorganisms due to differences in surface charge and the importance of hydraulic conductivity to transport. More recent work has explored how endospores can be released from the subsurface and transported throughout the marine environment (Reference Bell, Blake, Sherry, Head and Hubert195,Reference Chakraborty, Ellefson, Li, Gittins, Brooks and Bernard196), with current efforts focused on understanding how these processes influence biogeographic patterns in the subsurface.
17.3.1.2 pH
In environments where space and energy are permissive for growth, other physical and chemical extremes may exert an influence on life, although many of these extremes are poorly studied. As with surface environments, there is no known subsurface environment where pH is known to limit life as a sole stressor. In hydrothermal vent environments, pH values as low as 1.6 are reported (Reference Nakagawa, Takai, Suzuki, Hirayama, Konno and Tsunogai197), although the movements of fluids though these systems make it difficult to determine long-term in situ pH values. The lowest growth of a subsurface isolate (A. boonei at pH 3.3; Reference Reysenbach, Liu, Banta, Beveridge, Kirshtein and Schouten157) may not be the lowest pH limit of subsurface life. Alkaline environments are generated in the subsurface (see Section 17.1.4 for more details), such as during serpentinization of ultramafic rocks, which generates pH values greater than 12 (Reference Blank, Green, Blake, Valley, Kita and Treiman198). Isolates from the continental subsurface can grow at these extremes. Although cell numbers in the hyperalkaline Chamorro Seamount were found to decline in regions with a pH greater than 11 (Reference Takai, Moyer, Miyazaki, Nogi, Hirayama and Nealson199), there is no definitive evidence that pH alone limits growth.
17.3.1.3 Salinity
The isolation of halophiles from deep-sea environments (Reference Antunes, Taborda, Huber, Moissl, Nobre and da Costa200) shows that salt-tolerant organisms can be found in the deep subsurface. Sodium chloride solutions with a water activity >0.75 are unlikely to act as limits to life in the deep subsurface. However, solutions of other salts, such as MgCl2, which can have water activities below the limit for life and potentially exert chaotropic effects, can potentially act as limits to life in deep subsurface MgCl2-rich brines (Reference Hallsworth, Yakimov, Golyshin, Gillion, D’Auria and de Lima Alves201). In the continental deep subsurface, evaporites at 1 km depth in the Boulby Mine (Zechstein sequence) have been observed to produce solutions with a water activity of 0.56, below the limit for life and at which no life was detected (221). Deep subsurface evaporites may therefore contain habitats where salinity extremes limit life. These findings were obtained due to Deep Carbon Observatory support for metagenome sequencing of DNA purified and extracted from the evaporitic brines. The metagenomes have also yielded insights into carbon cycling in deep subsurface evaporites. For example, complete pathways for autotrophy were absent, but many complete pathways for metabolism of carbohydrates, amino acids, and other organic molecules were found, suggesting that the communities in the Zechstein sequence use either carbon derived from surface photosynthetic carbon entrained in surface-derived fluids or subsurface hydrocarbons (221).
17.3.1.4 Temperature
Because of the geothermal gradient, temperature is a ubiquitous extreme in the deep subsurface. Geothermal gradients can be extreme, such as in geothermally active regions (e.g. Yellowstone National Park), where the temperature may exceed the upper temperature limit for life (currently 121°C) within centimeters. On the other hand, geothermal gradients at subduction zones may be ~7°C km–1, resulting in a theoretical 121°C isotherm of ~17 km (Reference Colwell and Smith202). The temperature at which natural communities of organisms are limited is not known. Investigations of deep subsurface marine sediments suggest that cell abundances drop to below detectable levels in sections corresponding to hyperthermophilic growth at less than the 121°C isotherm (Reference Amend and Teske203). A study of the Middle Valley sediments over an inactive hydrothermal sulfidic vent (Ocean Drilling Program (ODP) site 1035) showed that cell abundances dropped to below detection when temperatures were in the range 80–110°C at 70–170 m below seafloor (mbsf) (Reference Cragg, Summit, Parkes, Zierenberg, Fouquet, Miller and Normak204). A temperature limitation-induced limit to life was similarly suggested for an active hydrothermal system (ODP legs 139 and 169), where cell abundances were found to increase laterally away from the vent, but to decrease substantially with depth and falling below detection at 20–25 mbsf (Reference Cragg, Summit, Parkes, Zierenberg, Fouquet, Miller and Normak204).
In addition to temperature extremes, the limits of life may additionally be restricted by energy limitations or the imposition of other stressors (e.g. salinity or extreme pH), making the limit lower than laboratory-determined investigations. However, one should also note that stressors do not always work in synergy to limit life. High pressure was found to shift the upper temperature limit of Desulfovibrio indonesiensis from 48°C to 50°C in the laboratory (Reference Rebata-Landa and Santamarina192). Nevertheless, the lower cell abundances reported in numerous subsurface environments at temperatures that exceed ~70°C compared to more mesophilic temperatures generally support the hypothesis that temperatures limit the deep biosphere in a region consistent with the upper temperature limits recorded for laboratory-grown strains.
17.3.2 Adaptations for Survival at the Extremes
The biochemical and physiological adaptations of organisms in the deep subsurface to physical and chemical extremes such as pH have not been well studied. In principle, there seems no reason to expect that adaptations to extremes such as pH would not be similar to the same adaptations observed in surface-dwelling organisms (e.g. transmembrane proton pumping as a means to regulate pH; Reference Daniel and Cowan205,Reference Baker-Austin and Dopson206).
However, of the range of physical parameters that can potentially influence deep subsurface life, high pressure is a ubiquitous condition (Reference Bartlett207,Reference Hazael, Meersman, Ono and McMillan208). High pressure will occur in combination with other stressors encountered in specific environments, so that understanding the limits of life under high pressure in combination with other extremes is paramount to knowing the role of pressure in defining the limits to life in the subsurface (Figure 17.3).
The adaptations to high pressure and combinations of high pressure with other extremes have received some attention. A study of D. indonesiensis revealed adaptations in the cellular lipids (Reference Rebata-Landa and Santamarina192). High temperature was found to reduce the proportion of unsaturated lipids, presumably to enhance membrane packing. Although high pressures might be expected to act antagonistically to reduce membrane fluidity, chain length was found to increase and branching was found to decrease membrane fluidity, suggesting that alterations of saturation, fatty acid length, and branching are employed to allow adaptation to both high temperatures and pressures.
17.3.3 Evolution of Deep Life
Mutation, natural selection, gene flow, and genetic drift are generally considered to be the main drivers of evolution on our planet. For deep life, the origins and evolution of subsurface life remains an open question. While phylogenetic methods are essential for inferring the evolutionary history of genes and species, metagenomic and single-cell studies (Reference Daly, Borton, Wilkins, Hoyt, Kountz and Wolfe26,Reference Tully, Wheat, Glazer and Huber99,Reference Nesbø, Swithers, Dahle, Haverkamp, Birkeland and Sokolova209–Reference Momper, Magnabosco, Hu, Amend and Fournier212) are beginning to provide new insights into the evolution of deep life.
In the subsurface, mutations – changes in the nucleotide sequence of a genome – are typically identified as mismatches observed during the alignment of metagenomic reads to a reference or consensus genome. Recently, scientists investigating the sediments of Aarhus Bay (Reference Starnawski, Bataillon, Ettema, Jochum, Schreiber and Chen210) and the hydrothermal fluids of Von Damm and Piccard in the Mid-Cayman Rise (Reference Anderson, Reveillaud, Reddington, Delmont, Eren and McDermott211) used sequence alignment methods to identify mutations within populations of microorganisms derived from various depths and/or habitats. To evaluate whether or not these populations were under positive or purifying selection, both studies compared the ratio of nonsynonymous and synonymous mutations (Ka/Ks) in protein-coding sequences. With the exception of Piccard, these subsurface sites did not exhibit an elevated Ka/Ks, indicating that the majority of observed genetic changes were silent mutations and that the dominant evolutionary process was purifying selection (the removal of deleterious mutations over time) rather than positive selection (when beneficial mutations arise and sweep the population). These observations are consistent with more general studies that indicate that purifying rather than positive selection is responsible for the majority of diversity patterns we see within populations of microorganisms (Reference Novichkov, Wolf, Dubchak and Koonin213–Reference Kuo, Moran and Ochman215).
In addition to single-nucleotide changes, entire genes and cassettes of genes can be transferred from one population to another via horizontal gene transfer (HGT), an example of gene flow. HGTs are best identified through genomic and phylogenetic comparisons and play an important role in bacterial and archaeal evolution. A biofilm metagenome from the LCHF identified increased abundances of transposases relative to surface metagenomes, suggesting that HGT is an important evolutionary process in this system (Reference Brazelton and Baross216). In the continental subsurface, it has been shown that populations of subsurface bacteria have acquired horizontally transferred metabolic genes that distinguish them from that their surface- and sub-seafloor sediment-based relatives (Reference Chivian, Brodie, Alm, Culley, Dehal and DeSantis21,Reference Momper, Reese, Zinke, Wanger, Osburn and Moser43,Reference Jungbluth, Glavina Del Rio, Tringe, Stepanauskas and Rappé84). A comparison of 11 Thermotoga maritima-like genomes from surface marine sites in the Kuril Islands, Italy, and Açores and subsurface oil reservoirs in Japan and the North Sea revealed that these closely related organisms exhibit high amounts of gene flow between populations, suggesting that these T. maritima-like organisms are readily migrating to and from oil reservoirs around our planet (Reference Nesbø, Swithers, Dahle, Haverkamp, Birkeland and Sokolova209).
While T. maritima-like organisms and the endospores described in Section 17.3.1.1 may readily move between surface and subsurface habitats, other subsurface populations may not migrate as easily. For sub-seafloor sediments, low diffusivity likely inhibits movement between the deepest sediment layers and the surface (Reference Starnawski, Bataillon, Ettema, Jochum, Schreiber and Chen210). Low replication rates, small population sizes, and restricted mobility may indicate that genetic drift, or the changes in genotype frequencies due to random events, may be a stronger driver of evolution than natural selection. The founder effect is a particularly interesting case of genetic drift in the context of sub-seafloor evolution. Here, a heterogeneous population gets divided into small populations of migrants due to stochastic processes. By chance, some of the migrant populations will exhibit low amounts of genetic variability and, over time, may look very different from the parent population.
While the interplay between these evolutionary processes continues to be an active field of subsurface research, additional advances have been made to understand the molecular mechanisms that lead to the diversity we observe. In addition to replication error, DNA damage and erroneous repair, and HGT, diversity-generating retroelements (DGRs) have been found to play an important role in the diversification of tail fiber ligand-binding domains in subsurface archaea (Reference Paul, Bagby, Czornyj, Arambula, Handa and Sczyrba217) and a variety of protein targets in subsurface candidate phyla (Reference Paul, Burstein, Castelle, Handa, Arambula and Czornyj218). DGRs create site-specific protein hypervariability through a process known as “mutagenic retrohoming” and are especially interesting in the context on subsurface diversification as they create diversity without cell replication or division. As evolutionary research continues in the subsurface, an important step will be to consider the roles that these processes play in the context of the energy, spatial, and population-level limitations each environment provides.
17.4 Conclusion
While much is still unknown, global initiatives like the Census of Deep Life (CoDL; https://vamps2.mbl.edu/portals/CODL) and IODP Expedition 370 (www.jamstec.go.jp/chikyu/e/exp370) are currently generating large data sets to better characterize the biodiversity and limits to life in the subsurface. Already, the CoDL has coordinated the sequencing of over 600 subsurface samples from a wide variety of subsurface habitats, and the scientists of IODP Expedition 370 have collected 112 cores (equivalent to 577.85 m) across the sediment–basalt interface. Although precautions and methodological improvements have been utilized in these important programs, major challenges such as changes in sequencing technology and contamination from the surface still exist. Similar to the efforts of the US Department of Energy, US Geological Survey, and US Environmental Protection Agency to identify indigenous subsurface microbial communities in the mid-1980s (Reference Phelps, Fliermans, Garland, Pfiffner and White219), a major challenge will be the characterization of authentic and contaminating organisms. However, while Phelps and colleagues focused on the infiltration of drilling fluids into native samples (Reference Phelps, Fliermans, Garland, Pfiffner and White219), the current challenge is to remove contaminating DNA sequences from the surface and confounding factors from statistical analyses. Early work by Sheik et al. provides an interpretable outline of best practices for identifying and removing contaminating sequences from subsurface 16S rRNA gene data sets (Reference Sheik, Reese, Twing, Sylvan, Grim and Schrenk220). The remarkable progress since the first deep subsurface metagenome was sequenced a decade ago (Reference Chivian, Brodie, Alm, Culley, Dehal and DeSantis21) highlights the extraordinary potential to advance our understanding of the subsurface biogeography, ecology, and evolution, with countless new discoveries awaiting on the made.
Acknowledgments
We thank Josh Wood for illustrating Figures 17.2 and 17.3 and Rob Pockalny for assisting in the preparation of the map in Figure 17.1. We also thank R Anderson, the Center for Dark Energy Biosphere Investigations (C-DEBI), the Flatiron Institute Center for Computational Biology (CCB), and participants of the C-DEBI/CCB Evolution Workshop funded by NSF award OIA-0939564 and the Simons Foundation for insightful discussions surrounding the topic of microbial evolution in the deep subsurface.
Questions for the Classroom
1 What are the subsurface biomes and how do they vary?
2 What limits cellular abundances in the continental subsurface and marine subsurface?
3 What are some common themes between the continental and marine subsurface biospheres?
4 Where would heterotrophic lifestyles, autotrophic lifestyles, and a combination (i.e. metabolic versatility) be predicted in the subsurface?
5 What methods are available to study subsurface life and how do they vary?
6 What are the physical limits to life on Earth?
7 What might deep life tell us about life on other planets?
8 What are the mechanisms of evolutionary change? How would one identify them?
List of Online Resources
Maps of subsurface studies and cell numbers: https://caramagnabosco.shinyapps.io/SubsurfaceBiologicalStudies.
C-DEBI BCO-DMO data portal: www.bco-dmo.org/program/554979.

 Open access