

INTRODUCTION
Many countries in Europe have national serological surveillance schemes for evaluating their vaccination programmes [Reference Pinot de Moira and Nardone1–Reference Meerhoff4]. The European Seroepidemiology Network (ESEN) project was initiated in 1996 to coordinate and harmonize these systems so that a comparison could be made between vaccination strategies in Europe. Eight European countries and Australia participated in this original study and seroprevalence was estimated for five infections: measles, mumps, rubella, pertussis, diphtheria [Reference Osborne, Weinberg and Miller5].
The European Seroepidemiology Network 2 (ESEN2) project was established in 2001 as a continuation of the ESEN study [Reference Nardone and Miller6]. ESEN2 aimed to estimate and compare age-specific seroprevalence for eight vaccine-preventable diseases in Europe. These were: measles, mumps, rubella, diphtheria, pertussis, as well as varicella zoster virus (VZV), hepatitis A virus (HAV) and hepatitis B virus (HBV) infections. Following the success of the poliomyelitis eradication programme in Europe, the WHO Regional Office in Europe set up targets for the elimination of other vaccine-preventable diseases. The diseases included in the ESEN and ESEN2 studies were selected based on the WHO targets. As part of the project, serosurveys of 1000–3000 samples were collected from 21 European countries and Australia, and tested by their national laboratories using each country's routine assays [Reference Nardone and Miller6].
Serosurvey results provide the most accurate reflection of the immune status of the population. However, the variety of assays and laboratory methods used by the national laboratories can result in non-comparable serological outcomes and hence, seroprevalence estimates. Inter-laboratory variation is not uncommon even when the same assay method and international standards are used [Reference Anastassopoulou7–Reference Kafatos14]. For the ESEN and ESEN2 projects, a statistical method was developed to adjust for this variation by standardizing the serological quantitative data [Reference Andrews9, Reference Kafatos, Andrews and Nardone15, Reference Kafatos16]. The equations used for standardizing the serological outcomes for the ESEN2 project have been presented in previous papers [Reference Anastassopoulou7, Reference de Ory11, Reference Tischer13, Reference Kafatos14, Reference di Giovine17, Reference Giammanco18]. The final seroprevalence estimates have also been presented elsewhere [Reference di Giovine17–Reference Nardone24].
The aim of this paper was to quantify the adjustments made on seroprevalence estimates due to using different assays and laboratory methods. This was achieved by comparing seroprevalence estimates before and after pereforming the standardization of serological outcomes for measles, mumps, rubella, diphtheria, VZV and HAV.
METHODS
Standardization procedure
The standardization procedure can be described in brief as follows: a panel of about 150 samples for each marker of infection of interest (or group thereof) was prepared by a reference laboratory and included quantitative results from the whole range of antibody levels from negative and equivocal to positive samples. ‘Equivocal’ or ‘low positive’ results (the terms are used interchangeably for the purposes of this paper and the ESEN projects) are those found just above the negative/positive cut-off point (equivocal range). This standardization panel was sent and tested by each participating laboratory. The process was repeated twice, once before as a pilot run and once halfway during the main serosurvey testing. Using the second panel test, each laboratory's panel results were regressed against the reference centre, thus obtaining standardization equations. These equations were used to convert the quantitative measurements of the serosurveys into the reference assay's unitage [Reference Andrews9, Reference Kafatos, Andrews and Nardone15]. After the serological results of the national laboratories were standardized into common units, seroprevalence was estimated by grouping these measurements into positives or negatives according to the reference assay's cut-off [Reference Andrews9, Reference Kafatos, Andrews and Nardone15].
Back-standardization procedure
There were occasions where it was not possible to standardize a country's results because the serosurvey had been tested before the distribution of the panel. A back-standardization procedure was then used as an alternative method. Following the serosurvey testing, about 150 samples were selected from the serosurvey after stratifying the results according to titre to ensure that the whole range from high positive to low negative was represented. The samples were sent to the reference laboratory to be re-tested. The standardization was then performed in the same way as for the standardization panel [Reference Andrews9].
Quantification of standardization adjustment on seroprevalence estimates
Age-specific seroprevalence was estimated before and after standardization for the measles, mumps, rubella, diphtheria, VZV and HAV serosurveys that were tested as part of the ESEN2 study. Pertussis serosurveys were not included in the analysis because an alternative analytical approach was undertaken [Reference Giammanco18]. HBV serosurveys were excluded since standardization was not possible to be fully implemented. HBV seroprevalence is estimated from a combination of different HBV antigens [Reference Mims25] and for some of these assays only qualitative or semi-quantitative serological results were available [Reference Kafatos14, Reference Nardone24]. The age groups of a typical serosurvey were as follows: 1, 2, …, 9, 10–14, 15–19, 20–29, 30–39, ⩾40 years although this varied by country depending on the sampling methods used and the available resources.
To quantify the adjustment arising from the various laboratories and assay methods used in the ESEN2 project, the difference in seroprevalence estimates DS j for age groups j = 1, …, k was defined as follows:
 $$DS_j = \hat \psi _j - \hat \phi _j,$$
where $\hat \phi $
and
$\hat \phi $
and $\hat \psi $
refer to the seroprevalence estimates before and after standardization, respectively.
$\hat \psi $
refer to the seroprevalence estimates before and after standardization, respectively.
The mean of overall absolute seroprevalence difference or simply mean seroprevalence difference (MS) was defined as:
 $$MS = \displaystyle{1 \over n}\sum\nolimits_{\,j = 1}^k {n_j} \left\vert {DS_j} \right\vert,$$
where n was the total number of samples and n j the total number of samples in each age group. The reason for selecting these statistics was to provide an easy-to-interpret quantification of seroprevalence differences.
Uncertainty intervals around the MS estimates were obtained by bootstrapping values of n j and |DS j | from the dataset of k age groups. Following 1000 bootstraps, the 2·5th and 97·5th percentiles of the resulting bootstrap estimates were defined as the 95% bootstrap intervals (BI) [Reference Efron and Tibshirani26]. Stata v. 12·1 (StataCorp, USA) was used for the statistical analysis.
RESULTS
When observing the individual age groups following standardization, 531/1233 (43·1%) had seroprevalence differences following standardization of ⩽1% whereas 309/1233 (25·1%) had differences >5% and 133/1233 (10·8%) age groups had seroprevalence differences >10%. The overall impact of the adjustment due to the different laboratory methods and assays can be summarized by an overall mean seroprevalence difference MS = 3·2% (95% BI 2·9–3·6). In other words, on average we would expect a seroprevalence difference of 3·2% after standardization. However, this percentage varied greatly by antigen.
Tables 1–6 show the antigen assays used by each national laboratory together with the assay cut-offs. The age group j is also given for which |DS j | was highest as well as the maximum seroprevalence difference for this age group, DS. The mean seroprevalence differences are summarized in Table 7 by antigen, type of assay used (reference assay or not) and type of standardization method used (back-standardization or not).
Comparison of the measles seroprevalence differences following standardization as well as mean seroprevalence differences across age groups listed by laboratory and assay method used
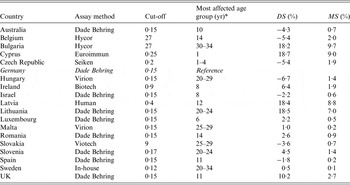
DS, Difference in seroprevalence estimates; MS, mean seroprevalence difference.
* ‘Age group’ denotes the age group with the highest |DS j |.
Comparison of the mumps seroprevalence differences following standardization as well as mean seroprevalence differences across age groups listed by laboratory and assay method used

DS, Difference in seroprevalence estimates; MS, mean seroprevalence difference.
* ‘Age group’ denotes the age group with the highest |DS j |.
Comparison of the rubella seroprevalence differences following standardization as well as mean seroprevalence differences across age groups listed by laboratory and assay method used

DS, Difference in seroprevalence estimates; MS, mean seroprevalence difference.
* ‘Age group’ denotes the age group with the highest |DS j |.
Comparison of the diphtheria seroprevalence differences following standardization as well as mean seroprevalence differences across age groups listed by laboratory and assay method used

DS, Difference in seroprevalence estimates; MS, mean seroprevalence difference.
* ‘Age group’ denotes the age group with the highest |DS j |.
Comparison of the VZV seroprevalence differences following standardization as well as mean seroprevalence differences across age groups listed by laboratory and assay method used

DS, Difference in seroprevalence estimates; MS, mean seroprevalence difference.
* ‘Age group’ denotes the age group with the highest |DS j |
Comparison of the HAV seroprevalence differences following standardization as well as mean seroprevalence differences across age groups listed by laboratory and assay method used

DS, Difference in seroprevalence estimates; MS, mean seroprevalence difference.
* For details on assay methods see Table 1 of the standardization paper for anti-HAV [Reference Osborne, Weinberg and Miller5].
† ‘Age group’ denotes the age group with the highest |DS j |
Frequencies of serosurveys by mean seroprevalence differences, antigens, type of assay and type of standardization method

Seroprevalence differences by antigen
For measles, for 14/18 laboratories the mean seroprevalence difference was <3%. Of the remaining four laboratories with mean seroprevalence differences ranging from 7% to 10%, three used a different assay than the Dade Behring reference assay (Tables 1 and 7). For 9/18 national serosurveys the mean seroprevalence for mumps was <5% whereas there were three serosurveys with mean seroprevalence differences >10%. All of these were tested with a different assay than the reference assay (Tables 2 and 7). For rubella, 13/17 serosurveys had mean seroprevalence differences of ⩽2% and one serosurvey showed results of >10% (Tables 3 and 7). Six out of eight serosurveys for diphtheria had mean seroprevalence differences of ⩽5% (Tables 4 and 7). For VZV, 7/10 serosurveys had mean seroprevalence differences of <2% and all the differences were <7% (Tables 5 and 7). For HAV, there were two serosurveys with mean seroprevalence differences as high as 15% (Tables 6 and 7).
The mean seroprevalence differences by antigen and country are summarized in Figure 1. The mean seroprevalence for VZV (1·7%, 95% BI 1·2–2·3%), measles (2·6%, 95% BI 2·1–3·2) and rubella (2·4%, 95% BI 1·8–3·0) was generally low. High differences were estimated for HAV (4·7%, 95% BI 3·3–6·5) and mumps (4·3%, 95% BI 3·7–4·8). The mean seroprevalence difference for diphtheria was 3·2% (95% BI 1·8–4·7) (Fig. 1).
Seroprevalence differences by country and antigen. The mean seroprevalence differences are based on the absolute differences.

Seroprevalence differences by type of assay used
For laboratories that used the reference assay, 79% had mean seroprevalence differences of ⩽5% compared to 59% of national serosurveys tested with other assays. Those national laboratories that used the same assay as the reference centre had a mean seroprevalence difference of 1·9% (95% BI 1·5–2·3) whereas the laboratories that used a different assay with respect to the reference centre had higher mean seroprevalence differences (MS 4·4%, 95% BI 3·9–5·0).
Seroprevalence differences using back-standardization
When using back-standardization, 64·7% mean seroprevalence differences were <5% compared to 70·8% when standardization was used (Table 7). The mean seroprevalence difference for the standardization method was 3·4% (95% BI 3·0–3·8) and for back-standardization 2·5% (95% BI 1·8–3·4).
Seroprevalence differences by age group
The absolute differences between the crude and standardized seroprevalence for each age group, |DS j |, are given in Table 8. For the older age group (>20 years), 80% of the absolute differences were <5% compared to 72–75% for the other age groups. The mean seroprevalence differences for the age group was: 1–4 years (3·7, 95% BI 3·1–4·5), 5–9 years (3·7, 95% BI 3·1–4·2), 10–19 years (3·8, 95% BI 3·1–4·5) and >20 years (2·6, 95% BI 2·1–3·2).
Frequencies of age groups by absolute seroprevalence differences and age groups

Differences between standardized and non-standardized seroprevalence
A graphic display of the differences between standardized and non-standardized prevalence is given in Figure 2. The Italian laboratory used a different assay (DiaSorin, Italy) than the reference centre (Abbott Laboratories, USA) to test against HAV (Table 6). Although both assays shared the same cut-off value (10 mIU/ml), a large number of samples were re-classified following standardization, which meant that there was a large difference in seroprevalence following standardization [Reference Anastassopoulou7, Reference Kurkela21].
Example of standardized and non-standardized seroprevalence by age group for Italian HAV results.

The estimated HAV seroprevalences for the Italian serosurvey results tested against HAV before and after standardization are shown in Figure 2. It appears that there is a high number of sera just above the local assay cut-off for those aged <25 years. These samples were re-classified as negative following standardization.
DISCUSSION
As part of the ESEN2 study, serosurveys carried out and tested independently from each other were combined with the aiming of estimating seroprevalence. For this purpose, a statistical method was developed to standardize the serological outcomes into common units. In this paper the crude and adjusted seroprevalences were compared in order to assess the impact of the standardization method. The overall mean seroprevalence difference was estimated as 3·2% (95% BI 2·9–3·6); however, this percentage varied greatly by antigen and assay used. Low mean seroprevalence differences were reported for VZV, measles and rubella and high differences for mumps and HAV.
Those national laboratories that used the reference assay had lower seroprevalence differences than those that used other assay types. However, there was no consistency in the estimated seroprevalences in national laboratories that used a particular assay, implying that additional factors may affect the outcome of such tests (internal or in-house controls, handling of samples, etc.). For example, although Belgium, Ireland, Italy and Slovakia used the DiaSorin assay for HAV (ETI-AB-HAVK-3), their respective MS varied from 0·2% to 15·9% (Table 6). This implies that some type of adjustment needs to be made when analysing data that use a variety of laboratory methods (whether samples are tested in different laboratories or if a different assay has been used).
The differences between crude and standardized seroprevalences was higher for those aged <20 years compared to those aged ⩾20 years. This means that for the <20 years age group there is a higher number of samples with results close to the positive/negative cut-off. This could be due to the high number of vaccinated children whereas a higher number of adults are expected to be unvaccinated, especially those born prior to the establishment of vaccination programmes. Antibody responses to vaccination are often lower than those resulting from natural infection [Reference Giesecke27].
For the purposes of the ESEN2 project a single cut-off point was chosen by merging equivocal (or low positive) and positive results. This adds to the overall test-to-test variation since some assays have a larger proportion of equivocal results resulting in higher sensitivity. However, this is a practice commonly applied to serological data, and it was used for a number of different antigens and assays throughout the ESEN and ESEN2 projects [Reference Andrews9, Reference Tischer13, Reference Andrews19, Reference de Melker28, Reference Pebody29].
Other than the successful application of the standardization method, suitable assay cut-offs are required for obtaining unbiased seroprevalence estimates. Both these assumptions may be bypassed when using an alternative method for seroprevalence estimation. Using mixture modelling directly on non-standardized serological data makes it possible to obtain seroprevalence estimates without applying assay cut-offs, therefore, avoiding the time-consuming and costly process of standardization [Reference Gay30]. However, there are two major disadvantages associated with this method: (a) there is a certain element of subjectivity associated with choosing the shape (and the number) of the underlying components of mixture models and (b) the distributions of the underlying components need to be well separated which was not always the case for the serosurveys examined in the project. Due to these limitations of the mixture models as well as the fact that the standardization method is easier to apply once the assay cut-offs have been selected were the reasons the latter method was preferred.
In conclusion, this paper attempts to quantify the effect of samples tested in different laboratories and/or using different assay methods on seroprevalence estimation. For the majority (70%) of the national serosurveys shown there was little difference between the crude and the standardized seroprevalence estimates (MS < 5%) suggesting little laboratory and assay method effect. However, for a small number of laboratories (9%) the standardized seroprevalence estimates were altered by >10% compared to the crude estimates despite using long-established assays. Adjusting the serological data using the standardization method or another method such as mixture modelling is necessary, particularly for specific antigens and in cases where different assays have been used. The methods described in this paper could potentially be applied to new international seroepidemiological initiatives such as the Consortium for the Standardization of Influenza Seroepidemiology [31].
APPENDIX. ESEN2 members
Backhouse J, Gilbert L (Australia); de Cock L, Vranckx R (Belgium); Gatcheva N, Voynova V (Bulgaria); Mitis G, Zarvos M (Cyprus); Kriz B, Nemecek V, Petras P (Czech Republic); Davidkin I, Jokinen S (Finland); Hellenbrand W, Thierfelder W, Tischer A (Germany); Anastassopoulou C, Hatzakis A, Tsakris A, Panagiotopoulos T (Greece); Antony M, Bojtos J, Kálmán B, Koren K, Sovegjarto I (Hungary); Cotter S, Jones L, O'Flanagan D, Thornton L (Ireland); Aboudy Y, Cohen D, Green M (Israel); Alfarone G, Bruzzone B, Gabutti G, Giammanco A, Icardi G, Rota MC, von Hunolstein C (Italy); Duks A, Kazanova L, Selga I, Velicko I (Latvia); Bakasenas V, Caplinskas S, Griskevicius A (Lithuania); Mossong J, Schneider F (Luxembourg); Amato A, Christopher B (Malta); Berbers G, Boot H, de Melker H (Netherlands); Alexandrescu V, Butur D, Lupulescu E, Pistol A (Romania); Klement C, Mikova I, Slacikova M, Sobotová Z (Slovakia); Prosenc K (Slovenia); de Aragon VM, de Ory F (Spain); Johansen K (Sweden); Hesketh L, Miller E, Nardone A (UK).
ACKNOWLEDGEMENTS
We thank all the ESEN2 members who contributed to the collection and testing of the serological samples included in this paper. The ESEN2 project was funded by the European Commission (contract number QLK2-CT-2000–00542), national governments and other national funding sources.
DECLARATION OF INTEREST
None.


