


Highlights
The fate of subsurface additions of isoprene and its chemical and biological derivatives was monitored in soil columns using in situ diffusive gas probes and online high-resolution mass spectrometry.
Chemical degradation supports active isoprene oxidation pathways in soil.
Isoprene additions prime the soil microbiome to increase biological degradation rates.
Biological degradation outpaces chemical degradation in a lasting response to isoprene priming.
Introduction
Isoprene, the second-most abundant volatile organic compound (VOC) in the atmosphere, is emitted in massive quantities from the terrestrial biosphere (~600 Tg y–1) with ~90% of total emissions from vegetation (~0.001–100 μmol day–1 g(leaf, dry weight (dw))–1) (Sharkey et al., Reference Sharkey, Wiberley and Donohue2008; Guenther et al., Reference Guenther, Jiang, Heald, Sakulyanontvittaya, Duhl, Emmons and Wang2012). Soil uptake of atmospheric isoprene is a widespread process (Tang et al., Reference Tang, Schurgers and Rinnan2019; Rinnan and Albers, Reference Rinnan and Albers2020) that counterbalances an uncertain proportion of these biogenic isoprene emissions. Early estimates positioned isoprene soil uptake at 4% of the overall sink (Cleveland and Yavitt, Reference Cleveland and Yavitt1998) but updates are needed that consider variation across biomes, soil properties (Pajares et al., Reference Pajares, Campo, Bohannan and Etchevers2018; Singh and Dubey, Reference Singh and Dubey2023) and environmental factors (Werner et al., Reference Werner2021; Pugliese et al., Reference Pugliese2023). Isoprene degradation in soil is pertinent not only to atmospheric isoprene but also to other ecosystem isoprene sources. Roots can emit isoprene, although estimates vary widely (~0.001–100 μmol day–1 g(roots, dw)–1) (Ghirardo et al., Reference Ghirardo, Gutknecht, Zimmer, Brüggemann and J-P2011; Bellucci et al., Reference Bellucci, Mostofa, Weraduwage, Xu, Abdelrahman, De Gara, Loreto and Sharkey2024; Miloradovic Van Doorn et al., Reference Miloradovic Van Doorn, Merl‐Pham, Ghirardo, Fink, Polle, Schnitzler and Rosenkranz2020), potentially extending the reach of the rhizosphere’s influence on soil (Porte et al., Reference Porte, Schmidt, Yergeau and Constant2020; Raza et al., Reference Raza, Wei, Jousset, Shen and V-P2021). Although there is thought to be little to no isoprene storage in leaves (Sharkey and Yeh, Reference Sharkey and Yeh2001) that would pass to litter, modest isoprene emissions from litter have been observed (~0.001–60 μmol day–1 g(litter, dw)–1) (Gray et al., Reference Gray, Helmig and Fierer2015; Crocker et al., Reference Crocker, Guo, U’Ren, Pugliese, Ladd, Werner and Meredith2025), possibly from isoprene-producing microbes that are found in soil (Kuzma et al., Reference Kuzma, Nemecek-Marshall, Pollock and Fall1995). Anthropogenic VOC contamination of soil is common, including isoprene soil contamination from industrial rubber plants (Srivastva et al., Reference Srivastva, Shukla, Singh, Upadhyay and Dubey2015). These isoprene sources are likely dynamic across time and space (i.e. hot moments and spots) (Ghirardo et al., Reference Ghirardo, Gutknecht, Zimmer, Brüggemann and J-P2011) depending on plant species, stress, phenology and other environmental factors. The fate of isoprene inputs from the atmosphere, litter, roots and microbes to soil, and thus the dynamics and concentrations of soil isoprene, may be controlled both by biological and chemical degradation processes.
Biological degradation of isoprene in soil is primarily attributed to microbes (Cleveland and Yavitt, Reference Cleveland and Yavitt1998), including bacteria (van Hylckama Vlieg et al., Reference van Hylckama Vlieg, Kingma, van den Wijngaard and Janssen1998, Reference van Hylckama Vlieg, Kingma, Kruizinga and Janssen1999; Larke-Mejía et al., Reference Larke-Mejía, Crombie, Pratscher, McGenity and Murrell2019) and putatively fungi (Gray et al., Reference Gray, Helmig and Fierer2015), where microbes oxidise isoprene for biosynthesis and growth, in some cases as a sole carbon source (van Hylckama Vlieg et al., Reference van Hylckama Vlieg, Kingma, van den Wijngaard and Janssen1998, Reference van Hylckama Vlieg, Kingma, Kruizinga and Janssen1999; Dawson et al., Reference Dawson, Rix, Crombie and Murrell2022), or via coincidental co-oxidation by related enzyme groups (e.g. soluble di-iron monooxygenase (SDIMO) enzymes; Yang et al., Reference Yang, Kertesz and Coleman2025). In bacterial isoprene degradation pathways, isoprene is initially transformed into a volatile epoxide (C5H8O) and then into other intermediates that enter the central metabolism for biosynthesis and growth (van Hylckama Vlieg et al., Reference van Hylckama Vlieg, Leemhuis, Spelberg and Janssen2000; Dawson et al., Reference Dawson, Rix, Crombie and Murrell2022). Isoprene degradation is initiated by a conserved isoprene monooxygenase enzyme, and the corresponding isoA marker gene has been used to investigate and highlight the distribution and diversity of these bacteria (Larke-Mejía et al., Reference Larke-Mejía, Crombie, Pratscher, McGenity and Murrell2019), including in soil associated with isoprene-emitting plants (Carrión et al., Reference Carrión, Larke-Mejía, Gibson, Farhan Ul Haque, Ramiro-García, McGenity and Murrell2018). Soil sterilisation experiments (Cleveland and Yavitt, Reference Cleveland and Yavitt1998) suggest that the microbial role in isoprene uptake is larger than potential abiotic processes such as dissolution (Mochalski et al., Reference Mochalski, King, Kupferthaler, Unterkofler, Hinterhuber and Amann2011), adsorption onto soil particles (Ahmad and Martsinovich Reference Ahmad and Martsinovich2022) and chemical degradation (Insam and Seewald, Reference Insam and Seewald2010; Li et al., Reference Li2019; Tang et al., Reference Tang, Schurgers and Rinnan2019). Overall, the relative contributions of biotic versus abiotic processes to isoprene soil exchange are not well constrained.
Chemical degradation of isoprene is an important process in the atmosphere. Isoprene is highly reactive (~30 min lifetime at 5 × 10⁶ •OH molecules cm–3), where gas-phase oxidation processes constitute its dominant sink with consequential impacts on atmospheric chemistry (Carslaw et al., Reference Carslaw, Bell, Lewis, McQuaid and Pilling2000; Wennberg et al., Reference Wennberg2018). Isoprene oxidation mainly proceeds through •OH-, NO3-, O3- and •Cl-initiated reaction pathways (Wennberg et al., Reference Wennberg2018) that form different suites of first-generation oxidation products (direct products from these initial reactions) depending on levels of NO. Under low-NO conditions (e.g. <40 ppt; Wennberg et al., Reference Wennberg2018; Langford et al., Reference Langford2022), isoprene–•OH adducts and isoprene epoxydiol isomers dominate, in contrast to high-NO conditions (e.g. >100 ppt; Ren et al., Reference Ren2003; Newland et al., 2021), where NO-driven oxidation primarily leads to the generation of methyl vinyl ketone (MVK) and methacrolein (MACR) (both with the formula C4H6O) (Carlton et al., Reference Carlton, Wiedinmyer and Kroll2009; Wennberg et al., Reference Wennberg2018; Bates and Jacobs, Reference Bates and Jacob2019). First-generation products can undergo further oxidation to form suites of second-generation and further oxidised products (Krechmer et al., Reference Krechmer2015). Photochemical processes help drive isoprene oxidation in the atmosphere, yet isoprene oxidation persists even under dark nocturnal conditions (e.g. via NOx; Brown et al., Reference Brown2009; Chen et al., Reference Chen2022; Li et al., Reference Li, Cui, Huang, Zhang, Wang, Chen and Ge2023), suggesting that chemical pathways for isoprene oxidation may occur elsewhere.
In the miniature atmospheres of soil pores, chemical degradation mechanisms are posited to also impact VOCs (Insam and Seewald, Reference Insam and Seewald2010) and may involve similar oxidants as in the atmosphere (i.e. NO, •OH) that could proceed both in the presence of light near the surface and in the dark subsurface (Fig. 1). Soil reactive oxygen species (ROS) are produced via Fenton or Fenton-like reactions that are abiotically catalysed by minerals including clays and iron oxides even at modest concentrations (Yu et al., Reference Yu, Chi, Teng, Dong, Kappler, Gillings, Polizzotto, Liu and Zhu2019) or are biologically initiated via microbial production of oxidants (e.g. •OH, •O2−, H2O2) (Diaz et al., Reference Diaz, Hansel, Voelker, Mendes, Andeer and Zhang2013; Bond et al., Reference Bond, Hansel and Voelker2020; Yu and Kuzyakov, Reference Yu and Kuzyakov2021). These processes result in elevated ROS concentrations in soil (e.g. •OH levels of one to tens of ppm; Diaz et al., Reference Diaz, Hansel, Voelker, Mendes, Andeer and Zhang2013; Page et al., Reference Page, Kling, Sander, Harrold, Logan, McNeill and Cory2013) that greatly exceed typical levels in the atmosphere (e.g. 0.03 ppt •OH; Albrecht et al., Reference Albrecht, Novelli, Hofzumahaus, Kang, Baker, Mentel, Wahner and Fuchs2019). Microbial denitrification and nitrification pathways produce NO as an intermediate (Morley et al., Reference Morley, Baggs, Dörsch and Bakken2008) that likewise builds to elevated concentrations in soil (hundreds to thousands of ppb; Rudolph et al., Reference Rudolph, Rothfuss and Conrad1996; McDonald et al., Reference McDonald, Lewis, DeLaune, Hux, Boutton and Gentry2023) compared to the atmosphere even under so-called high-NO atmospheric conditions (tens to hundreds of ppt; Newland et al., Reference Newland2021; Langford et al., Reference Langford2022), consistent with observations of net NO emissions from the soil to the atmosphere (Pilegaard, Reference Pilegaard2013; Weng et al., Reference Weng, Lin, Martin, Millet, Jaeglé, Ridley, Keller, Li, Du and Meng2020). Already, chemical oxidation in soil is known to contribute to plant and soil organic matter degradation and soil CO2 fluxes (Du et al., Reference Du, Chen, Yu, Polizzotto, Sun and Kuzyakov2020; Yu and Kuzyakov, Reference Yu and Kuzyakov2021; Ke et al., Reference Ke, Kang, Avery, Zhang, Yu, Xie and Duan2022), suggesting that a gas-phase organic compound like isoprene may also be susceptible to chemical degradation. Taken together, via the production of biotic- and abiotic-derived oxidative gases, soil has the potential to facilitate isoprene oxidation as a chemical degradation process alongside microbial degradation.
Soil pores can harbour a mini-atmosphere that promotes isoprene oxidation via abiotic and biotic mechanisms. Soil is a complex matrix that contains microorganisms and mineral complexes, that together and individually, can generate reactive oxygen species–•OH, NO, and •HO2 (red ellipses)–central to isoprene chemical degradation. The bacteria that reside on the surface of soil aggregates also degrade isoprene and may compete for isoprene as a substrate. Here, we present a simplified overview of soil chemical isoprene oxidation including notable first-generation products from previously described low-NO (purple labels: 3-methyl furan, isoprene epoxydiol (IEPOX), isoprene hydroxy hydroperoxides (ISOPOOH)), high-NO (orange labels: methyl vinyl ketone (MVK), methacrolein (MACR)) and •OH (blue label: isoprene hydroxy peroxy radicals (ISOPOO)) and selected second-generation products (grey labels) alongside recently revised microbial degradation pathways (green labels) (Wennberg et al., Reference Wennberg2018; Dawson et al., Reference Dawson, Rix, Crombie and Murrell2022). Masses detected in this study (yellow highlighted boxes) are associated with the tentative identities of shown known oxidation products (details in Table S1). These chemical and biological processes modulate the fate of isoprene released from a volatile organic compound (VOC) doser (bottom cylinder) – representing an artificial root – as they diffuse through the soil, for example to a measurement point such as a gas sampling probe (top cylinder). The experimental details underlying this conceptual schematic are presented in Fig. 2.

Constraining simultaneous biological and chemical isoprene degradation processes in soil is a technical challenge. Headspace measurements inform much of our understanding of soil–atmosphere exchange processes but may not adequately reflect soil pore conditions. For example, the widespread use of VOC-free sweep air in VOC analysis can lead to emission biases (Honeker et al., Reference Honeker, Graves, Tfaily, Krechmer and Meredith2021). Soil sterilisation methods to isolate biotic from abiotic processes (e.g. via autoclaving, irradiation and fumigation; Cleveland and Yavitt, Reference Cleveland and Yavitt1998; Li et al., Reference Li2019) may alter VOC fluxes in soil by lysing microorganisms, destabilising soil aggregates (Berns et al., Reference Berns, Philipp, Narres, Burauel, Vereecken and Tappe2008) and eliminating microbially produced oxidants. Soil gas measurements using diffusive probes connected to trace gas analysers can reveal a more non-destructive view of in situ soil gas concentrations with cm-scale spatial resolution (Roscioli et al., Reference Roscioli, Meredith, Shorter, Gil-Loaiza and Volkmann2021; Gil-Loaiza et al., Reference Gil-Loaiza, Roscioli, Shorter, Volkmann, Ng, Krechmer and Meredith2022). Mass spectrometers that quantify a diverse range of VOCs (e.g. proton transfer reaction time-of-flight mass spectrometers; PTR-TOF-MSs) have been central to building an understanding of the vast chemical diversity of the atmosphere, including tracking isoprene and its derivatives to examine different oxidation pathways (Li et al., Reference Li2020), and may likewise be useful for identifying the volatile intermediates of biological pathways like isoprene degradation (Kim et al., Reference Kim, Goldstein, Chakraborty, Jardine, Weber, Sorensen, Wang, Faybishenko, Misztal and Brodie2021; Dawson et al., Reference Dawson, Rix, Crombie and Murrell2022; Meredith and Tfaily, Reference Meredith and Tfaily2022; Vettikkat et al., Reference Vettikkat2023). These approaches provide a means to investigate the spatial and temporal dynamics of biological and chemical pathways for isoprene degradation in soil.
The goal of this study was to determine the roles of biological and chemical degradation of dynamic subsurface isoprene inputs to soil. Using constructed column experiments containing soil or silica sand as an abiotic control, we quantified the response of isoprene and its gas-phase degradation derivatives in the subsurface to repeated additions of isoprene through an artificial root by measurements through in situ diffusive gas probes connected to an online PTR-TOF-MS. We expected that temporal and spatial trends in subsurface isoprene and its derivatives would reveal the relative contributions of biological and chemical pathways to its degradation in soil through comparison to abiotic and diffusive controls. We hypothesised that isoprene availability would stimulate growth of isoprene-degrading microbes (as revealed by 16S rDNA amplicon sequencing) and increase their abundance and marker genes (as revealed by isoA quantitative PCR). Here, our results reveal a role for both biological and chemical degradation of isoprene in soil, and that isoprene priming stimulates biological degradation to outcompete chemical degradation with a lasting effect. This study demonstrates the relevance of the chemical degradation of isoprene in soil and helps paint a more dynamic picture of gas-phase biotic and abiotic interactions belowground.
Methods
As an experimental overview (see also Table S2 and Fig. 2), we constructed seven soil columns containing either soil (n = 6 columns) or silica as an abiotic control (n = 1 column). Each column contained a subsurface isoprene addition point (doser; n = 1 per column) at 22.5 cm depth that was bracketed by VOC sampling points (probes; n = 2 per column) buried 12.5 cm above and below the doser. The soil columns were split into two sets of triplicate columns (set 1 and set 2) that differed only by the dates that they began receiving isoprene additions (3 weeks apart) to evaluate the reproducibility of our observations. We performed two rounds of dosing (4 days of dosing on followed by 4 days of dosing off for each round) to each column set by adding a gas stream with elevated concentrations of isoprene and carbon tetrachloride (CCl4), where CCl4 served as a conserved tracer for the added gas mixture. We quantified isoprene, CCl4 and potential isoprene degradation products by sequentially sampling each diffusive soil gas probe every 1.5 h using an online PTR-TOF-MS. We collected soil before and after the dosing period in soil column set 1 to determine whether the abundance of specific microbial taxa (16S rDNA amplicon sequencing) or isoprene degradation potential (isoA gene copy numbers) shifted in response to isoprene exposure. Overall, this column-dosing approach emulated a subsurface point source of isoprene and measured the resulting variations in the concentrations of isoprene and its degradation products as a function of distance from the source, which contrasted significantly from traditional mesocosm enrichment studies with uniform concentration treatments and typically smaller sizes. We compared temporal patterns in the silica column (chemistry only) to the soil columns (chemistry and biology) to infer relative contributions of chemical versus biological processes, whether either changed over time and whether ‘memory’ of increases in biological uptake persisted over no-dosing periods.
Soil column system for monitoring belowground isoprene. (a) Cross-section of an individual soil column highlighting the location of volatile organic compound (VOC) dosers, probes and sensors. Soil core sampling depths indicated by horizontal dashed lines. (b) Overview of gas sampling system for column set 1, set 2 and abiotic silica control used to track real-time shifts in isoprene degradation via soil gas probe measurements using a proton transfer reaction time-of-flight mass spectrometer (PTR-TOF-MS). A detailed flow diagram is given in Fig. S1. CCl4 = carbon tetrachloride; FEP = fluorinated ethylene propylene ; PFA = perfluoro alkoxy; PTFE = polytetrafluoroethylene; VICI = Valco Instruments Company Inc valve.

Experimental design
We constructed soil columns for subsurface isoprene dosing and in situ measurements (Fig. 2). Nine polyvinyl chloride (PVC) columns (1 m height, 0.25 m diameter) were lined with inert polytetrafluoroethylene (PTFE) film to prevent column VOC contamination. We placed a foundational rock layer (KolorScape drainage rock, Atlanta, GA, USA) at the bottom of the liner to allow moisture to escape through a perforated plate glued to the base of the columns. Six columns were each filled with ~70 kg of commercial garden potting soil (generic peat-soil mix). To maintain consistent soil structure across columns and over the depth, every 15 cm of soil filled was evenly compacted until the column was filled to approximately 80 cm. During filling, one custom VOC doser (22.5 cm depth) and two sampling probes (15 and 30 cm depths) were installed to emit (dose) and measure VOCs (Fig. 2), respectively. To distinguish the effect of soil from abiotic factors, one additional column was filled with a dry silica matrix (Granusil 4095, high-purity industrial quartz; Covia Corporation, Emmett, ID, USA; see Gil-Loaiza et al. (Reference Gil-Loaiza, Roscioli, Shorter, Volkmann, Ng, Krechmer and Meredith2022) for details) as an abiotic control. Although the silica matrix was not sterilised, the dry mineral surface should support negligible microbial activity compared to soil and this approach avoided VOC off-gassing from soil sterilisation (Jiao et al., Reference Jiao, Kramshøj, Davie-Martin, Albers and Rinnan2023). Dosers (65 mm length, 12.7 mm outer diameter, 9.5 mm inner diameter, 15 mm cap thickness) and probes (155 mm length, 12.7 mm outer diameter, 15 mm cap thickness) consisted of closed cylinders made of sintered PTFE with a 10 μm pore size (Berghof GmbH, Eningen, Germany) (Roscioli et al., Reference Roscioli, Meredith, Shorter, Gil-Loaiza and Volkmann2021; Gil-Loaiza et al., Reference Gil-Loaiza, Roscioli, Shorter, Volkmann, Ng, Krechmer and Meredith2022). Dosers and probes were assembled with two inlets that were attached to ⅛ inch perfluoro alkoxy tubing. The dosing gas mixture was supplied from a custom-made tank with isoprene and CCl4 each at 800 parts per million by volume (ppmv) in ultra-high purity nitrogen gas (N2). We selected this concentration to detect elevated isoprene from the probes at a distance of ~12.5 cm from the doser based on initial trials and the assumption that concentrations at the source interface (i.e. root, litter, pollution) may be high. The flow of the dosing gas (40 standard cubic centimeters per minute (sccm)) was controlled by a mass flow controller (MFC) (Alicat Scientific, Inc., Tucson, AZ, USA) split into a uniform flow for each column by a manifold of critical orifice, and released out of the dosing probes.
The isoprene dosing experiment occurred over a span of 39 days (31 May 2022 to 9 July 2022) and involved two sets of soil columns (set 1 and set 2) and the abiotic silica control (Table S2). First, soil column set 1 and the silica column were dosed with the isoprene:CCl4 mixture at a flow rate of 40 sccm (1.42 μmol min–1 isoprene, equivalent to 0.03 μmol day–1 g(soil)–1 isoprene, an addition rate that could be achieved from just ~20 g (dw) of high-isoprene emitting roots; see Introduction) in two ~4 day long dosing cycles separated by a ~4 day no-dosing period for a total addition of ~16 mmol each of isoprene and CCl4, and ~98 mmol total carbon to each column over the entire experiment. These rates of CCl4 addition were expected to be four orders of magnitude higher than weak CCl4 uptake by soil (Mendoza et al., Reference Mendoza, Goodwin and Happell2011), allowing CCl4 to serve as a tracer. To determine if the observed changes in isoprene response were reproducible, we repeated the same dosing sequence on soil column set 2 and the silica columns as a temporal control.
Soil moisture and temperature sensors fitted with a custom (QuantAQ, Somerville, MA, USA) three-dimensional-printed housing of Clear Resin V3 (FormLabs, Boston, MA, USA) were installed at depths of 15 and 30 cm to measure volumetric water content and temperature at these depths in each column. Sensors operated in real time and sent data to a cloud server. All cables were wrapped in fluorinated ethylene propylene (FEP) film to limit VOC contamination from the lines.
VOC sampling using a PTR-TOF-MS
A custom system was assembled (Figs 2 and S1) to sample soil gas using diffusive probes with one inlet line and an outlet line connected to a ‘T’ (Roscioli et al., Reference Roscioli, Meredith, Shorter, Gil-Loaiza and Volkmann2021; Gil-Loaiza et al., Reference Gil-Loaiza, Roscioli, Shorter, Volkmann, Ng, Krechmer and Meredith2022). Equilibrated probe gas was sampled via the diffusive gas probes using multiport sample selection valves (VICI Valco Instruments Inc., Houston, TX, USA) that directed the sample from one probe at a time to proton-transfer-reaction time-of-flight mass spectrometry PTR-TOF-MS (Vocus; Aerodyne Research Inc., Billerica, MA, USA) for simultaneous quantification of isoprene, CCl4 and potential isoprene oxidation products. Each probe was measured every 1.5 h. Controlled zero air flow (10 sccm) managed by a mass flow controller (MFC) from a tank was first sent to move the equilibrated soil gas sample out of the probe body, past the outlet ‘T’ connection, after which inlet flow ceased and a second carrier stream of zero air was delivered via a second MFC (100 sccm) through the ‘T’ connection to send the plug of soil gas to the Vocus for analysis (Fig. S1). In all cases, the flow was balanced by a third MFC directly before the Vocus inlet to ensure no advective flow was driven across the gas probe. The plug measurement approach minimises the amount of zero air flowing through probes, which could disrupt soil gas concentrations.
A Vocus PTR-TOF-MS (Krechmer et al., Reference Krechmer2018) was used to analyse the abundance of isoprene, isoprene oxidation products and CCl4 in the soil gas recovered via the soil probes. Two separate instruments were used throughout the experiment due to instrument availability. Set 1 columns were measured using a Vocus with a 1.2 m flight tube corresponding to a resolving power of 10,000 m/Δm, while set 2 was measured with a Vocus with a 0.6 m flight tube and resolving power of 5,000 m/Δm. Data were acquired at a time resolution of 1 Hz. Instrument blanks were run for 1 min approximately every 5 min across the duration of the experiment by overflowing the PTR-TOF-MS inlet with zero air. Data gaps in the first dosing period exist around experiment day 8 due to a software error and day 18 due to an empty zero air tank, while gaps in the second dosing period were a result of swapping PTR-TOF-MS instruments.
The Vocus response to isoprene was quantitatively calibrated using injections of a known prepared standard mix (Apel-Riemer Environmental Inc., Miami, FL, USA) on both instruments. The cylinder contained 14 standards that enabled explicit calibrations to those standards. Isoprene was one of them; CCl4 was not. Chemicals such as CCl4 that were not in the standard cylinder were left uncalibrated in arbitrary units (A.U.) that still reveal quantitative relative differences in their observation over space and time. Calibrations occurred on an automated cycle approximately every 1.5 h.
VOC data analysis
To quantify VOCs in each gas sample (both for isoprene concentrations and A.U. units for all other compounds), we integrated the 1 Hz PTR-TOF-MS observations from t = 2 s to t = 30 s to capture the subsurface gas ‘plug’ that was transported to the analyser. This approach assumed that the arrival time of a compound within a soil gas sample to the instrument resembled a Gaussian distribution, so we treated the signals analogous to a chromatographic peak and integrated the area under the curve to determine the quantity of chemical signal for each probe measurement. Using this approach, we obtained subsurface VOC measurements every 1.5 h from each measurement location.
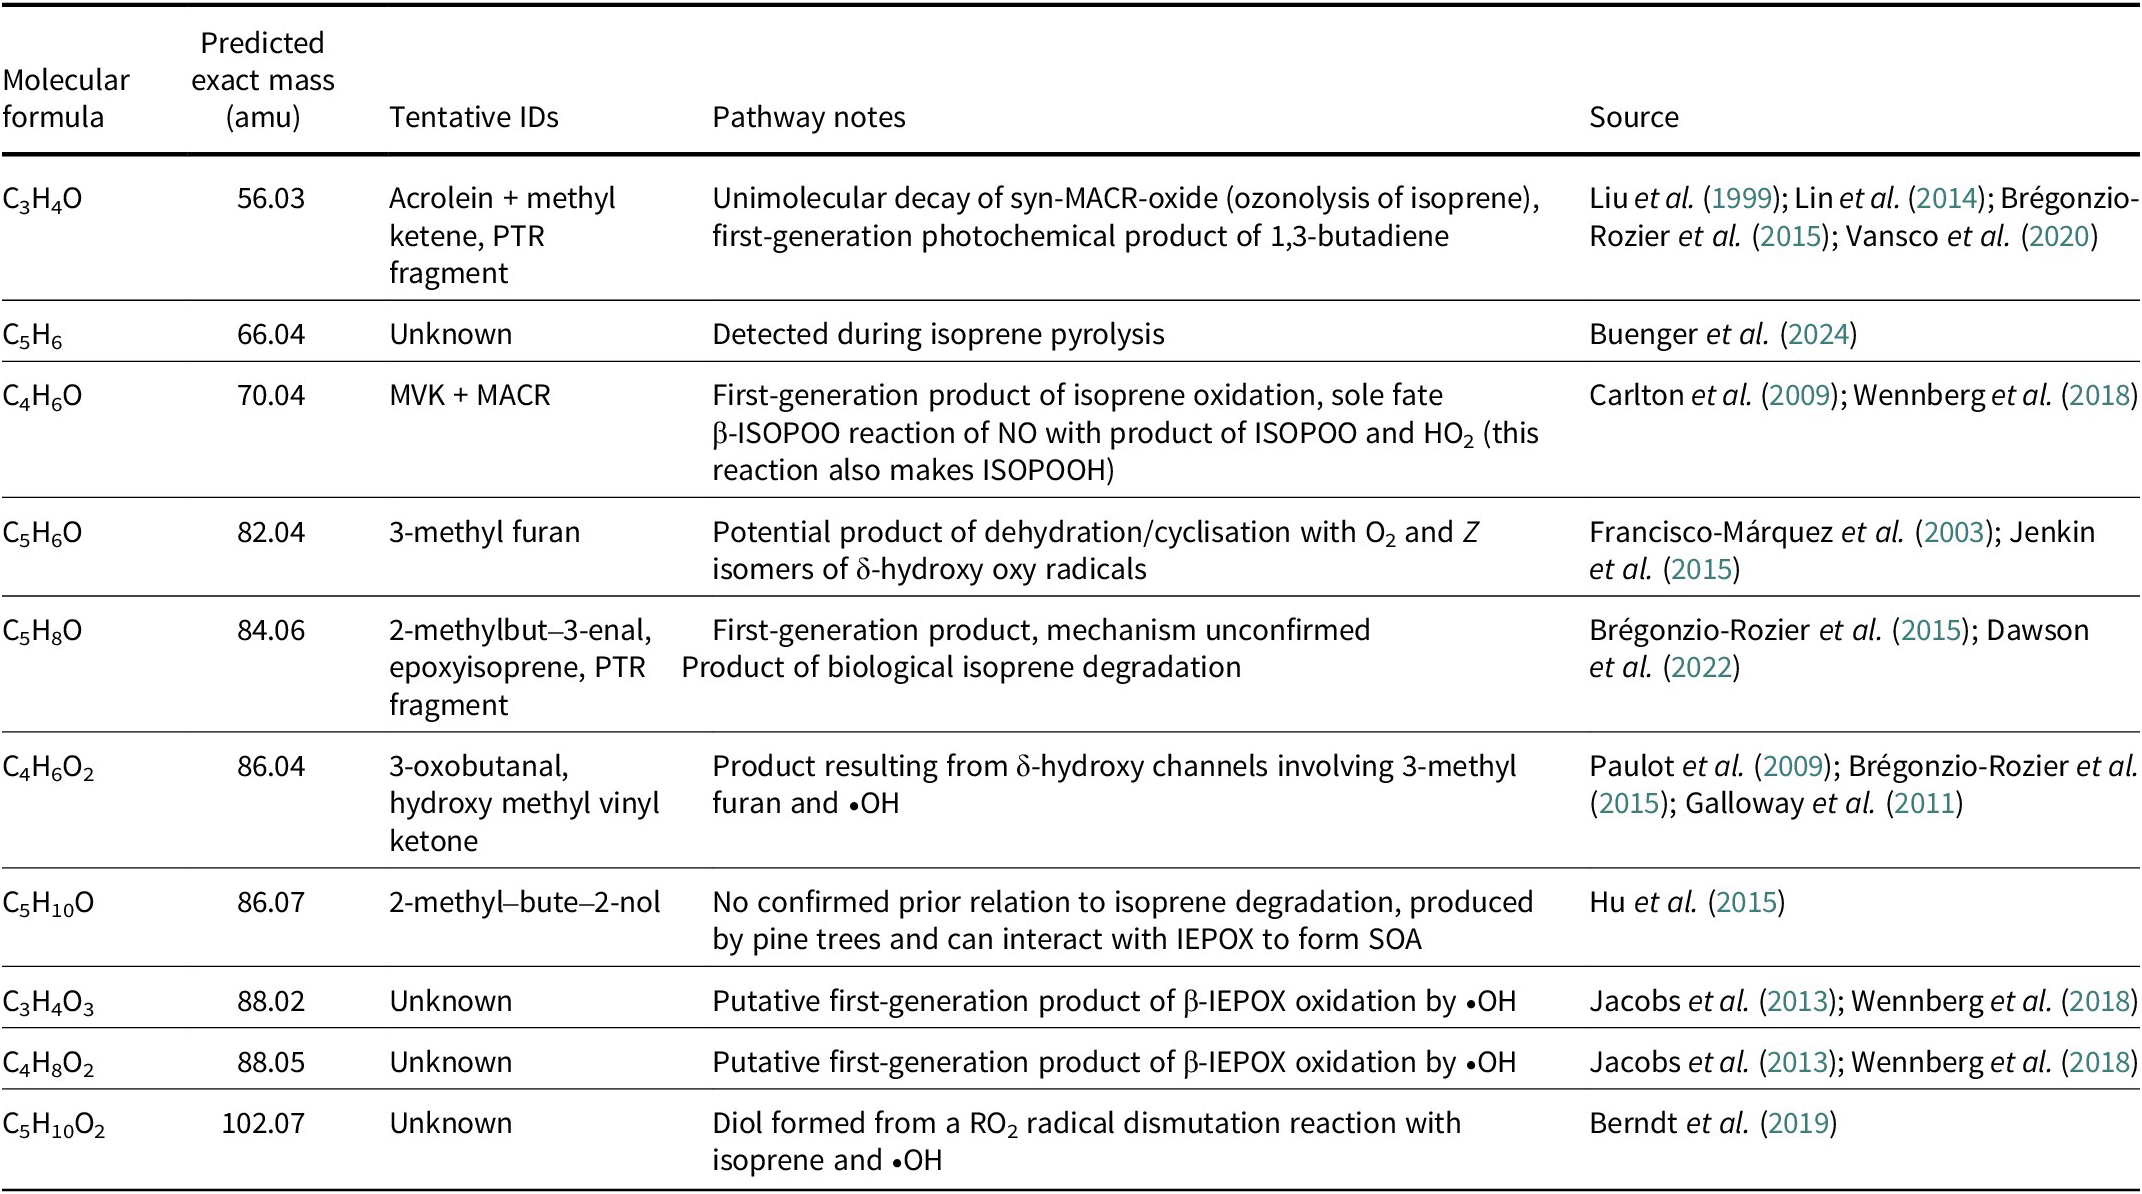
To identify potential isoprene degradation products from the set of observed masses, we first performed a low-resolution binning time-series data analysis using the py-tofspec python package (Palmo, 2023 v. 0.2.1; https://meredith-lab.github.io/py-tofspec/). We focused on masses for putative oxidation products based on gas-phase terpene oxidation products detected using a Vocus by Li et al. (Reference Li2020) that were primarily C4 and C5 compounds (Wennberg et al., Reference Wennberg2018) generated by •OH- and O3-initiated reactions. We evaluated the time series of these mass-to-charge signals and retained only those (n = 9) that showed temporal trends similar to isoprene. We generated high-resolution time-series (HRT) of select compounds using the Tofware (Aerodyne Research, Inc., Billerica, MA, USA and TOFWERK, Thun, Switzerland) software package within Igor Pro 9 (WaveMetrics, Portland, OR, USA) for all results presented here. Tofware performed mass calibration, baseline subtraction and assigned molecular formulas to detected ions. We assigned tentative identities (IDs) and putative pathways for each observed compound (Table S1). While signals were detected as their proton adduct (+H) they are discussed in the text as their native (unprotonated) elemental formula.
To visualise quantitative differences in peak behaviour of isoprene and derivatives, we empirically fit the data to two analytical models that reflect the peak following the first dosing (Ricker model) and its subsequent rate of decay (exponential model) (Crocker et al., Reference Crocker, Guo, U’Ren, Pugliese, Ladd, Werner and Meredith2025). We fit a general Ricker function (see Eqn 1) to HRT data for each compound and measurement point over the first dosing period (n = 30–85). Ricker functions are commonly used to model population dynamics over time and have been used successfully to model soil VOC time series (Crocker et al., Reference Crocker, Guo, U’Ren, Pugliese, Ladd, Werner and Meredith2025). To compare decay rates of compounds between soil and silica following the peak (~15 h after dosing) across 2 days (n = 24–76), we first accounted for differences in gas diffusion by normalising each VOC response to the corresponding CCl4 signal; these ratios were log-transformed and the slope of linear fits was used as a proxy for decay rate. To estimate the relative yield of putative isoprene derivatives, we compared the ratio of each compound’s peak response to that of isoprene in silica (assuming most isoprene is unreacted in silica) to the ratio of observed PTR proton affinities related to each mass (Table 2) using Equation 2. All analyses were performed in R version 4.1.2. Significant differences presented were determined using a student’s t-test and p < 0.05.
 $$ {R}_{VOC\hskip0.24em \left(t+1\right)}=a\cdot {R}_{VOC\hskip0.24em (t)}\cdot {e}^{-b\cdot {R}_{VOC\;(t)}}+\mathrm{c} $$
 $$ {Y}_{VOC}=\frac{{\mathrm{P}\mathrm{eak}}_{VOC\hskip0.24em \left( Soil\ \ or\ \ silica\right)}}{\mathrm{P}{eak}_{Isoprene\hskip0.24em (Silica)}}\times \frac{\mathrm{P}\mathrm{roton}\hskip0.32em {\mathrm{Affinity}}_{Isoprene}\;}{{\mathrm{P}\mathrm{roton}\ \mathrm{Affinity}}_{VOC}}\times 100\% $$
Soil core extraction, preservation and nucleic acid extraction
To analyse shifts in the soil microbiome and gene copy number of isoA before and after isoprene exposure, duplicate 23 cm soil cores were taken from depth ranges of 0–10 cm and 10–23 cm from each of the triplicate columns in set 1 before the first dosing (day 5, T0) and 24 days later following the isoprene dosing (day 29, T1). Duplicate samples were retained separately and not homogenised by depth ranges. These samples were allocated for DNA extraction for 16S rRNA amplicon sequencing (1 g) in sterile bags and DNA/RNA co-extraction (2 g) in LifeGuard Preservation Solution (Qiagen). Soil samples were shipped from Aerodyne Research, Inc. (Billerica, MA, USA) to the Meredith Lab at the University of Arizona (Tucson, AZ, USA) overnight on dry ice and immediately stored at –80°C. DNA and RNA were co-extracted from preserved soil samples from each of the duplicate samples (RNA PowerSoil Total Isolation Kit and RNeasy PowerSoil DNA Elution Kit; Qiagen) according to the manufacturer’s instructions and cleaned to remove potential PCR inhibitors (DNeasy PowerClean Pro Cleanup Kit; Qiagen). DNA was extracted from only one set of the duplicate soil samples (DNeasy PowerSoil HTP 96 Kit; Qiagen) following the manufacturer’s protocol. We evaluated the quality and quantity of all samples using NanoDrop (Thermo-Fisher, Waltham, MA, USA) and a Qubit dsDNA High Sensitivity Assay Kit (Thermo-Fisher), respectively.
16S rRNA gene sequencing
To analyse shifts in microbial community composition and members, we conducted 16S rRNA amplicon sequencing at the PANDA Core for Genomics and Microbiome Research (Tucson, AZ, USA) following library preparation (Laubitz et al., Reference Laubitz2021). The 16S rRNA V4 region was amplified using the 515F-806R primer set, which included Illumina adapter sequences and a Golay barcode placed on the 515F primer (Caporaso et al., Reference Caporaso2012). PCR was performed in 40 uL reactions with a program consisting of initial denaturation at 95°C for 120 s followed by 35 cycles of 95°C for 30 s, 50°C for 30 s and 72°C for 30 s, with a final elongation at 72°C for 300 s. A Quant-iT PicoGreen dsDNA Assay Kit (ThermoFisher, Waltham, MA, USA and Invitrogen Corporation, Carlsbad, CA, USA) with a plate reader was used to quantify the 16S amplicons. DNA was then pooled into equal amounts and cleaned with an UltraClean PCR Clean-Up Kit (MoBio Laboratories, Carlsbad, CA, USA). Pooled amplicons were denatured as well as diluted with NaOH (0.1 M). Then 6.75 mol of each sample was sent to be sequenced on a MiSeq Illumina platform using 600 cycle MiSeq Reagent kit v3 (Illumina, Inc., San Diego, CA, USA) for 2 × 300 bp paired-end sequencing. The software package Quantitative Insights into Microbial Ecology 2 (QIIME2) version 2019.10 was used to demultiplex raw reads (Bolyen et al., Reference Bolyen2019). Within the QIIME2 platform, Divisive Amplicon Denoising Algorithm 2 was used to filter and trim reads, as well as merge paired ends to identify amplicon sequence variants (ASVs) (Callahan et al., Reference Callahan, McMurdie, Rosen, Han, Johnson and Holmes2016). The Greengenes 16S database was used to train a Naïve Bayes classifier to assign taxonomic classes to ASVs (DeSantis et al., Reference DeSantis, Hugenholtz, Keller, Brodie, Larsen, Piceno, Phan and Andersen2006). Finally, ASV tables were imported into R (version 4.1.2) for statistical analyses using the DESeq2 package (Love et al., Reference Love, Huber and Anders2014). ASVs with significant differences in the log2-fold change (p value < 0.05) were visualised by family and phylum and labelled with an ASV ID linked to a National Center for Biotechnology Information (NCBI) sequence ID (Table S6), with families with known hydrocarbon or isoprene-degraders noted (Gray et al., Reference Gray, Helmig and Fierer2015; Murphy Reference Murphy2017; Larke-Mejía et al., Reference Larke-Mejía, Crombie, Pratscher, McGenity and Murrell2019).
Quantification of isoA copy number
We performed quantitative PCR of isoA (MetaCyc Pathway 7777) to quantify and assess the change in the number of isoprene degrading bacteria before (T0) and after (T1) the isoprene dosing regimen on DNA extracts. A 20 μL reaction containing 0.4 μM of isoA14F and isoA511R primers (all primers are summarised in Table S4) (Carrión et al., Reference Carrión, Larke-Mejía, Gibson, Farhan Ul Haque, Ramiro-García, McGenity and Murrell2018), 20 ng of template DNA and 10 μL of the SensiFast SYBR Hi-ROX kit (Bioline, London, UK) underwent qPCR using the following program as described previously (Carrión et al., Reference Carrión, Larke-Mejía, Gibson, Farhan Ul Haque, Ramiro-García, McGenity and Murrell2018): 3 min 98°C denaturation step and 40 cycles of 95°C for 20 s, 60°C for 20 s and 72°C for 30 s. qPCR primers were selected for their ability to quantify isoA copy number from diverse sequences and sample types (Larke-Mejía et al., Reference Larke-Mejía, Crombie, Pratscher, McGenity and Murrell2019). All data were recorded at 88°C as described to reduce the amount of primer dimers quantified.
A melt curve from 60 to 95°C was performed after 40 cycles in 0.3°C increments to determine the specificity of the reaction. The reaction was performed in tandem with a 10-fold dilution series of isolated and purified isoA samples (108–102 copies per μL) to obtain the copy number standard curve for the isoA gene. To generate an isoA qPCR standard curve, the complete isoA gene (1545 bp) was isolated from the genomic DNA of Rhodococcus sp. AD45 via PCR purification of isoA amplicons generated as follows: 50 μL PCR reaction contained 0.4 μM of the primer-pair isoAF (5′-ATGCAATGGAAGGCGCAG-3′) and isoAR (5′-CTAGATCGAGATCTTTTCCTGTGC-3′), 25 ng of template DNA and 0.5 μg/μL bovine serum albumin (BSA). The PCR program consisted of an initial denaturation step of 98°C for 30 s and 37 cycles of 98°C for 15 s, 61°C for 45 s, 72°C for 45 s and a final extension step of 7 min. Primers to amplify the complete isoA gene were designed for this study using Primer3 and BLAST based on the isoA gene of Rhodococcus sp. AD45 deposited under the NCBI accession number AJ249207. The final product was purified using a Qiaquick PCR Purification Kit (Qiagen) as described by the manufacturer.
Results
Subsurface isoprene uptake adapts to isoprene additions and increases over time
We monitored spatial and temporal patterns in subsurface concentrations of isoprene and CCl4 in response to their repeated dosing in columns containing soil or silica. The initial belowground addition of isoprene and CCl4 caused rapid increases in subsurface isoprene concentrations in both silica and soil columns (Fig. 3a). In silica, maximum isoprene concentrations (measured in parts per billion per volume (ppbv)) during the initial dosing period were two- to four-fold higher than in soil (~450 ppbv vs ~100–200 ppbv). While isoprene concentrations remained largely consistent in silica columns over the first dosing period (experiment days 6–10), isoprene levels in soil rapidly decayed over 2 days to near pre-dosing levels, despite the continued addition of isoprene gas during this time. The CCl4 tracer levels persisted over this dosing period in both soil and silica columns (Figs 3a and 4b). After dosing ceased (experiment days 10–14), CCl4 levels declined in all columns and isoprene concentrations declined in the silica columns to near pre-dosing levels. These patterns were consistent within each column type and were not consistently higher or lower based on the depth of the probes that were equidistant from the doser. A second round of isoprene and CCl4 dosing (experiment days 14–18) again increased in CCl4 in soil columns but no isoprene was detected by any soil probe over the dosing period. In contrast, the silica response in both isoprene and CCl4 was qualitatively similar to the first dosing period. To ensure this time-dependent response to isoprene dosing in soil was reproducible, we repeated the dosing sequence in a second set of columns (set 2). We observed identical responses in behaviour in set 2 (Figs 3b and S2) to that of the first set of columns (set 1) to their individual first and second dosing exposures, specifically that the first dose resulted in a multi-day peak that eventually declines to near zero, while the second dose only produced a transient peak (<1 day) or no peak at all. During this experiment, the mean soil volumetric water content and temperature from column 1 and column 2 (column 3 sensors malfunctioned) was 11.4 ± 2.3% and 26.9 ± 1.5°C (error = SD, ranged from 25 to 32°C), respectively, in this relatively stable indoor environment.
Belowground isoprene additions were only transiently detected in soil but consistently increased isoprene in silica sand and the carbon tetrachloride (CCl4) tracer in all columns. (a) Four-day dosing periods (purple shading, 22.5 cm depth) of isoprene and the CCl4 tracer to column set 1 resulted in (top panel) increases in detected CCl4 in all columns (column 1 (black), column 2 (blue), column 3 (red)) and depths (15 cm dashed lines, 30 cm solid lines) plotted as a function of experiment day. Isoprene is reported in parts per billion by volume (ppbv) while CCl4 is reported in PTR-TOF-MS arbitrary units (A.U.) as we lacked a calibration standard. In silica sand (light blue), isoprene enhancements were similar to CCl4, whereas in soil (bottom three panels), isoprene enhancements were short-lived and did not reflect CCl4 enhancements. (b) A reproducible response in soil isoprene to a first and second isoprene dose was observed during separate measurement periods for both set 1 (black and peach, solid) and set 2 (purple and blue, dashed). To overlap the response to each of the four dosing events, isoprene concentrations (averaged over both depths) are plotted versus the days since the onset of the last dosing (see Table S2 for timeline).

Belowground isoprene additions stimulated increases in putative C3–C6 isoprene oxidation products in soil and silica across sampling depth and columns. Uncalibrated levels of the following compounds in soil columns (columns 1–3; black, blue and red) compared with a silica column (light blue) at 15 cm (dashed line) and 30 cm (solid line) during isoprene dosing in set 1: (a) C5H8O, (b) CCl4, (c) C3H4O, (d) C5H7, (e) C4H6O, (f) C5H6O, (g) C5H8O, (h) C4H6O2, (i) C5H10O, (j) C3H4O3, (k) C4H8O2 and (l) C5H11O2. Masses are labelled by the most relevant tentative identity related to isoprene degradation. Line segments connect 12 h data averages. Shaded blue areas indicate periods of isoprene dosing. Coloured borders indicate the tentative isoprene degradation pathway (orange, high NO; purple, low-NO; green, microbial degradation). MACR = methacrolein; MVK = methyl vinyl ketone; PTR = proton transfer reaction.

Potential isoprene oxidation products appeared belowground following isoprene additions
We investigated the high-resolution mass spectral time series to identify potential isoprene oxidation products that also increased on isoprene addition. Nine mass signals (Table 1) showed temporal trends similar to isoprene (Fig. 4a) and had tentative identities that matched known oxidation products. The most prominent oxidation products identified in both soil and silica columns were the combined MVK and MACR signal (70.04 amu) (C4H6O; Fig. 4e) and a mass-to-charge probably related to the degradation product of MACR–C3H4O (Fig. 4c). Masses correlating with prominent isoprene–•OH oxidation products, including C5H10O (Fig. 4i) and C5H10O2 (Fig. 4l) were also identified. The response for the majority of these oxidation compounds increased with isoprene levels and peaked around 24 h after initial exposure regardless of depth or column substrate (soil vs silica). Some of the masses exhibited maximum signals in soil columns up to 30% greater than in silica: C4H6O (MVK + MACR; Fig. 4e), C4H6O2 (unknown; Fig. 4h), C4H8O2 (4-hydroxybutanal; Fig. 4k) and C5H6O (3-methyl furan; Fig. 4f). Given the continuous dosing of isoprene, we predicted that oxidation products would be continually generated and result in stable concentrations over time. This was largely observed in silica but not soil, where the signal of all compounds declined over the first dosing period in tandem with isoprene (Fig. 4). Most products decayed to pre-dosing levels after isoprene dosing ended, with a notable sharp increase in C5H10O (Fig. 4i) signal in soil and silica in between dosing periods. When columns were exposed to a second dose of isoprene, a rise in these oxidation products was again observed in silica columns (Fig. 4a) and CCl4 was observed in both silica and soil (Fig. 4b), but no corresponding response was observed in soil (except C4H6O2; Fig. 4h) where isoprene also failed to increase (Figs 3a and 4a). Oxidation products indicative of O3-induced oxidation were not observed.
Observed putative isoprene degradation products

ID = identity; IEPOX = isoprene epoxydiol; ISOPOO = isoprene hydroxy peroxy radicals; ISOPOOH = isoprene hydroxy hydroperoxides; MACR = methacrolein; MVK = methyl vinyl ketone; PTR = proton transfer reaction; SOA = secondary organic aerosols.
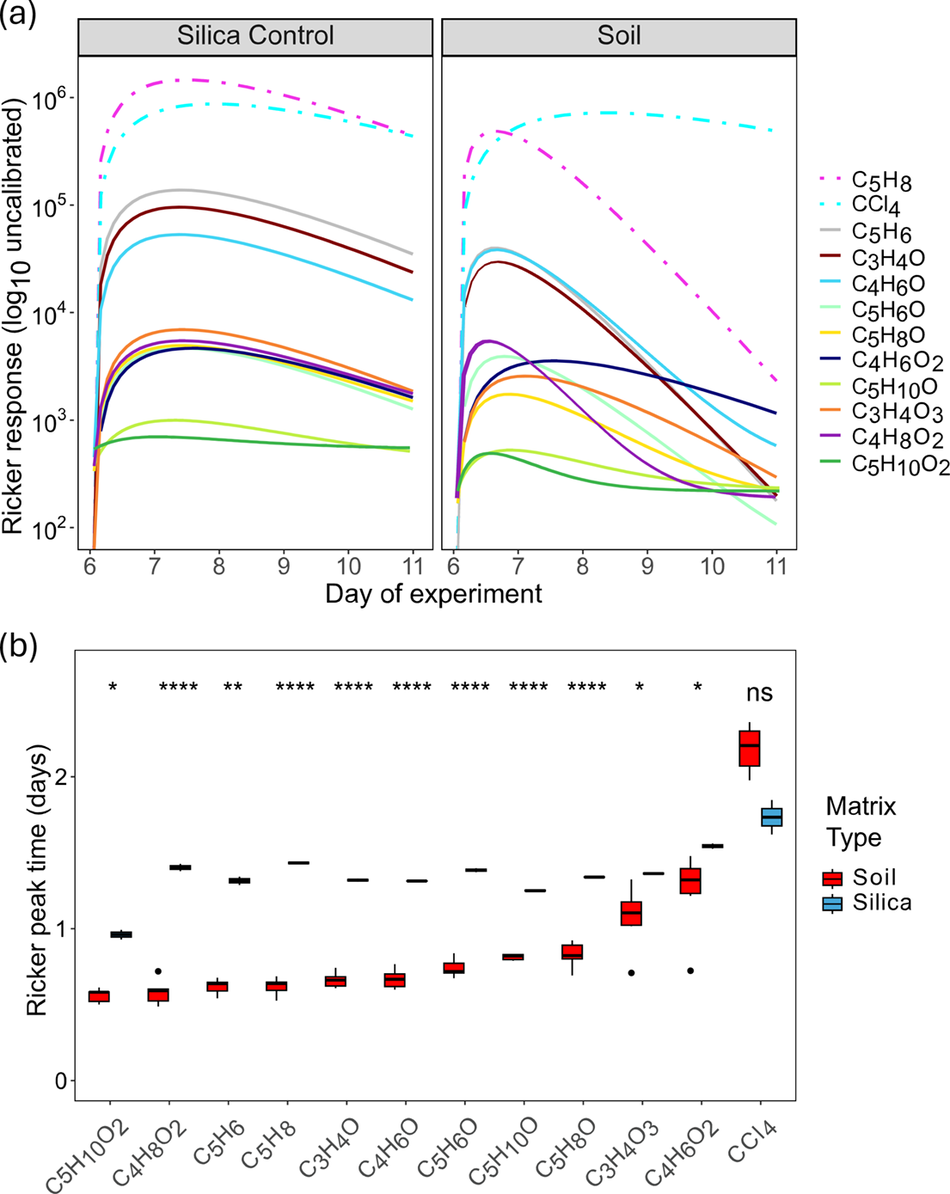
Modelled dynamics of isoprene and related compounds over the initial dosing period. Comparison between modelled proton transfer reaction responses generated using the Ricker function of two example probes in the (a) silica (22 cm) and soil (set 1 column 1, 22 cm) columns over the dosing period. The y axis is in log-scale. The R 2 and root mean standard error for each curve can be found in Table S5. In general all R 2 values for all probes were above 0.6 except for C4H7O2, C5H11O, C5H11O2 masses. (b) Box plot of total silica and soil modelled Ricker peak times, significance levels (p < 0.05 to p < 0.0001) between matrices are highlighted by asterisks with insignificant differences being labelled as not significant (ns).

Isoprene and its degradation products exhibit earlier peaks and faster decay in soil than silica
We used analytical models to compare the temporal behaviour of each compound. Ricker model fits helped reveal a systematic difference in peak behaviour between silica and soil (Fig. 5a), where peaks in silica were broad and slowly declined for all compounds (nearly resembling a plateau) whereas peaks in soil were narrower and declined faster for isoprene and all its potential derivatives (Fig. S4 and Supplemental File S1). Similar patterns were observed in the soil and silica columns in terms of dominant (e.g. C5H6, C3H4O, C4H6O) versus weak (e.g. C5H8O, C5H10O2) signals. Peak shape for the inert CCl4 tracer was similar in both the silica and soil columns, revealing that the difference in the behaviour in soil was isolated to isoprene and isoprene derivatives (with the exception of C4H6O2). These differences were quantitative, as revealed by significant differences between soil and silica in terms of Ricker model peak time (inversely related to peak width) for isoprene and all its derivatives but not for CCl4 (Fig. 5b).
Peak decay rates were further explored by fitting exponential models to the post-peak measurements of each compound (isoprene and its potential derivatives) normalised by the corresponding CCl4 level (Fig. 6a) to account for potential differences in diffusion across columns and soil types that might drive shared temporal variations in isoprene, CCl4 and other gases as seen in the silica column (Fig. 4). Concentrations of isoprene and its derivatives declined significantly faster in soil than silica (Fig. 6b), shifting from average decay rates of 0.17 ± 0.012 standard error (SE) day–1 to 0.27 ± 0.041 (SE) day–1 in silica probes across all compounds to a range in average decay rates of to 0.76 ± 0.073 (SE) day–1 to 1.29 ± 0.061 (SE) day–1 in soil depending on the compound. Isoprene was at the leading edge of decay rates with a mean rate of 1.27 ± 0.059 (SE) day–1 in soil along with C5H6 (a potential PTR fragment of isoprene). This enhancement in decay rates from silica to soil was observed for all oxidation products, including some with soil decay rates nearly as high as isoprene (e.g. dominant first-order oxidation products MVK and MACR; C5H8O) and others that decayed more slowly (e.g. C4H6O2; see also Fig. 5b), although no significant differences were detected.
Soil enhances decay of isoprene and putative oxidation products. (a) Peak normalised decay of isoprene and putative derivatives to end of dosing of respective example probes in the silica (22 cm) and soil (set 1 column 1, 22 cm) columns over the dosing period. (b) Linear slopes recovered from log-transformed transformed data. The R 2 and parameters for each regression line can be found in Table S6. In general all R 2 values for all probes were >0.9 except for C4H7O2, C5H11O and C5H11O2 masses. Significance levels (p < 0.05 to p < 0.0001) between matrices are highlighted by asterisks. CCl4 = carbon tetrachloride; PTR = proton transfer reaction; VOC = volatile organic compound.

Soil influences the yield of oxidation products compared to the abiotic control
To clarify the degree to which that soil modifies the yield of various isoprene oxidation products, we compared trends in the soil:silica ratios. Abundance ratios >1 denoted compounds that were higher in soil whereas ratios <1 indicated those that were more abundant in silica. Before dosing, when the abundances of all of the compounds of interest were low, all soil:silica ratios were <1 (Fig. 7). On the introduction of isoprene, all ratios shifted. Isoprene maintained the lowest soil:silica ratio of all these compounds, and after the initial rapid increase with the first isoprene addition, the ratio continued to drop as isoprene concentrations plummeted in soil (Fig. 7). The initial rise in ratios revealed differences in yields in soil versus silica across the oxidation products. For three compounds, there was a greater abundance in soil relative to silica (soil:silica >1) over the first day of exposure (experiment day 6): C4H6O (MVK + MACR), C4H8O2 (4-hydroxybutanal) and C5H6O (3-methyl furan). We estimated these yield differences (Table 2) using peak signals and proton affinities for each compound in soil and silica against that of isoprene in the inert silica (see Methods). Peak isoprene was significantly lower (~39%) in soil than in silica, while yields of chemical isoprene degradation products were more consistent between soil and silica (less than two-fold change). Higher yields in soil than silica were observed for three compounds C4H6O (MVK + MACR), C4H6O2 (3-oxobutanal) and C4H8O2 (4-hydroxybutanal). Overall, the estimated isoprene degradation products yields represented <6% of maximum isoprene levels and were similar between soil and silica columns. By the end of the first dosing period (experiment day 10), all compounds were more elevated in silica than soil (ratio <1).
Relative soil:silica levels of isoprene and isoprene oxidation products reveal sensitivity to soil versus abiotic processes. The soil:silica concentration response ratio (30 cm depth, 3 h averaging windows) is shown for the first (left) and second (right) isoprene dosing periods in set 1. Ratio values >1 (threshold line) coincide with higher concentrations in the soil matrix compared to silica. Ratios represent a 3 h averaging window across replicated soil columns and a single silica column for the 30 cm depth (n = 20–30). Error ribbons represent 1σ standard deviation across three columns. Shaded blue areas indicate periods of isoprene dosing. PTR = proton transfer reaction.

Estimated yields of isoprene and putative oxidation products in soil and silica for compounds based on available proton affinities for detected masses

Isoprene exposure may have increased the abundance of particular taxa but not isoA
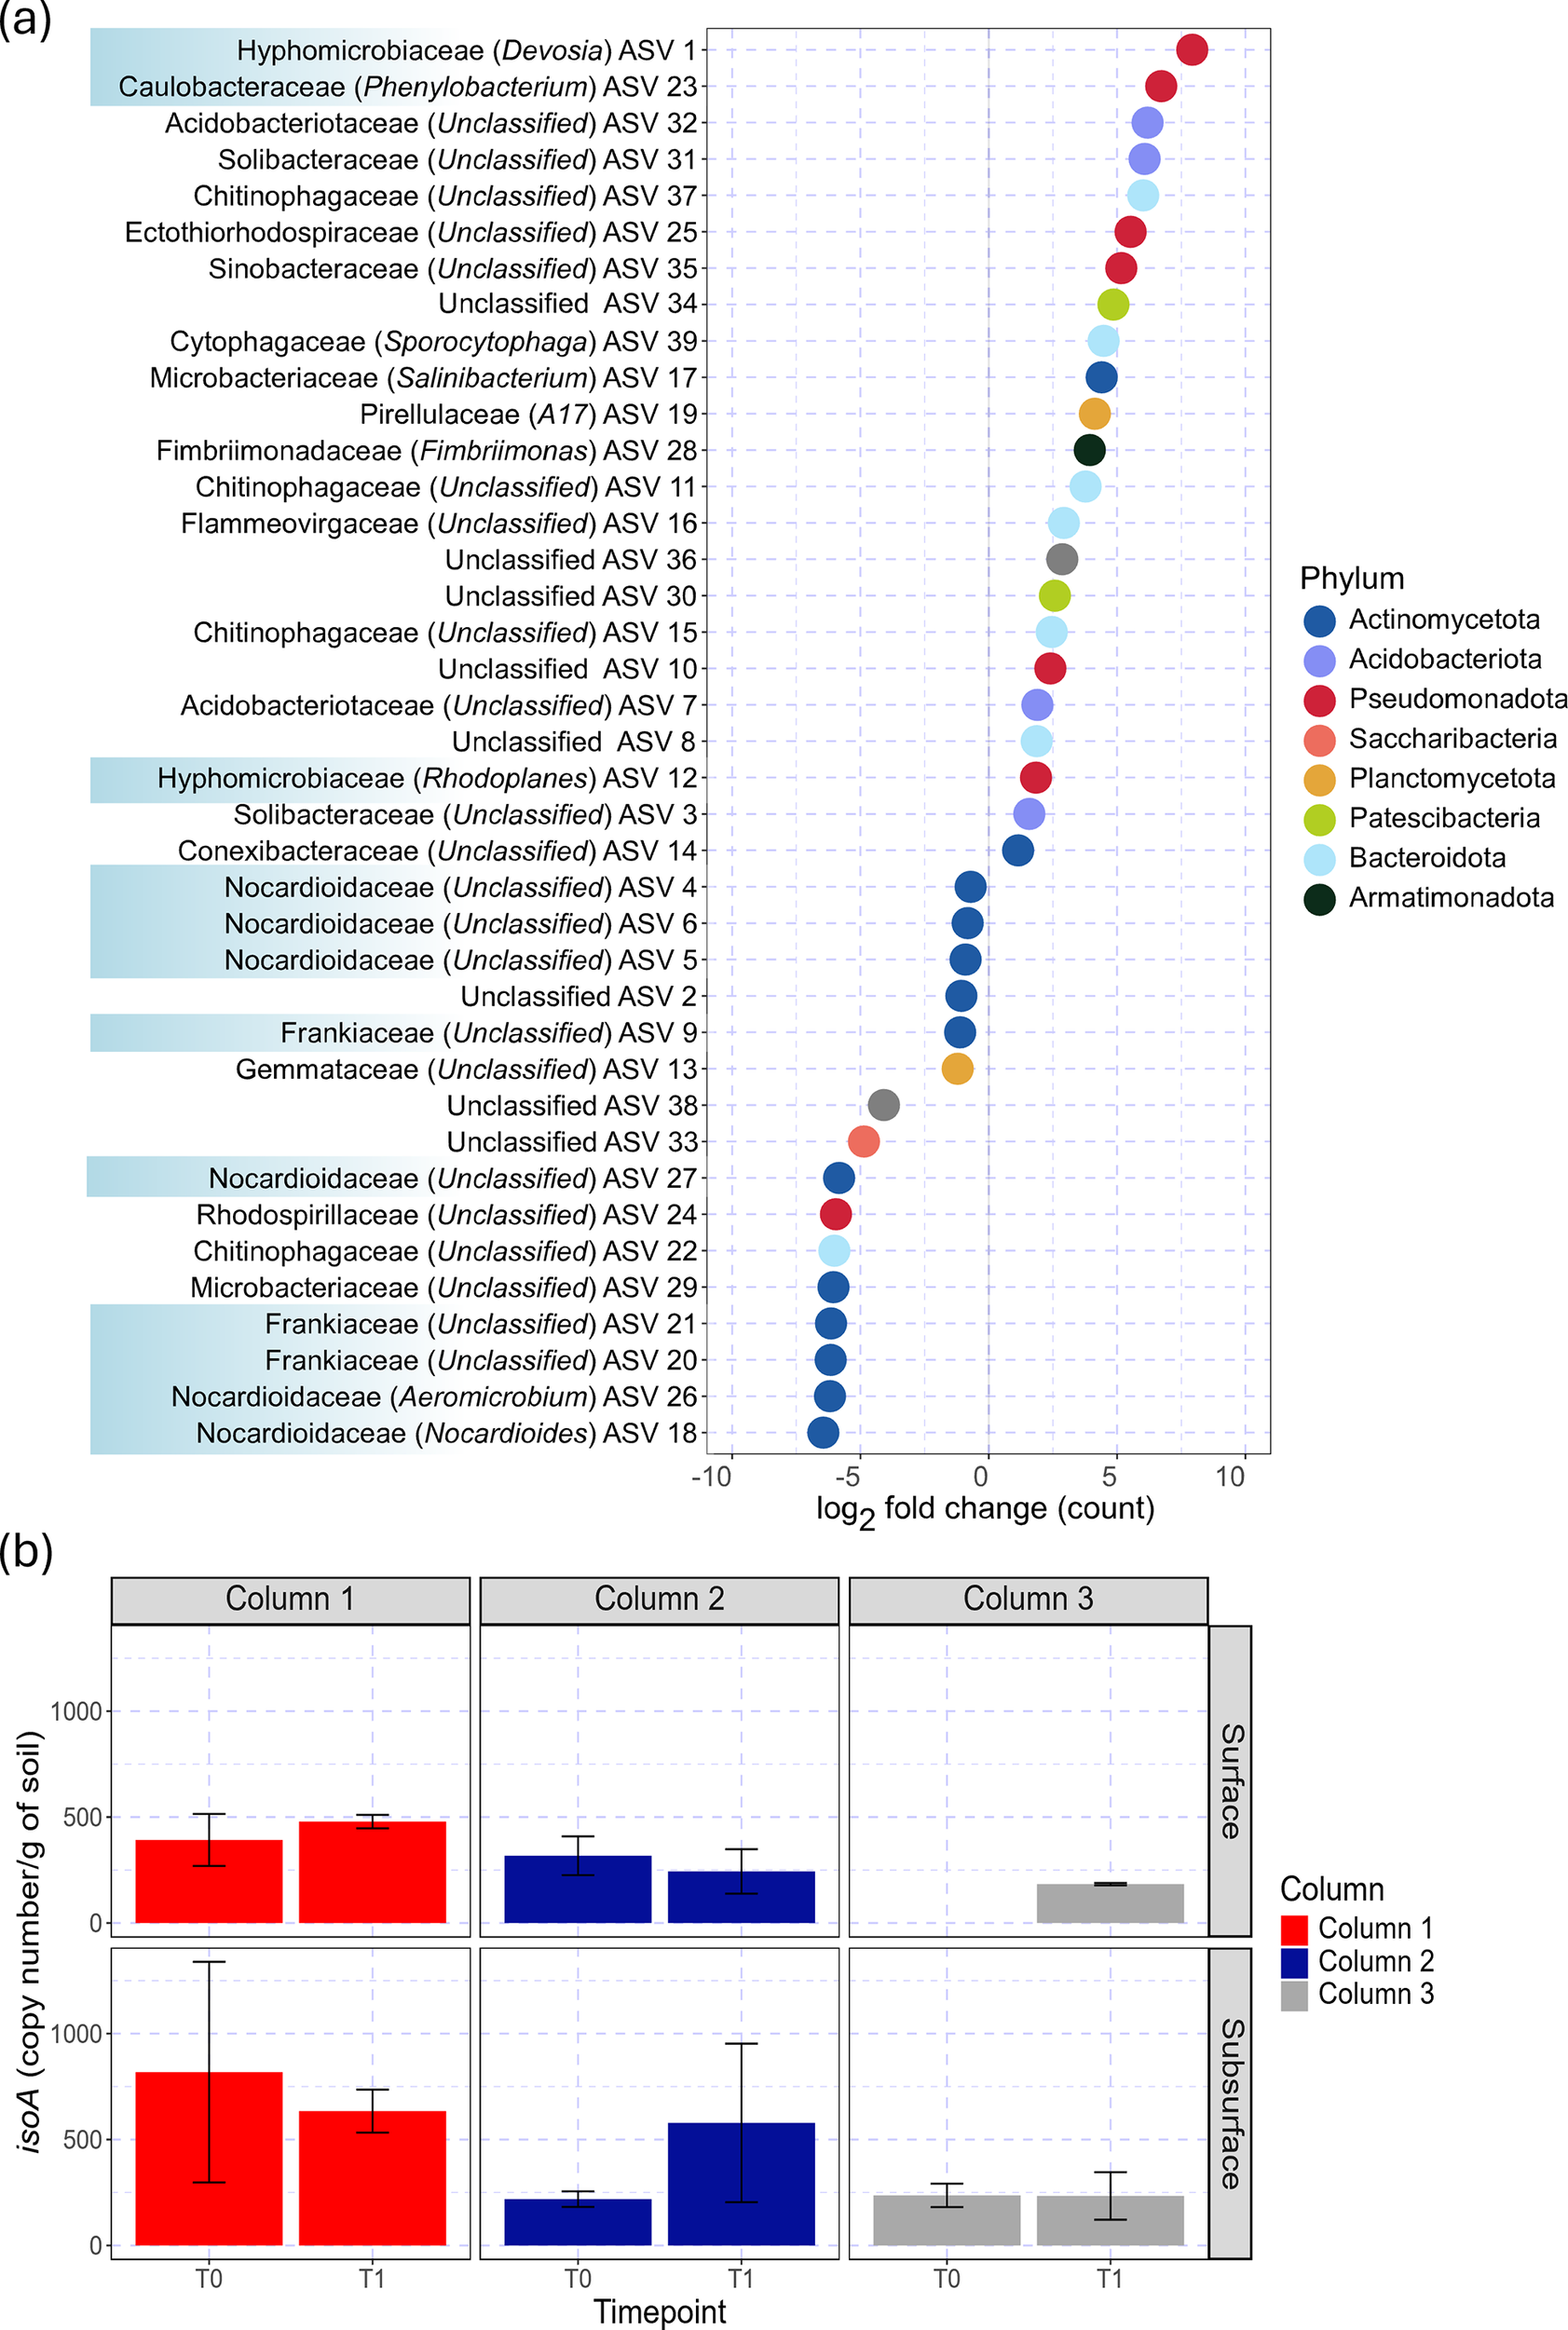
To determine if biological factors could explain the increased isoprene uptake in the soil columns over time, we first identified bacterial community members with significant differential abundance in soil collected before (T0) versus after (T1) the entire isoprene dosing period in column set 1 (Fig. 8a and Supplemental File S2). We observed significant increases in the abundance of multiple bacterial ASVs (i.e. log2 fold-change with p value <0.05) including those from Acidobacteriota, Pseudomonadota and Bacteroidota phyla. ASVs that decreased with isoprene dosing included multiple Actinobacteriota, including from the Nocardiaceae and Frankiaceae families. The family with the highest log2-fold change of 7.92 was Hyphomicrobiaceae ASV 1, followed by a 6.72 log2-fold change of ASV 23 from the bacterial family Caulobacteracea (Fig. 8a). We detected isoA genes in all samples, except surface T0 in column 3 (Fig. 8b). The abundance of isoA ranged from 100 to 800 copies g–1, but we did not observe a significant trend with depth or time. Although we aimed to quantify isoA expression by generating complementary DNA from total RNA extracted from these soil samples, we did not detect isoA amplification from cDNA even though we were able to amplify unrelated RNA polymerase sigma factor (rpoD) genes, preventing an assessment of potential changes in gene expression.
Microbial response to isoprene additions. (a) Inferred soil microbial taxa (amplicon sequence variants (ASVs)) from various families that increased or decreased following isoprene exposure based on positive or negative log2-fold change, respectively. Bacterial taxa associated with isoprene degradation (blue highlight) are noted. Points represent a significant (p < 0.05) log2-fold change of bacterial ASV family counts for pre- vs post-isoprene exposure and are coloured by phylum. (b) Isoprene degradation genes (isoA) were observed across most soil columns, depths and isoprene exposure histories. The averaged absolute isoA copy number per gram of soil before and after the dosing period (T0 vs T1) is shown for column set 1 at each sampling depth (surface 0–10, subsurface 10–20 cm). Error bars represent 1σ standard deviation across three columns.

Discussion
We used simultaneous belowground isoprene dosing and monitoring in silica and soil columns to disentangle microbial and chemical degradation pathways and their oxidation products. Our results reveal a competition between these processes in response to isoprene exposure, discussed in detail below. While dosing produced isoprene peaks in both matrices, soil microbial degradation consumed ~61% of added isoprene (Table 2). Chemical degradation represented a smaller fraction (<6%) but initially generated similar levels of oxidation products (Table 2). As dosing continued, isoprene and its derivatives declined more rapidly in soil than in silica, with earlier peaks and faster decay rates (Figs 5 and 6). Declines in isoprene typically preceded those of oxidation products until microbial uptake removed all added isoprene and oxidation products returned to baseline (Fig. 4). The progressive increase and persistence of isoprene consumption after exposure indicate a biological process that ultimately outcompetes chemical sinks. Thus, although soil appears to host a rich oxidative atmosphere, isoprene-adapted microbiomes effectively dominate isoprene turnover.
Isoprene degradation was characterised by significant and sustained increases in microbial uptake capacity over time in response to isoprene priming. We attribute the selective and increasing rate of degradation of isoprene in soil vs silica when compared to its paired inert tracer (Figs 4 and 6) to microbial degradation. The microbial role in soil isoprene degradation has been demonstrated (Cleveland and Yavitt, Reference Cleveland and Yavitt1998), and we found conserved bacterial marker genes (e.g. isoA) (Crombie et al., Reference Crombie, Khawand, Rhodius, Fengler, Miller, Whited, McGenity and Murrell2015; El Khawand et al., Reference El Khawand2016) for this described biochemical pathway (van Hylckama Vlieg et al., Reference van Hylckama Vlieg, Leemhuis, Spelberg and Janssen2000; Dawson et al., Reference Dawson, Rix, Crombie and Murrell2022) in all soil columns (Fig. 6b). Soil was a sink of isoprene both at ambient levels and under dosing conditions (e.g. days 5–6.5 and 6.5–8, respectively; Fig. 7). Soil isoprene uptake has been demonstrated over a range of elevated concentrations (e.g. 0.4–100 ppm; Cleveland and Yavitt, Reference Cleveland and Yavitt1998; Singh and Dubey, Reference Singh and Dubey2023) that approach our range of dosed (800 ppmv) and measured soil (maximum of ~200 ppmv at 7.5 cm from the doser) concentrations. In response to isoprene dosing, soil uptake capacity increased over time to effectively intercept the full isoprene enhancement within 2 days (Fig. 3), consistent with soil incubation studies showing enhanced isoprene uptake within 2–3 days (10–100 ppm isoprene) (Singh and Dubey, Reference Singh and Dubey2023) and over 2–6 weeks (2–200 ppm isoprene) (Gray et al., Reference Gray, Helmig and Fierer2015). An acceleration in soil isoprene uptake rates during prior stable isotope probing experiments (over 2 days to repeated 25 ppmv isoprene injections) directly linked increased isoprene degradation to microbial activity via incorporation of 13C into their DNA (Larke-Mejía et al., Reference Larke-Mejía, Crombie, Pratscher, McGenity and Murrell2019). Similar dose-dependent relationships have been demonstrated for microbial oxidation of molecular hydrogen (H2) in soil (Dong and Layzell, Reference Dong and Layzell2001; Khdhiri et al., Reference Khdhiri, Piché-Choquette, Tremblay, Tringe and Constant2017; Piché-Choquette et al., Reference Piché-Choquette, Khdhiri and Constant2018), including via soil probes (Moma, Reference Moma2021), and show that soil microbiomes retain memory of increased H2 availability. Singh and Dubey (Reference Singh and Dubey2023) noted weak enhancements in isoprene uptake at high concentrations potentially due to the buildup of inhibitory biodegradation products such as aromatics and reactive epoxides (Ensign, Reference Ensign2001; Alvarez et al., Reference Alvarez, Exton, Timmis, Suggett and McGenity2009) in sealed incubation jars. In our 1 m soil columns, microbial (and chemical) isoprene degradation products could freely diffuse along concentration gradients, suggesting a weaker role for inhibition under more realistic environmental conditions. Future studies that measure isoprene and its degradation products at finer spatial scales and using specific bacterial isoprene degradation and soluble di-iron monooxygenase (SDIMO) inhibitors (Sims et al., Reference Sims, Wright, Crombie, Dawson, Lockwood, Le Brun, Lehtovirta‐Morley and Murrell2023) would help determine whether inhibition is an important feature closer to the source.
Increases in microbial isoprene degradation may have been driven, in part, by increases in the abundance of specific isoprene-degrading bacteria. Most of the well-characterised isoprene-degrading bacteria to date are classified as Actinobacteriota, such as Rhodococcus sp. AD45 (van Hylckama Vlieg et al., Reference van Hylckama Vlieg, Kingma, van den Wijngaard and Janssen1998, Reference van Hylckama Vlieg, Leemhuis, Spelberg and Janssen2000) or Pseudomonadota (specifically ɣ-Proteobacteriota), and we expected that notable families like Rhodococcus, Nocardioidacea, Variovorax and Gordonia containing known isoprene degraders would increase in abundance (Gray et al., Reference Gray, Helmig and Fierer2015). Contrary to our expectations, ASVs belonging to the phylum Actinobacteriota decreased in abundance (with Conexibacteraceae ASV 14 as the exception), even for families containing isoprene degraders (Nocardioidacea and Frankiaceae) (Fig. 8a). Two ASVs (ASVs 25 and 35) classified as ɣ-Proteobacteriota (Ectothiorhodospiraceae, Sinobacteraceae) increased but have not been previously associated with isoprene degradation. The most enriched ASV (ASV 1) following isoprene dosing belonged to the Hyphomicrobiaceae family (Fig. 8a), which contains members that engage in hydrocarbon degradation potentially via SDIMO enzymes and may consume isoprene as a carbon source (Miqueletto et al., Reference Miqueletto, Andreote, Dias, Ferreira, dos Santos Neto and de Oliveira2011; Gray et al., Reference Gray, Helmig and Fierer2015). This family includes the genus Devosia that has been shown to be enriched by isoprene (Murphy, Reference Murphy2017) and survive in soil contaminated by different hydrocarbon toxins such as hexachlorocyclohexane and diesel (Kumar et al., Reference Kumar, Verma and Lal2008; Ryu et al., Reference Ryu, Chung, Le, Jang, Yun, Park and Jeon2008). In addition, soil exposed to isoprene was enriched with ASV 23 from the bacterial family Caulobacteracea that has been associated with isoprene degradation (Gray et al., Reference Gray, Helmig and Fierer2015) and its genus, Phenylobacterium, was enriched by 13C-isoprene additions providing strong evidence for isoprene degradation (El Khawand et al., Reference El Khawand2016), notably, Devosia and Phenylobacterium species are gram-negative, often non-motile and aerobic, suggesting that the N2 matrix of the dosing gas did not displace O2 enough to support anaerobic processes and we found no evidence for increases in ASVs associated with putative anaerobic isoprene degradation (Kronen et al., Reference Kronen, Lee, Jones and Manefield2019; Carrión et al., Reference Carrión, McGenity and Murrell2020). If the enhanced decay rate of isoprene in soil relative to silica (Fig. 6) reflected the specific growth rate (~1.1μg day–1) of isoprene-degrading bacteria, this would suggest a population increase of 85-fold over the 4-day dosing period (following N(t)/N0 = expμt). The 240- and 105-fold increases in the top two enhanced ASVs (Fig. 8a) could therefore sufficiently explain a population-based increase in microbial isoprene degradation rates.
Isoprene exposure may have also enhanced isoprene degrading activity through increased production of isoprene degrading enzymes, especially given the rapid increase in isoprene uptake (Fig. 3). Soil microbes regulate enzyme production and release in response to resource availability (Sinsabaugh et al., Reference Sinsabaugh2014) that are sometimes revealed through shifting patterns in soil microbial gene expression. Here, we observed no significant changes in isoA gene copy numbers following isoprene dosing (Fig. 6b). We used isoA qPCR and PCR primers developed from a growing library of reference sequences (Carrión et al., Reference Carrión, McGenity and Murrell2020). Links have been drawn between methane and 1,4-diozane SDIMO marker genes and respective soil degradation potential (Li et al., Reference Li, Eshghdoostkhatami and Cupples2025; Nwokolo and Enebe, Reference Nwokolo and Enebe2025), but not for isoprene. This, and the indeterminateness of our results even under substantial and controlled isoprene enrichments, reaffirms the need for additional isolates and characterisation efforts of isoprene degrading bacteria to improve the robustness of these functional gene makers.
The capacity of soil microbiomes to adapt to elevated isoprene and other volatile substrates highlights the importance of volatile-mediated traits in shaping ecological interactions and life-history strategies (Ledford et al., Reference Ledford, Geffre, Marschmann, Karaoz, Brodie and Meredith2025). Isoprene inputs to soil are expected to fluctuate over time, ranging from diurnal variations driven by temperature- and light-dependent emissions from leaves and roots to seasonal pulses associated with litterfall decomposition, which may occur episodically and depend on soil moisture (Crocker et al., Reference Crocker, Guo, U’Ren, Pugliese, Ladd, Werner and Meredith2025). In this study, we found that microbial community investments supporting rapid isoprene degradation persisted over a 4-day interval between isoprene additions, indicating a sustained ecological shift. Such community ‘memory’ of trace gas metabolism poses a major challenge for inferring gross consumption rates from observed concentrations or net fluxes without accounting for how prior exposure alters instantaneous uptake dynamics. Approaches using tracers (e.g. stable isotope labelling) or concentration-based kinetic assays may therefore be essential for quantifying true turnover rates and disentangling transient from acclimated metabolic responses.
Chemical degradation of isoprene supported rich and underappreciated oxidation pathways in soil. The introduction of isoprene led to a concomitant spike in known isoprene oxidation products in both silica and soil (Fig. 4). Observed signals included first- and second-generation isoprene oxidation products that are generated in the atmosphere primarily by •OH-initiated and NO-initiated reactions, or both (Table 1). Dominant first-generation atmospheric isoprene degradation products MVK + MACR (C4H6O) were produced at the highest yield (Table 2). High-NO pathway products dominated (denoted by colours in Fig. 4) with a 10-fold greater signal compared to low-NO and all other recorded masses. Soil chemical oxidation appears to depend acutely on isoprene availability (Singh and Dubey, Reference Singh and Dubey2023), which was suppressed in the second round of dosing in both sets of columns. Although isoprene tended to peak before and decay faster than other oxidation products, trends between compounds were not conclusive, for example in terms of chemical branching. Both soil and silica contain minerals that may catalyse oxidant formation, for example •OH from O2. In soil, oxidant formation can be augmented by microbe-mediated formation processes (Du et al., Reference Du, Chen, Yu, Polizzotto, Sun and Kuzyakov2020). In addition to these internal sources, oxidants may diffuse into soil and silica from the overlying atmosphere, but oxidation product levels were not necessarily higher in our probes closer to the surface (Fig. 4). Despite competition for isoprene in soil (reactant availability), first-generation isoprene degradation products MVK + MACR (C4H6O) and an unknown mass (C4H8O2) showed an initial enhanced oxidative yield in soil (Fig. 7 and Table 2), suggesting that soil may support an enhanced oxidative potential over silica. This is consistent with reports of higher oxidant concentrations in soil than the atmosphere (e.g. for •OH and NO; Rudolph et al., Reference Rudolph, Rothfuss and Conrad1996; Page et al., Reference Page, Kling, Sander, Harrold, Logan, McNeill and Cory2013; Du et al., Reference Du, Chen, Yu, Polizzotto, Sun and Kuzyakov2020; McDonald et al., Reference McDonald, Lewis, DeLaune, Hux, Boutton and Gentry2023). Alongside chemical isoprene degradation, biological isoprene degradation may release the C5H8O volatile epoxide (Dawson et al., Reference Dawson, Rix, Crombie and Murrell2022), but C5H8O levels were higher in silica than soil, suggesting that chemical pathways for C5H8O production dominated. Some isoprene degradation products are taken up by soil (e.g. MVK + MACR, C5H8O; Pugliese et al., Reference Pugliese2023) or are present in microbial pathways active in soil (e.g. acetoin/C4H8O2 production from diacetyl; Honeker et al., Reference Honeker2023), and these biological sinks may have been active. Overall, these results indicate that chemical conversion of isoprene exists alongside microbial uptake in soil.
Alternative abiotic processes in soil can drive VOC uptake, including surface adsorption and dissolution in the aqueous phase (Tang et al., Reference Tang, Schurgers and Rinnan2019). Isoprene, as a relatively small hydrocarbon, is expected to only weakly interact with mineral complexes in soil like Al2O3 or TiO2 nanoparticles (Lichtin et al., Reference Lichtin, Avudaithai, Berman and Grayfer1996; Ahmad and Martsinovich, Reference Ahmad and Martsinovich2022), which is supported by weak isoprene sorption onto dust (Zeineddine et al., Reference Zeineddine, Romanias, Gaudion, Riffault and Thévenet2017). Ambient isoprene adsorption onto sterilised soil tends to decrease (not increase) over time (Li et al., Reference Li2019), in contrast to our results. Moreover, isoprene has low solubility, therefore we find little evidence for a role of adsorption or dissolution in our study.
These results have important implications for biosphere–atmosphere exchange of isoprene as well as internal isoprene cycling within the pedosphere. Soil enhances and alters atmospheric isoprene oxidation by acting as a biological and chemical sink, and escape of elevated soil oxidant concentrations (e.g. NO, •OH) and turbulent interactions between soil surfaces and the overlying air may represent an underappreciated source of oxidation potential to the atmospheric environment. Current understanding of oxidation chemistry in the atmosphere is far from complete, with reports of a missing radical sink at the global and ecosystem scales (Ferracci et al., Reference Ferracci, Heimann, Abraham, Pyle and Archibald2018; Bottorff et al., Reference Bottorff2023). While it is unclear how enhanced oxidation from soil would explain current discrepancies, we note that manifold roles of soil as a source and sink of oxidants and VOCs are not included in models. Our findings share parallels with a recent exposé on isoprene sinks in the surface ocean that demonstrated active microbial and chemical degradation (e.g. via H2O2 and HOBr) processes and suggested higher rates of both isoprene production and consumption in surface ocean waters than previously appreciated (Simó et al., Reference Simó, Cortés-Greus, Rodríguez-Ros and Masdeu-Navarro2022). Similarly, we reveal the relevance of both microbial and chemical degradation of isoprene, and an immense capacity for microbial isoprene uptake to respond to new isoprene inputs to soil. If isoprene inputs to soil have been underestimated (e.g. from microbial production, root emissions, litter emission), this likewise suggests that there could be more underlying isoprene cycling in soil than previously recognised.
Here, we demonstrate the relevance of chemical degradation pathways for isoprene in soil, which have been previously posited but not shown for soil VOCs (Insam and Seewald, Reference Insam and Seewald2010). Already, a vast array of volatile and semivolatile products have been described from the oxidation of isoprene alone (Nguyen et al., Reference Nguyen, Laskin, Laskin and Nizkorodov2011), with tremendous increases in complexity when considering the diverse sets of VOCs present in ambient air (Palm et al., Reference Palm2017). We know little about the true composition of the soil pore gas milieu, and while the volatile component of soil organic matter (SOM) appears vast (Meredith et al., Reference Meredith, Ledford, Riemer, Geffre, Graves, Honeker, LeBauer, Tfaily and Krechmer2023), it has been typically overlooked (Honeker et al., Reference Honeker, Graves, Tfaily, Krechmer and Meredith2021; Meredith and Tfaily, Reference Meredith and Tfaily2022). Here, we demonstrate that akin to the dynamic and extensive shifts in soil organic matter from chemical oxidation, the soil volatilome likewise undergoes chemical ageing in ways that are yet to be fully explored.
Conclusions
Our in situ measurements of the response of isoprene and its chemical and biological derivatives to repeated isoprene additions within soil reveal, for the first time, the relevance of chemical degradation pathways to isoprene in soil and the capacity of the soil microbiome to respond to (and ‘remember’) increased isoprene availability. These results paint a dynamic picture of the subsurface gas-phase interactions between microbial and chemical pathways controlling the fate of isoprene soil inputs from atmospheric, root, litter and microbial sources. These chemical mechanisms may influence the overall biosphere–atmosphere exchange of isoprene and other VOCs, and influence the reactivity above ecosystems. Within soil systems, chemical oxidation probably plays a significant role in VOC ageing that spans the volatility spectrum, representing an important mode of SOM-VOC interactions that may contribute to carbon cycling, stabilisation and loss in soil. Moreover, the ability of microbial degradation to swiftly respond to new inputs of isoprene suggests greater internal soil isoprene and VOC cycling than previously appreciated. The lasting biological memory of isoprene priming allows soil microbiomes to respond and adapt to changing substrate availability in their environment but also represents a significant challenge for linking contemporaneous measurements of trace gas cycling with measures of microbial genomic potential and expression. This study suggests that the miniature atmospheres among soil gas pores support dynamic interactions between VOCs, microbes and oxidative chemistry, with many mysteries yet to explore.
Supplementary material
The supplementary material for this article can be found at http://doi.org/10.1180/gbi.2026.10006.
Acknowledgements
This material is based on work primarily supported by the National Science Foundation under Grant No. 2034192. The authors thank Eben Cross and Joseph Palmo for their contributions to the technical aspects of this work and Zhaoxin Zhang for helpful input to the manuscript.
Competing interests
The author(s) declare none.


 Open access