


Data-intensive scientific discovery
The challenges of dealing with the rapid growth of data in materials science-related fields has long been recognized.Reference Murray-Rust1–Reference Dalby, Nourse, Hounshell, Gushurst, Grier, Leland and Laufer3 With more recent advances in computer science, the tools for advancing data-intensive scientific discovery have opened the door for more engagement from the scientific community. As suggested by Gray, this has created “The Fourth Paradigm: Data-Intensive Scientific Discovery.”Reference Hey, Tansley and Tolle4 He pointed out that experimental, theoretical, and computational science were all being affected by the data deluge, and a fourth “data-intensive” science paradigm was emerging. Indeed, we are witnessing materials science being greatly affected in the new era of “data-centric” materials science, which will likely become the new paradigm for materials research and education.
For more than a decade, MRS Bulletin has published issues related to the nexus of data science and materials science, including materials informatics5 and microstructural informatics.6 In this issue, we continue to expand on those themes by focusing on the numerous efforts in developing and utilizing databases of electronic structure calculations, and their impact on addressing different classes of problems in materials science.
Computational high-throughput screening
First-principles calculations with predictive performance play an essential role in data-centric materials science. In 1990s, researchers were able to make first-principles calculations of 10–100 inorganic crystalline compounds at most with less than a few atoms in a unit cell with a level of accuracy comparable to experiments. Density functional theory (DFT) is a reasonable way to fulfill the accuracy level without prohibitive computational costs. Today, developments of computational hardware and software have enabled computations of 105–106 compounds having much larger unit cells. These results have been stored in databases such as the Materials Project (MP) (materialsproject.org), AFLOW (aflowlib.org), OQMD (oqmd.org), NOMAD (www.nomad-coe.eu), and Materials Cloud (www.materialscloud.org).
In order to construct such databases, powerful software tools to automate computational engines to run thousands of simulations are essential, as are application programming interfaces (APIs) for the resulting databases. Complex sequences of calculations are encoded into scientific workflows. Robust tools to store, search, and disseminate big data are important as well, and scientists benefit greatly from them. Such software platforms are described in this issue.Reference Pizzi, Togo and Kozinsky7–Reference Ward, Aykol, Blaiszik, Foster, Meredig, Saal and Suram11
When a target property can be accurately computed by DFT without excessive computational cost, high-throughput screening (HTS) within the DFT database is a straightforward strategy. These types of screening approaches have been used to design and discover materials with a wide range of properties, including those for structural, electronic, functional, and energy materials. Unfortunately, many materials properties are not directly computable by DFT. For some materials properties that can be computed, the computational expense precludes a HTS approach. In these instances, descriptors or features that correlate with the target property may instead be used for HTS. Examples of useful descriptors have been found through physical considerations and the knowledge of experts.Reference Curtarolo, Hart, Nardelli, Mingo, Sanvito and Levy12–Reference Isayev, Oses, Toher, Gossett, Curtarolo and Tropsha15
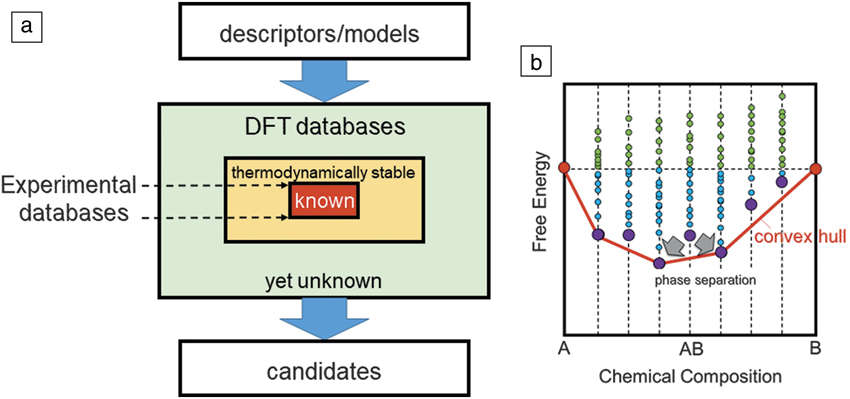
Initially, DFT databases were developed for crystal structures registered in experimental databases, such as the International Crystal Structure Database (ICSD).16 A DFT calculation can find an equilibrium structure corresponding to the local minima of the potential energy surface, which is called geometry optimization. However, the optimization is typically limited within a local structure space fixing the number of atoms in the given unit cell. In addition, this local optimization is most often made using the symmetry of the starting configuration, and does not allow switching to other symmetries. In other words, the thermodynamic stability of the compound is far from guaranteed if the structure of a hypothetical compound is simply optimized locally.
Methods to perform global structure optimization based on strategies such as the evolutionary algorithm,Reference Oganov and Glass17 particle swarm optimization,Reference Wang, Lv, Zhu and Ma18 minima hopping,Reference Amsler and Goedecker19 and random structure searchingReference Pickard and Needs20 have been developed and successfully applied to many examples using program packages such as USPEX (http://uspex-team.org/en/), CALYPSO (www.calypso.cn), and AIRSS (www.mtg.msm.cam.ac.uk/Codes/AIRSS). However, these are computationally demanding for exploration of the vast chemistry space composed of possible combinations of chemical elements. For example, the number of combinations exceeds one billion for quaternary systems with simple composition ratios. Additionally, even with these global optimization tools, which search for minimum energy structures at a given composition, thermodynamic stability is still often not guaranteed, since a stable compound must be lower in free energy than phase separation into all possible decomposition products. The utility of large-scale databases becomes apparent when assessing thermodynamic stability, since these databases allow comparison of the energy of any compound under consideration with all possible combinations of phases included in the database. The major databases previously listed (MP, AFLOW, OQMD) all have automated the construction of these “convex hulls” to assess thermodynamic stability. Figure 1 illustrates the HTS scheme using a DFT database, along with the convex hull concept. If one wants to expand the search space beyond the set of known compounds to “as yet-unknown” compounds, the thermodynamic stability should be examined before or after the screening. However, computational demand increases dramatically when one goes beyond the boundaries of known compounds. Hence, it remains a challenge to explore the vast chemistry space exhaustively by only using DFT calculations.
(a) A flowchart of high-throughput screening of density functional theory (DFT) databases. “Known” denotes compounds registered in the International Crystal Structure Database whose existence and structure are known by experiments. (b) A schematic diagram for the convex hull of free energy. Blue and green dots correspond to compounds with negative and positive formation energies, respectively. Violet dots show the lowest energy structures for given chemical compositions. The red line shows the convex hull. The AB compound corresponding to the violet dot is thermodynamically not stable and is subject to phase separation since it is not on the convex hull.
One significant deficiency of current databases is that they contain (for the most part) only experimentally synthesized compounds for which the crystal structure has been determined. Examination of diffraction databases such as the Powder Diffraction File21 shows that there are on the order of 104–105 experimentally synthesized inorganic compounds whose crystal structures have not been solved. Solution of these structures followed by subsequent DFT calculations would enable a large increase in the size of available databases. Methods such as the first-principles assisted structure solution (FPASS) have been developed and applied to this problem of automating structure solution.Reference Meredig and Wolverton22,Reference Ward, Michel and Wolverton23 However, the computation expense of the methods still leaves a large number of unsolved compounds today. In addition, all DFT databases (MP, AFLOW, OQMD) largely or completely ignore compounds that contain partial occupancy in the crystal structure. Although methods such as cluster expansions of special quasi-random structuresReference Zunger, Wei, Ferreira and Bernard24,Reference Seko and Tanaka25 could address these partially occupied structures, the automated use of these tools in HTS still presents challenges. Since a large fraction of the total number of compounds experimentally reported have partial occupancy, a solution of these challenges would also represent a large expansion of the data set.
Machine-learning models for formation energy and other physical quantities
If one can obtain a good “guess” of formation energy by machine learning (ML) using a large set of DFT calculations as training data, the thermodynamic stability of an arbitrary compound can be assessed without computationally demanding DFT calculations. Attempts at such ML models have been carried out for 134,000 small organic molecules in the GDB-9 database.Reference Ramakrishnan, Dral, Rupp and von Lilienfeld26–Reference Schütt, Arbabzadah, Chmiela, Müller and Tkatchenko29 The accuracy of these ML models is comparable to target values not only for the energy, but also for geometry, harmonic frequency, dipole moment, and polarizability. For inorganic crystals, ML models with reasonable accuracy have been reported as well.Reference Meredig, Agrawal, Kirklin, Saal, Doak, Thompson, Zhang, Choudhary and Wolverton30–Reference Seko, Hayashi, Nakayama, Takahashi and Tanaka34 In some cases, errors in the formation energy from these ML models (relative to DFT) were estimated to be close to the errors of DFT relative to experiments.Reference Kirklin, Saal, Meredig, Thompson, Doak, Aykol, Ruhl and Wolverton35 These ML models are thus becoming useful for rapid screening to select candidates for detailed examination.Reference Faber, Lindmaa, von Lilienfeld and Armiento32,Reference Ward, Liu, Krishna, Hegde, Agrawal, Choudhary and Wolverton33,Reference Schmidt, Chen, Botti and Marques36
Scientific intuition suggests that the energetics and properties of compounds are determined not only by their chemical compositions, but also by their structures. Consequently, ML models with high accuracy typically use structural descriptors as well as elemental descriptors. The need for structural descriptors limits the use of ML models for the exploration within an unknown compound domain, since the structural descriptors cannot be a priori provided for unknown compounds. Even when the compound of interest (e.g., at the extremum of a target property) with respect to structural and elemental descriptors is predicted by an ML model, there is currently no robust approach to reconstruct the crystal structure from these descriptors.
Instead of making ML models for energy or other quantities by a regression approach, one can use a classification approach to judge whether a compound is relevant for further investigation. Attempts to find chemically relevant compositions (CRCs), where the presence of a stable compound is anticipated, have been made using ML models.Reference Meredig, Agrawal, Kirklin, Saal, Doak, Thompson, Zhang, Choudhary and Wolverton30,Reference Hautier, Fischer, Jain, Mueller and Ceder37–Reference Seko, Hayashi and Tanaka39 In a similar manner, a CRC with a high metallic glass-forming ability within experimentally unexplored composition domains was recently successfully predicted and experimentally validated.Reference Ward, Agrawal, Choudhary and Wolverton40,Reference Ren, Ward, Williams, Laws, Wolverton, Hattrick-Simpers and Mehta41 These and other efforts in the ML domain have demonstrated the power of application of these nascent tools for materials problems.
Experimental big data analysis and databases
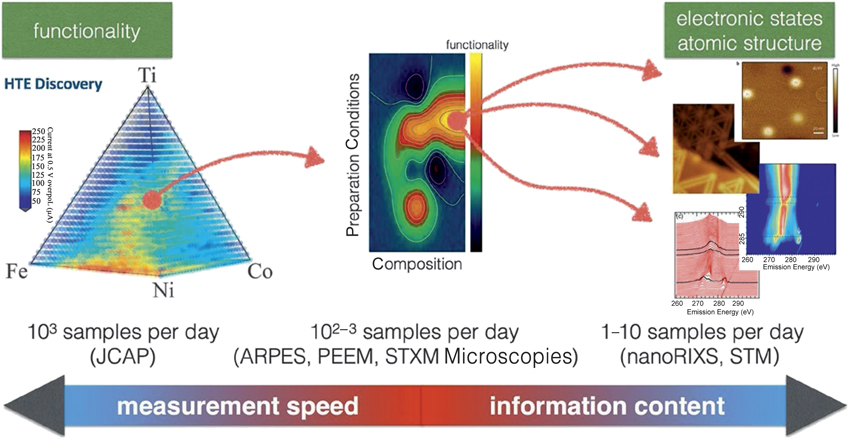
Progress in digitally controlled microanalysis tools has enabled acquisition of big data from nanostructures with atomic resolution. There are many examples of this, such as the analysis of hyperspectral image data obtained by transmission electron microscopy,Reference Seko, Toyoura, Muto, Mizoguchi and Broderick42,Reference Shiga, Muto and Tanaka43 and topological data analysis of atom probe tomography images.Reference Zhang, Broderick, Rajan and Tanaka44 A high-throughput synthesis (thin films) and characterization approach with composition and temperature gradients across the substrate has been systematically conducted and the outputs are stored in the high-throughput experimental materials (HTEMs) database (www.htem.nrel.gov).Reference Zakutayev, Wunder, Schwarting, Perkins, White, Munch, Tumas and Phillips45 Linking such data to theory and the related assessment of accuracy of measurements in HTS can help in making combinatorial libraries become a source of generating reference data.Reference Rajan46 Materials systems for such experiments can be selected using ML models based on DFT databases and other preceding databases, as described earlier in this article. Such combinations are expected to accelerate data-driven discovery.
Further, we had notedReference Rajan46 that “when combinatorial experiments are coupled to the plethora of HTS techniques, they can then serve as experimental platforms for linking length scales and time scales and, hence, multiscale modeling.” To accomplish this, “combinatorial library synthesis needs to be linked to the significant advances in computational modeling,” and this is one area of research that opens new trajectories for harnessing electronic structure databases. With advances in experimental capabilities coupled to the availability and access to large amounts of robust electronic structure data, the foundations for an integrated workflow between experiment and theory can be laid (Figure 2).47
Large quantities of samples are analyzed in an automatic manner for a specific functionality that is faster to measure, after which a reduced number of highly contrasting samples are subjected to a more detailed analysis (middle) to investigate the relationship between preparation conditions and composition. Courtesy of the Advanced Light Source, Lawrence Berkeley National Laboratory.47 Note: HTE, high-throughput experimental; JCAP, Joint Center for Artificial Photosynthesis; ARPES, angle-resolved photoelectron spectroscopy; PEEM, photoemission electron microscopy; STXM, scanning transmission x-ray microscopy; RIXS, resonant inelastic x-ray scattering; STM, scanning tunneling microscopy.
Finally, it may be useful for readers to refer to some other materials databases. NIMS (National Institute for Materials Science) in Japan provides a wide range of materials databases, MatNavi,48 with basic properties of polymers, inorganic materials, and metals, together with experimental materials datasheets such as creep data. The Materials Data Facility (MDF)49 (www.materialsdatafacility.org), a pilot project funded by NIST, provides a scalable repository where materials scientists can publish, preserve, and share research data. Citrination50 is an open database of materials data collected by Citrine Informatics. The Nanoporous Materials Genome Center has produced a database of nanoporous materials, including existing and proposed zeolites, metal–organic frameworks (MOFs), and porous polymer networks (PPNs). Textural properties (surface area and void fraction) have been calculated for all materials, and adsorption properties for gases such as hydrogen, methane, and CO2 have been simulated for large numbers of these materials.Reference Simon, Kim, Gómez-Gualdrón, Camp, Chung, Martin, Mercado, Deem, Gunter, Haranczyk, Sholl, Snurr and Smit51
In this issue
Currently, several DFT databases of structure, formation energy, and other materials properties for 105–106 inorganic compounds are available. Combining ML tools, the databases have been utilized for discovery and design of new materials and solving different classes of problems in materials science.
The article by Pizzi et al. in this issueReference Pizzi, Togo and Kozinsky7 presents automation software for preparing and performing multistep computational workflows. The AiiDA program manages the execution of dynamic workflows ensuring a format reusable in different projects and by different researchers. The way to integrate some tools for the automated computation is explained as well.
The Ye et al. articleReference Ye, Chen, Dwaraknath, Jain, Ong and Persson8 describes the MP database, which contains DFT results for most of the known inorganic materials. Features or descriptors useful for applying the ML techniques to the database are explained. Examples of the data-accelerated materials design are then showcased.
The AFLOW database contains DFT results for more than 1.8 million materials, including hypothetical compounds. The Oses et al. articleReference Oses, Toher and Curtarolo9 in this issue illustrates how they combined the database with ML tools in order to make thermodynamic formability modeling feasible. Construction of electronic structure fingerprints is explained as well.
The Ward et al. articleReference Ward, Aykol, Blaiszik, Foster, Meredig, Saal and Suram11 presents another DFT database, OQMD. Applications of informatics techniques for accelerated materials discovery and extraction of design rules are described. A data-centric approach in experimental materials science is given as well. Future perspectives for the continued expansion of materials informatics applications are then discussed.
The activity of a European Centre of Excellence, NOMAD, is explained by Draxl and SchefflerReference Draxl and Scheffler10 in this issue. It collects computed data obtained by the most important first principles codes. It can also manage the data of other databases, such as MP, AFLOW, and OQMD, to feed into the ML process. The outlook for handling experimental data is then discussed.
The Seko et al. articleReference Seko, Toyoura, Muto, Mizoguchi and Broderick42 describes the data-centric approaches used for characterization and design of nanostructures of materials, which is called nanoinformatics. Combination of ML techniques with DFT data and digitally controlled microscopy and spectroscopy data are shown to be powerful for exploration of the design spaces.
Looking forward
In this issue of the MRS Bulletin, we have focused on electronic structure databases or properties that can be derived from electronic structure calculations. There are many ongoing efforts that are compiling data on different genres of materials, their chemistry, properties, and characterization. As these databases increase in size and diversity, one needs to begin to consider the development of other functionalities of databases. These include the ability to find ways to merge the knowledge derived from different types of databases that capture multiscale information. The integration of information will help to create a new paradigm for the next generation of databases—transforming them from repositories of data to “laboratories” where information and data are fused to help unravel the complexity of materials engineering problems.Reference Rajan52–Reference Broderick and Rajan55
Acknowledgments
I.T. acknowledges the Japan Society for the Promotion of Science (JSPS) for a Grant-in-Aid for Scientific Research on Innovative Areas “Nano-Informatics” (18H05195) and a Grant-in-Aid for Scientific Research (A) (18H03843); Japan Science and Technology Agency (JST) through Materials Research by Information Integration Initiative (MI2I). K.R. acknowledges support from the National Science Foundation (NSF) DIBBs Project, Award No. ACI-16-40867. C.W. acknowledges support from the Center for Hierarchical Materials Design and from the US Department of Commerce, National Institute of Standards and Technology under Award No. 70NANB14H012.
Isao Tanaka is a full professor in the Department of Materials Science and Engineering and the director of the Elements Strategy Initiative for Structural Materials of Kyoto University, Japan. He also holds a researcher position in the Japan Fine Ceramics Center and National Institute for Materials Science-MI2I. He received his BE and ME degrees in metal physics from Kyoto University and his PhD degree from Osaka University, Japan. Previously, he was at the Institute of Scientific and Industrial Research of Osaka University, and Max Planck Institute for Metals Research, Germany. His current research focuses on a data-centric approach for materials discovery, including solid-state ionics, oxide/nitride semiconductors, engineering ceramics, and structural metals. Tanaka can be reached by email at tanaka@cms.mtl.kyoto-u.ac.jp.

Krishna Rajan is the inaugural Erich Bloch Endowed Chair of the Department of Materials Design and Innovation at University at Buffalo, The State University of New York. He is a leading proponent of the field of materials informatics. His research focuses on the application of information science and data-intensive methodologies for the discovery, characterization, and modeling of materials. Rajan’s awards include the von Humboldt Research Award for pioneering work in materials informatics. He received his undergraduate education at the University of Toronto, Canada, and doctorate from the Massachusetts Institute of Technology, followed by a postdoctoral appointment at the University of Cambridge, UK. Rajan can be reached by email at krajan3@buffalo.edu.

Christopher Wolverton is the Jerome B. Cohen Professor of Materials Science and Engineering at Northwestern University. Previously, he was with the Research and Innovation Center at Ford Motor Company, where he was a group leader for the Hydrogen Storage and Nanoscale Modeling Group. He received his BS degree in physics from The University of Texas at Austin and his PhD in physics from the University of California, Berkeley. His research interests include computational studies of a variety of energy-efficient and environmentally friendly materials via first-principles atomistic calculations, high-throughput and machine-learning tools to accelerate materials discovery, and “multiscale” methodologies for linking atomistic and microstructural scales. He is a Fellow of the American Physical Society. Wolverton can be reached by email at c-wolverton@northwestern.edu.


