
Introduction
Universities often provide ample opportunities for training students to innovate and commercialize their inventions [Reference Watson, McGowan and Cunningham1–Reference Jackson, Gabriel, Pariser and Feig6], but similar support is often lacking in hospital and medical settings outside the university environment. Limited institutional support in these settings frequently compels innovators to seek external resources, a time-consuming and arduous process that also increases the risk of exposing innovations prematurely, before adequate intellectual property protections are in place. These barriers are particularly challenging for innovators who are less connected, have fewer resources for early-stage development, or lack protected time to navigate complex innovation pathways.
To address these challenges and foster a more inclusive innovation environment, the Mayo Clinic Florida (MCF) Office of Entrepreneurship (OE) launched the Alligator Tank (AT) in 2017. This annual, cross-departmental internal pitch competition is open to all innovators at the institution, regardless of their rank or department. In preparation for the AT, innovators receive training utilizing various business start-up resources, some of which the OE modified and adapted to the healthcare sector.
This case study examines the first seven ATs, evaluating trends that demonstrate the effectiveness of the training and institutional business development processes, while also identifying opportunities for improvement. These findings offer insight into the early-stage medical innovation ecosystem within one of the leading hospitals in the United States [Reference Powell, Murphy and Bell7], and acts as a guide for other institutions seeking to implement pitch competitions and entrepreneurial medical education. With appropriate adaptation, this framework can help institutions cultivate an industry-wide culture of innovation and accelerate the translation of science within the healthcare sector.
Translational research and translational science
Translational research defines the actions of transforming clinical and community observations and bench-side research into improved clinical processes, innovative services, and new products including diagnostics, therapeutics, and medical devices. Translational science is the study of the processes involved in translational research and aims to overcome barriers along that pipeline [Reference Faupel-Badger, Vogel, Austin and Rutter8–Reference Vogel, Haynes and Hussain11]. Both are critical to implementing new healthcare interventions.
Traditionally, medical professionals envision the translational research process through a two-dimensional Bench-to-Bedside (2B) model. Translational science, however, shows that this process has many complex dimensions. Innovators would benefit from additional training in the basics of business and commercial influences on innovation. Ideally, institutions should provide this training to enhance both quality and capacity of innovation [Reference Ramsey, Proctor and Chambers2,Reference Collins, Reizes and Dempsey12].
To reflect the complexity of the translational research process, the OE introduced a third B into the 2B-model, adding a crucial business component [Reference Collins, Reizes and Dempsey12,Reference Cook, Bikkani and Poterucha Carter13]: the Bench-to-Business-to-Bedside (3B) model [Reference Hale, Rotman, Sreedhar and Ekker14,Reference Campbell, Rotman and Roy15]. Translational research is inherently nonlinear, demanding consideration of the Bench, the Bedside, and the Business perspectives at every developmental stage. While medical innovators often view the patient as the primary or sole stakeholder, numerous other participants shape whether an invention successfully reaches patients. The 3B model highlights the importance of a viable business proposition alongside patient-focused solutions [Reference Collins, Reizes and Dempsey12].
Internal pitch competitions, such as the AT, help medical innovators understand and articulate all elements of the 3B model, and thereby accelerate the translational process. These competitions serve as developmental steppingstones and potential sources of investment [Reference Price5,Reference Collins, Reizes and Dempsey12]. A distinguishing feature of the AT is its inclusivity, open to innovators throughout the institution. This approach allows novice innovators to gain entrepreneurial experience through hands-on learning, while maintaining focus on their primary professional, often patient-facing, responsibilities.
Alligator Tank healthcare innovation pitch competition
The AT accepts applications over a two-month period, after which nine innovations are selected to pitch based on participants’ written responses to five core questions:
-
1. What is the problem?
-
2. What is the solution?
-
3. Why you?
-
4. Why now?
-
5. How is it a business?
Each selected innovator has 120 s to present these answers to a panel of five judges, which includes at least one practicing medical professional, one research leader, and one representative from the business development office. The pitching session occurs in a room of more than 100 colleagues, including, crucially, institutional leadership such as the CEO and the CAO of Mayo Clinic Florida. It begins after 5 pm to accommodate those with clinical responsibilities. During the pandemic years of 2020 and 2021, the event was hosted virtually. Importantly, to avoid unintended public disclosures, attendance is restricted to Mayo Clinic employees, and medical and graduate students, and the pitches are not made publicly available.
The 120-second limit requires innovators to articulate the need and the market value of their inventions clearly and concisely. In the OE’s training model, innovators have access to multiple internal pitch and entrepreneurial training opportunities, which are critical to communicating their visions effectively. The OE developed a formal, graduate-level entrepreneurial education program open to innovators [Reference Greenberg-Worisek, Cornelius and Gas16]. Furthermore, prior to the application deadline, the OE hosts three preparatory 1-hour long, hybrid, workshops. The first workshop addresses the fundamentals of translational science, and using examples from previous submissions, helps attendees to understand what kind of translational research could benefit from the work of the OE, including the AT. The second workshop focuses on characteristics of successful AT applications. Through activities during the workshop, attendees narrow down their problem and solution statements and consider customer segments that might make for a more viable business model. The third workshop covers effective pitching strategies for succinctly answering the five core questions. Special emphasis is given to simplifying presentation slides, removing field-specific terminology, and narrowing the focus to the specific needs of the judges, as many first-time innovators with scientific and medical backgrounds tend to approach the innovation pitch in similar ways they approach scientific presentations. Additionally, each selected AT finalist receives several hours of one-on-one and team-based coaching from OE members leading up to the day of the AT itself. Throughout this process, participants and their innovations are introduced to tools such as the Lean Startup Methodology, Business Model Canvas, and Value Proposition Canvas [Reference Ries17–Reference Osterwalder and Pigneur20].
Judges evaluate pitches on the quality of the responses to the five core questions, using a five-point Likert scale with four criteria for each question (relevance, clarity, evidence, pitch-craft). The presence of a disclosure, prototype, and preliminary data was documented, but not weighed.
By training and developing innovators, institutions foster a culture of innovation among clinicians, scientists, students, and staff. In doing so, they help secure and implement best practices, meet patient needs, leverage their innovation ecosystem over the long term, and promote more efficient, integrated translation [Reference Jackson, Gabriel, Pariser and Feig6,Reference Collins, Reizes and Dempsey12]. This goal underlies the design of the AT, with its strong emphasis on experiential training.
Methods
Initial data collection
Demographics (team and team member names, departments, academic rank, gender) and information on innovations (presence of prototypes, disclosures, and preliminary data) were collected through self-reporting during the application process and confirmed in follow-up conversations and interviews. Data was collected and stored using Microsoft Office 365 Forms and Excel.
TRL calculation
In healthcare, technology transfer offices use adapted technology readiness levels (TRL) frameworks to evaluate pharmaceuticals, medical devices, and related systems [Reference Salvador-Carulla, Woods, De Miquel and Lukersmith21]. A modified TRL value was calculated based on the presence of a disclosure (+1 point), prototype (+1 point), and preliminary data (+1 point). A + 1 offset was used to differentiate innovations with none of the above supporting developmental milestones from innovations with missing data. TRLs thus ranged from 0 (missing data) to 4 (disclosure, prototype, and preliminary data). Additional rationale for this particular TRL modification is provided in the discussion.
Disclosure and commercialization data
Mayo Clinic Ventures, an office within the Department of Business Development responsible for commercialization of Mayo Clinic intellectual property, provided high-level information on disclosure, patent, and commercialization status.
Data analysis
Microsoft Office 365 Excel was used for comparative analysis. Graphical design was performed in GraphPad Prism 10.4.0.
Post-Alligator Tank interviews
Twelve randomly selected stakeholders from the first to sixth edition of the AT were interviewed to learn about their experiences. Stakeholders included first-time and repeat pitchers, winners, judges, and individuals who supported innovators in pitch or innovation development. Interviews were conducted either virtually or in person. Due to the diversity and unique involvement of each interviewed stakeholder, the interviews did not follow a specific script. Feedback was transcribed, consolidated, and thematically analyzed. The most common suggestions from the stakeholder interviews are discussed.
Alligator Tank data and outcomes
Between 2017 and 2023, the AT consistently received more applications than available pitching slots, which stabilized at nine after starting with eight in the first year (Figure 1A). Over these seven years, 86 teams, comprising 246 team members (195 unique individuals), applied. Of these, 62 teams (191 team members, including 158 unique individuals) were selected to pitch. Some innovators applied successfully in multiple years, submitting either new innovations or refined versions of their previous ideas. A broad range of departments, including surgical, clinical, and research units, is represented (Figure 1B), with the Neurological Surgery department (comprising Neurological Surgery (hospital) and Neurosurgery (research)) having the largest representation (33%). At Mayo Clinic Florida in 2023, there were a total of 107 departments, including research and medical. Over the last 3 of the years analyzed in this study, there have been a total of 24 different departments represented within the teams at AT. Of the 62 innovations pitched, 63% (39) were categorized as medical devices, 6.5% (4) diagnostic materials, 19% (12) digital software, 6.5% (4) non-medical devices, and 5% (3) research devices.
AT department and rank information A) number of applicants and pitchers per year of AT. B) pie chart showing the percentage breakdown of pitchers (team lead) and their department affiliations. C) pie chart showing the percentage breakdown of the academic rank of each winner over all years of AT. D)Percentages of further breakdown of what program/rank the student winners were affiliated with. E) ratio of males to females on each winning team broken down by year of AT. For all panels, the numbers to the right of the percentages in the parentheses note the number of individuals.
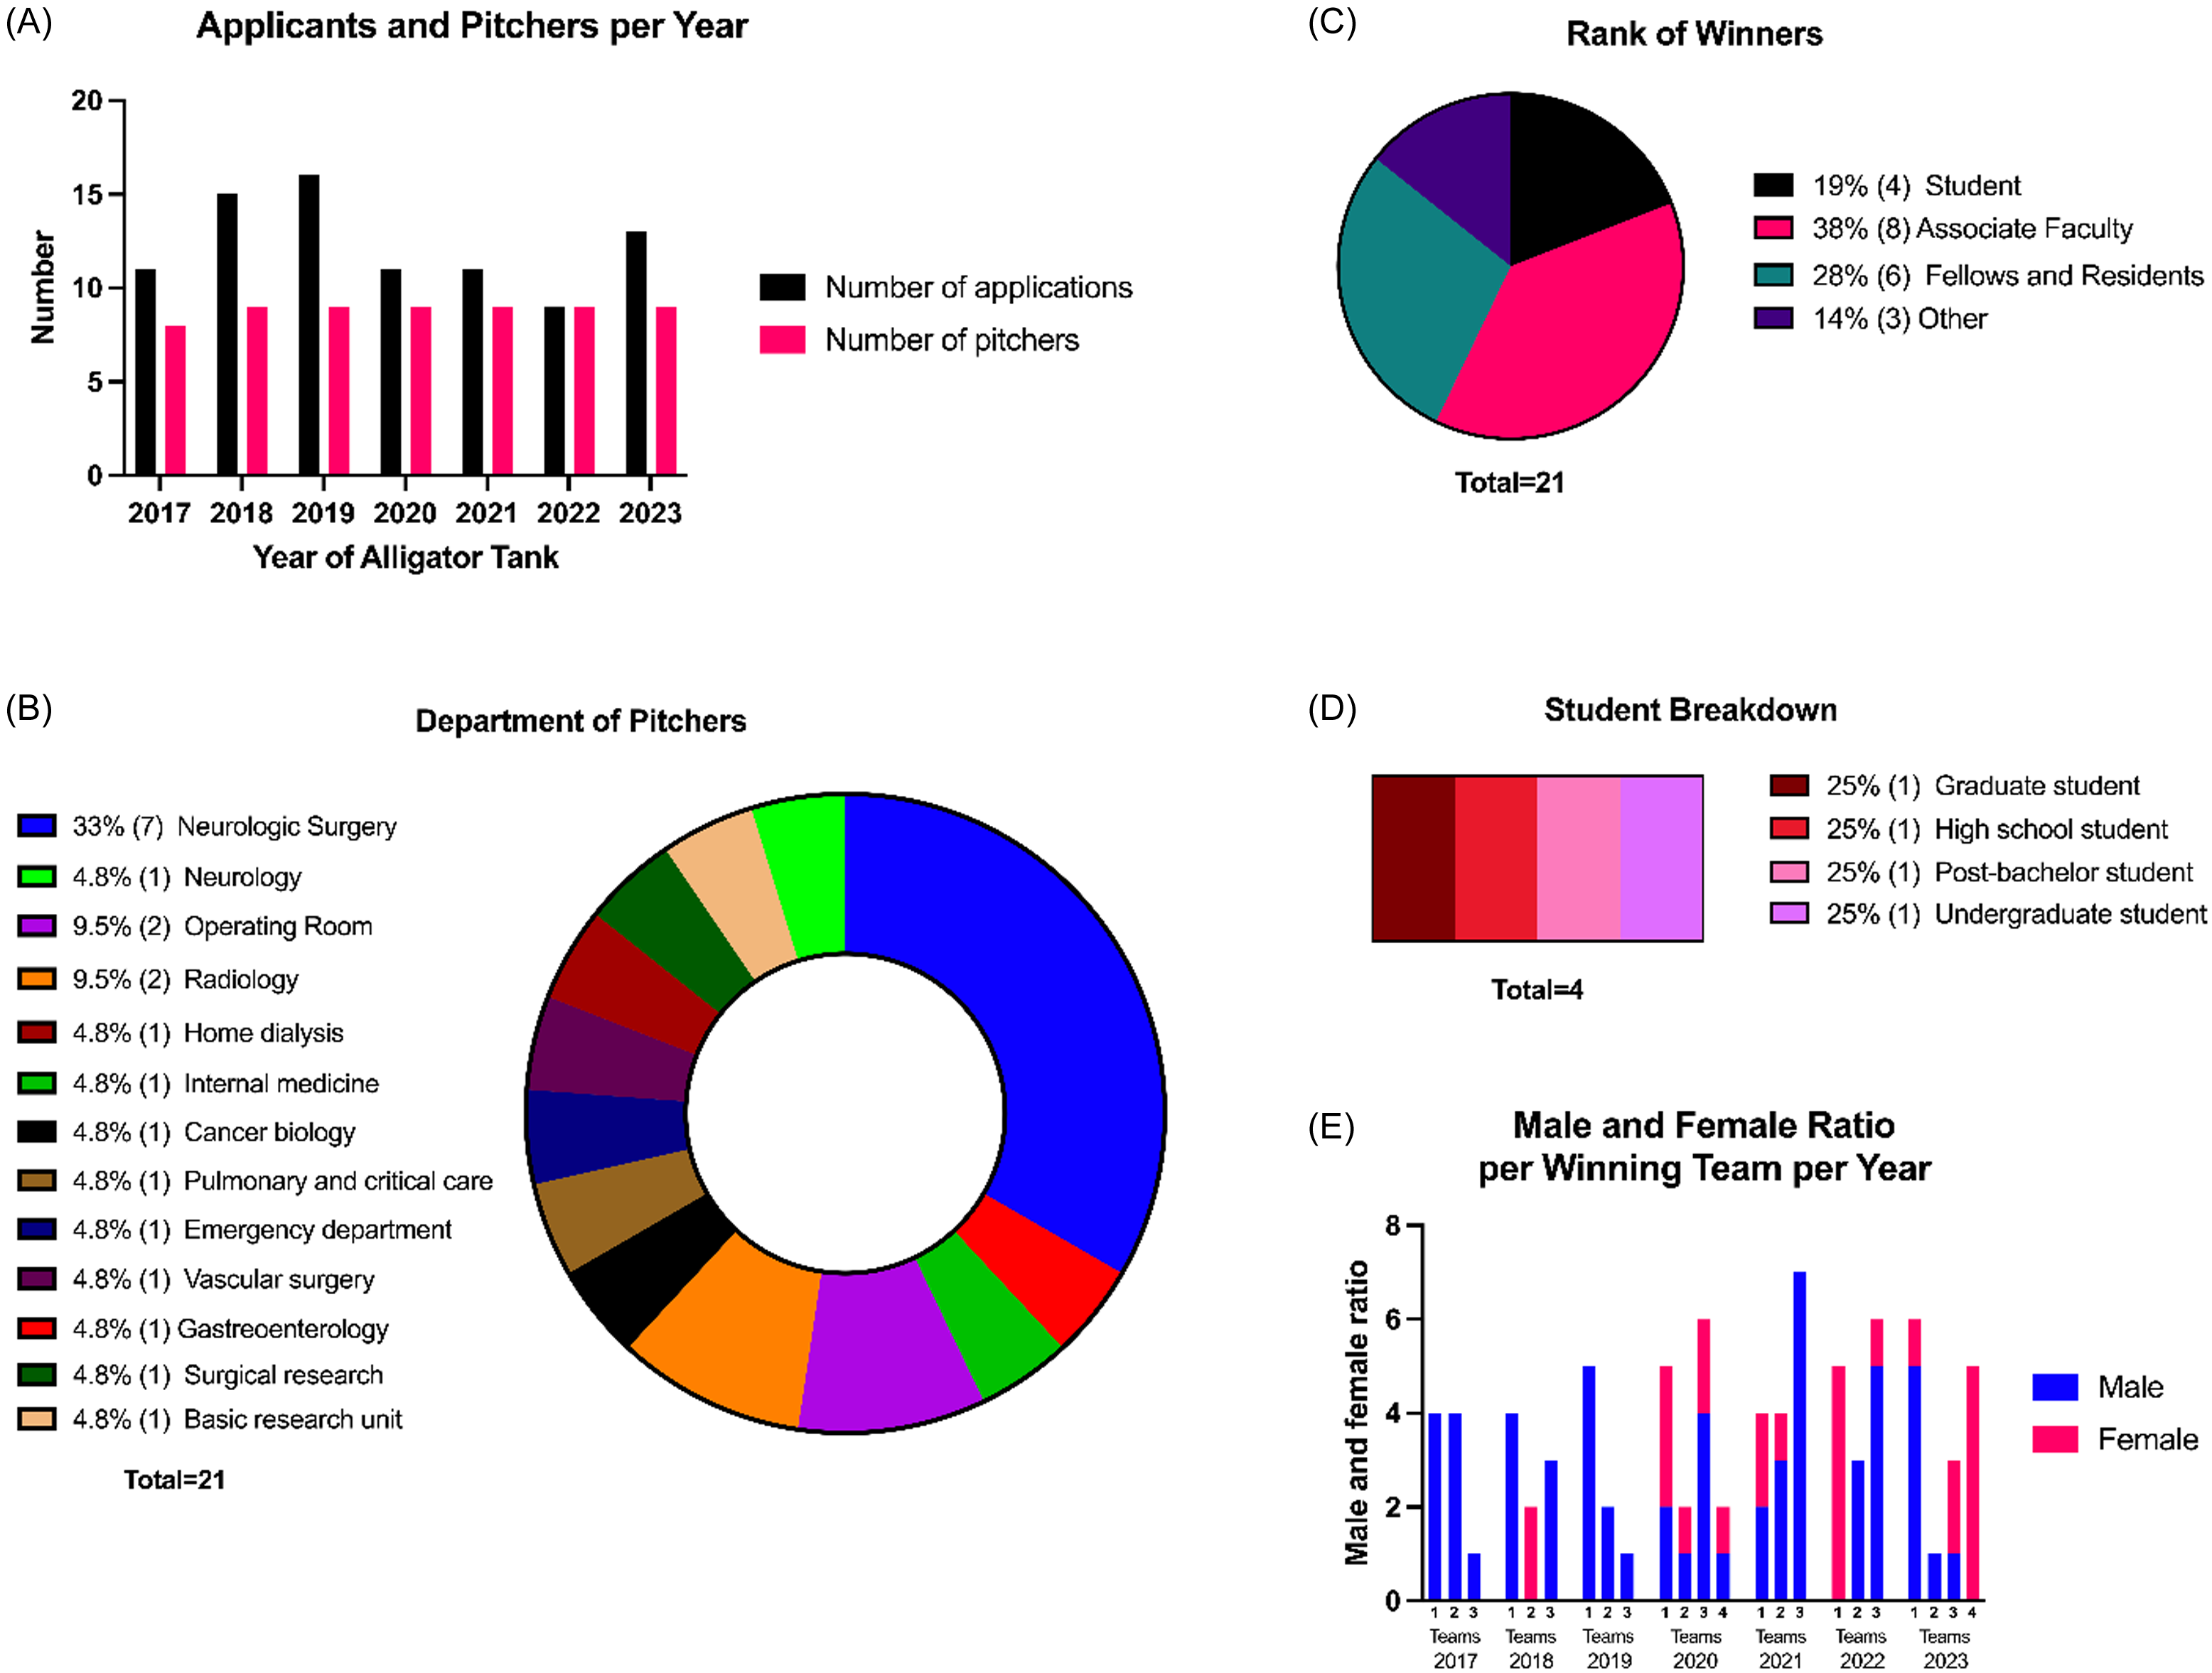
Academic ranks of each team lead varied from students (22%), associate faculty (35%), fellows and residents (26%), and other (17%) (Figure 1C). The student category ranges from high school to graduate-level participants (Figure 1D). Although Mayo Clinic does not have its own high-school or STEM undergraduate program, the institution hosts students throughout the year in various internship programs.
The number of members on winning teams varies annually, ranging from one to seven (Figure 1E). No correlation was observed between team gender distribution and winning outcomes. For instance, in 2017 and 2019, all winning teams were male, while in other years, winning teams included all-male, all-female, and mixed-gender groups.
TRL data were collected from the selected teams each year, except in 2017 (Figure 2). Every year, except for 2018, there were more teams that had pre-disclosures but did not win (22%–44%) compared to teams that had disclosures and did win (11%) (Figure 2A–B). Among teams pitching between 2020 and 2023, only 44% had preliminary data; of the winning teams during these years, just one team per year in 2020 and 2021, and two teams each in 2022 and 2023, had preliminary data (Figure 2C–D). Notably, each year at least one winning team lacked preliminary data.
Components of assigned TRL A-B) the number of teams per year that pitched an innovation that was disclosed, and won or did not win AT, respectively. C-D) the number of teams per year that pitched an innovation in which they collected preliminary data for, and won or did not win AT, respectively. E-F) the number of teams per year that pitched an innovation had a prototype, and won or did not win AT, respectively. G-H) the number of teams per year that had the assigned TRLs of minimal, low, mid, or max, and whether they won or did not win AT, respectively. For each graph, the number within each bar represents the number of teams.
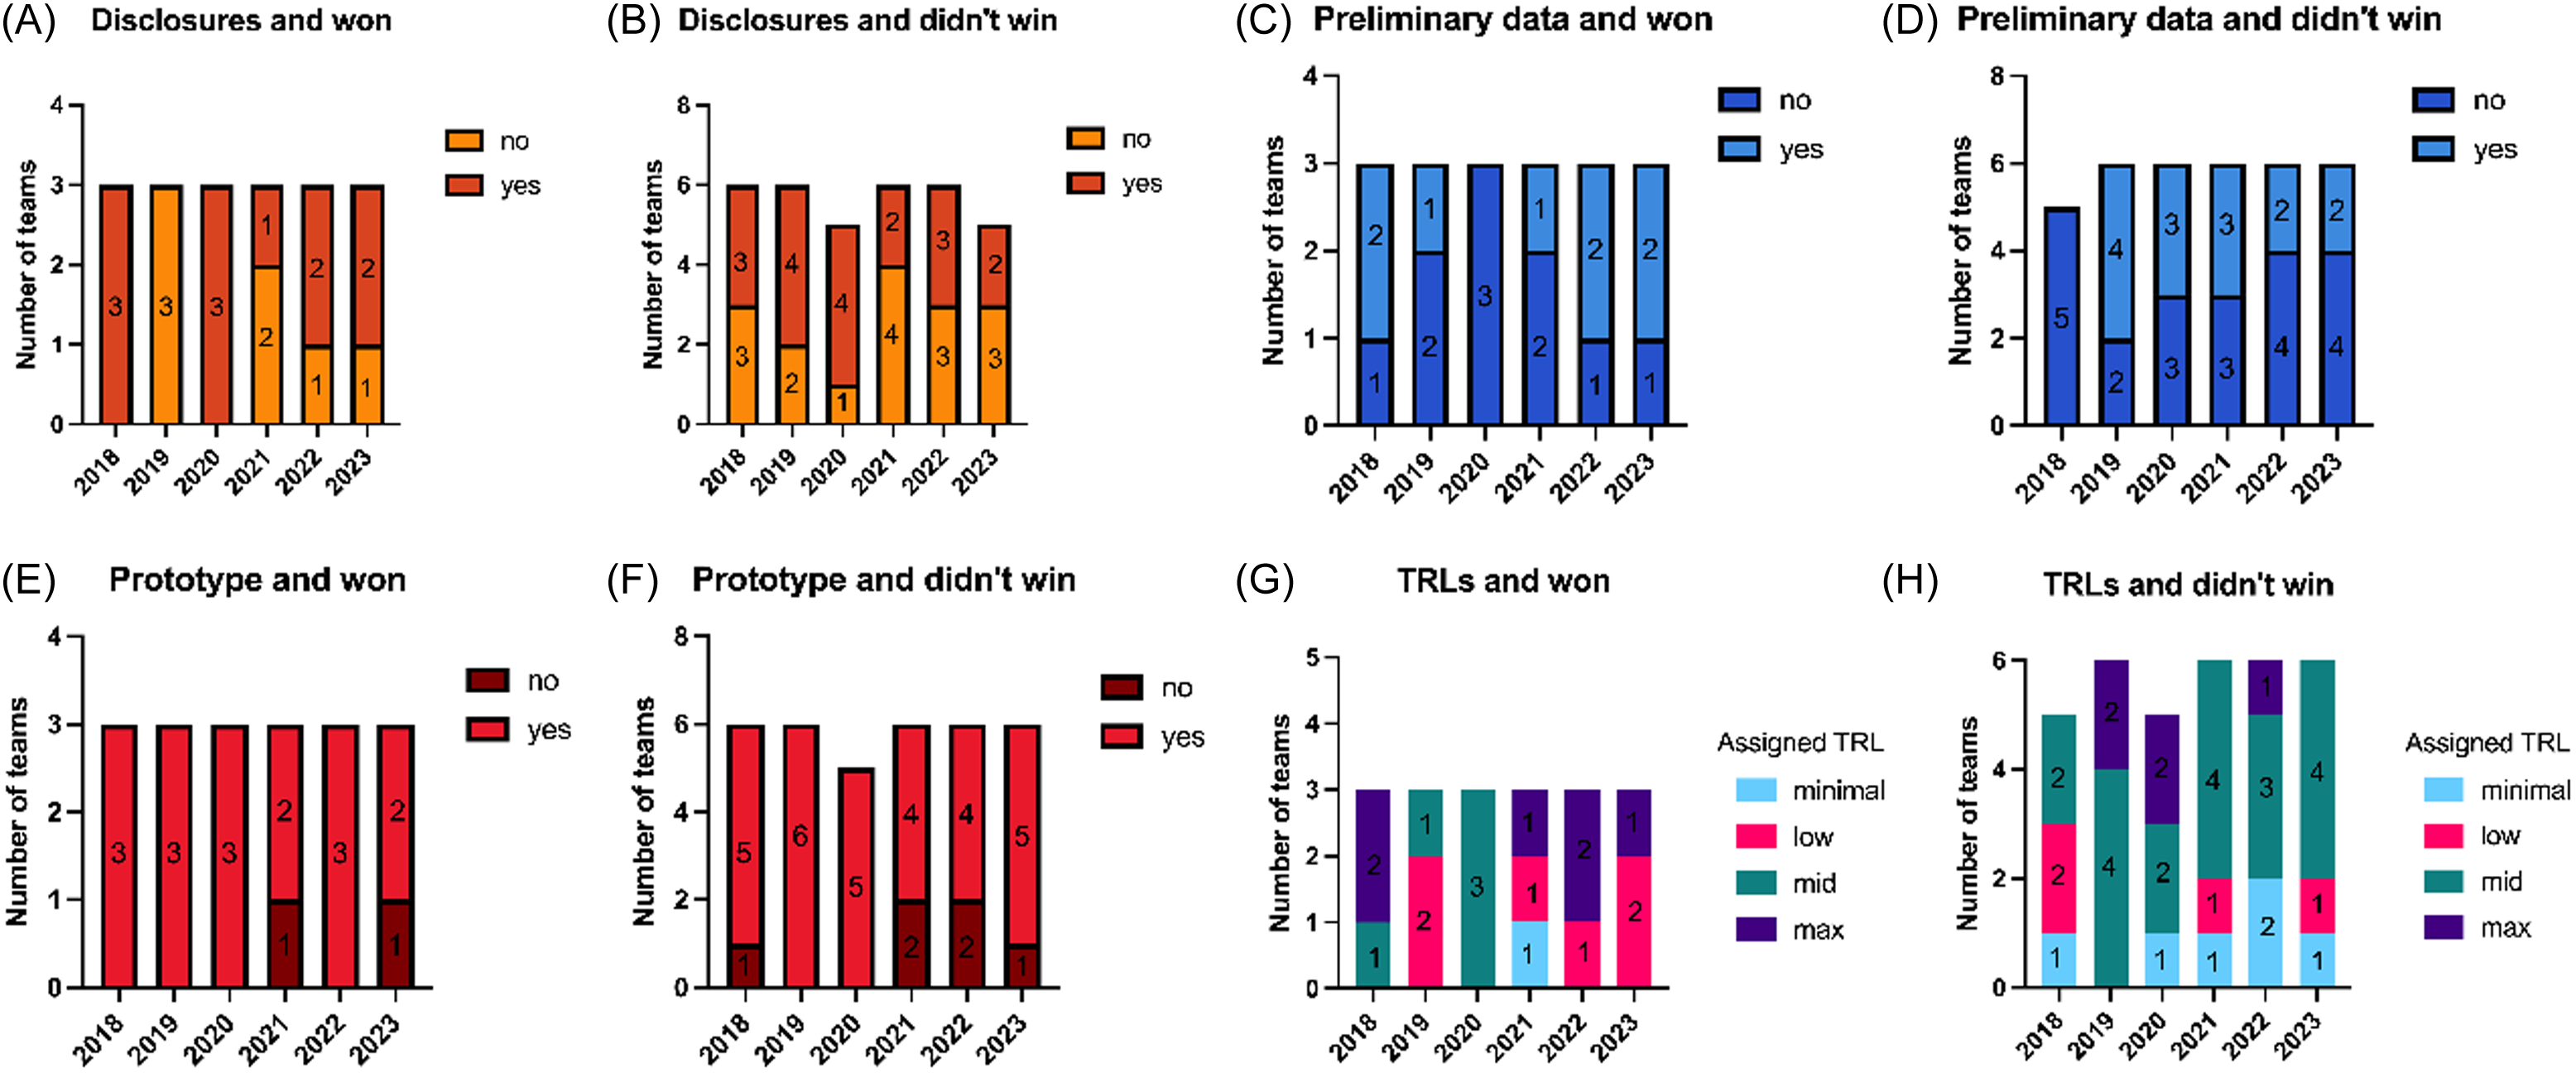
At least 67% of pitchers presented a prototype, and all winning teams, except one in 2021 and one in 2023, had a prototype. From 2018 to 2023, seven winning teams possessed all three TRL components—pre-disclosure, prototype, and preliminary data (a TRL of 4)—before their pitch, and one winning team lacked all three (Figure 2G). During the same period, five teams with all three TRL components did not win in their respective AT year (Figure 2H).
Between 2018 and 2023, there were a total of 54 pitches and the team leads of 28 teams had filed innovation disclosures at Mayo Clinic Ventures (MCV) before their pitch. After the AT, the number of team leads with disclosures increased to 37 (Figure 3A). Due to incomplete information, disclosure data from 2017 was omitted from the analysis.
Impact of disclosures and winning likelihood. A) the number of pre-disclosures and post-AT disclosures, summed across all years (total n = 55). B) the winning likelihood broken down into the percentage of teams that declared a pre-disclosure and won AT compared to the percentage of teams that declared a pre-disclosure and lost. C) the total number of winning teams, broken down into the number of these teams that had pre-disclosures, and how many of those winning teams then submitted a disclosure post-AT. D) the total number of winning teams, broken down by if the team leads of each team had>1previous disclosure or no previous disclosure and how this related to likelihood to win AT. For all panels, the numbers to the right of the percentages in the parentheses note the number of individuals.
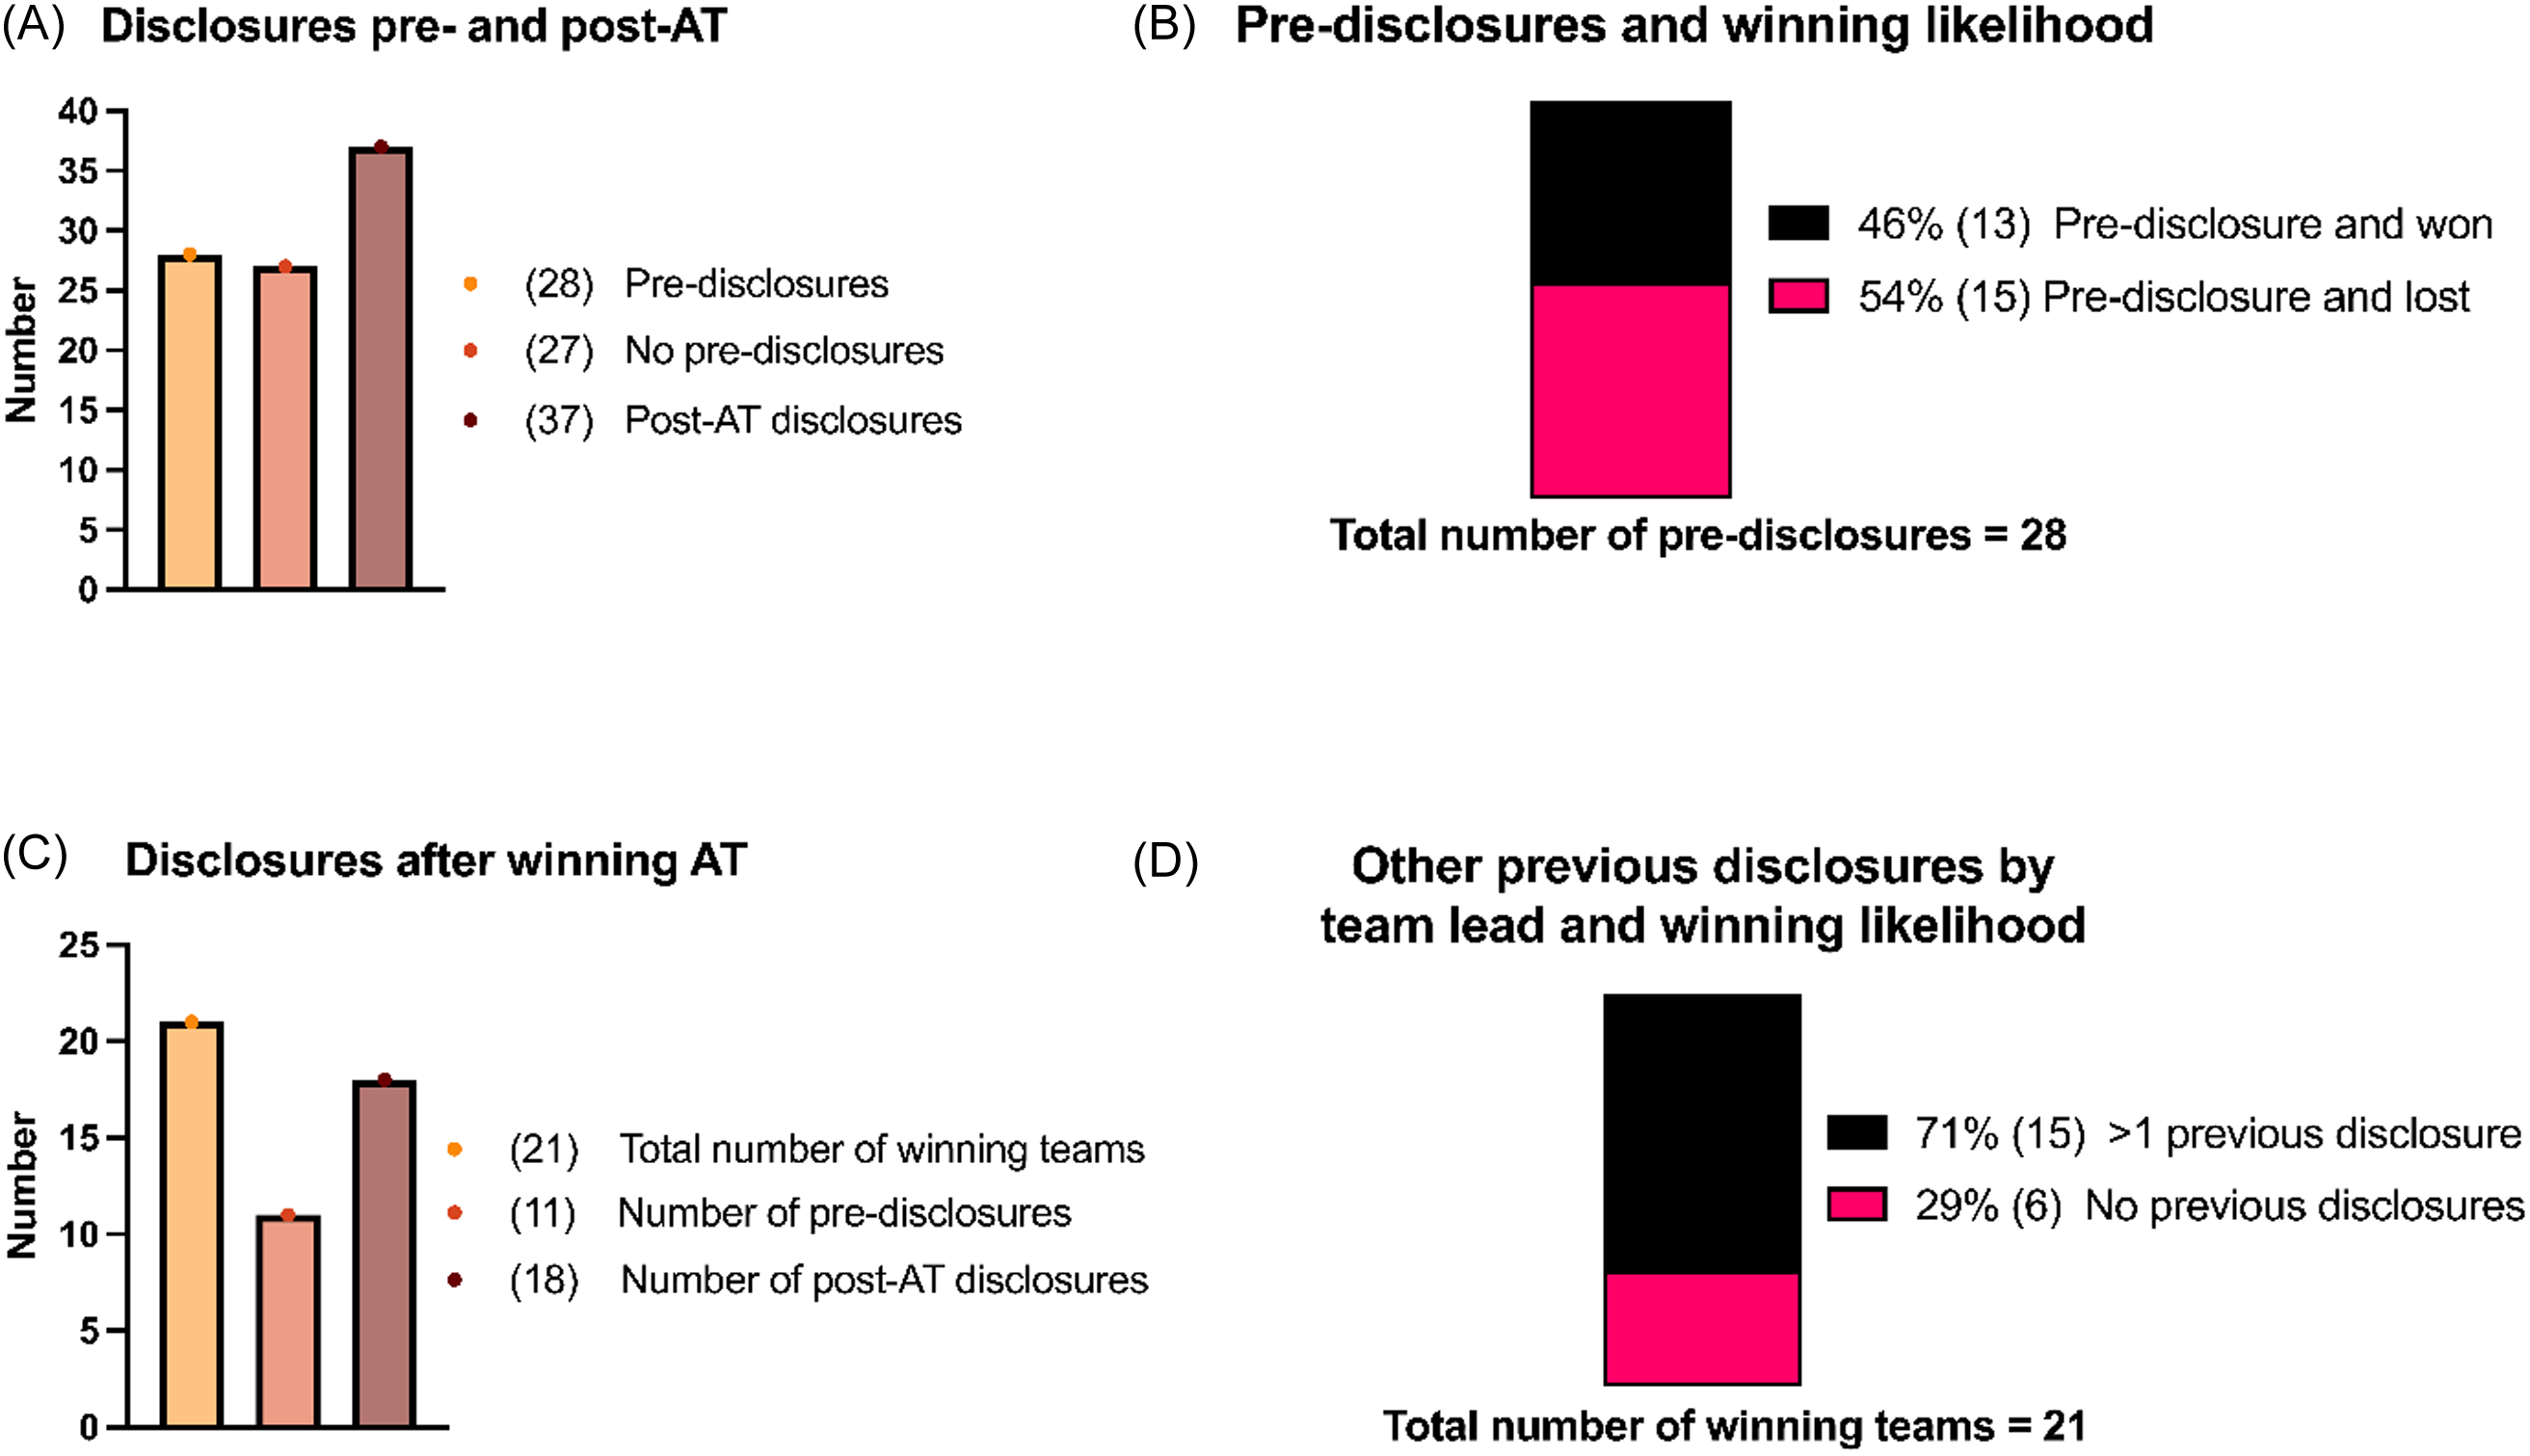
Among the 28 teams with prior disclosure experience, just under half won their edition of the AT (Figure 3B). Of the 21 winning teams analyzed over six AT editions, 11 had disclosure experience before their pitch. Following the AT, 7 additional winning teams filed one or more disclosures (Figure 3C). Notably, nearly three-quarters of team leads who won their AT edition had more than one disclosure on record at MCV prior to presenting (Figure 3D).
Interviews with the twelve randomly selected stakeholders revealed an overall positive experience innovating at Mayo Clinic Florida and participating in the AT. Constructive feedback repeatedly covered the following three themes (1) a lack of protected time reduces ability to participate and progress innovation, (2) one competition with varying innovator experience, innovation maturity, and innovation types reduces the confidence of new innovators, and (3) unmanaged expectations for innovation processes and events, in particular that winning the competition does not necessarily equal future commercialization of the innovation.
Alligator Tank case story: IV Safe Lock
One successful outcome from the AT is the IV Safe Lock device. Developed by Kara Bragg, DNP, and Michael Albus, MD, this device prevents accidental self-administered overdoses by emergency department patients by blocking access to intravenous catheter ports [Reference Bragg, Albus, Bragg, Beste and Simon22]. In preparation for the AT and with the support of the above-mentioned programs, the team refined their problem statement, aligning it with validated customer needs and clearly connecting the strength of the solution to those validated needs.
After Bragg won the 2020 AT, through which the innovation received broad internal exposure, the team received follow-on support in navigating the complex internal innovation ecosystem. In an interview, Bragg highlighted the importance of having institutionally offered support from the OE and the technology transfer office and a supportive network of individuals trained in engineering and business. Following the AT, IV Safe Lock received a patent, successfully completed a clinical trial, and licensed its intellectual property to a commercial development partner [Reference Bragg, Albus, Bragg, Beste and Simon22]. This trajectory exemplifies how the AT’s entrepreneurial training and institutional support can accelerate the maturation and commercialization of medical innovations.
Discussion
This study outlines one of the first successful innovation training models for a nontraditional medical or research-heavy system. The AT fosters interdisciplinary innovation by attracting a diverse range of innovators from multiple departments and academic ranks, including students. This diversity reflects the quality and general adaptability of training provided by the OE. Pitch competitions can foster an innovation culture, but they must be thoughtfully structured and guided to ensure meaningful outcomes. For example, judges and participants need clear guidance on event expectations and outcomes, TRL definitions should be standardized if used for assessments, and the fact that prototype availability exerts greater influence on winning the event than other TRL indicators should be accounted for. Recommendations for improving the pitch competition, the broader ecosystem, and overall innovation processes are discussed.
Since 2017, the AT has provided innovators with a platform to pitch their medical inventions. Over that time, 86 applicants and 62 teams have participated. Despite attracting participants from a range of academic ranks and encouraging departmental diversity, the event sees limited engagement from nonclinical innovators (e.g., administrative staff, billing and coding experts, information management specialists, and IT professionals). To cultivate an enterprise of seasoned innovators, all segments of the healthcare ecosystem must be encouraged to engage in ecosystem building events like AT. Introducing discipline-specific pitch events, or categories within events, could encourage participation among nonclinical innovators who may feel intimidated when competing against physicians and scientists, who often receive greater recognition in healthcare settings, as relayed during some of the post-AT interviews. This discrepancy resulting from constructs of status may impose a barrier to enterprise maturation. Offering specialized avenues for these innovators can create more opportunities to pitch, access winning incentives, and ultimately enhance the scalability of innovation.
The department of neurological surgery contributed many applicants. One reason could be the vocal support for innovation by the department chair during the analyzed years, which fostered a culture that expected participation in innovation opportunities. Additionally, the Tank’s lead organizer—who had postdoctoral experience in the department—helped build early, strong connections and word-of-mouth support, ultimately resulting in more applicants, even though an independent panel selected the finalists. These explanations point to the importance of relationships fostering innovation participation.
Students making up a substantial pool of the winning teams suggest a strong AT training model and the dedication of the OE to prepare the pitchers on how to best present their idea. The prominent success of student-led teams highlights the inclusive nature of the AT, which welcomes innovations irrespective of academic rank or tenure status. Observing students succeed alongside physicians, tenured faculty, and established innovators reinforces the institution-wide emphasis on nurturing innovation.
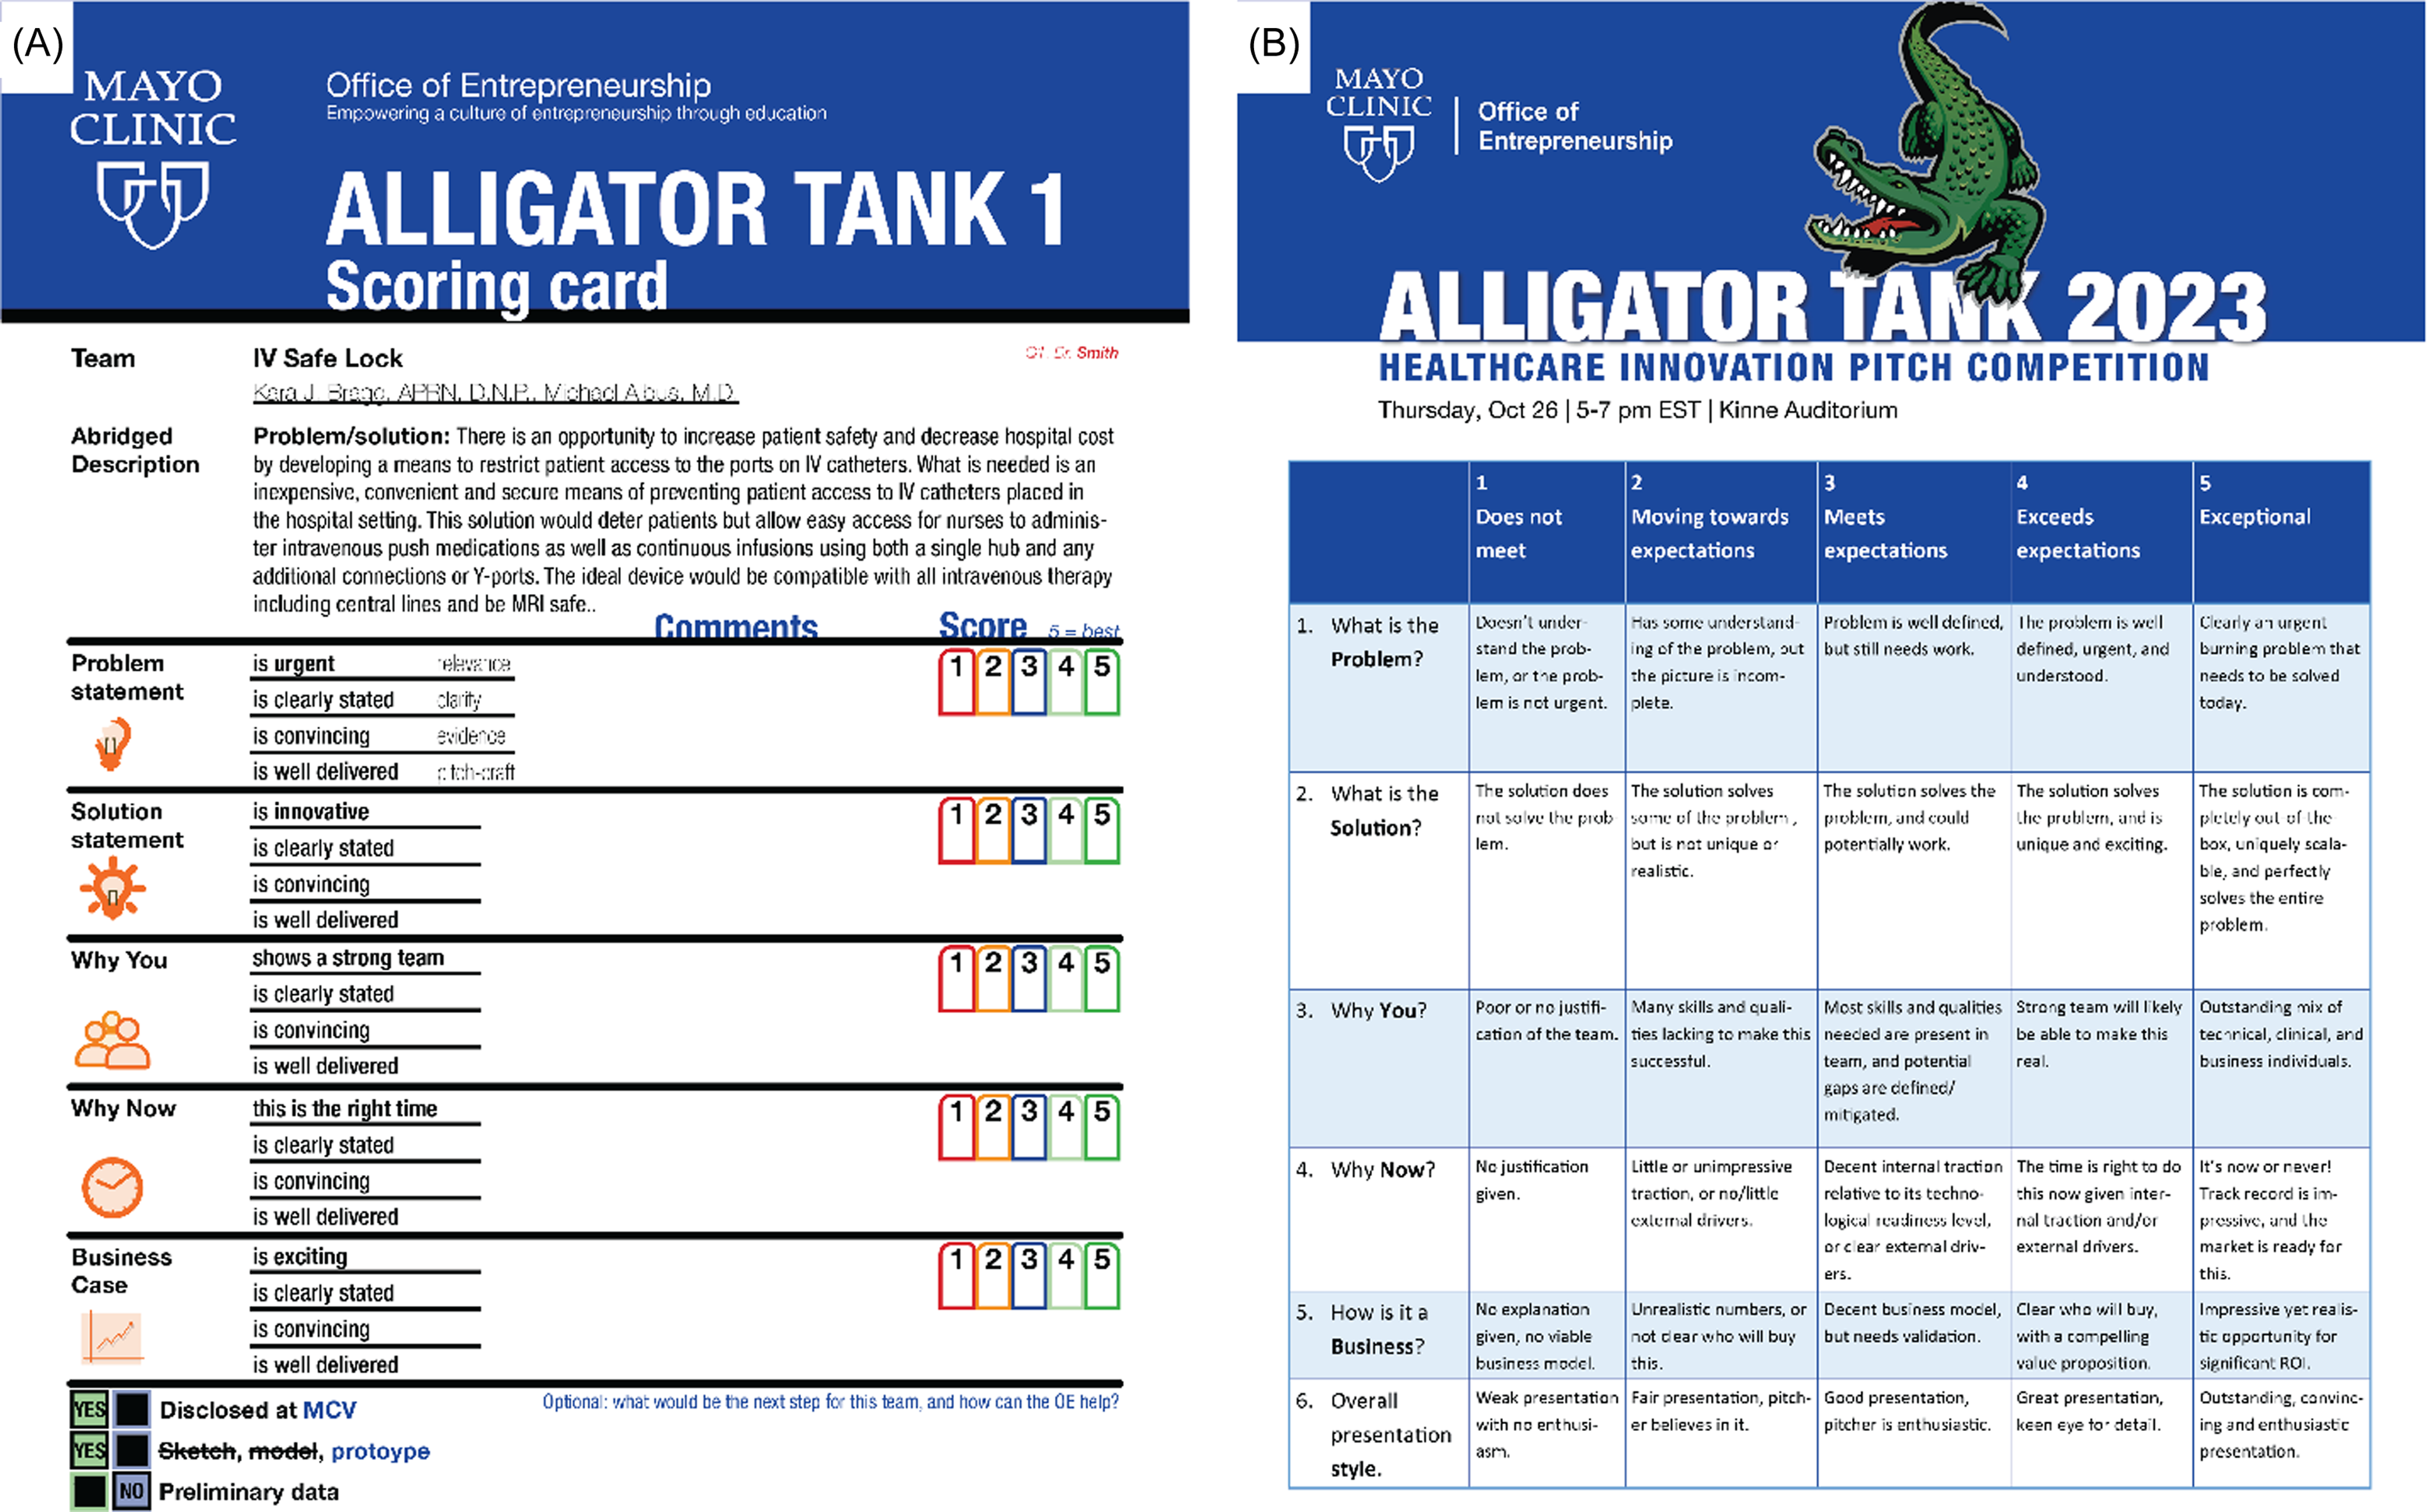
Ensuring judges fully understand the scoring criteria for the five core questions is crucial for minimizing subjectivity. Over time, the judging rubric has been refined based on experience and feedback, and recent iterations include clearer explanations of how to assign scores and interpret the Likert scale, providing a unified standard (Figure 4). Further reducing bias could involve rotating judges annually, if institutional size permits. Moreover, judges should remain internal or sign NDAs to safeguard intellectual property.
Unified scoring rubric. A) the judges receive an abridged description of the problem and proposed solution, to quickly orient them as they judge and while they deliberate after the event. The five core questions are clearly outlined, as well as the 4 sub-categories on which to base the likert-scoring. This format is uniform for all teams, the example provided is based on the described case study of IV safe lock. B). Based on the feedback of the judges over the years, a specific rubric was developed which makes the likert-scoring both easier and more uniform.
Additionally, event satisfaction depends on ensuring that pitchers understand the commercialization pathway for their specific inventions. Winning a pitch competition does not necessarily increase commercialization prospects or guarantee a patent. Based on one of the most recurring themes observed in the stakeholder interviews, future pitch competitions should be explicit regarding the relationship between participating in competition and winning outcomes. Another feedback-based consideration is realistic time allocation for institutional innovation vision. Post-AT interviews indicated that inadequate protected time in particular limits the development and progression of novel ideas.
The relationship between a strong TRL—defined here as having a pre-disclosure, a prototype, and preliminary data—and winning the AT was also evaluated. Of these three TRL indicators, having a prototype emerged as the most influential for pitching success. However, neither pre-disclosures nor preliminary data alone, nor even all three factors together, guarantee a winning outcome; the training and quality of the pitch itself play a more critical role.
Originally developed by NASA in the 1970s, TRLs were later adopted by various U.S. and European funding agencies. They became standardized when the International Organization for Standardization published the ISO 16,290:2013 standard [Reference Héder23]. The TRL spans 9 levels, from basic observations without technologic concepts (TRL 1) to actual systems proven in operational environments (TRL 9). Generally, once a healthcare innovation reaches TRL 5, it can no longer rely solely on the innovator in a pure healthcare delivery and clinical research setting. At TRL5, critical components of healthcare innovations need to be verified in clinically relevant environments and typically require substantial financial investments. At this stage, identifying a commercialization partner is often necessary to support subsequent steps, including clinical trials.
While the classical TRL scale is recognizable, it does not fully capture the nuances of medical innovations showcased at the AT. Therefore, a more systematic TRL approach was developed for this study, as described in the Methods, to accommodate the variability among different types of medical innovations (e.g., systems, devices, and therapeutics). Judging criteria do not weigh the modified TRL, they only consider the pitch and the answers to the five core questions, so this number is used primarily as a reference for outcome assessment. Moreover, commercialization is contingent upon many factors beyond TRL. A high TRL indicates a more advanced development stage and suggests potential future milestones rather than guaranteed market maturity [Reference Salvador-Carulla, Woods, De Miquel and Lukersmith21].
Although the AT does not require a prototype, and there are no explicit prototype criteria, it can be difficult for judges to discount the influence of a prototype on their assessment, potentially introducing bias against innovators at different TRL stages. While a prototype alone does not ensure commercialization potential, “making it real” through prototyping demonstrates feasibility and credibility [Reference Cook, Bikkani and Poterucha Carter13,Reference Ries17], though the degree of influence varies [Reference Deininger, Daly, Lee, Seifert and Sienko24,Reference Wessel, Thies and Benlian25]. In the interviews, multiple stakeholders have suggested separating TRLs or requiring a prototype, given that more than two-thirds of pitchers already use one. Introducing a “tiered” design to the competition by TRL, innovator experience, or application within a research or clinical setting may create a more equitable environment. Although current data indicate that maturity does not correlate with winning, this adjustment could encourage broader participation and enhance the competition’s accessibility.
Limitations and future directions
This study’s data collection was primarily post hoc, and given the complexity of commercializing medical innovations, it remains challenging to assert that participating in an internal innovation competition directly leads to individual commercial success. While thorough training helps level the playing field between junior and senior innovators, the long-term impact of these innovation programs warrants extended evaluation. Another potential avenue of inquiry is whether hosting internal events like the AT influences the recruitment and retention of top innovation talent, a marker of development of the institution’s innovation culture. To explore these possibilities, proactive and continuous communication among training providers, event organizers, the technology transfer office, and Human Resources needs to be established and maintained over a significant longitudinal period.
Additionally, the composition and influence of the audience attending these events have not been closely examined. While it is mentioned that the attendance of institutional leadership is crucial to its impact, it is not unimaginable that the audience is strongly influenced in the culture of innovation. Future research might investigate whether merely attending events fosters greater innovation propensity. Similarly, assessing whether attendance by departmental or institutional leadership translates into increased allocation of protected time for innovators – a key barrier identified in promoting innovation – could offer valuable insights.
Moreover, as the AT matured, OE wanted to introduce another accolade that pitchers competed for: “crowd favorite.” This accolade was only introduced from 2020 on and was solely awarded based on the amount of votes each team received from audience members. With this methodology comes inherent bias, as the amount of votes each team received is directly influenced by how many audience members were in attendance to support a specific team. Additionally, these votes were collected using an online form, which may not have limited the voters to the audience members in the room. For these reasons, we have decided to exclude the “crowd favorite winners” from our data and observations. In the future, we recommend a robust way to unbiasedly have audience members vote for their favorite teams.
MCF OE’s innovation strategies are intended to be adopted and modified to fit the frameworks of various nontraditional medical systems and research-heavy organizations, as hospitals model a traditional research and development company heavily reliant on efficient output procedures [Reference Jankowski and Gault26]. Presently, there is limited literature on internal pitch competitions, and none specifically on individual innovation events within a medical institution. This study seeks to stimulate discussion about which innovation and entrepreneurial support models lead to the most accessible commercialization pathways.
Conclusion
The AT competition at Mayo Clinic Florida demonstrates how integrating entrepreneurial principles into a clinical environment can drive meaningful innovation. By combining structured pitch events with hands-on training, mentorship, and resources, the OE equips healthcare innovators with the skills necessary to translate their ideas into tangible patient-centric solutions. The AT experience encourages participants to embrace diverse perspectives, moving beyond traditional organizational hierarchies and fostering a sense of inclusivity and collective problem-solving. Notably, a wide array of participants—ranging from students and junior faculty to seasoned clinicians—have succeeded in this environment, highlighting that impactful innovation can arise from any level, department, or professional background.
Through this inclusive and engaging framework, the AT promotes a culture that values entrepreneurial thinking as much as clinical and research expertise. By doing so, it creates an internal ecosystem where innovators understand not only the scientific and clinical aspects of their work but also the commercial and strategic dimensions necessary for successful translation. This approach helps ensure that new healthcare solutions are poised to meet genuine market and patient needs, ultimately accelerating the path from bench to bedside.
Moving forward, continuous refinement of judging criteria, clearer guidance on commercialization pathways, and greater support for protected innovation time may further enhance the impact of such competitions. Replicating or adapting the AT model offers a blueprint for healthcare institutions worldwide, encouraging them to integrate entrepreneurial training into their core strategies to foster sustainable innovation ecosystems.
Acknowledgements
The authors would like to thank the Mayo Clinic Office of Translation to Practice and Mayo Clinic Ventures for providing feedback, insights, and high-level disclosure data for AT pitchers. We would also like to thank the Mayo Clinic Summer Undergraduate Research (SURF) program and St Catherine University’s Katies for Aging Research and Equity (KARE) program for facilitating the opportunity for undergraduate students to perform clinical translational science research at Mayo Clinic. Finally, the authors thank the stakeholders and participants for their candid feedback provided during post-AT interviews and follow up conversations.
Author contributions
Shavonnye Rath: Conceptualization, Data curation, Formal analysis, Investigation, Methodology, Visualization, Writing-original draft, Writing-review & editing; Marissa Russo: Conceptualization, Data curation, Formal analysis, Investigation, Methodology, Resources, Visualization, Writing-original draft, Writing-review & editing; Maarten Rotman: Conceptualization, Data curation, Formal analysis, Funding acquisition, Investigation, Methodology, Resources, Visualization, Writing-original draft, Writing-review & editing.
Funding statement
During some of the years of the AT reported in this publication, the Mayo Clinic Office of Entrepreneurship was supported by Grant Number UL1 TR002377 from the National Center for Advancing Translational Sciences (NCATS). Some of the research reported in this publication was supported by Grant Number R25 AG060892 from the National Institutes of Health (NIH) through the KARE Program. The contents of this publication are solely the responsibility of the authors and do not necessarily represent the official views of the funding institutions or the affiliated institutions of the authors.
Competing interests
The authors declare none.


 Open access