

Despite composing a large and growing share of the voting-eligible population (Budiman Reference Budiman2020; Igielnik and Budiman Reference Igielnik and Budiman2020; Wong Reference Wong2017), racial and ethnic minorities continue to be underrepresented in American politics at the local (Hajnal and Trounstine Reference Hajnal and Trounstine2005; Hajnal et al. Reference Hajnal, Kogan and Markarian2022; Ricca and Trebbi Reference Ricca and Trebbi2022), state (Bump Reference Bump2021; Casellas Reference Casellas2010; Scola Reference Scola2007), and national levels (Lowande et al. Reference Lowande, Ritchie and Lauterbach2019). But, when minorities run for office, research has consistently found that they stand a great chance of winning (Fraga and Hassell Reference Fraga and Hassell2021; Gonzalez Juenke and Shah Reference Gonzalez Juenke and Shah2015; Scott Reference Scott2018; Shah et al. Reference Shah, Scott and Juenke2019). Scholars have proposed several explanations for this state of affairs. Prominent work has argued that the under-representation of racial and ethnic minorities is due to a lack of supply of candidates, and has focused on how electoral institutions and the demographic composition of districts shape the emergence of minority candidates (see, for example, Bejarano Reference Bejarano2013; Branton Reference Branton2009; Fraga et al. Reference Fraga, Juenke and Shah2020; Krebs Reference Krebs1999; Lai and Geron Reference Lai and Geron2006; Marschall et al. Reference Marschall, Ruhil and Shah2010; Phillips Reference Phillips2023, Reference Phillips2021; Shah Reference Shah2014; Shah et al. Reference Shah, Scott and Juenke2019; Tolley Reference Tolley2019; Trounstine and Valdini Reference Trounstine and Valdini2008). While such work has been instrumental in advancing our understanding of the drivers of minority representation, we turn our focus to a crucial and under-researched factor behind the supply of minority candidates: racial and ethnic minorities’ own political ambition.
If there exists a racial gap in political ambition, then continuing to study the individual-level determinants that shape such ambition—or willingness to run for elected office—is urgently needed. In previous work on the drivers of candidate emergence, this trait has been termed nascent ambition (Fox and Lawless Reference Fox and Lawless2005, 644). Over the last twenty years, extant research on the US has yielded mixed results. Older studies find that some minorities exhibit a lower willingness to run for office (Fox and Lawless Reference Fox and Lawless2005), though more recent studies find that racial and ethnic minorities report levels of interest in running for political office that are at times on par with White Americans (Scott and Collins Reference Scott and Collins2020; Shah Reference Shah2014).
Racial and ethnic gaps in latent candidates’ interest in running for political office, be it due to differences in socialization, expectations of encountering bias, or some other reason, would be an important piece of information in the quest for a fuller account of minority underrepresentation. Most importantly, if minorities are as or even more interested in running for office as Whites, this instead suggests that it is external obstacles, not individual differences in political ambition, that explain the lack of representational parity.
Our paper builds on previous studies in two ways. While past work has studied the office-seeking ambitions of racial and ethnic minorities, there are several reasons why revisiting these questions is needed. First, earlier work focused almost exclusively on elite segments of the population (e.g., those working in “springboard professions” (Fox and Lawless Reference Fox and Lawless2005), already elected politicians (Stone Reference Stone1980), and judges (Jensen and Martinek Reference Jensen and Martinek2009)). This focus on mid- or late-career professionals overlooks broad swaths of the population, not the least the young, who are more racially diverse than their older counterparts in the US (Deckman Reference Deckman2024; Frey Reference Frey2018), and who are galvanized into political action, including participation in protest movements (Chenoweth et al. Reference Chenoweth, Hamilton, Lee, Papageorge, Roll and Zahn2022, see Table A2).
Second, these studies were also carried out before important watershed moments in recent American political history. Political activism and leadership by racial and ethnic minorities have become increasingly visible during the 2000s. And, recently, movements advocating immigrant rights (Wallace and Zepeda-Millán Reference Wallace and Zepeda-Millán2020) and racial justice (e.g., Towler et al. Reference Towler, Crawford and Bennett2020), such as the Black Lives Matter (BLM) movement, have gained renewed traction. Previous work was largely conducted before the 2020 BLM protests in the wake of the George Floyd murder, which recent research has argued to be a powerful and mobilizing force for racial minorities (e.g., Gillion Reference Gillion2020).
While race is undoubtedly a critical factor in understanding political behavior and ambition, age also plays a vital role, particularly in mobilizing younger Americans of color and shaping their political attitudes. Beginning in the 1960s, often considered the decade of student protests, young Americans protested at voter registration drives, sit-ins, for racial equality and civil liberties, and against wars (Johnson and Feinberg Reference Johnson and Feinberg1980). Today, youth-driven movements such as those for racial justice and climate action, among others, continue to highlight the unique role of young people, not the least youth of color (Collins Reference Collins2021; Kenway and Maher Reference Kenway and Maher2024; O’Brien et al. Reference O’Brien, Selboe and Hayward2018; Vélez et al. Reference Vélez, Huber, Lopez, De La Luz and Solórzano2008).
This mobilization is not without challenges; youth of color are more likely to encounter law enforcement during protests (Davenport et al. Reference Davenport, Soule and Armstrong2011). Yet, these experiences often serve as powerful moments of political socialization, fostering a deeper understanding of institutional racism and historic injustices, and imbuing young activists with a sense of agency to fight against exclusionary structures (Fine et al. Reference Fine, Finesurrey, Rodriguez, Almonte, Contreras and Lam2021). Research on BLM protests, for instance, shows that participants are not only more likely to identify as Black or Latino but are also younger on average compared to participants in other protest movements (Heaney Reference Heaney2022). Recent work, moreover, has found exposure to BLM protests to liberalize attitudes and reduce racial prejudice, particularly among younger Americans (Mazumder Reference Mazumder2019). These patterns highlight that age, along with race, is a crucial factor in shaping political engagement and suggest that youth activism serves as a pathway through which younger Americans of color are mobilized, socialized into politics, and empowered with the agency to act.
Given these broad trends, it is high time to revisit the issue of how minorities’ interest in running for office compares to that of Whites, and how age may intersect with race to shape political ambition. To address these gaps, we take the work of Scott and Collins (Reference Scott and Collins2020) as our launch pad. Scott and Collins (Reference Scott and Collins2020) studied interest in running for political office in a 2017 survey using a large and nationally representative sample of Black Americans. While their study is mainly focused on examining the factors behind variation in Black political ambition in the main text, they include a table in the Appendix (Table A3) where they compare levels of political ambition among Black, White, Asian, and Latino Americans. This comparison shows that White Americans are only slightly more interested in running for office than are Black Americans (Scott and Collins Reference Scott and Collins2020, see Table A3).
We draw on the 2020 Collaborative Multiracial Postelection Survey (CMPS), conducted on large oversamples of Black, White, Asian, and Latino Americans in the aftermath of the 2020 presidential election and the wave of protests related to racial justice and immigration reforms, which are currently important to minoritized communities. Our findings reveal notable gaps in nascent ambition between groups. Contrary to past research, Black and Latino respondents exhibit more nascent ambition than Whites.
To probe for the mechanisms that underlie the aforementioned racial differences in being inclined to consider running for office, we turn to the correlates of political ambition, exploring demographics, socio-economic status (SES), political interest and ideology, past political mobilization, as well as biographical theories of political engagement. Our analysis of these potential mechanisms reveals that most standard explanations for individual variations in political engagement cannot explain the racial gap in political ambition. Rather, this gap is more consistently explained with biographic theories (Fillieule and Neveu Reference Fillieule and Neveu2019) and theories from race and ethnic politics scholars (Scott Reference Scott2018; Scott and Collins Reference Scott and Collins2020). It is only when we look to participation in protests and rallies organized by movements advocating racial justice that we are able to shed some light on racial disparities in nascent ambition. This is because such engagement is highly predictive of nascent ambition, and because Black and Latino Americans have been disproportionally engaged in such movements.Footnote 1
Finally, motivated by our finding that the young are more interested in running for office, and a hypothesis that they also are more involved in movements for racial justice, we also conduct a generational analysis of participation in protests for racial justice and its implications for nascent ambition. Specifically, we find that the racial gap in nascent ambition is driven by younger cohorts and that this gap can be accounted for by their engagement in movements advocating racial justice. Our generational analysis, thus, affirms the mobilizing functions of recent movements for racial justice and demonstrates the importance of exploring how age intersects with race to shape office-seeking ambitions.
Previous Literature
This paper aims to provide an updated descriptive assessment of racial gaps in political ambition and to probe for the mechanisms that underlie any such gaps. This section, therefore, reviews the literature on race and political ambition and the determinants of political ambition. Because our analyses highlight age as a key moderating factor, we also review the literature on how younger racial and ethnic minorities are uniquely socialized into political activism and protest.
Though engaging in protest is costly for all groups making collective demands, as Gause (Reference Gause2022) notes, it is particularly costly for racial and ethnic minorities, who tend to have fewer resources. Nonetheless, this high cost of protest participation tends to pay off: politicians tend to support the preferences of protesters more than non-protesters, and protests are most effective in changing legislative behavior when they are conducted by the most marginalized populations (Gause Reference Gause2022). Given that young people of color likely have fewer resources than their older counterparts, engaging in such behavior signals a strong commitment on their part.
Race and Political Ambition
There is a long tradition of studying political ambition among budding and actual US politicians (Schlesinger Reference Schlesinger1966). The concept of nascent ambition, understood as an “embryonic or potential interest in office seeking that precedes the actual decision to enter a specific political contest” (Fox and Lawless Reference Fox and Lawless2005, 643), is comparatively more recent. This conceptualization recognizes that before candidates emerge and start considering a serious bid for public office, they must possess some basic inclination to hold office in the first place. It opens the possibility that some groups are underrepresented simply because they lack an interest in pursuing a political career.
Well-known works linking nascent ambition to political representation have come from the literature on gender and political candidacy (Lawless and Fox Reference Lawless and Fox2005). But when it comes to studying how nascent ambition differs among racial and ethnic groups in broad non-elite segments of the population, research is scant. Scholars have long studied the importance of political ambition for Black representation, using highly elite samples consisting of politicians and judges (Jensen and Martinek Reference Jensen and Martinek2009; Stone Reference Stone1980). While recent work has studied nascent ambition among non-elite Blacks, it has not focused on comparisons to other racial groups (Scott and Collins Reference Scott and Collins2020). We therefore have yet to learn about the potential role of nascent ambition in explaining the lack of representational parity faced by some underrepresented groups. Finally, some older studies that focus more broadly on the determinants of nascent ambition have noted that racialized members of the general public exhibit less nascent ambition (Fox and Lawless Reference Fox and Lawless2005).Footnote 2
While this body of work lies closest to ours in its approach, it has some limitations. First, Fox and Lawless (Reference Fox and Lawless2005) focus on members of four professions that were overrepresented in politics at the time. If the path to political office has changed over time, or if paths to office differ across racial groups and generational cohorts, a broader sample of respondents will be necessary. Second, the fact that this study was conducted almost two decades ago in itself suggests that it is time for an update, as we have since witnessed important changes in American society with the potential to affect the political engagement of racial and ethnic minorities.
Explaining Gaps in Nascent Ambition
While our first order of business is to descriptively assess the nature and extent of racial gaps in nascent ambition, we also seek to probe for mechanisms that underlie any observed gaps. For this purpose, we turn to the literature that seeks to explain why some individuals develop nascent ambition while others do not.
The first group of potential explanatory factors focuses on demography and SES. Indeed, studies of nascent ambition have tested the importance of demographic factors, such as age, gender, race, and immigrant status (Dancygier et al. Reference Dancygier, Lindgren, Nyman and Vernby2021; Fox and Lawless Reference Fox and Lawless2005; Maestas et al. Reference Maestas, Fulton, Maisel and Stone2006). Along similar lines, factors such as education and income have been integrated into models seeking to explain nascent ambition (Bernhard et al. Reference Bernhard, Shames and Teele2021; Dancygier et al. Reference Dancygier, Lindgren, Nyman and Vernby2021; Kirkland et al. Reference Kirkland, Simas and Clifford2024; Scott and Collins Reference Scott and Collins2020).
A second group of explanatory factors also derives from this literature. Writing about political participation in general, Verba et al. (Reference Verba, Schlozman and Brady1995) argue that individuals’ stakes in policy can serve as a motivation to act politically. Their model, which emphasizes the role of political interest and ideological considerations, has been applied in the study of nascent ambition. Results from this research suggest that political interest is a strong predictor of considering running for office, whereas the impact of ideology and issue positions is more mixed (Dancygier et al. Reference Dancygier, Lindgren, Nyman and Vernby2021; Lawless and Fox Reference Lawless and Fox2005; Scott and Collins Reference Scott and Collins2020).
The third group of explanatory factors considers past political mobilization. As argued by Lawless and Fox (Reference Lawless and Fox2005, 38), “Running for public office represents the ultimate act of political participation […] Citizens with relatively high levels of political activism and interest, therefore, might be most likely to emerge as candidates.” Such acts that precede the development of nascent ambition include conventional forms of political participation, such as donating money to campaigns, contacting representatives, or attending political meetings. Scott et al. (Reference Scott, Brown, Frasure and Pinderhughes2021), for example, examine how past political participation is associated with whether Black women have been asked to run for office and whether they have considered doing so.
Beyond traditional participation, there is also good reason to consider recent developments that might be shaping considerations to run for political office. Contemporary work in social movement research emphasizes how new dynamics of political participation have emerged in the digital age, where social media platforms play a pivotal role in mobilizing communities behind common political causes, e.g., with respect to the Black Lives Matter movement, and amplifying their voices (cf., Bennett and Segerberg Reference Bennett and Segerberg2013; Clark Reference Clark2016; Van Haperen et al. Reference Van Haperen, Uitermark and Nicholls2023).
Biographical theories posit that “social movement organizations and protest events have to be studied as explicit and implicit socializing agents” (Fillieule Reference Fillieule2013, 3). Most importantly for the study at hand, this literature emphasizes the importance of exposure to, and participation in, major political events as key forces in shaping individuals’ future political engagement (e.g., Fillieule Reference Fillieule2013; Fillieule and Neveu Reference Fillieule and Neveu2019). Work on recent social movements in American politics largely confirms their mobilizing role. Of special interest are the findings on the mobilizing role of the Tea Party movement (Madestam et al. Reference Madestam, Shoag, Veuger and Yanagizawa-Drott2013), Black Lives Matter (Gillion Reference Gillion2020; Towler et al. Reference Towler, Crawford and Bennett2020), and the issue of immigration reform (Garcia-Rios and Barreto Reference Garcia-Rios and Barreto2016). This work has largely examined impacts on civic political participation, participation in campaign activities, interest in voting, voter turnout, and share of partisan support. It remains unknown, however, whether exposure to or participation in these protest events mobilizes individuals into office seeking.
There is a good reason to expect that participation in these movements would spur nascent ambition. Apart from fostering a general sense of political agency and efficacy, participation in movements for racial justice may socialize participants and spur nascent ambition in several ways. First, work on race and ethnic politics suggests that politicized group identities among ethnic minority citizens may boost conventional forms of political participation, including voting (Garcia-Rios and Barreto Reference Garcia-Rios and Barreto2016; Garcia-Rios et al. Reference Garcia-Rios, Lajevardi, Oskooii and Walker2023). Since social movements are likely to socialize participants into holding these types of politicized identities, it is likely that they will empower them politically. Second, a more recent literature highlights the role of negative emotions, such as anger and fear, in mobilizing women and members of marginalized groups (Banks et al. Reference Banks, White and McKenzie2019; Valentino et al. Reference Valentino, Brader, Groenendyk, Gregorowicz and Hutchings2011), including increasing their interest in office-running (Dittmar Reference Dittmar2020; Scott and Collins Reference Scott and Collins2020). Relatedly, it has been shown that a sense of policy threat can activate negative emotions, which can lead to heightened mobilization and increased political involvement (Clayton et al. Reference Clayton, O’Brien and Piscopo2023). Social movements for racial justice may not only serve as catalysts for these emotions and a heightened sense of policy threat, but also reinforce and amplify them, thereby increasing the probability that participants would consider running for office.
In this context, it is crucial to note that social movements, and protest events in particular, often disproportionately attract younger participants. This pattern may be linked to the intense emotions and group identities noted above, as well as the heightened sense of political agency that such movements can instill. Indeed, the United States has a long history of youth and student activism, with the 1960s providing a prominent example: during that period, young organizers mobilized en masse against the Vietnam War, staged sit-ins to protest racial discrimination, and registered voters to advance civil liberties. Black student activists, in particular, championed goals that mirrored those of the Black Power movement, emphasizing demands for civil rights and pushing back against racism on their campuses (e.g., Bradley Reference Bradley2010). Turning to more recent events, research shows that BLM protesters were younger and more racially diverse than the general population (Chenoweth et al. Reference Chenoweth, Hamilton, Lee, Papageorge, Roll and Zahn2022). In addition, the emotional impact of participating in BLM protests was large for the young, especially for Black youth, pointing to potentially empowering effects of the protests (Baskin-Sommers et al. Reference Baskin-Sommers, Simmons, Conley, Chang, Estrada, Collins, Pelham, Beckford, Mitchell-Adams, Berrian, Tapert, Gee and Casey2021). Both historical and more recent examples illustrate the broader role of youth in energizing protest movements and, potentially, in fueling future political ambition among their ranks. In studying the mobilizing role of movements for racial justice, it is therefore important to adopt an intersectional perspective that accounts for how these movements may disproportionately mobilize both racial minorities and younger generations, and help channel political participation into nascent ambition.
Youth Political Mobilization and Pathways to Ambition
Past work has long argued—and shown—that, compared to their older counterparts, young Americans are more turned off from politics and engage less politically (Bennett Reference Bennett1997; Lawless and Fox Reference Lawless and Fox2015). Age is a key predictor of turnout, with young voters systematically less likely to vote than other generations (Smets Reference Smets2012).Footnote 3
Although political ambition among young people remains understudied, patterns of political participation and mobilization provide critical insight into how ambition develops and racial gaps emerge. One explanation for low engagement among young people is that they feel alienated by political dysfunction, which limits their willingness to consider engaging in more costly political action, such as running for office (Lawless and Fox Reference Lawless and Fox2015). Another line of research, however, highlights that barriers and costs to politics are exceptionally high for this subgroup of the electorate (Hill Reference Hill2020; Juelich and Coll Reference Juelich and Coll2020; Shames Reference Shames2017). But, when these hurdles are reduced (e.g., through same-day registration efforts (Grumbach and Hill Reference Grumbach and Hill2022), civic education (Nelsen Reference Nelsen2023), or information campaigns (Bergan et al. Reference Bergan, Carnahan, Lajevardi, Medeiros, Reckhow and Thorson2022)), youth participation rises.
Two additional points regarding the youngest eligible voters are noteworthy. First, Gen Z is the most diverse generation in American history in terms of race, ethnicity, and LGBTQ+ status (Deckman Reference Deckman2024). In fact, demographically, Gen Z is the most racially and ethnically diverse generation the United States has ever had (Parker and Igielnik Reference Parker and Igielnik2020; Rouse and Ross Reference Rouse and Ross2018). In assessing Gen Z’s political priorities, research finds that America’s youngest voters are more interested than their counterparts in progressive socioeconomic policies (Rouse and Ross Reference Rouse and Ross2018), as well as in issues of gender equality, LGBTQ+ rights, and racial justice (Deckman Reference Deckman2024, Figures 1.3, 6.1). What’s more, certain subsets of this group (e.g., such as LGBTQ+ Zoomers and Gen Z women) are participating more than others in politics (Deckman Reference Deckman2024, Figure 1.5B).
Second, the group of young Americans is not a monolith, and important political differences remain. For example, in a study on candidate preferences in the 2016 election, Medenica (Reference Medenica2018) found that young Americans of color were significantly more likely to support Clinton than young White voters. And, others have found that even compared to their older ingroup racial counterparts, young voters of color hold more liberal attitudes on some policies, such as student debt forgiveness (Rouse and Ross Reference Rouse and Ross2018, see Figure 4.5).Footnote 4
Recognizing that young voters take substantial risks and incur high costs to participate in protests is crucial; as we show below, this participation itself provides an empirical foundation for explaining observed racial gaps in political ambition.
The Data
We rely on the 2020 CMPS, which was fielded between April and August 2021. Because of its large oversamples of underrepresented groups, the CMPS offers a unique opportunity to reliably measure how interest in running for office varies between Whites, Blacks, Latinos, and Asians. Moreover, the CMPS includes a sizable youth sample (16–17 year olds), which is crucial for our analysis of how age intersects with race.Footnote 5 Like with the 2016 CMPS (Barreto et al. Reference Barreto, Frasure-Yokley, Vargas and Wong2018), the 2020 CMPS also employed best practices for reaching a representative sample of each minority group. When we combine the youth and adult samples, our analyses include a total of 4, 465 Whites, 4, 116 Asians, 4, 930 Blacks, and 4, 139 Latinos (N = 17, 650). We use self-identified primary race/ethnicity, and each racial group is weighted to their known Census demographic characteristics.Footnote 6 While the oversample of minorities is crucial to the analysis that follows, the reader should keep in mind that the sample is not representative of the US population.Footnote 7
In addition to its oversample of Americans of color, the survey is unique for another vital reason: the context during which it was conducted. The survey was fielded in the aftermath of a wave of protests related to racial justice and immigration reforms, which are currently important to minoritized communities. Moreover, the survey was fielded following a contentious presidential election where President Trump refused to accept the election results, and where there was an attack on the U.S. Capitol on January 6th, 2021. Thus, the polarized political context in the foreground of the survey cannot be ignored, especially as research has found that Americans became sharply divided on these issues, along the lines of race and racial attitudes (e.g., Barreto et al. Reference Barreto, Claudia Alegre, Davis, Ferrer, Nguy, Palmisano and Robertson2023; Barreto et al. Reference Barreto, Frasure and Hall2025; Kuk et al. Reference Kuk, Lajevardi and Osborne-Garth2025; Merseth Reference Merseth2020; Newman et al. Reference Newman, Reny and Merolla2024).
Our main outcome variable of interest is nascent political ambition. We measure nascent political ambition with the following question in the CMPS: “If offered the opportunity, would you consider running for political office to further the issues that you care about most?” Respondents could then answer either “Yes, would do this,” “No, would not do this,” or “Not sure.” Overall, 15% of respondents indicated “Yes, would do this,” 65% replied “No, would not do this,” and 20% replied, “Not sure.” When we compare this rate to that in another study, which included a similar measure, we gain more confidence that this sample is not unusual. Lajevardi et al. (Reference Lajevardi, Mårtensson and Vernby2024), for example, find that 13% of American respondents would absolutely consider running for political office if offered the opportunity. Compared to Fox and Lawless (Reference Fox and Lawless2005), who queried respondents in pipeline professions about their willingness to run for office, we can see that CMPS respondents were much less likely than those in springboard professions in their elite sample (Table 1, 58%) to consider running for elected office in the future. In the following, we treat only those answering “Yes, would do this” as having nascent ambition.Footnote 8
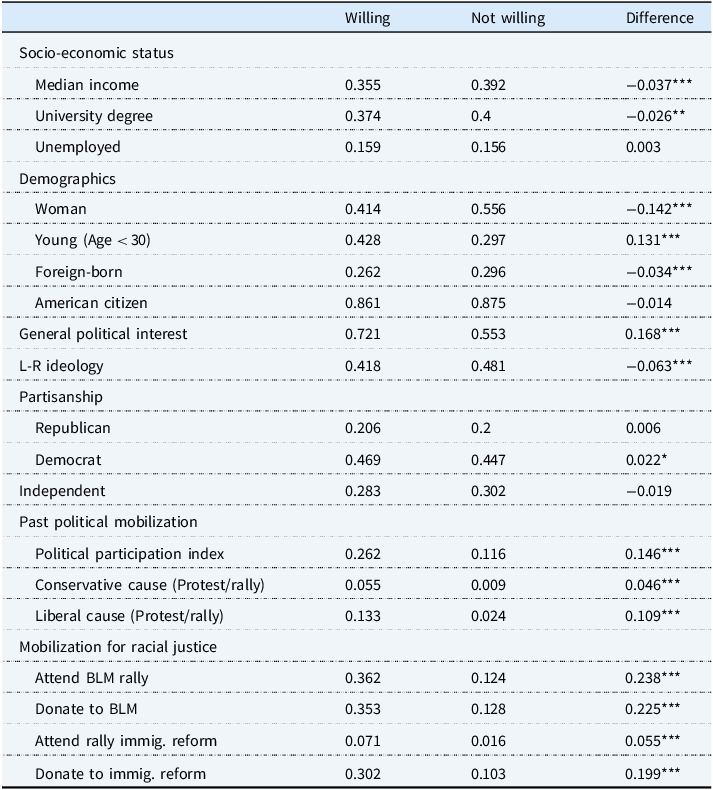
What factors are correlated with willingness to run for office?
Note: All variables range from 0 to 1. The number of observations ranges between 16,049 and 17,650. Significance tests are t-tests for differences between means. * p < 0.10, ** p < 0.05, *** p < 0.01.
To probe for the mechanisms that underlie any observed racial differences in the inclination to consider running for office, we include a number of potential correlates to nascent ambition. Beginning with SES, we include an indicator of whether the respondent’s income is above or below the median (Median Income), if they hold a university degree (University Degree), and whether they are currently unemployed (Unemployed). The demographic variables included are gender (Woman), whether the respondent is young (Age < 30)Footnote 9 , foreign-born (Foreign-Born), and is an American citizen (American Citizen).Footnote 10
The second set of explanatory factors is related to respondents’ stake in policy. We include an indicator for general interest in politics (General Political Interest), and also measure individuals’ partisan and ideological considerations (L-R Ideology and Partisanship).
Third, we measure past political mobilization in several ways. First, we create an index of conventional political participation (Political Participation Index). This index draws on 4 survey items that measure whether the respondent has engaged in any of the following activities since January 2020: 1) contributed money to a candidate, political party, ballot issue, or other campaign organization, 2) wore a campaign button, or posted a campaign sign or sticker, 3) contacted an elected representative or a government official, or 4) contacted in any way, such as by letter, telephone, internet, or in person, a government office about a problem you have or to get help or information.Footnote 11 To create the index, we take the unweighted mean of these survey items and rescale it to range from 0 to 1.
We also measure two forms of unconventional participation: Protests and rallies for conservative and liberal causes. The first (Conservative Cause) takes on the value of 1 if the respondent attended a march, demonstration, or rally to protest COVID-19 restrictions, electoral fraud in the 2020 election, or to support former President Trump. The second measure (Liberal Cause) takes on the value of 1 if the respondent attended a march, demonstration, or rally to support COVID-19 restrictions, economic equality, measures to combat climate change, stricter gun laws, the Women’s March, President Joe Biden, or voting rights for all.
We also separate mobilization for racial justice from other types of past political mobilization since we are more likely to see stark racial/ethnic differences in the former than the latter. To measure mobilization that has been especially salient to Black Americans, we include a variable measuring whether the respondent at any point from January 2017 and later participated in a march, demonstration, or rally in support of BLM or protesting racial bias in policing or the criminal justice system (Attend Rally BLM). In addition, one may be mobilized for BLM and against racial injustice in other ways, which is why we also include a measure of whether one has donated to BLM (Donate to BLM). To measure past mobilization around an issue that is especially mobilizing for Latinos, we focus on immigration reform. Specifically, we include a measure of whether the respondent, at any point from 2017 onward, has participated in a march, demonstration, or rally in support of immigration reform (Attend Rally Immig. Reform), and a measure of whether they have donated to this cause (Donate to Immig. Reform). As noted previously, the CMPS does not explicitly ask about participation in protests or rallies that focus on discrimination and violence targeting Asian Americans, such as Stop Asian Hate. We are thus unable to analyze how this specific type of political mobilization correlates with nascent ambition.
In the final part of our analysis, we turn our attention to the intersection of age and race, and how this relates to participation in movements for racial justice and nascent ambition. To simplify the presentation of our results, we present results split by generation.Footnote 12 Specifically, we present a number of descriptive figures where participation in movements for racial justice and nascent ambition are broken down by the following generational cohorts: Gen Z (born 1997–2014), Millennials (born 1981–1996), Gen X (born 1965–1980), Boomers (born 1946–1964), and the Post-War Generation (born 1928–1945).Footnote 13
Main Results
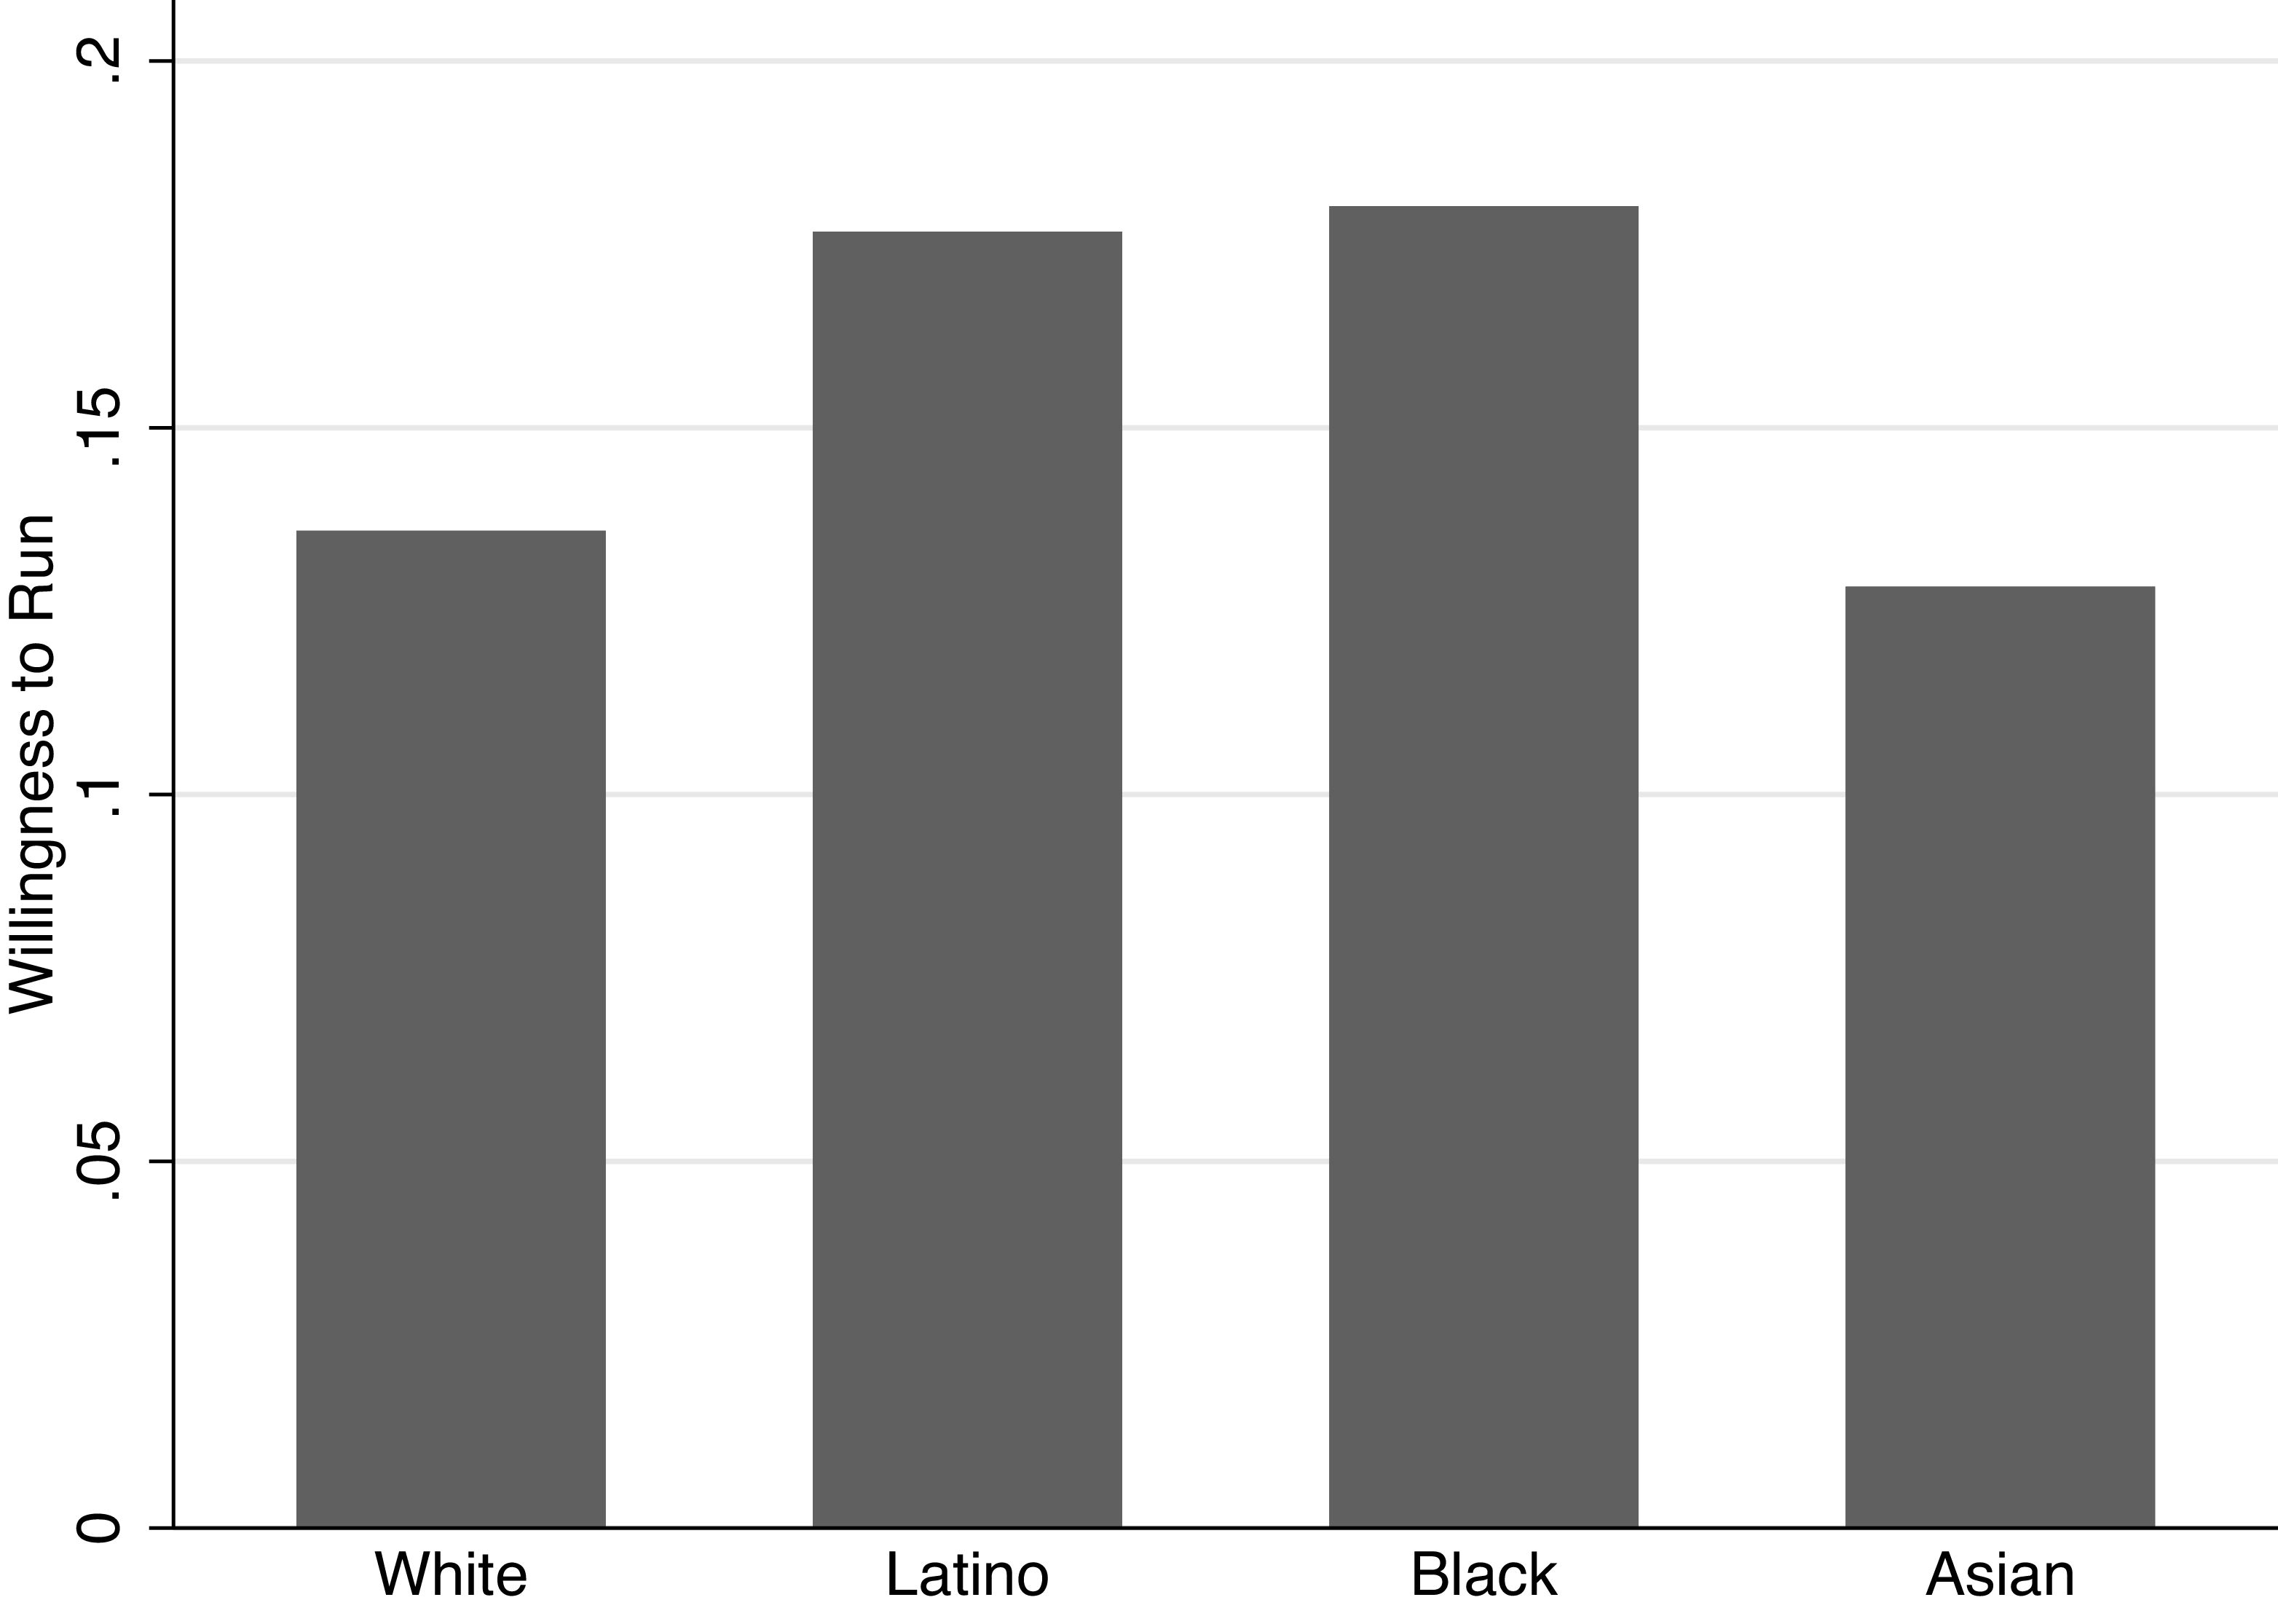
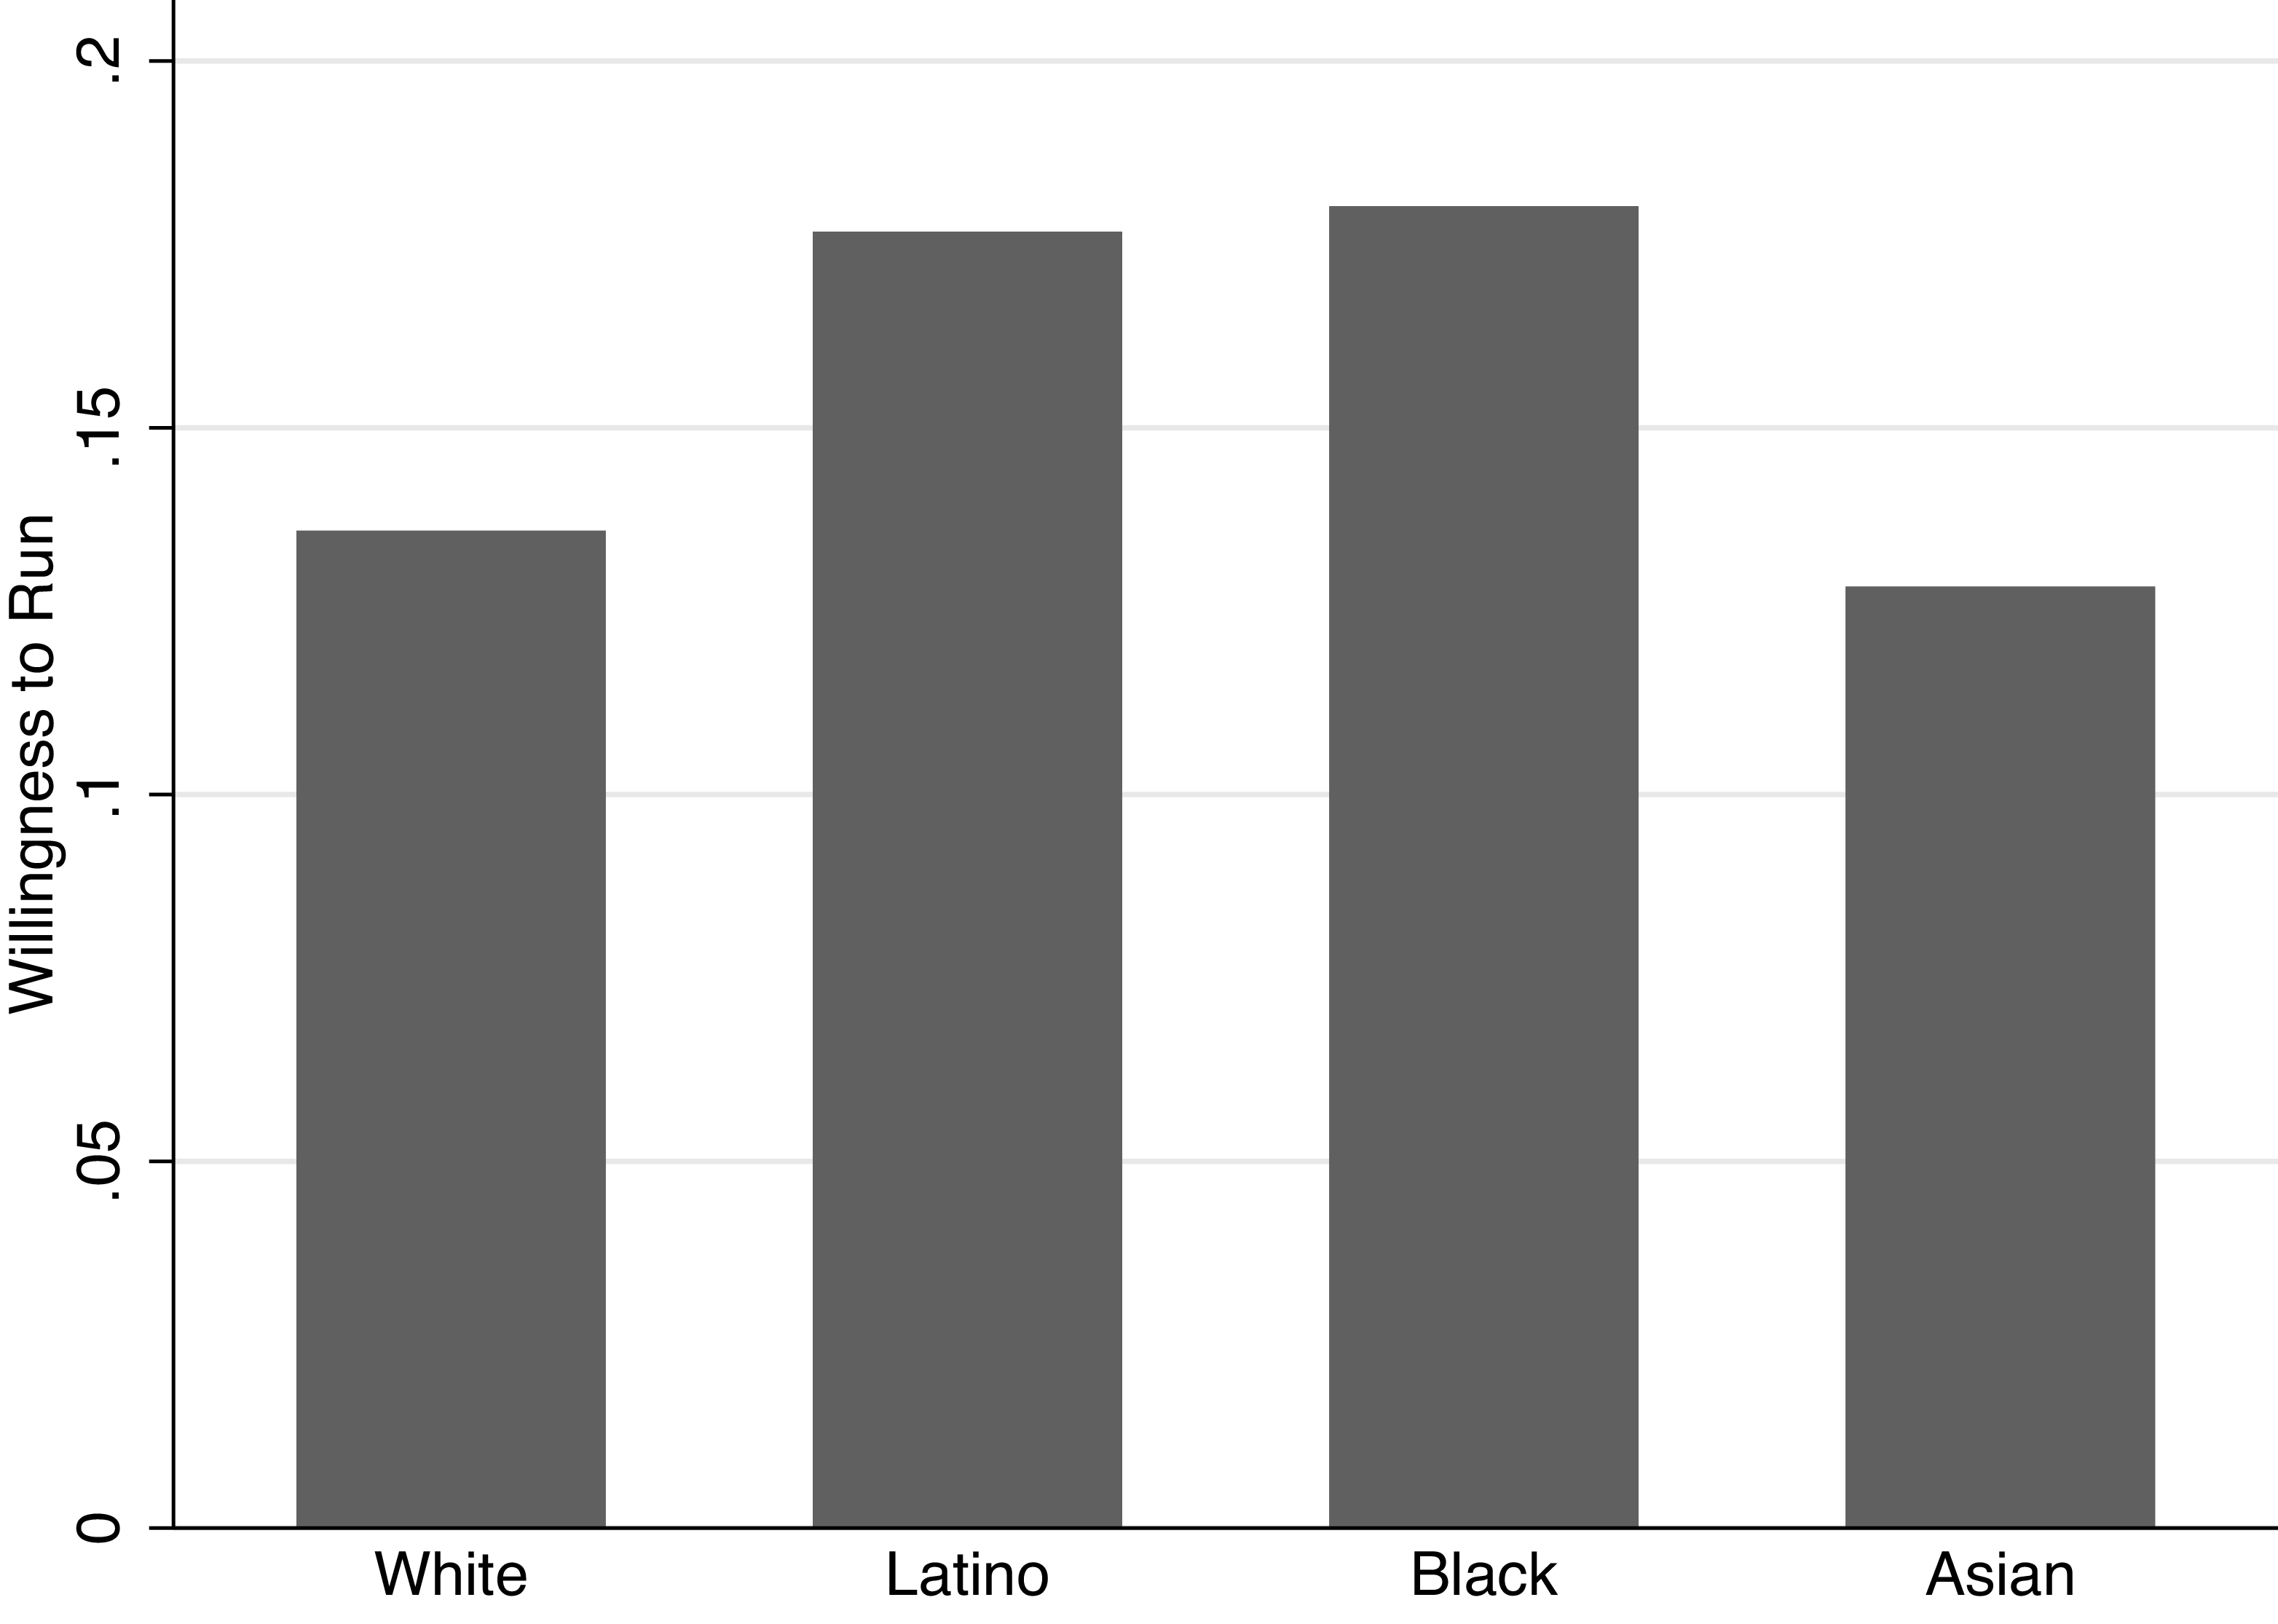
In Figure 1, we show the share interested in running by race/ethnicity. Despite being underrepresented among politicians in the US, Black respondents (16%) and Latinos (17%) are the most interested in running for office. For Whites and Asians, the corresponding figures are 14% and 12%, respectively. The difference between Blacks and Latinos is statistically insignificant (p≈ 0.406). However, both Black and Latino respondents are significantly more interested in running for office than are White and Asian respondents (p < 0.01).
The share interested in running for office by race/ethnicity.
Note: Proportion answering yes to the question “If offered the opportunity, would you consider running for political office?” N = 17, 650.
What accounts for the fact that Blacks and Latinos exhibit more nascent political ambition than Whites and Asians? For any factor to explain these ethnic/racial gaps in the interest in running, two conditions need to hold. First, the factor must be correlated with interest in running for office. Second, the factor must also differ systematically between racial and ethnic groups. In other words, we are looking for factors that are strongly related to race/ethnicity as well as political ambition.
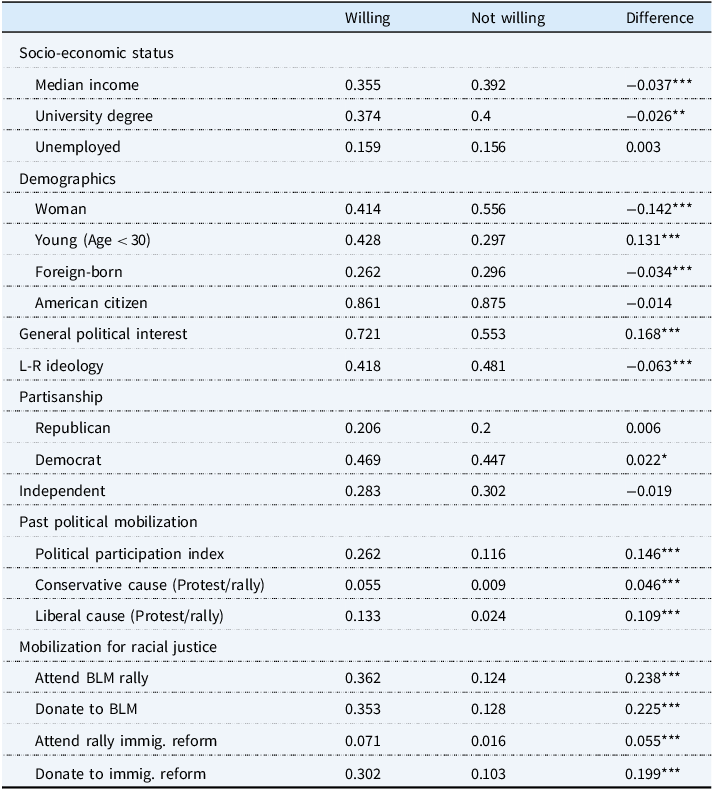
Table 1 reports the average values of our explanatory variables separately for those respondents who are willing to run for office and those who are not. This allows us to assess the first condition for explaining racial gaps in nascent political ambition: whether a factor is associated with interest in running. Beginning with the share with an above-median income, Table 1 shows that it is slightly lower among those willing to run than among those not willing. Similarly, the share with a university degree is slightly lower among those willing to run, running contrary to the standard expectation that education should be positively correlated with nascent ambition. However, the difference is substantively very small. Given the modest size of these differences, nascent ambition does not appear to be strongly stratified by SES or social class, consistent with recent research.Footnote 14 The difference in unemployment rates between the two groups is similarly small and not statistically significant.
Turning to demographics, the share of women is lower among those interested in running for office, consistent with previous research (Lawless and Fox Reference Lawless and Fox2005; Reference Lawless and Fox2010; Lawless Reference Lawless2012). The share of native-born respondents is higher among those interested in running, whereas citizenship does not seem to matter. Interestingly, there is a dramatic age gap in nascent ambition, a finding which we will explore further in the next section.
We also find that respondents exhibiting nascent political ambition have higher levels of political interest and lean more liberal. These differences are statistically significant. As for substantive significance, those willing to run are more than half a standard deviation higher on political interest (sd = 0.32), and about a fifth of a standard deviation (sd = 0.29) more left-leaning. However, there are no discernible partisan differences with respect to interest in running for office.Footnote 15
We now turn to past political mobilization. The political participation index is more than half a standard deviation (sd = 0.24) higher among those willing to run. Attending protests or rallies for conservative causes (sd = 0.12) is about a third of a standard deviation higher among the willing, whereas the corresponding figure for liberal causes (sd = 0.19) is higher.
Perhaps the most dramatic difference, however, can be found when we turn to mobilization for racial justice. As explained in the previous section, when creating the index for participation in rallies and protests for liberal causes, we separated out those centered on racial justice. The results in Table 1 suggest this may be important. Specifically, having attended a rally and donated to BLM is around three times as common among those interested in running. Turning to rallies and donations supporting immigration reform, the differences between those who are interested in running and those who are not are equally stark.
Some factors in Table 1 thus fail to meet the first condition for explaining racial disparities in political ambition; they are not correlated with the willingness to run for office. However, general political interest and ideology, a history of being active in politics, as well as variables proxying for mobilization in recent movements for conservative and liberal causes, and, more specifically, racial justice, satisfy this condition.
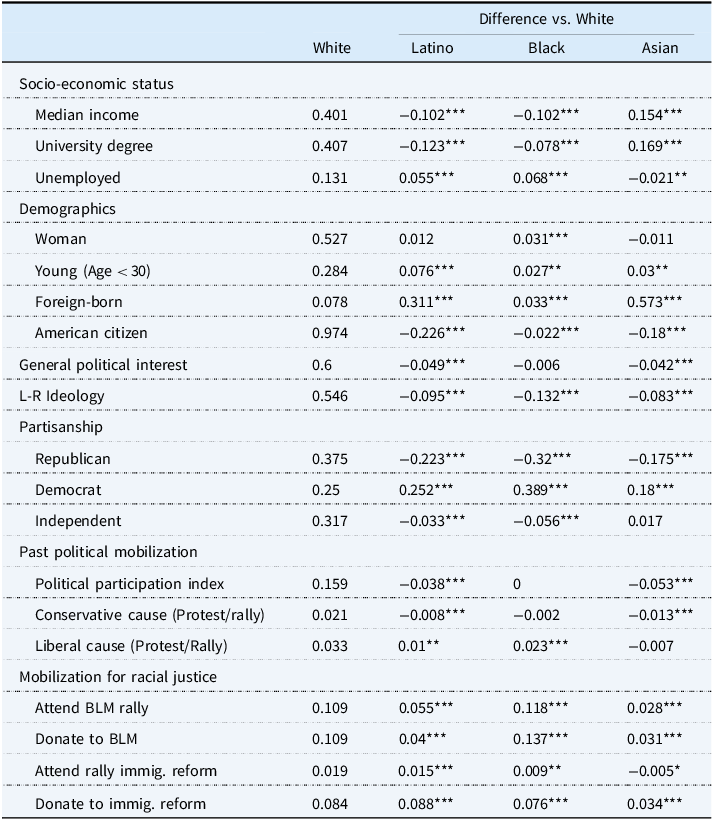
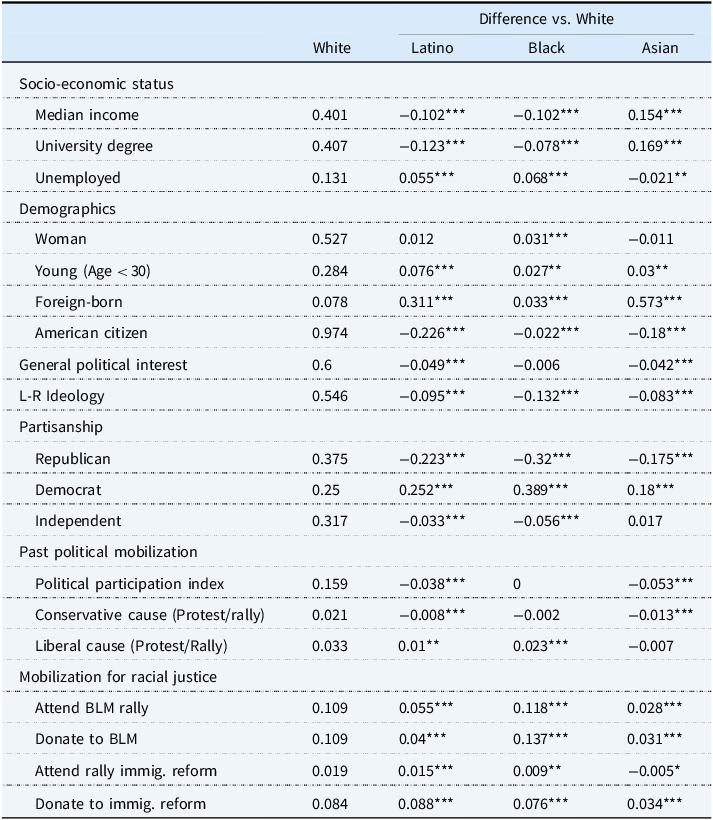
In Table 2, we move on to showing racial and ethnic differences in the factors that can explain political ambition.Footnote 16 Any factor that could explain gaps in political ambition between racial and ethnic groups must also differ systematically between these groups. The first column shows the average for Whites, whereas the remaining columns show how the other racial/ethnic groups differ from Whites on the variable in question.
Racial differences in factors correlated with willingness to run for office
Note: All variables range from 0 to 1. The number of observations ranges between 16,049 and 17,650. Significance tests are t-tests for differences between means. * p < 0.10, ** p < 0.05, *** p < 0.01.
As can be seen, several of the factors that differ across those who are interested in running and those who are not also differ across racial/ethnic groups. The first is age. Blacks, Asians, and, especially, Latinos are younger than Whites. Given that age is also strongly related to interest in running, this is a variable that could potentially explain some of the racial gaps in political ambition. Being foreign-born is also more common among ethnic minorities, but since this variable is negatively related to interest in running, it cannot account for the fact that Latinos and Blacks are more interested in running than are Whites.
Turning to general political interest, differences between racial groups are fairly small. Whites are slightly more politically interested than other groups, except for Blacks, who are about as interested. It is therefore unlikely that general political interest can account for the observed gaps in ambition. Turning to ideological orientation, recall from Table 1 that while those willing to run did not stand out with respect to partisanship, they indicated that they were slightly more liberal on average. Since Table 2 shows that all racial/ethnic minorities are more liberal than Whites, we cannot rule out at this stage of our analysis that this variable could account for a small part of the gap in nascent political ambition.
Whereas the three broad indices that capture the (past) political engagement of the respondents are all strongly related to interest in running, their relationship to race is ambiguous. On the one hand, the index measuring past acts of conventional political participation is lower for Latinos and Asians than for Whites and Blacks, and the same goes for the index that measures participation in protests or rallies for conservative causes. The index capturing participation in protests for liberal causes, however, is higher for Blacks and Latinos. The extent to which past political engagement can account for the racial disparities in political ambition is therefore ambiguous, and any conclusion will have to await the detailed regression analysis that we discuss below.
Finally, the set of indicators that specifically capture mobilization for racial justice is all strongly correlated with race. Blacks are more than twice as likely as Whites to have attended a BLM rally or donated to the organization. Latinos and Asians are also significantly more likely to have engaged in those acts than are Whites. Turning to the issue of immigration reform, Latinos are twice as likely to have attended a rally or donated. Blacks and, to some extent, Asians are also more likely than Whites to have mobilized around this issue. In combination with the results from Table 1, the results in Table 2 suggest that past mobilization for racial justice is a strong candidate for explaining why Blacks and Latinos are more interested in running for office than are Whites.
As a second step, and in order to evaluate to what extent the effects reported in Tables 1 and 2 can help account for the observed racial gaps in political ambition, we turn to multiple regression analysis. Specifically, we perform an analysis in which we regress willingness to run on race/ethnicity using different sets of control variables. Drawing on previous literature, we explore a number of “traditional factors” that are often examined when examining variation in political participation and interest in running for office. These include SES and demographics, as well as general political interest, ideology, and partisanship (e.g., Verba et al. Reference Verba, Schlozman and Brady1995). We then observe how much the impact of race/ethnicity on the interest in running is reduced by the inclusion of each set of controls.
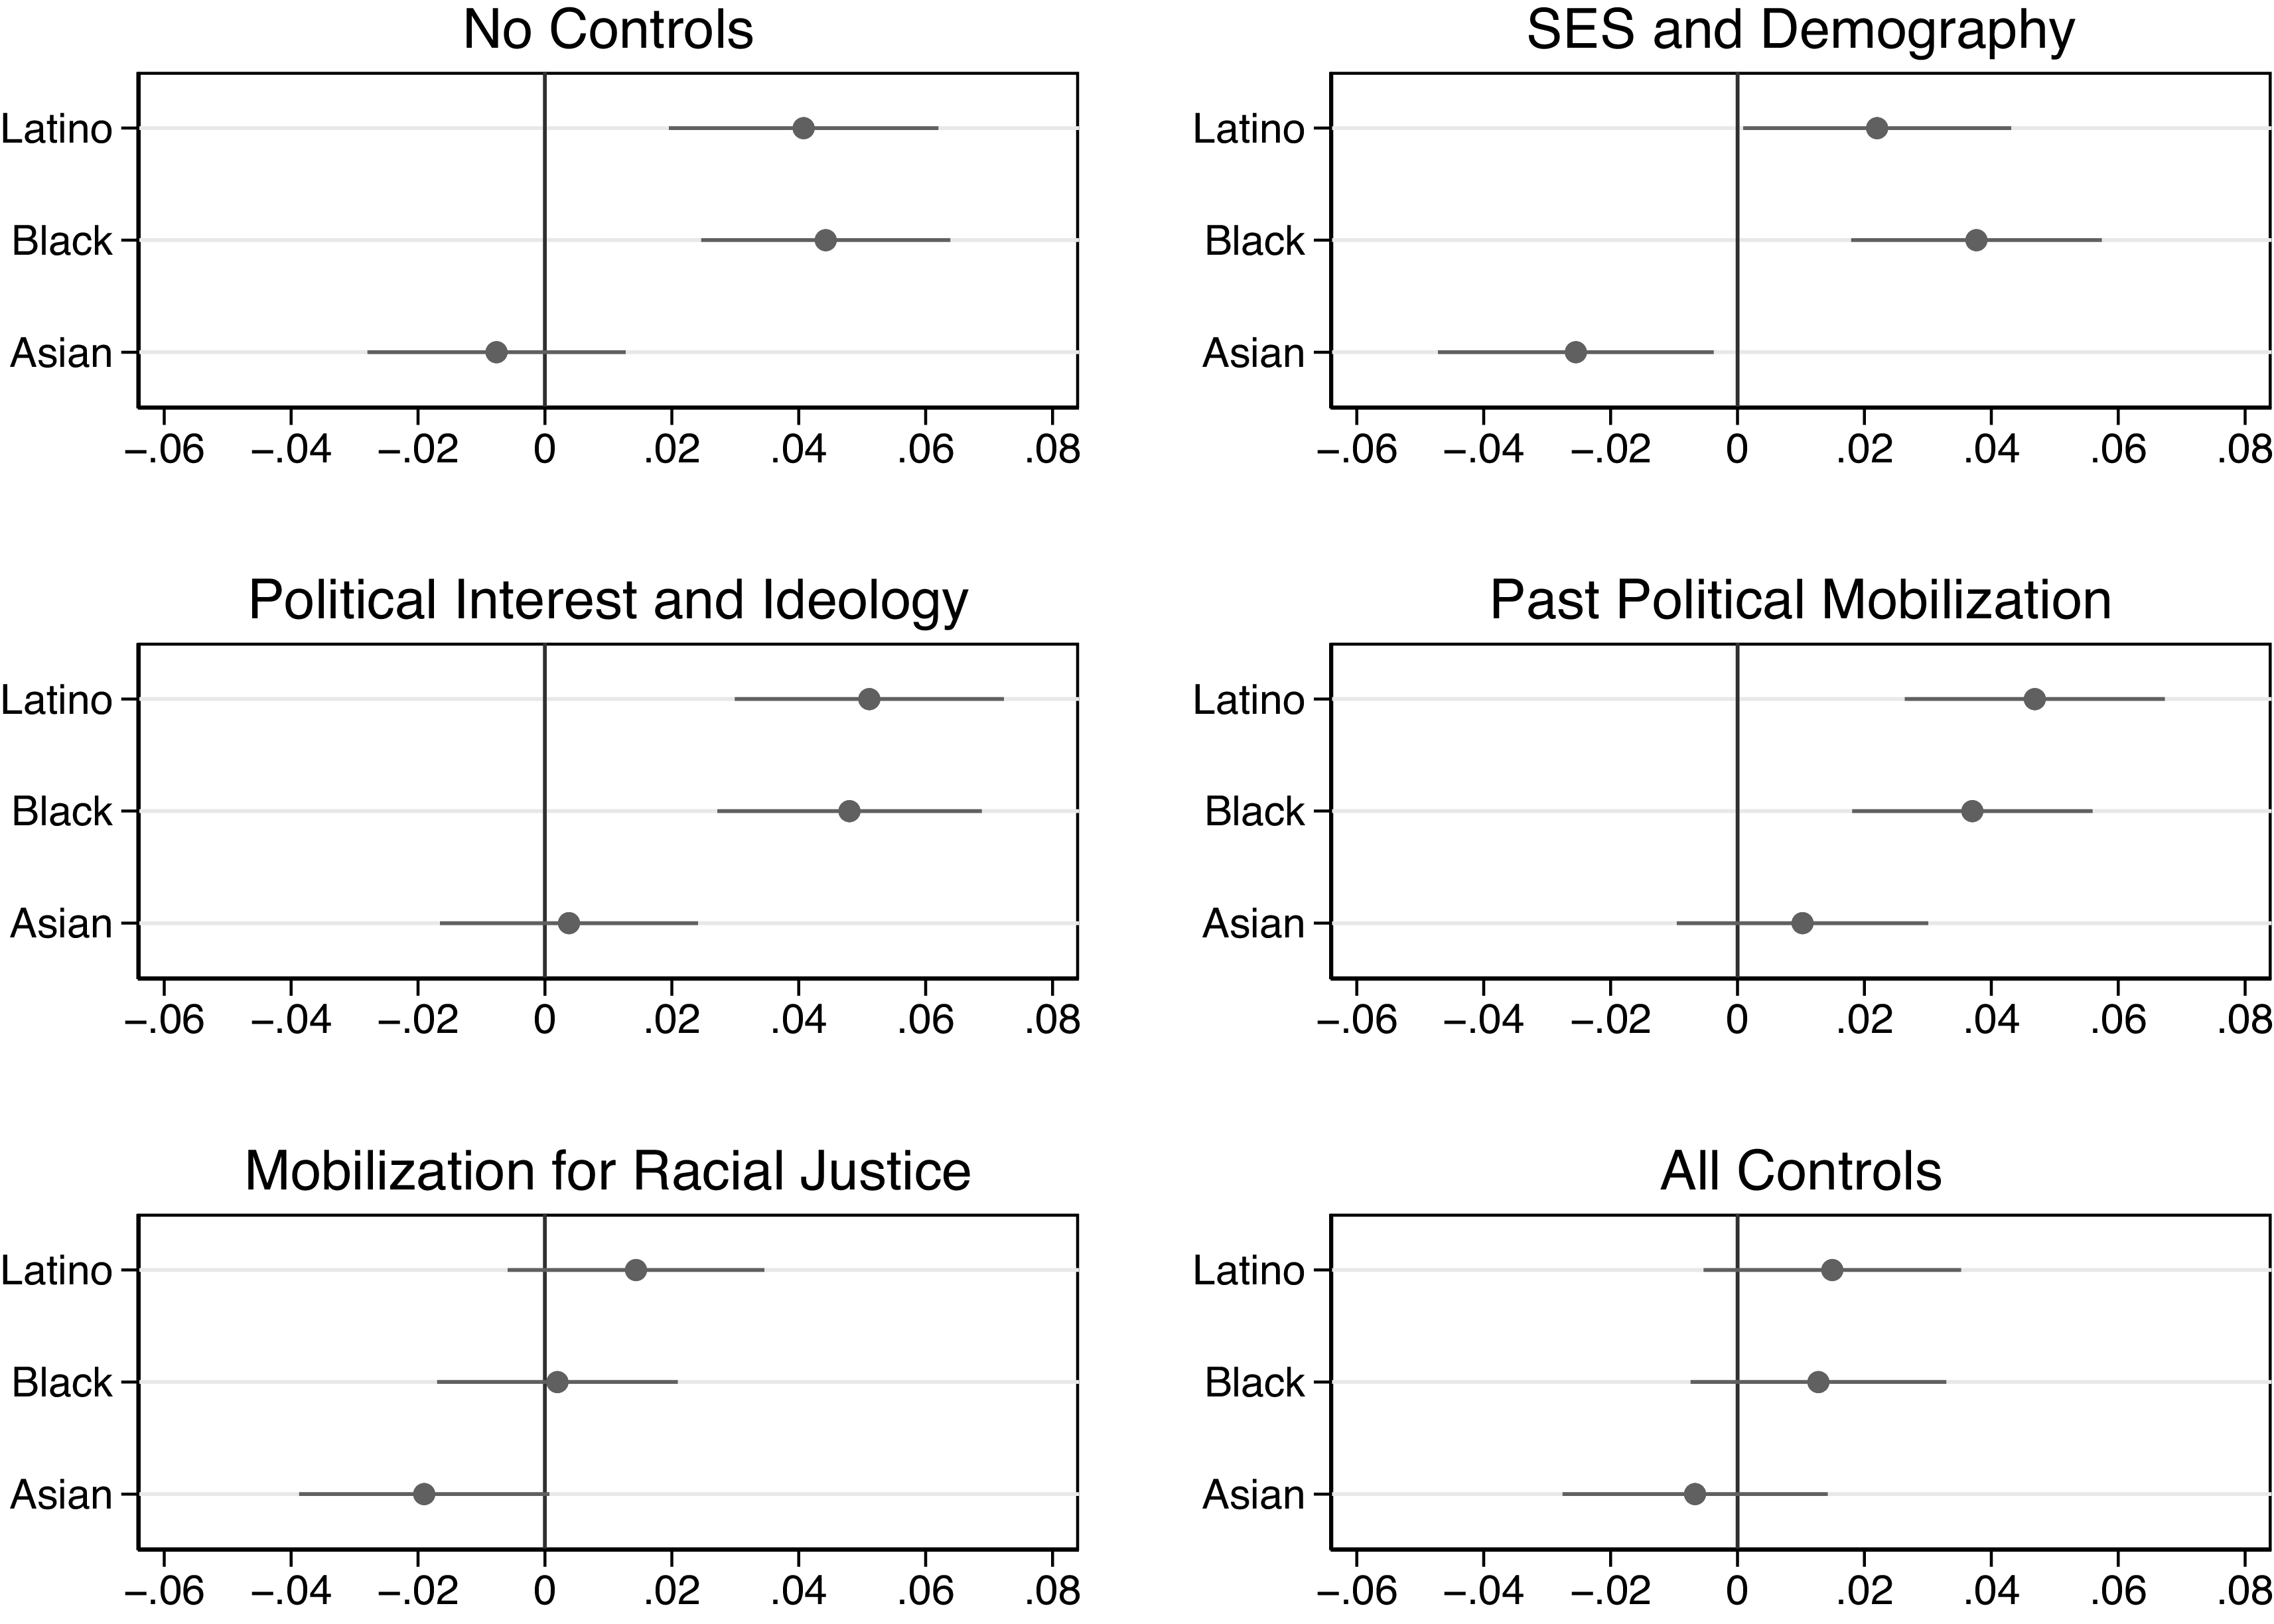
The results are shown in Figure 2.Footnote 17 As a benchmark, the figure includes a model with no control variables in the upper left panel. In the second model, we add the controls for SES and demography from Tables 1 and 2. As can be seen, the coefficient for Black does not change very much, while the coefficient for Latino is reduced. SES and demographics thus cannot explain the disparities between Black and Whites, but may be able to account for part of the difference between Whites and Latinos. Notably, Latinos are younger than Whites, and age is negatively correlated with interest in running (see Table 1). We will return to the intersection of race and age in the next section. For Asians, finally, the coefficient becomes more negative, suggesting that their interest in running would be lower if they were more similar to Whites on SES and demographics.
Accounting for the impact of race/ethnicity on the interest in running for office.
Note: Plots show coefficient estimates with 95% confidence intervals from six models that regress willingness to run on race/ethnicity using different sets of control variables. The reference category is White and the number of observations is N = 14, 434.
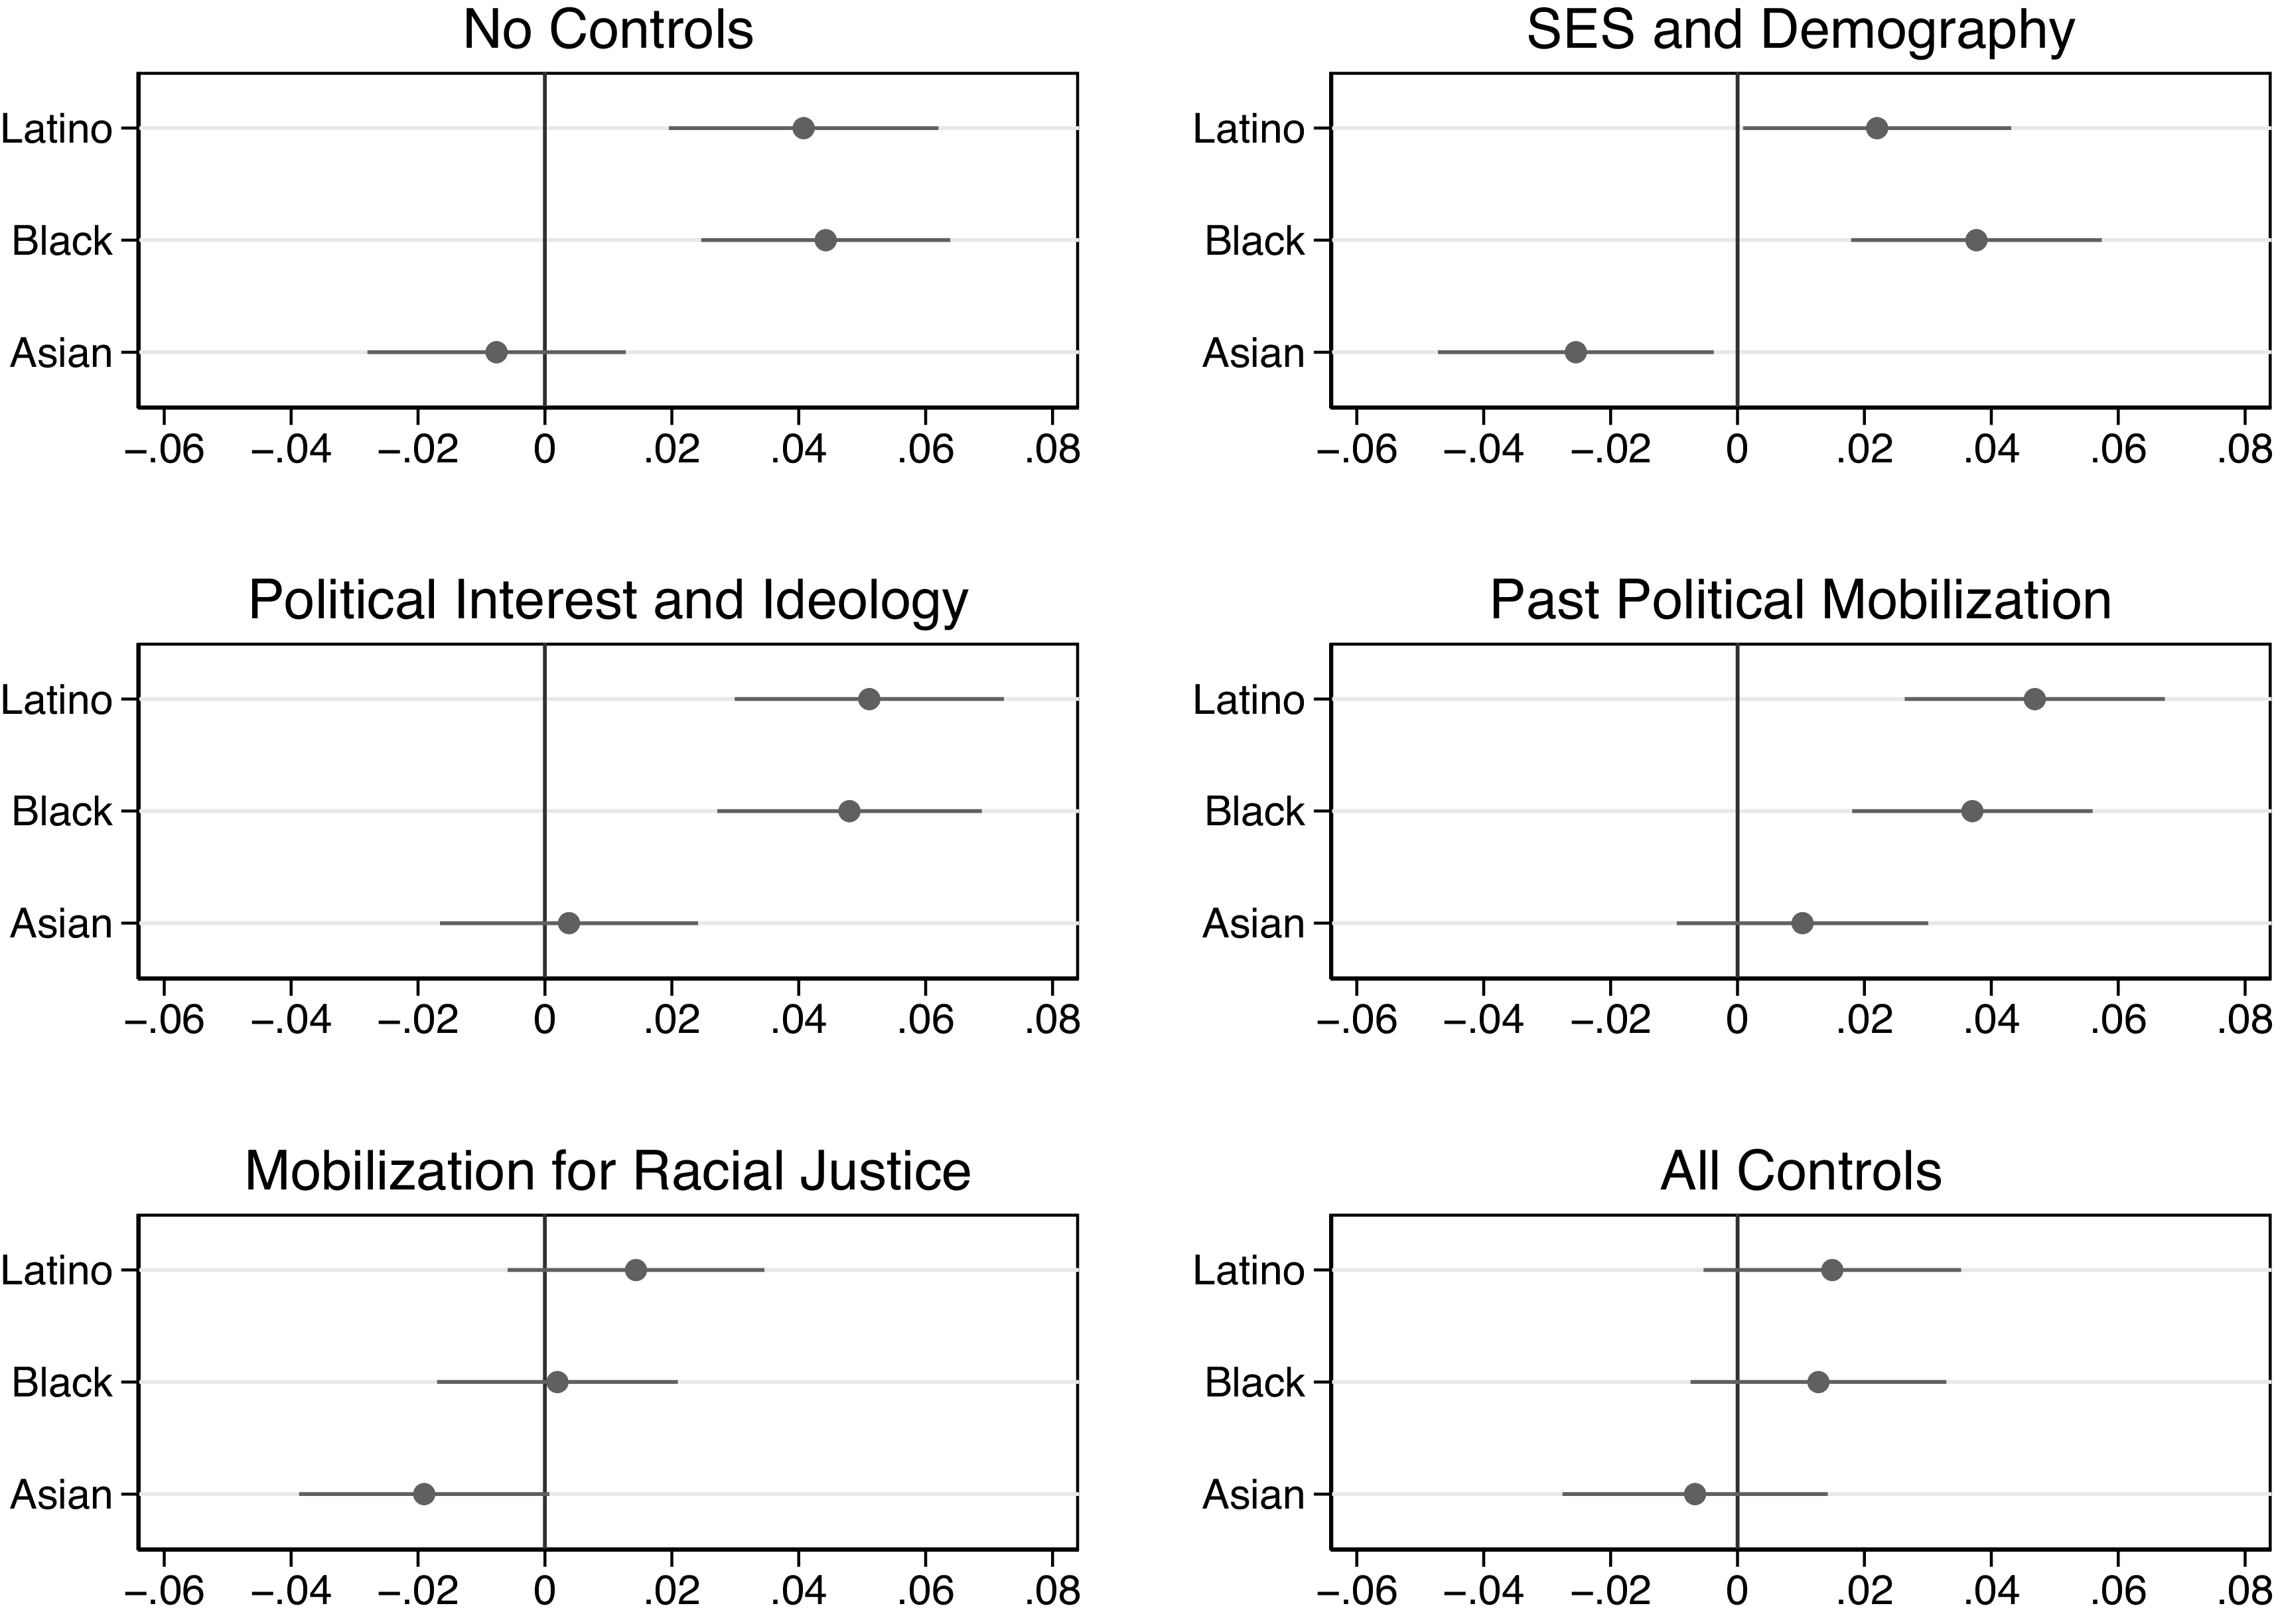
If we instead include variables that capture general political interest, ideology, and partisanship, the coefficients for race/ethnicity do not change dramatically compared to the baseline specification. The same goes for when we substitute those for measures of past political mobilization, which include both our index of conventional acts of political participation and the indices capturing participation in rallies/protests for conservative and liberal causes. Neither the fact that Latinos and Blacks are more liberal, nor that they have previously participated in more liberal protests and rallies, seem to account for their greater interest in running for office.
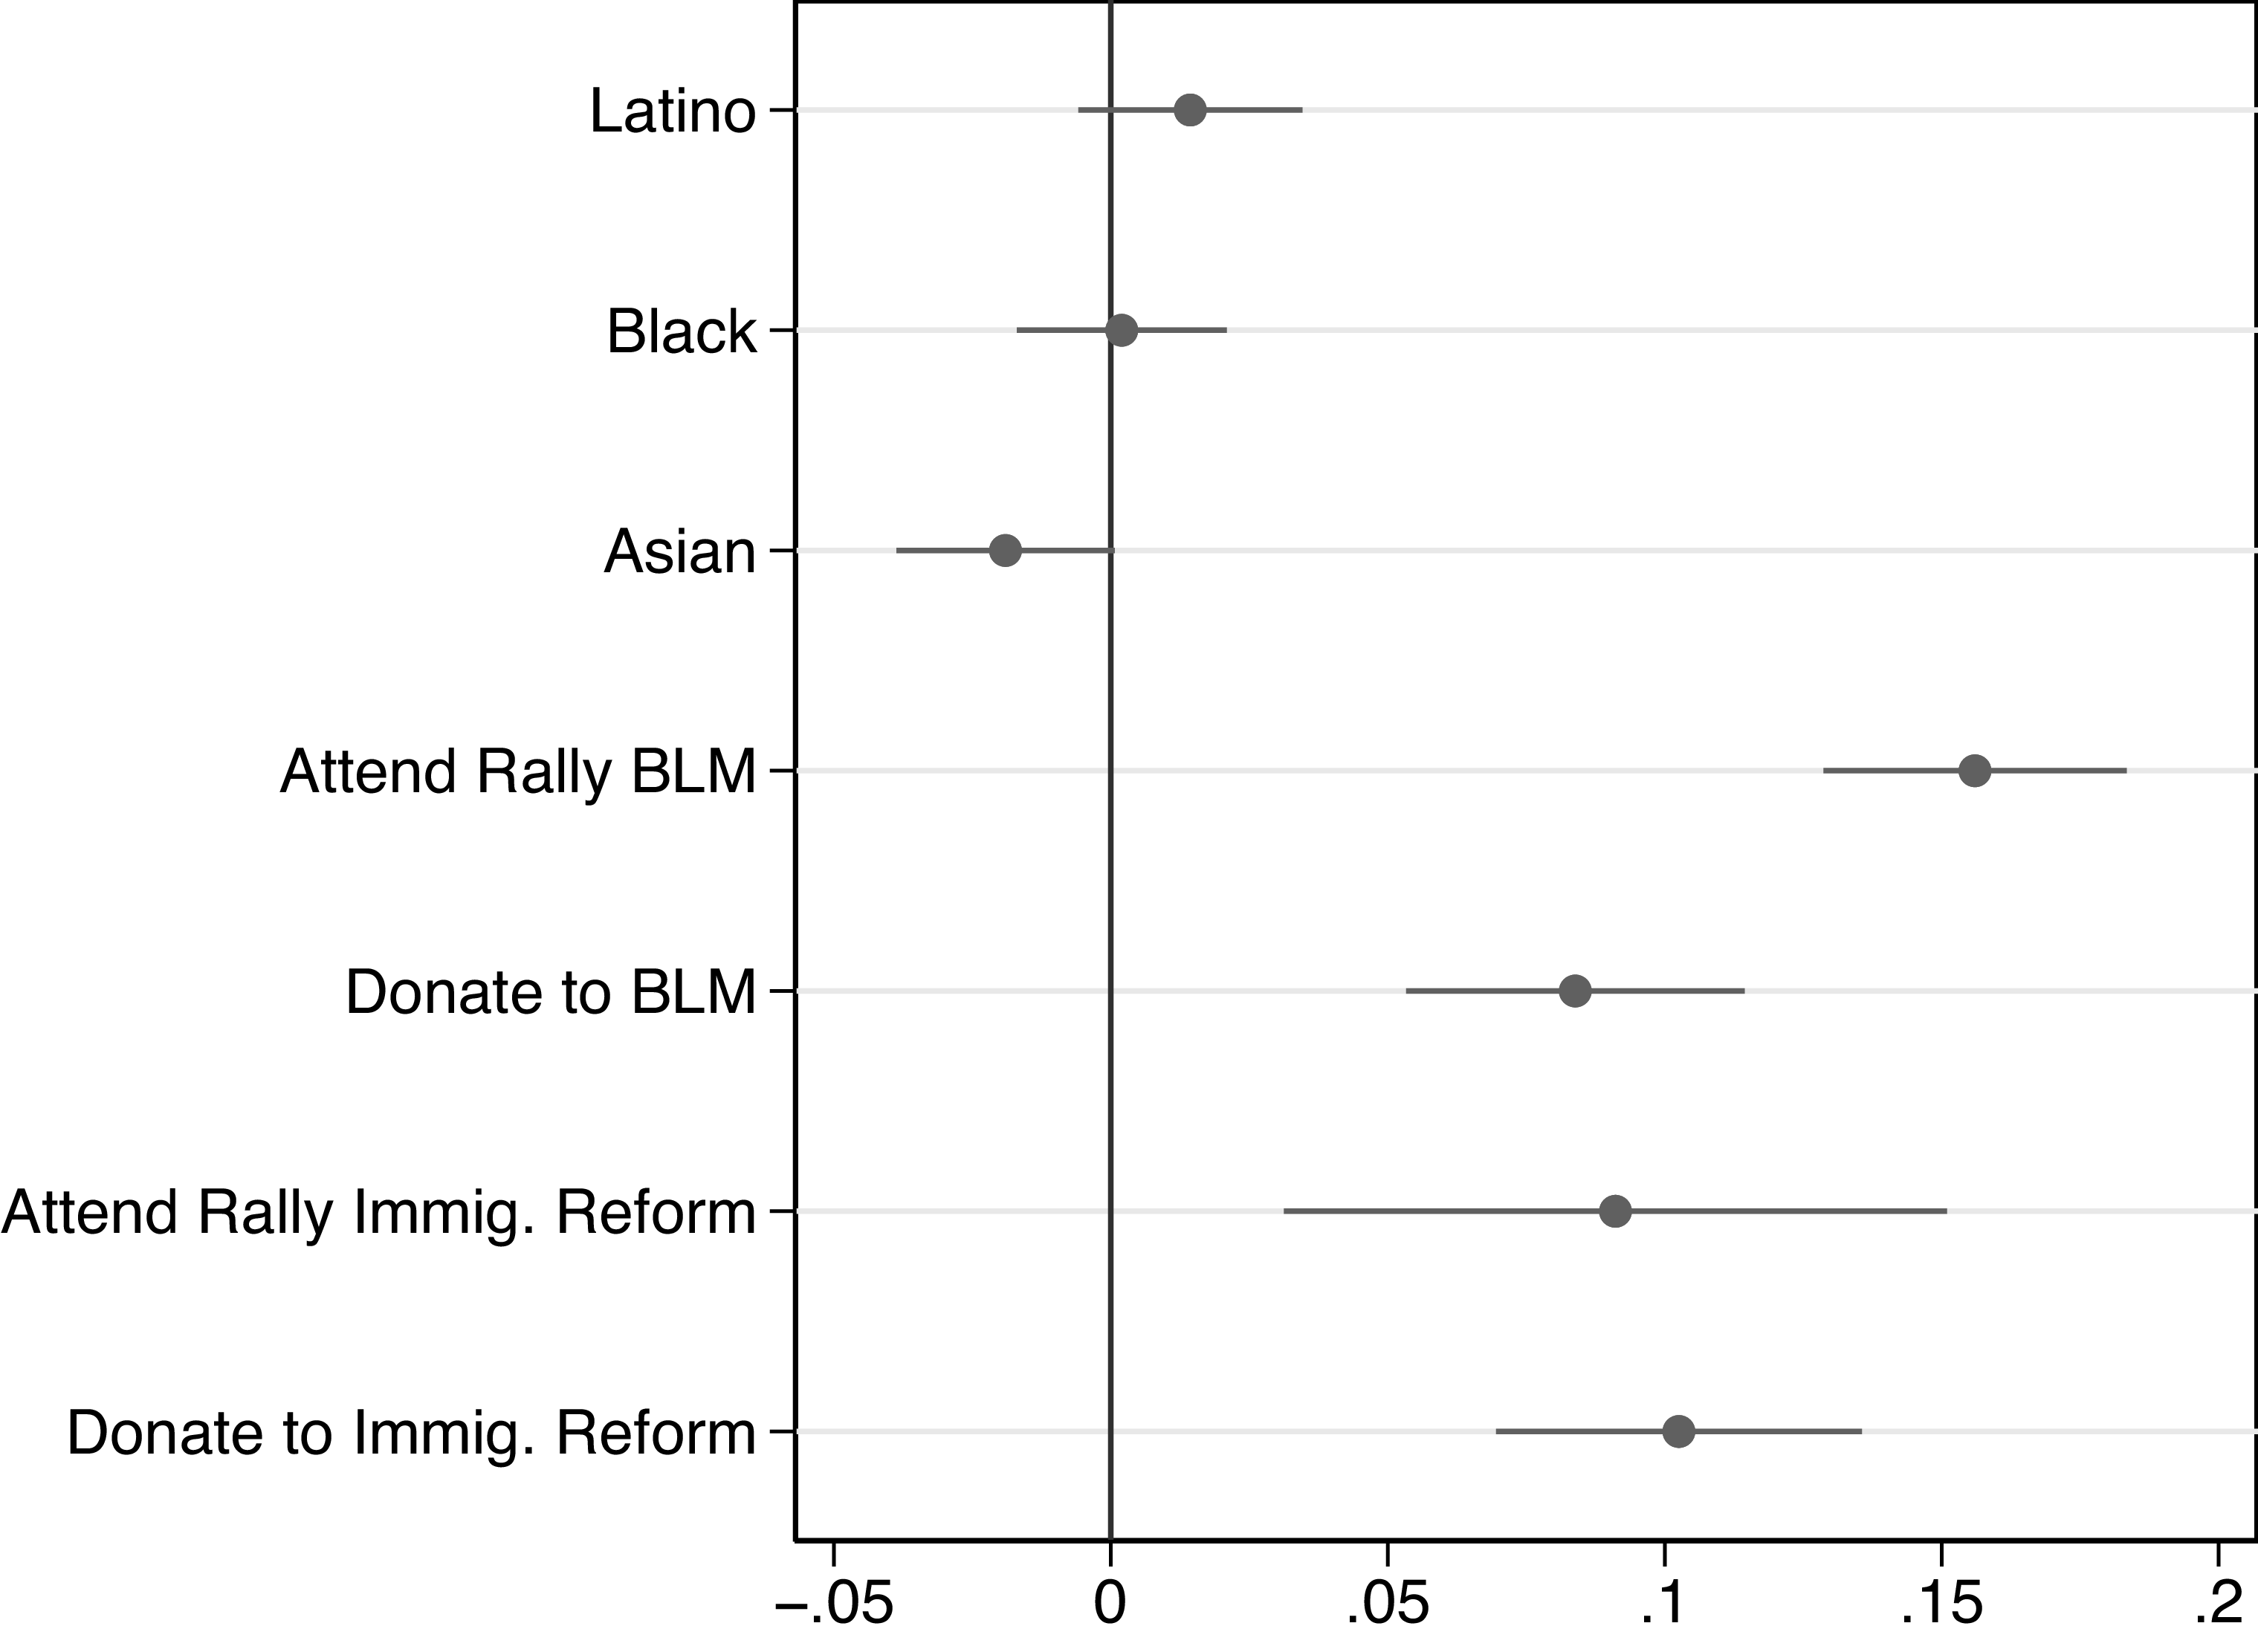
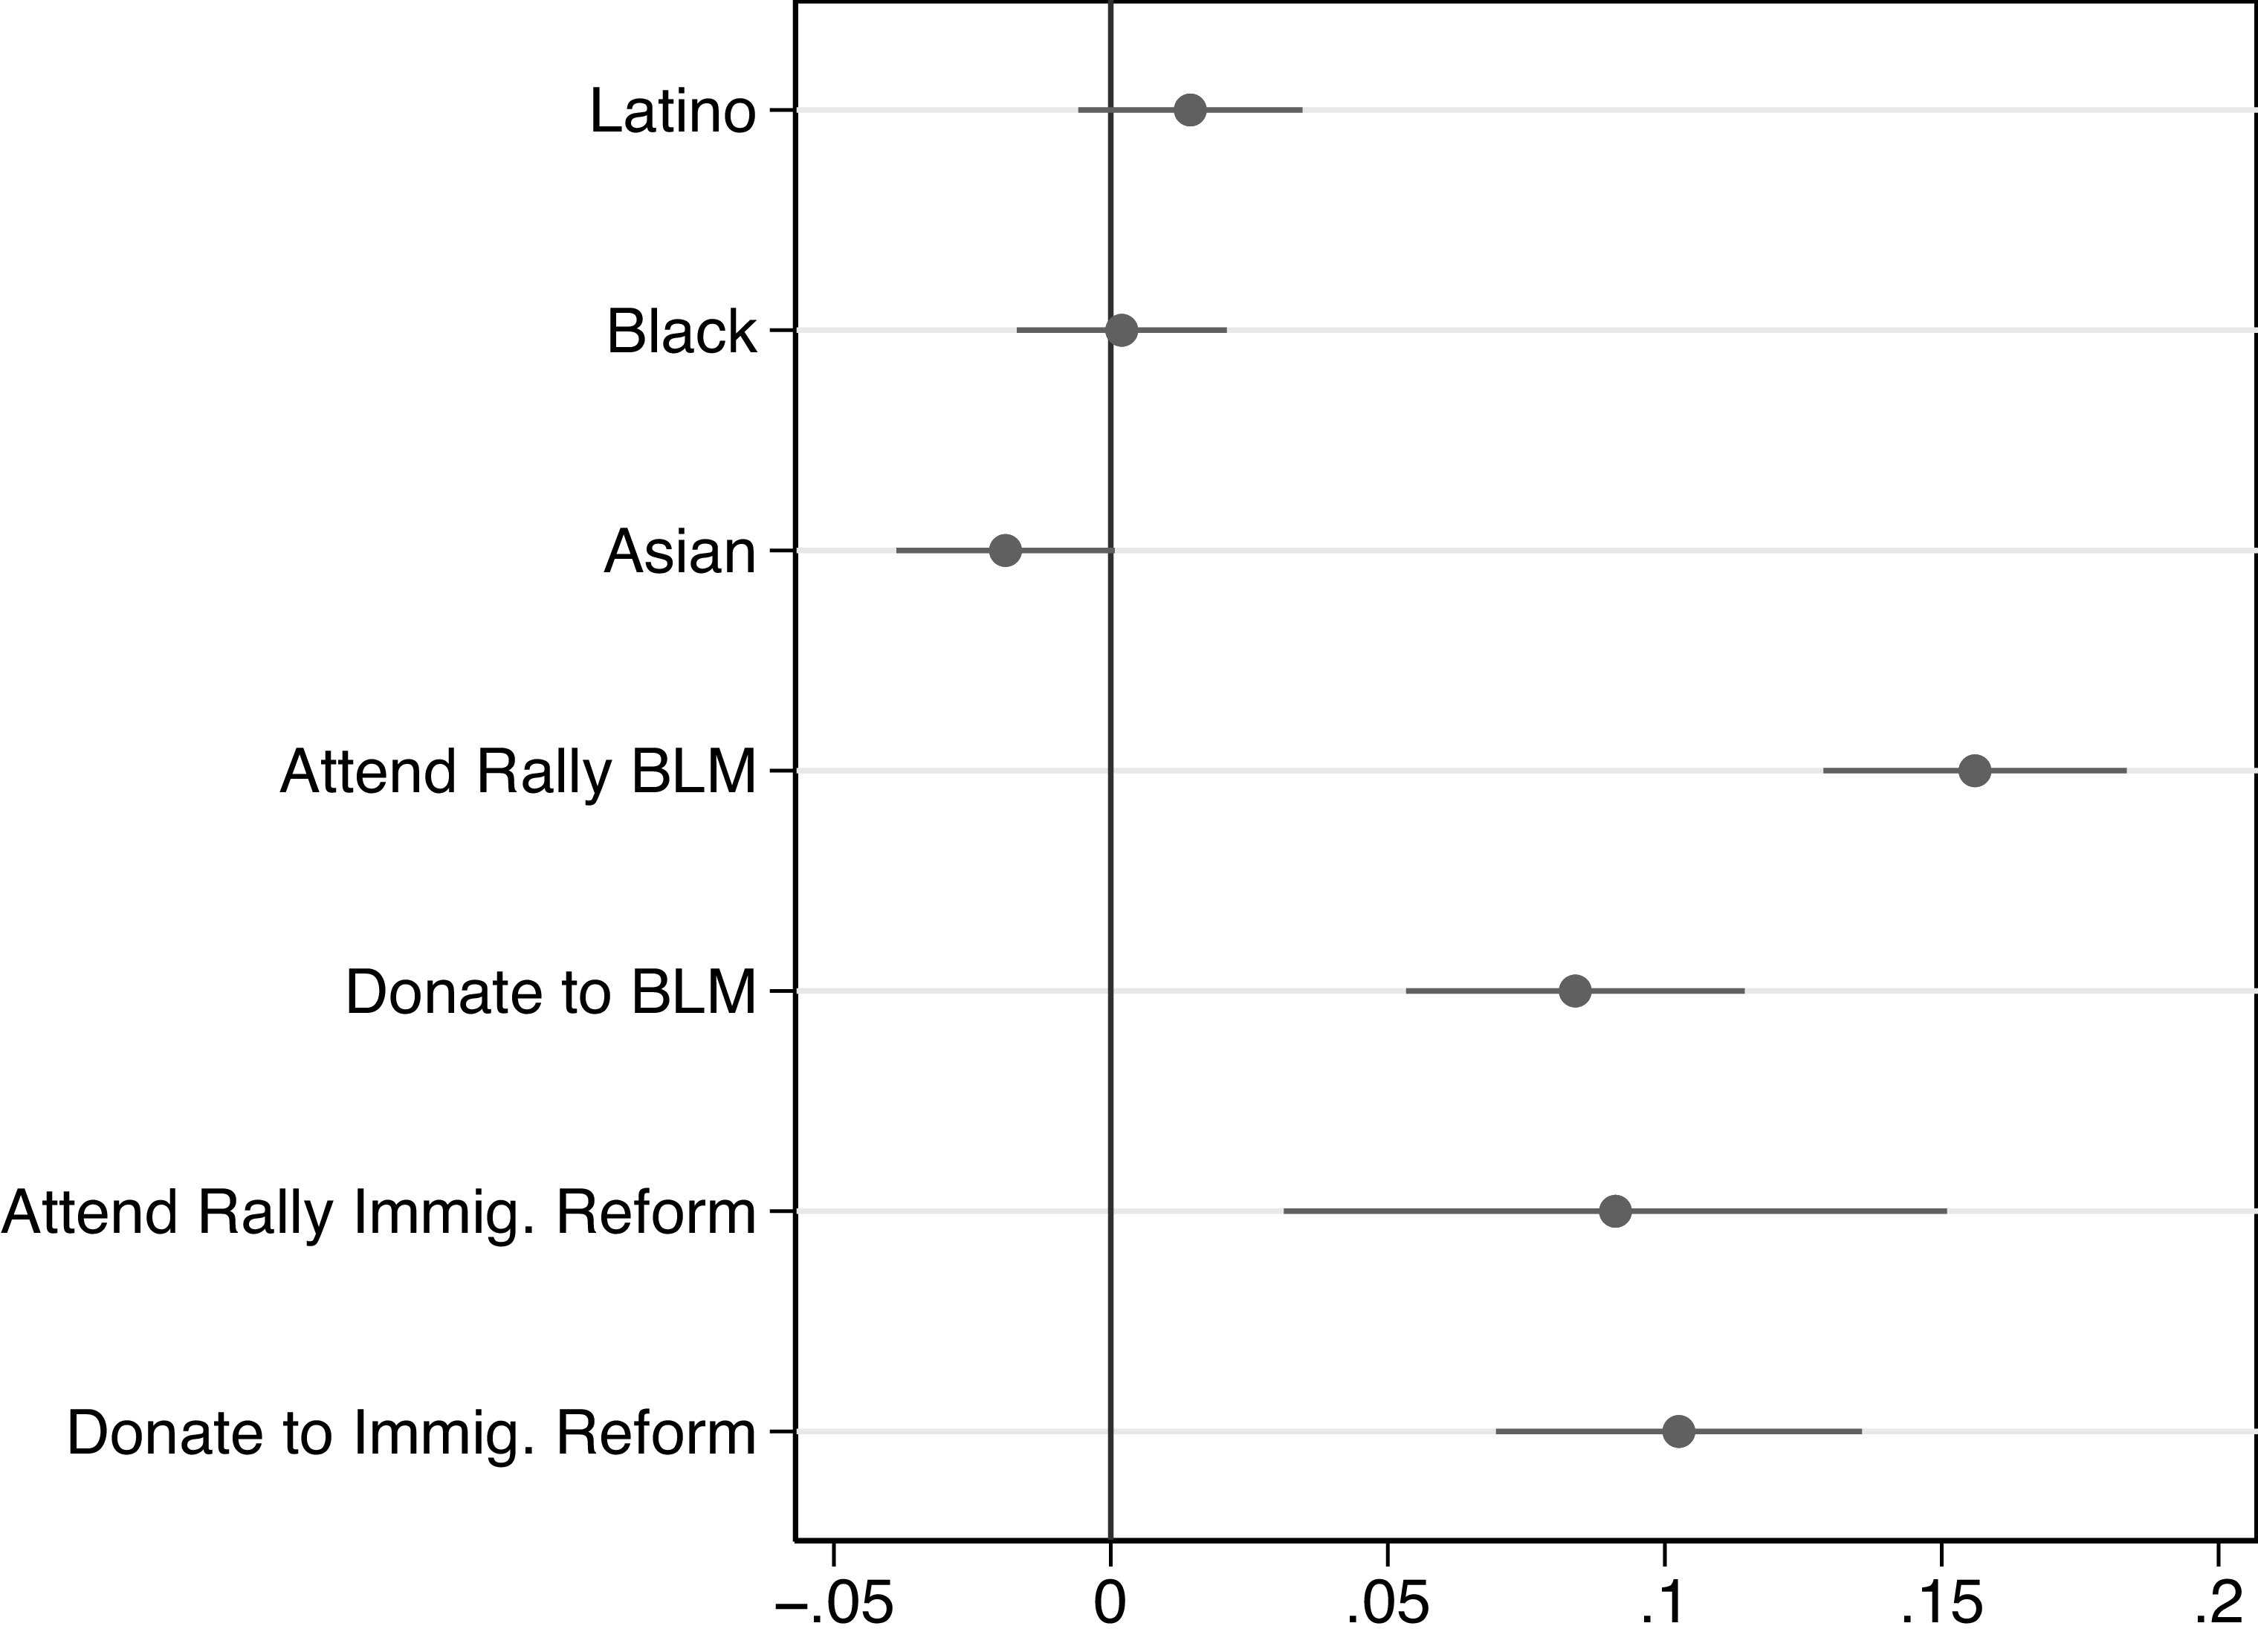
In the lower left panel, we add the set of controls that capture mobilization for racial justice. As can be seen, the coefficient estimates for Latinos and Blacks drop dramatically and are no longer statistically significant at conventional levels. This suggests that Latinos’ and Blacks’ greater interest in running for public office can be accounted for by their greater mobilization around issues of racial justice. This conclusion is further supported by Figure 3, where we show the full results for this model. As can be seen, each of the variables that capture mobilization for racial justice is positive, substantively large, and statistically significant. Finally, we add all sets of controls jointly. The results are in the lower right panel, and the coefficients for all minority groups remain statistically insignificant.Footnote 18
The impact of race/ethnicity and mobilization for racial justice on the interest in running for office.
Note: Plot shows coefficient estimates with 95% confidence intervals from model that regresses willingness to run on race/ethnicity using the set of control variables capturing mobilization for racial justice. The reference category is White and the number of observations is N = 14, 434.
In sum, the results in this section point towards the mobilizing function of recent movements for racial justice. Specifically, engagement with such movements is more common among minority groups, and at the same time strongly correlated with interest in running for office. Most importantly, the gap in nascent ambition observed between Latinos and Blacks on the one hand, and Whites on the other, is dramatically reduced when accounting for mobilization for racial justice. By contrast, none of the other factors—including SES, demography, political interest, ideology, and participation—can account for the gap.Footnote 19
Exploring the Intersection of Age and Race
In the final step of our analysis, we build on the observation from previous research that protest movements often disproportionately attract younger participants, and we examine the generational distribution of participation in these movements and interest in running for office. We expect that the youth-mobilizing functions of recent movements for racial justice help explain why Black and Latino respondents express greater interest in political candidacy.
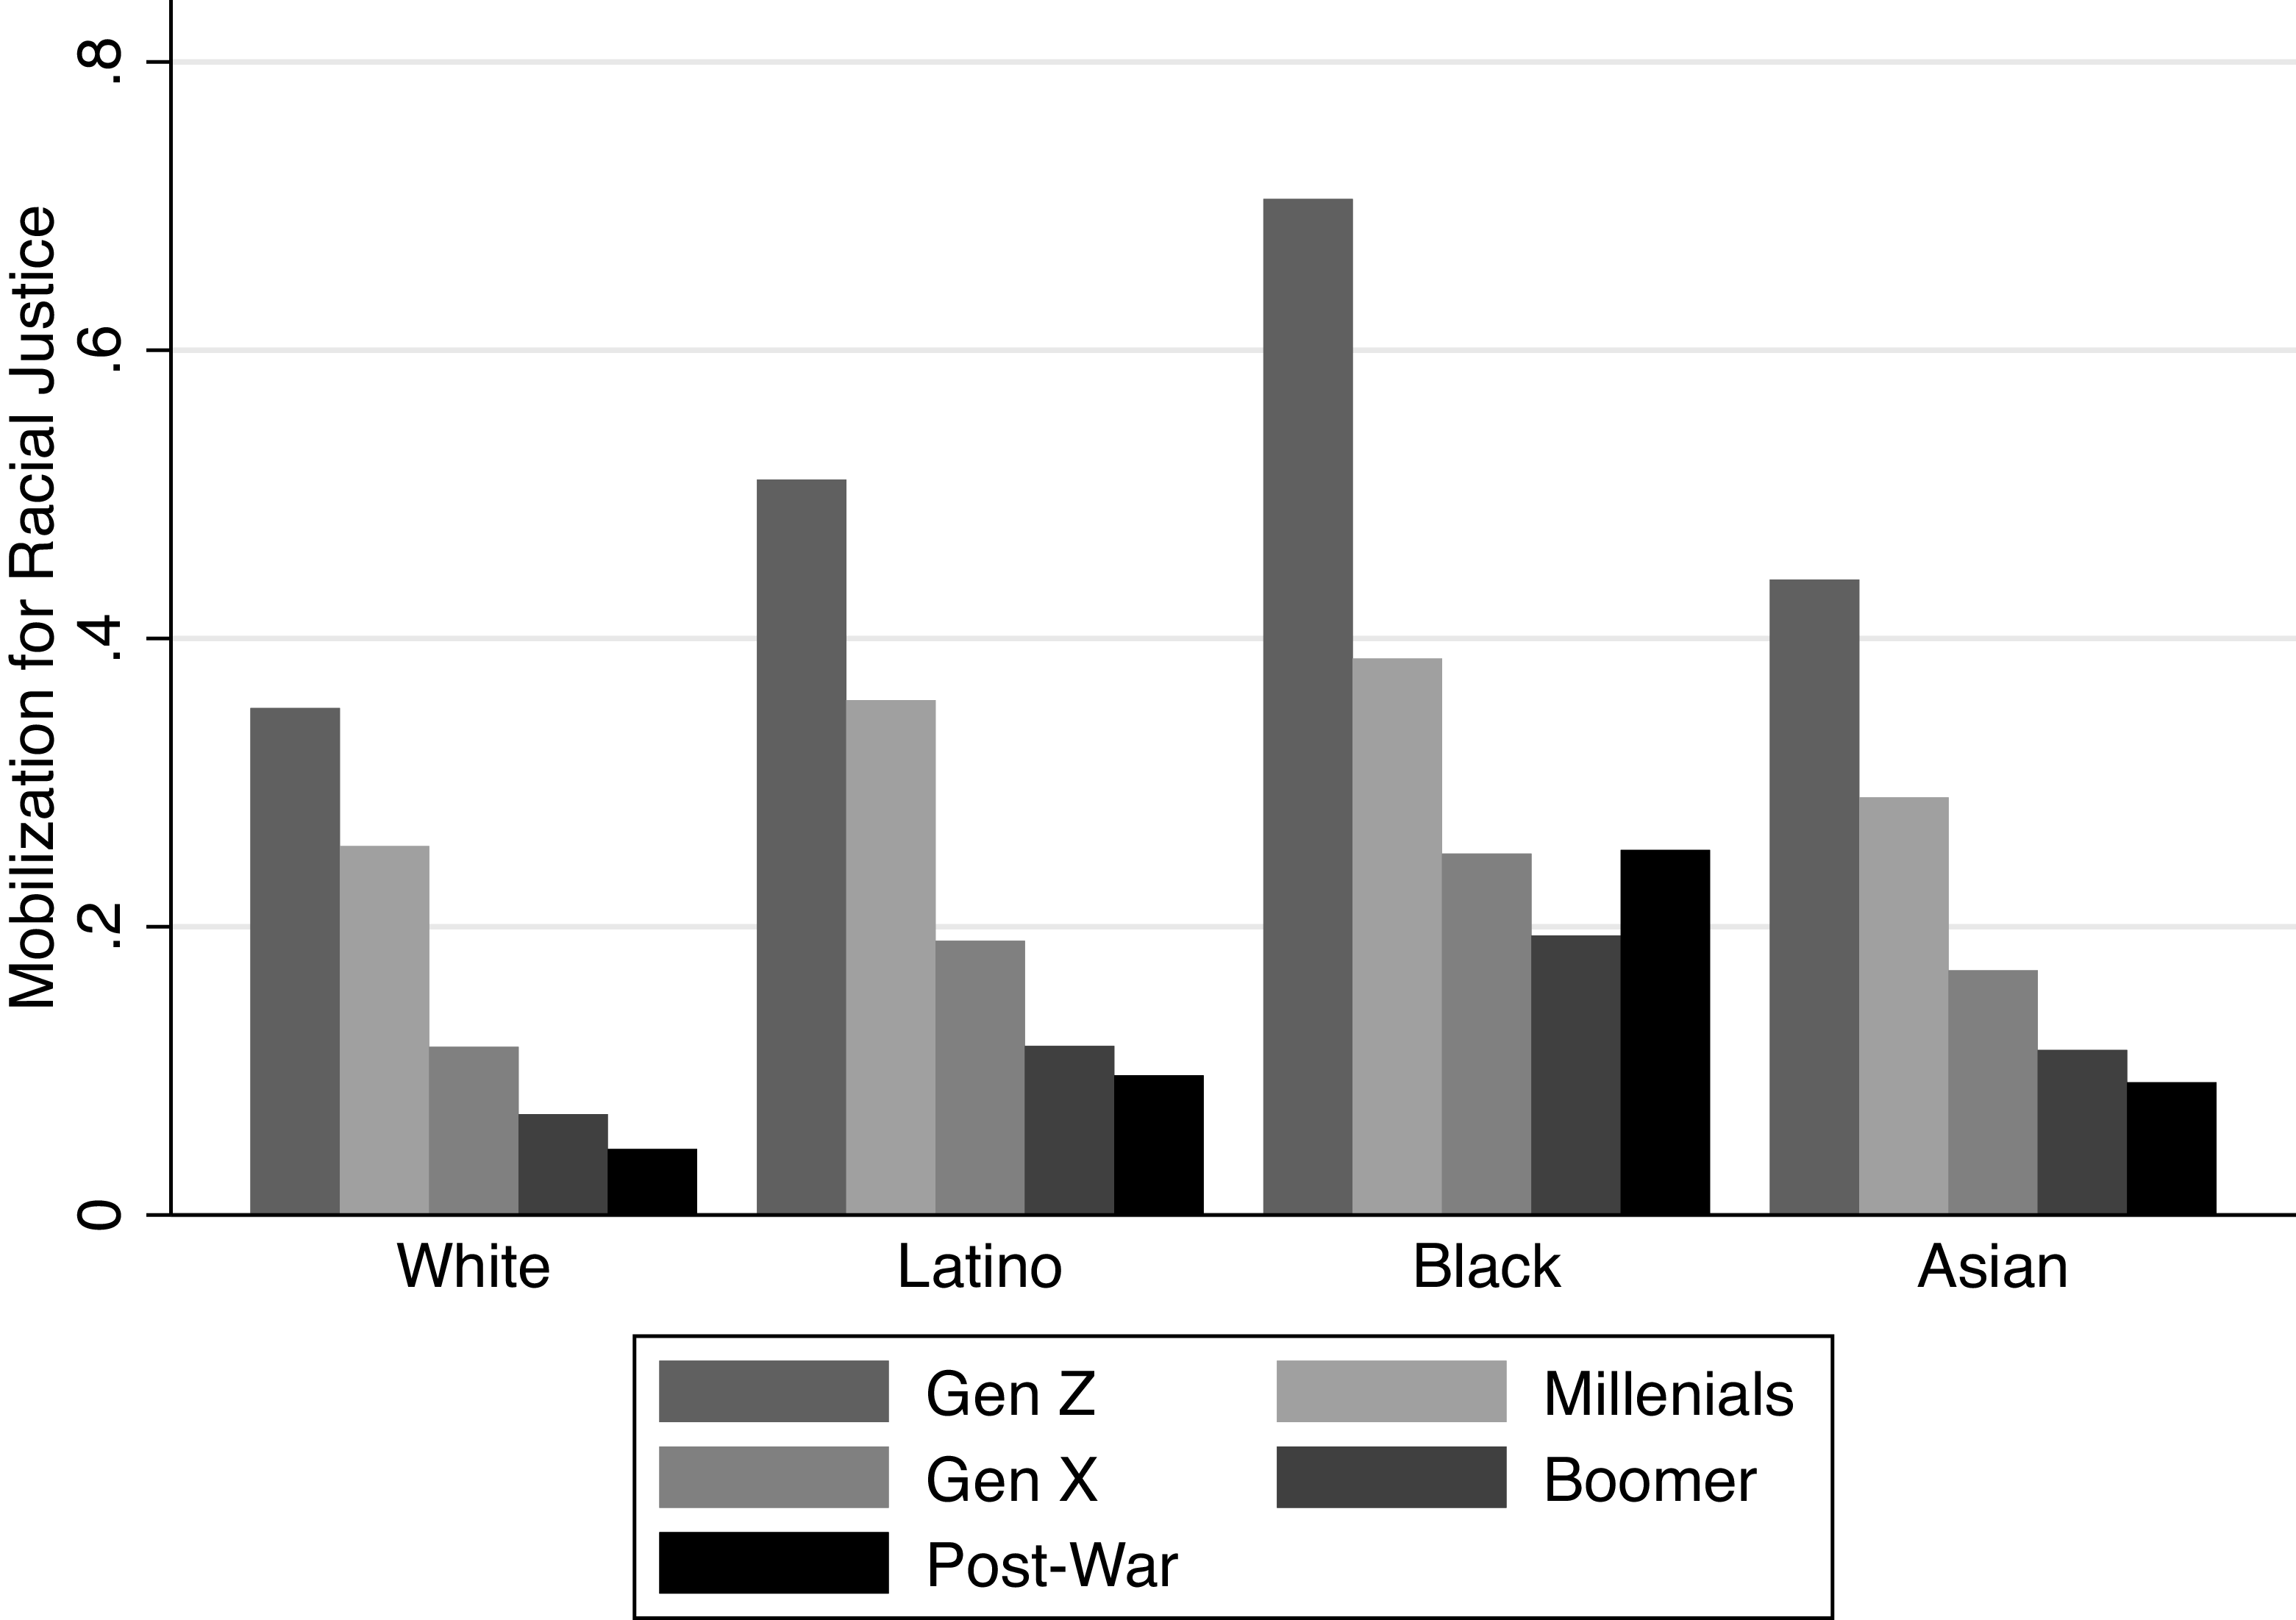
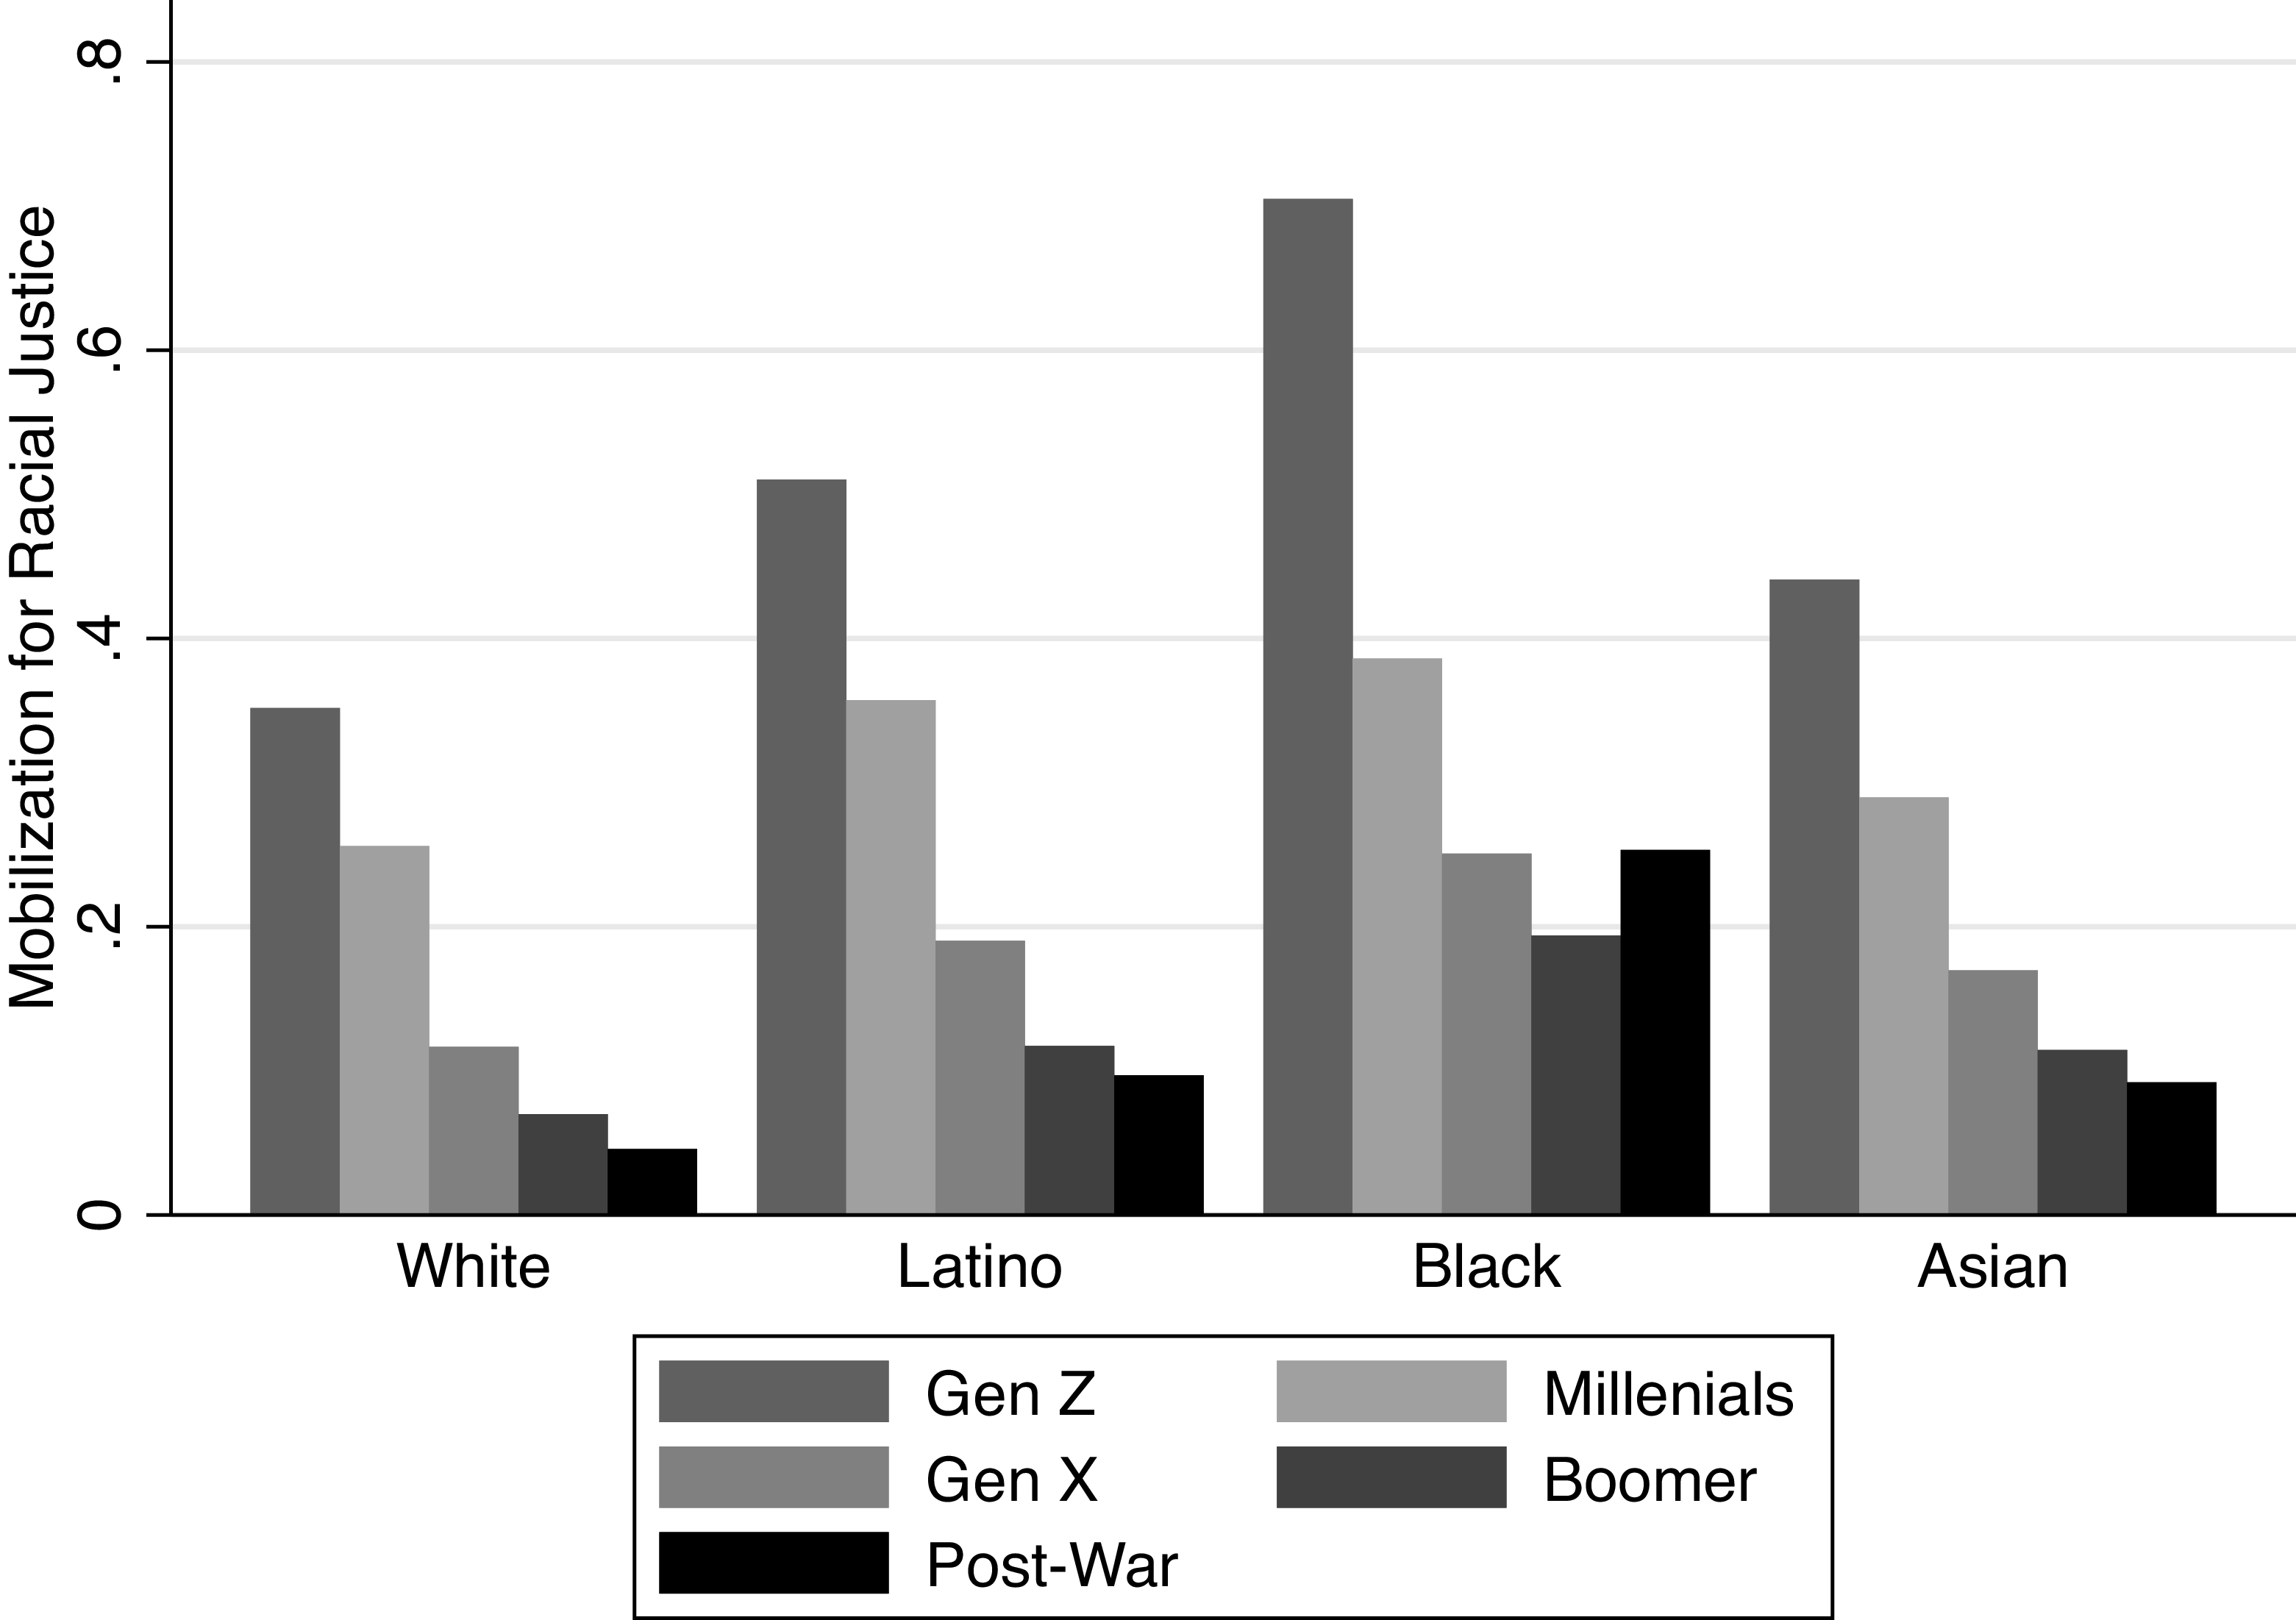
First, we analyze how participation in the four forms of mobilization for racial justice that we include in our analysis varies across generations and racial/ethnic groups. For presentational purposes, we have created an indicator that takes the value 1 if the respondent has participated in any of these events, and 0 otherwise. The results in Figure 4 show a striking generational pattern: Gen Zers and Millennials—and, to a lesser extent, Gen Xers—are much more likely to have been engaged in all four forms of mobilization. Moreover, Figure 4 shows that, within each generation, the proportion mobilized for racial justice is highest among Blacks and Latinos, and that the highest overall proportion by far is among Gen Zers from these two groups.
The share mobilized for racial justice by race/ethnicity and generation.
Note: Proportion answering yes to at least one of the questions about attending a BLM rally, donating money to BLM, attending a rally for immigration reform and donating money to campaigns for immigration reform. N = 14, 432.
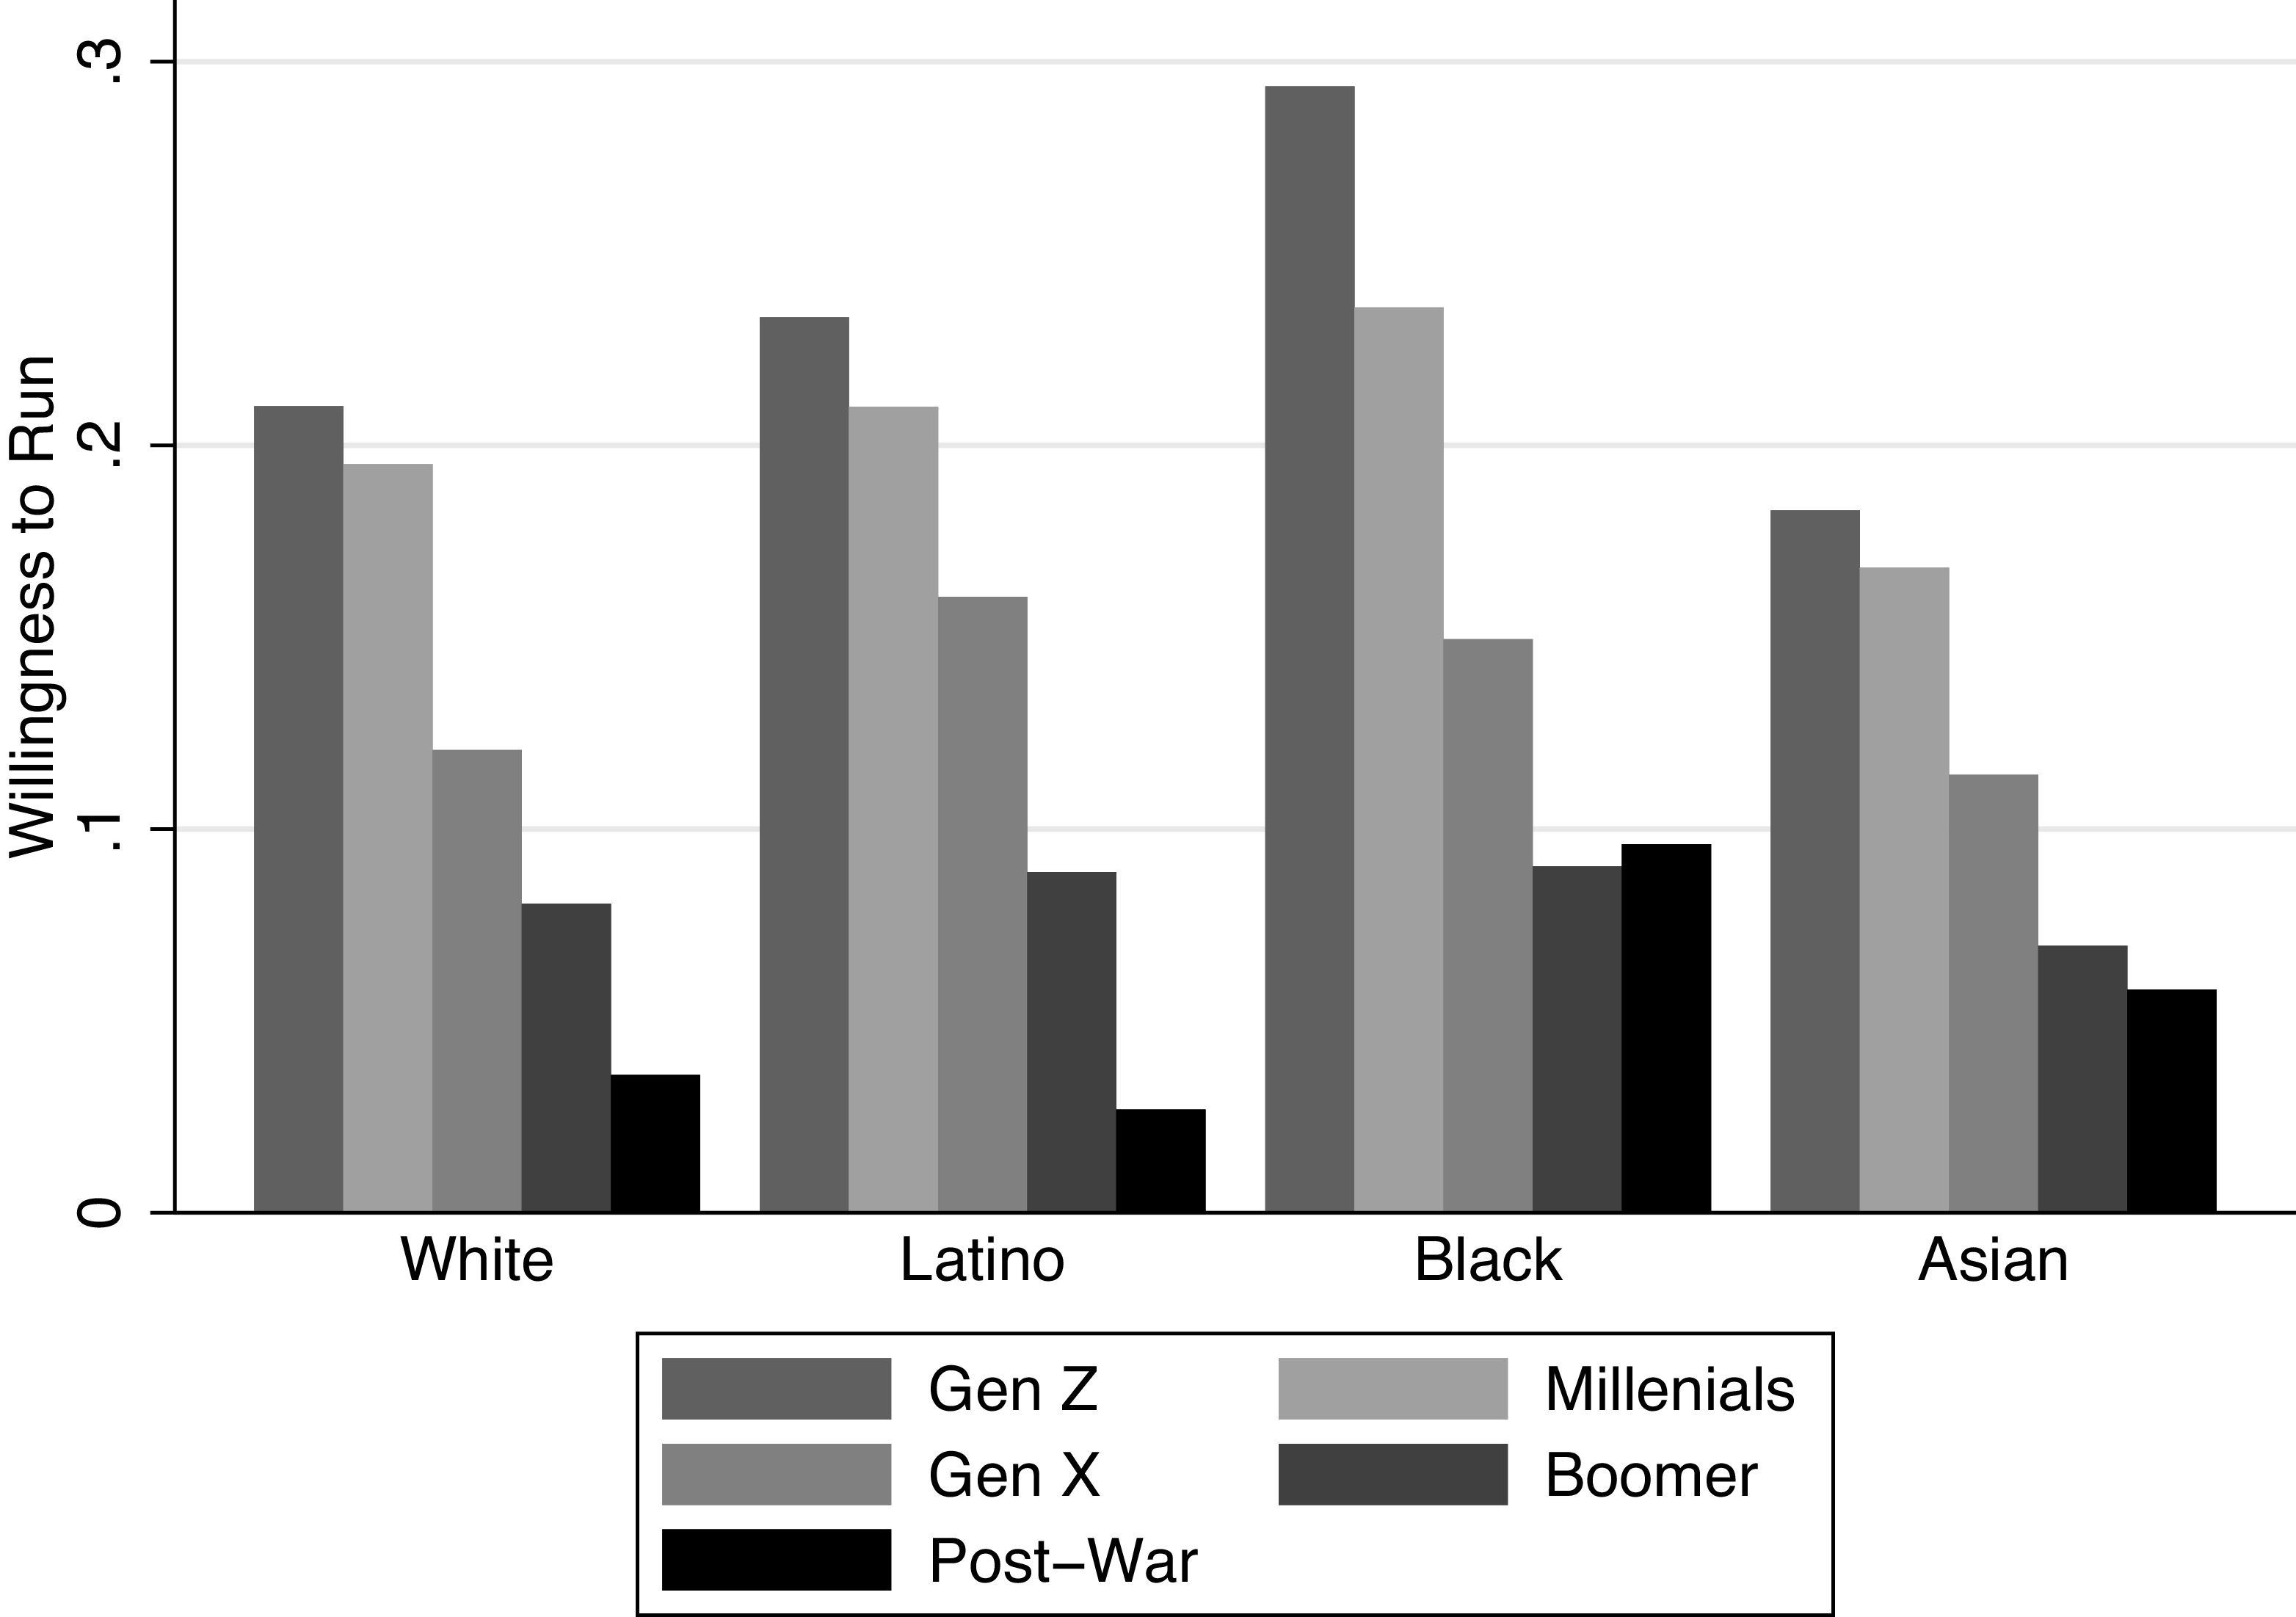
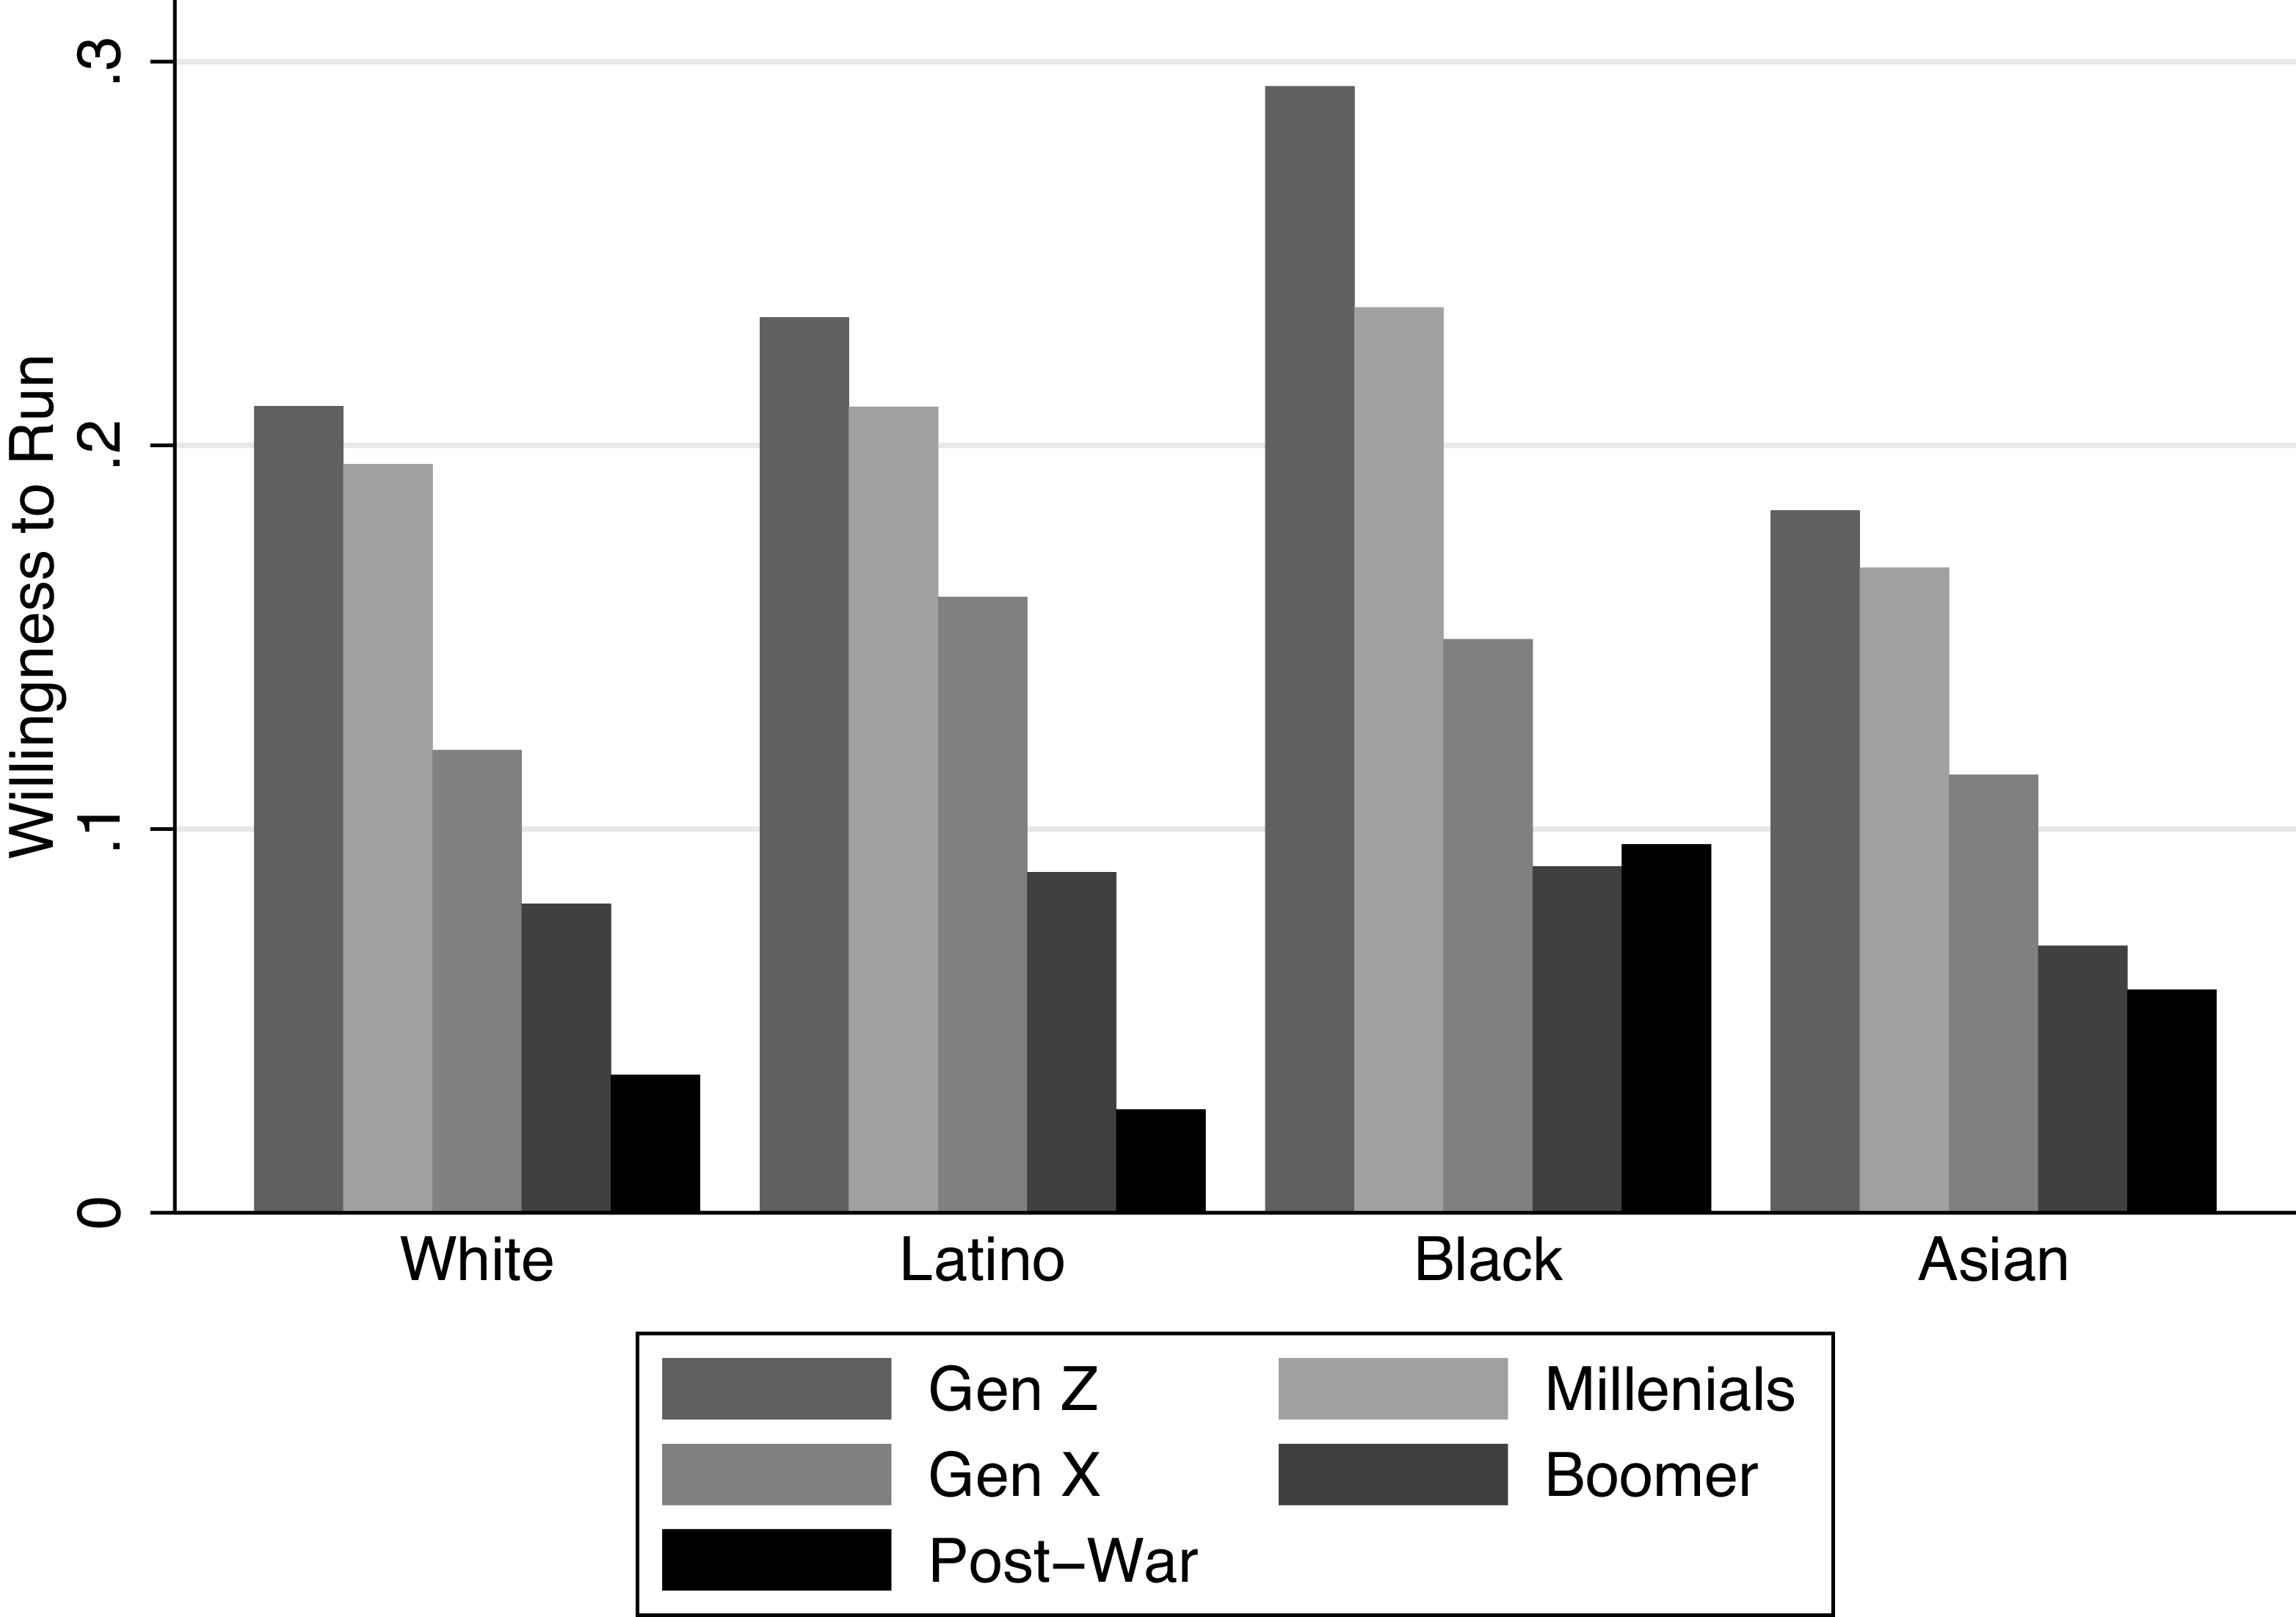
Second, given that mobilization for racial justice is skewed toward the young, we should expect, first, that interest in running for office is greater among the younger generations and, second, that the gap in political ambition between Blacks and Latinos on the one hand and Whites on the other (observed in Figure 1) is more pronounced among the young. These expectations are borne out in Figure 5. First, within all racial/ethnic groups, the younger generations are more interested in running for office. Second, comparisons across racial groups show that the within-generation gaps are generally larger for younger generations. Interestingly, Black respondents from the Post-War generation, who came of age during the civil rights era, are more interested in running for office than their generational counterparts in other racial groups. This result could indicate that the effect of mobilization for racial justice on political engagement has staying power (see also the results for this group in Figure 1). However, because respondents were not asked about participation in social movements so far back in time, we are unable to explore this possibility further.Footnote 20
The share interested in running for office by race/ethnicity and generation.
Note: Proportion answering yes to the question “If offered the opportunity, would you consider running for political office?” N = 14, 432.
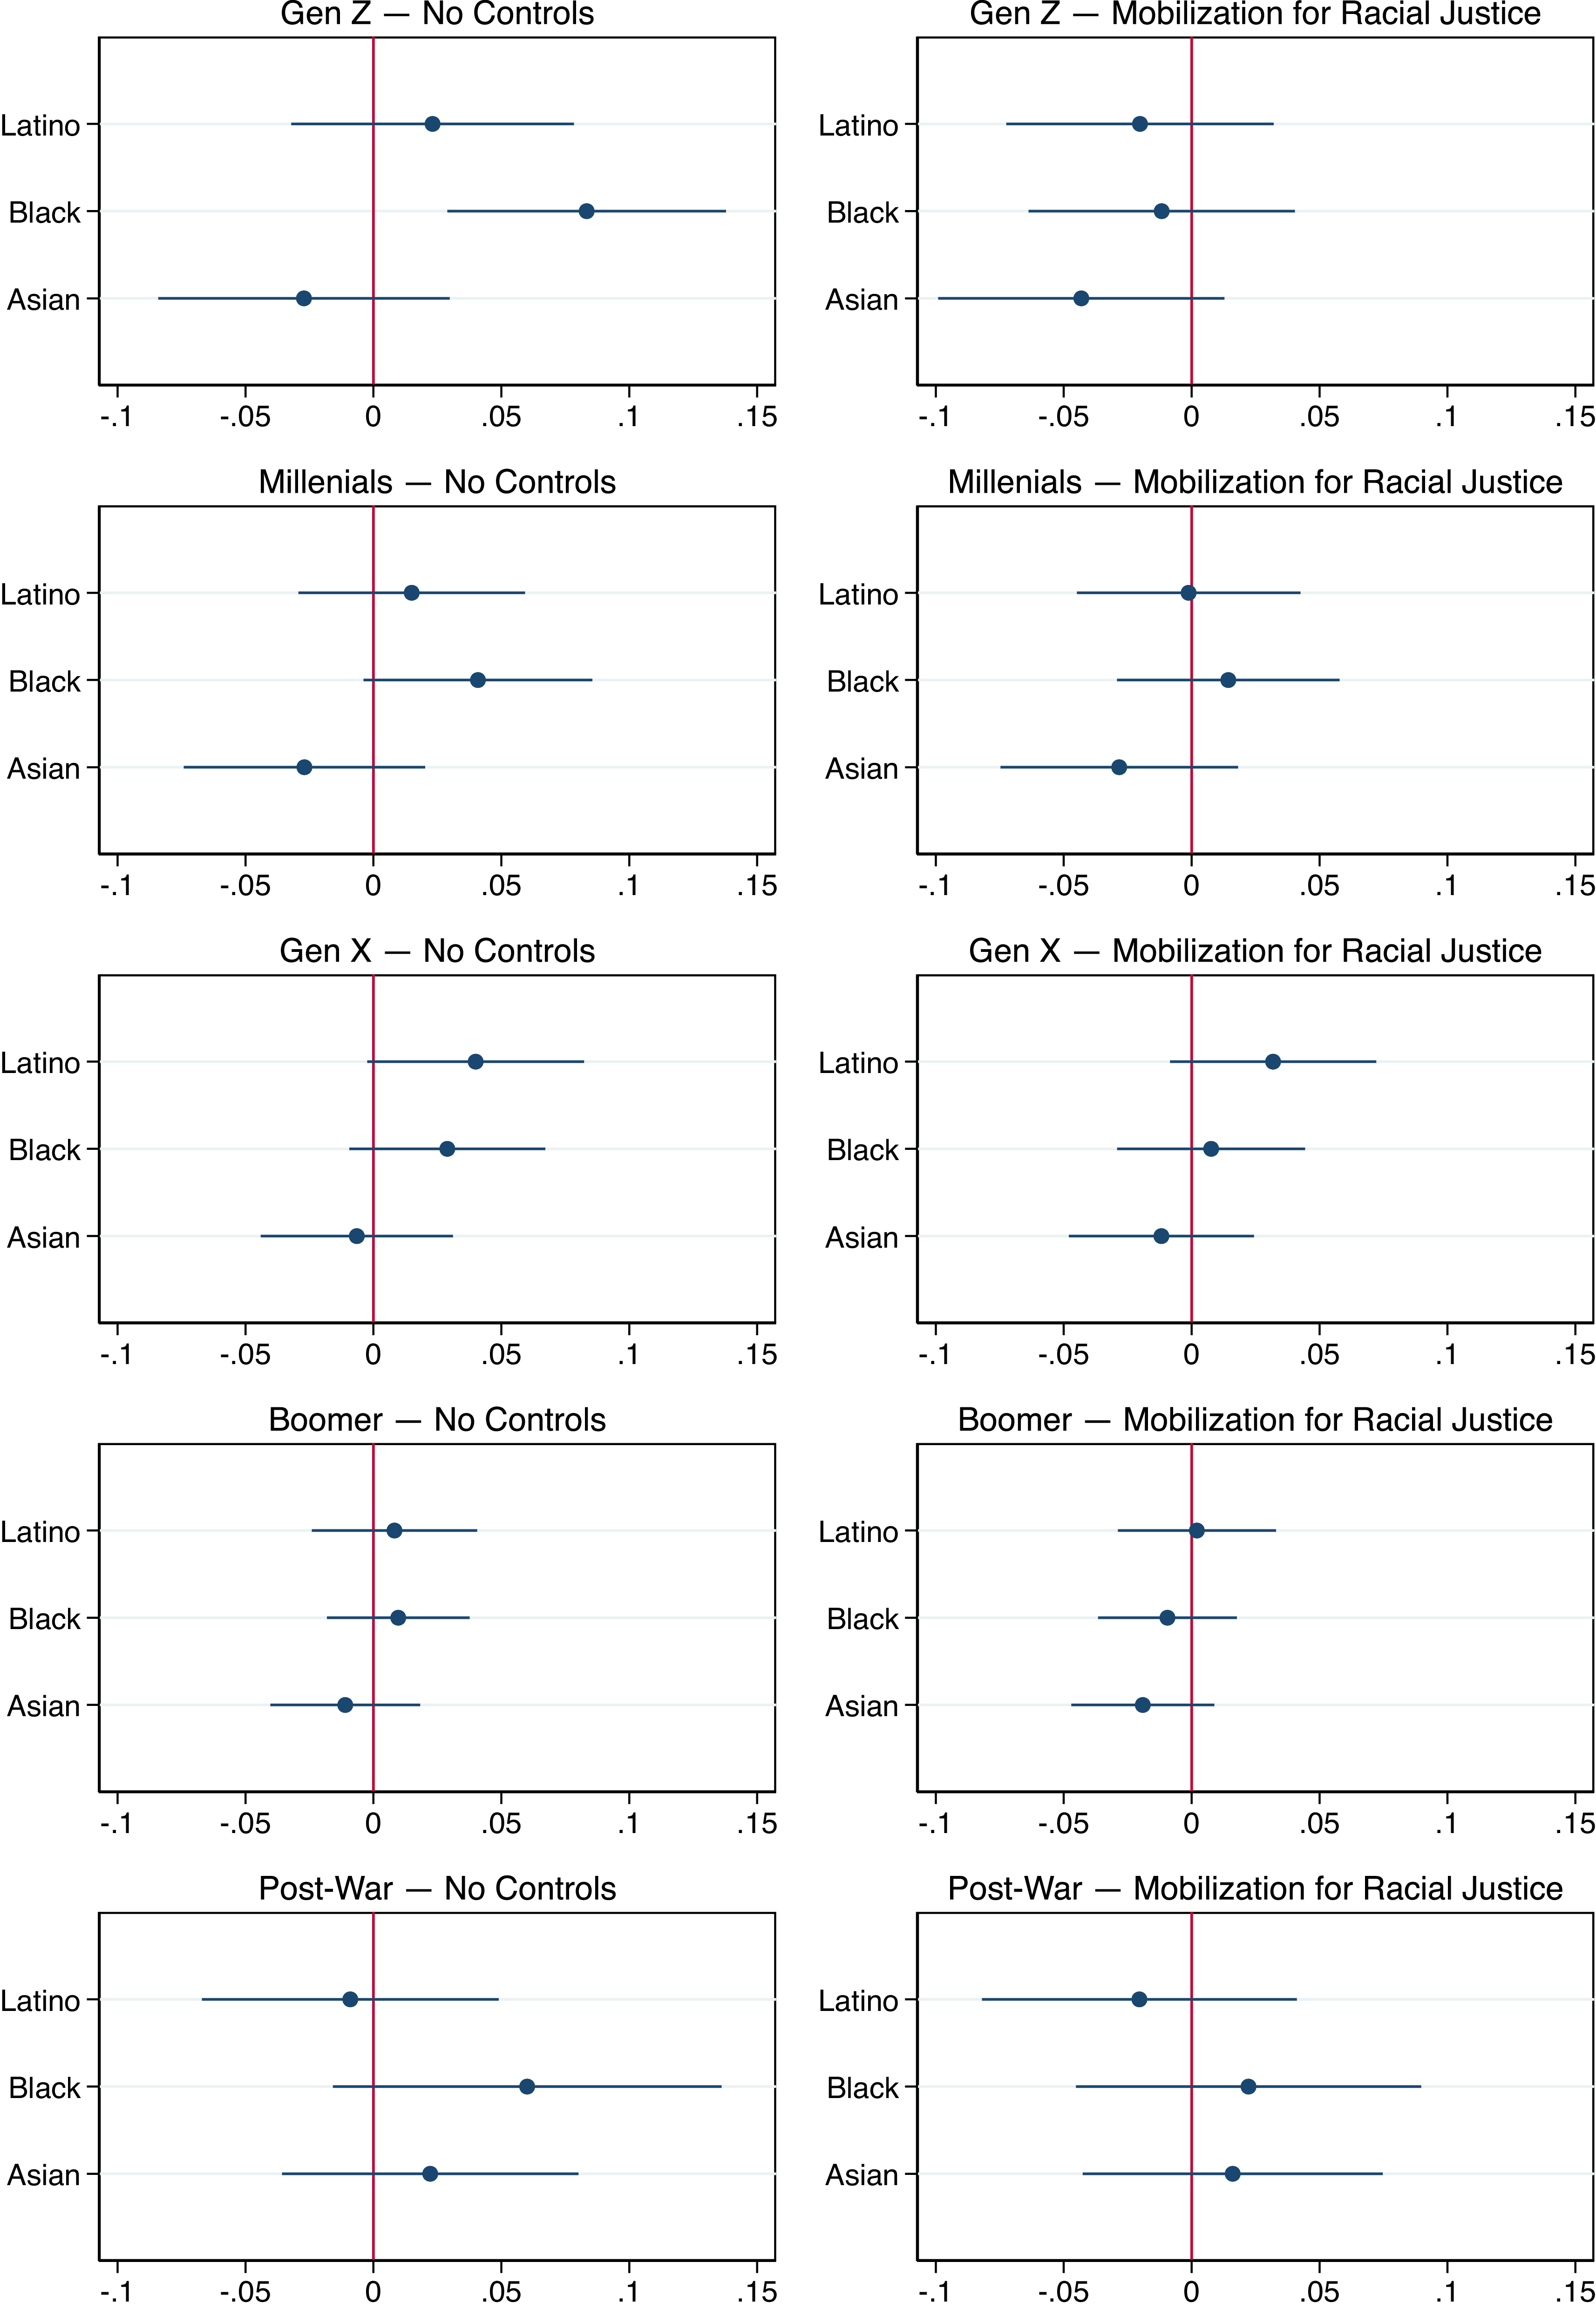
Third, given the descriptive findings above, we expect that racial/ethnic gaps in willingness to run within generations will be attenuated when we control for the four forms of mobilization for racial justice included in our analysis. Since gaps in willingness to run are mainly observed among Gen Zers, Millennials, and Gen Xers, this expectation pertains chiefly to these generations.Footnote 21 We therefore run a version of the main model (shown in Figure 2) in which we interact race/ethnicity with generation. The results appear in Figure 6.
The impact of race/ethnicity on the interest in running for office per generation.
Note: Plots show coefficient estimates with 95% confidence intervals from two models regressing willingness to run on the interaction between race/ethnicity and generation. In the left column are results from the model using no controls, and in the right column are results from the model controlling for four forms of mobilization for racial justice. Gen Z: N = 2,421. Millenials: N = 4,260. Gen X: N = 3,434. Boomer: N = 3,871. Post-War: N = 446.
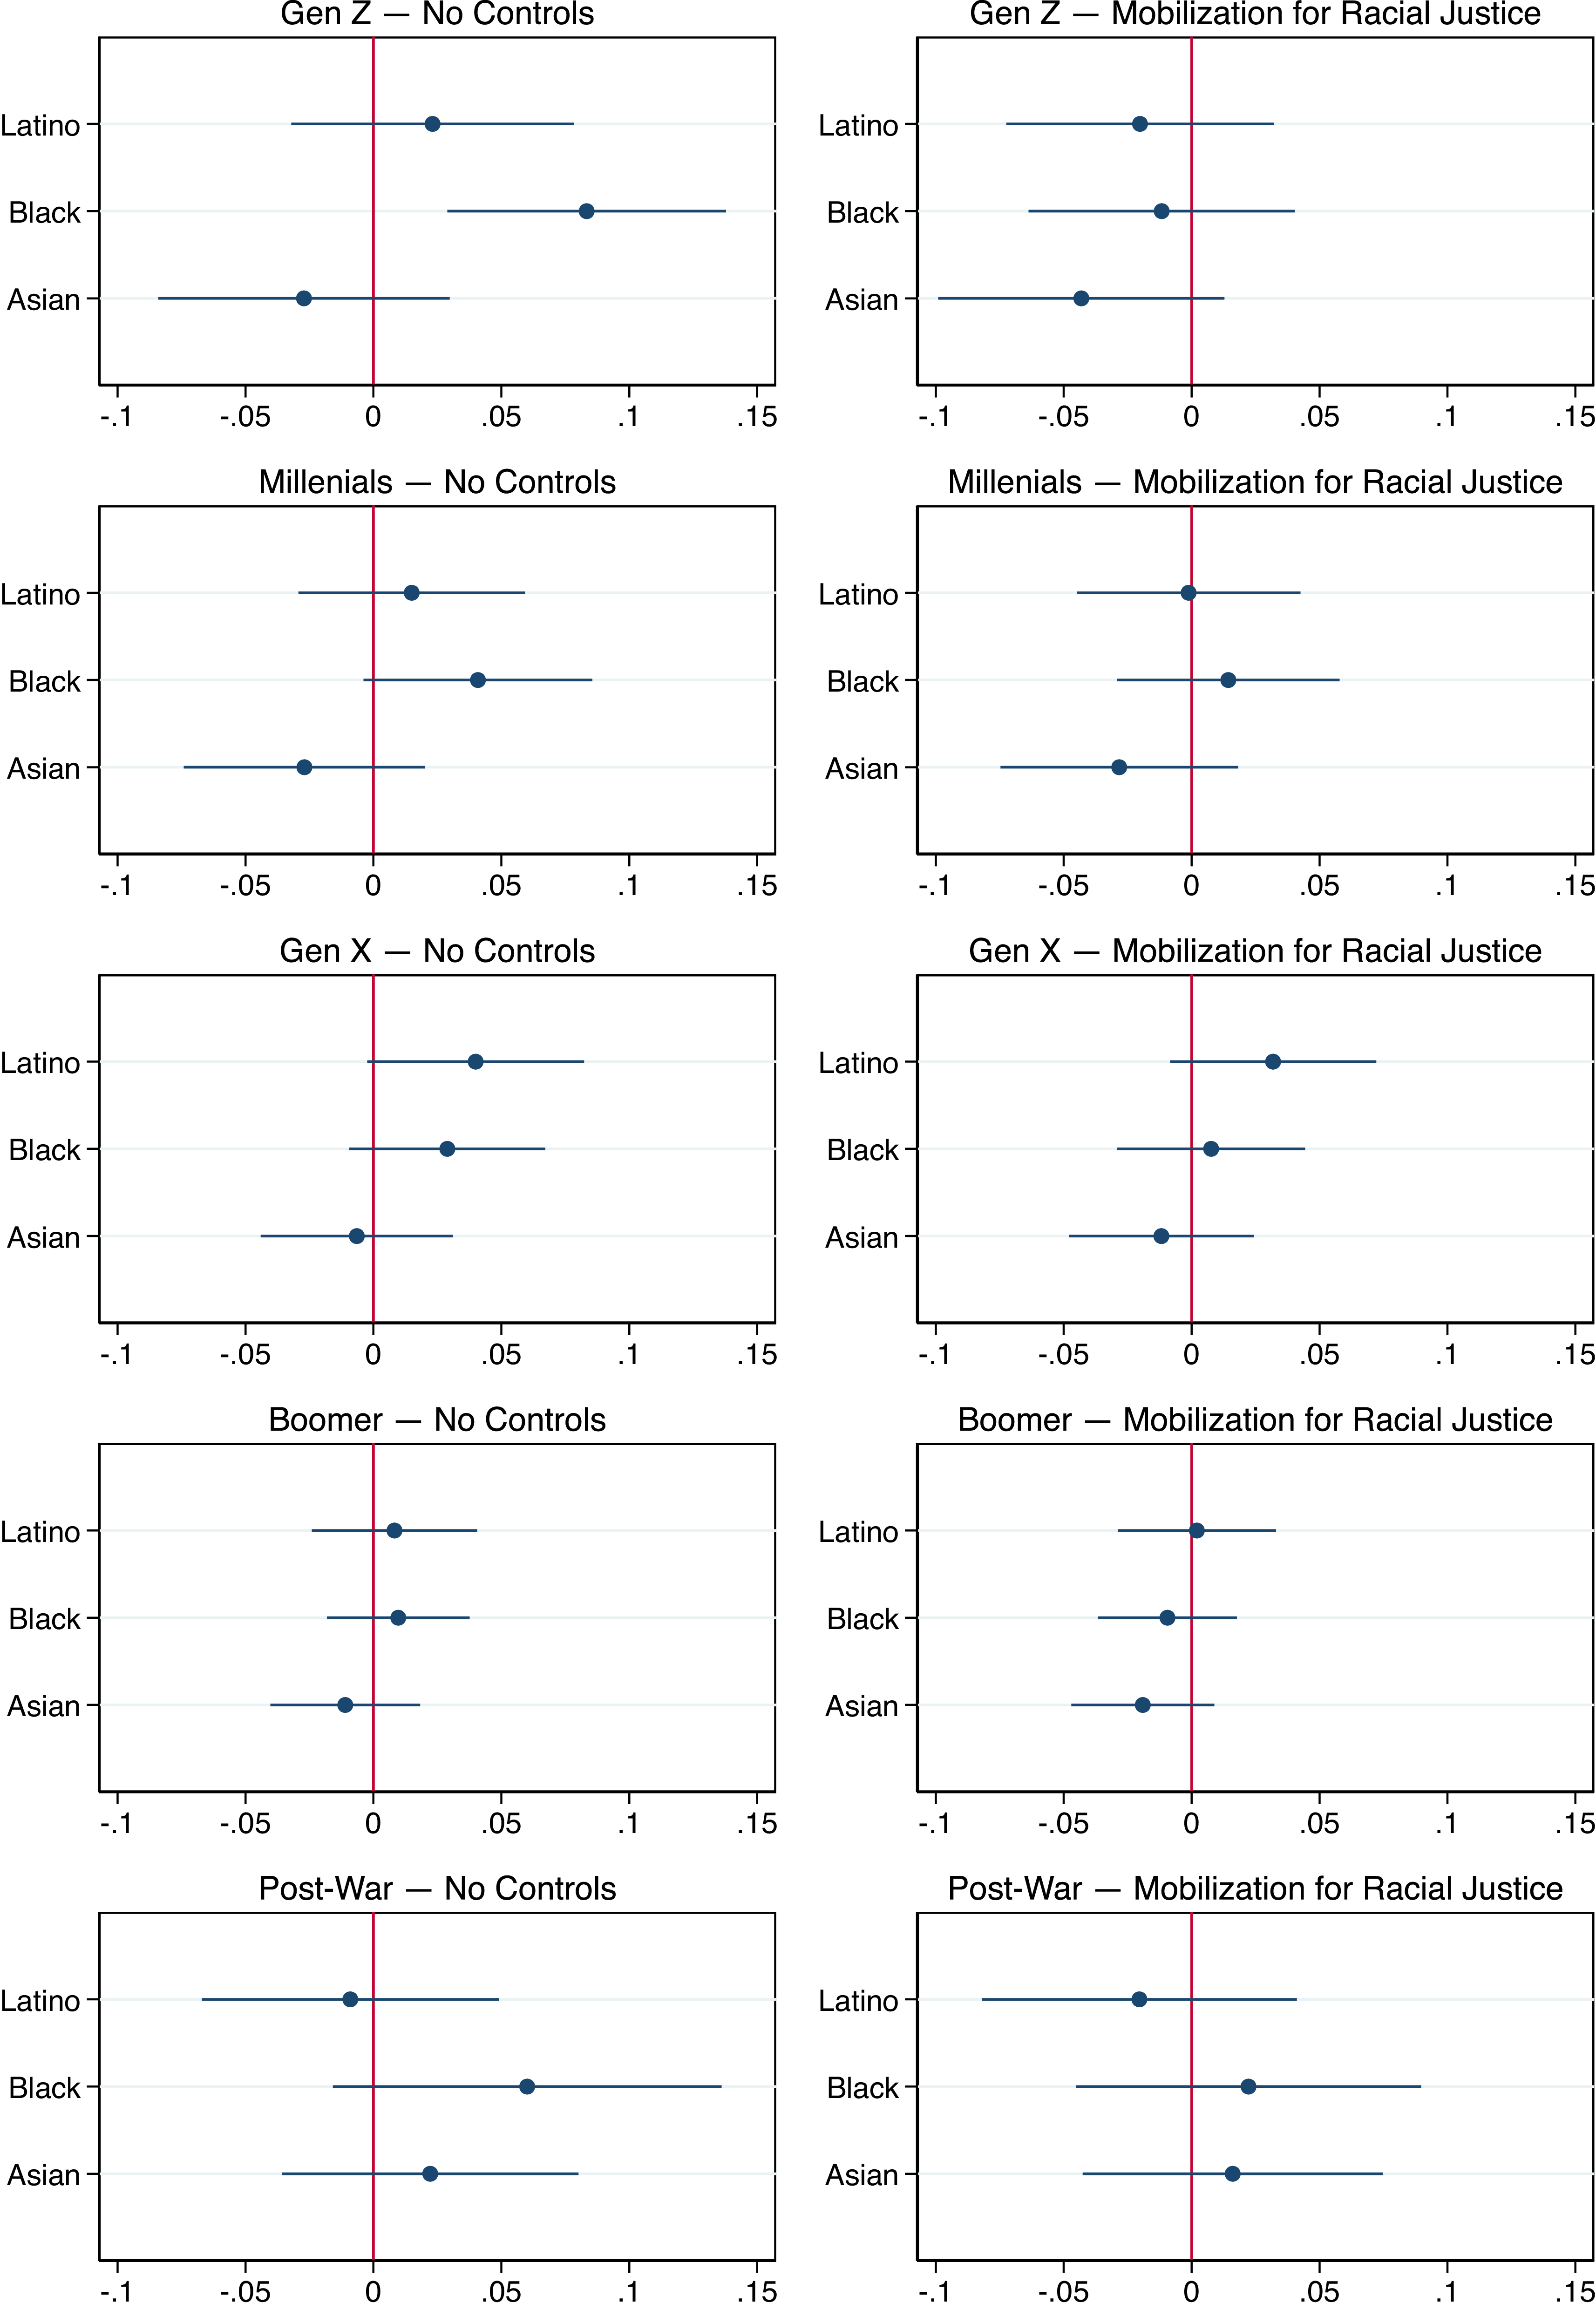
While the sample sizes for each analysis are considerably smaller (and the confidence intervals wider) than in the main analysis, the results are largely in line with our expectations. Beginning with the left column, which shows the results by generation without controls, we find that within-generation gaps between racial/ethnic groups are generally larger for younger generations. Gen Z Blacks are almost 9 percentage points more likely than Whites of their generation to be interested in running for office. The corresponding figures for Millennial and Gen X Blacks are around 4 percentage points. Comparing Latinos to Whites, gaps are between 2 and 4 percentage points for the youngest generations. However, the largest gap here is found in Gen X.
In the right column of Figure 6, we show the estimated gaps when controlling for the four forms of mobilization for racial justice used in the main analysis. As can be seen, and consistent with the main results in Figure 2, there is little evidence of racial/ethnic gaps in willingness to run once we adjust for mobilization for racial justice.
Our generational analysis is consistent with an account that emphasizes the youth-mobilizing functions of recent racial-justice movements as an explanation for why Black and Latino respondents express greater interest in political candidacy. Specifically, it is primarily younger generations that drive this racial/ethnic difference in nascent ambition, and this gap disappears once we adjust the gaps for mobilization for racial justice, in which younger generations and minorities were more engaged. Moreover, it shows that the intersection of race and generational belonging matters for interest in running for office. Specifically, we interpret the results in this section as evidence that these movements, by engaging younger generations and racial minorities more, led to the formation of a pool of politically ambitious individuals who are both younger and more racially diverse.
Conclusions
Our study highlights the untapped potential among young racial and ethnic minorities in the United States as a source of future political candidacies. Contrary to long-standing narratives that emphasize a lack of political ambition among underrepresented groups, our findings reveal that Black and Latino Americans, particularly those in younger generations, are more willing to consider running for office compared to their White and Asian counterparts. Our paper presents evidence that this racial gap in nascent political ambition is strongly tied to the mobilizing effects of participation in recent movements for racial justice, which have disproportionately engaged younger individuals from these communities.
These findings have several important implications. First, we find that race and age intersect to shape who is willing to run for office. Thus, our research underscores the importance of an intersectional approach to understanding political ambition; an approach that hitherto is relatively uncommon (but see, e.g., Holman and Schneider Reference Holman and Schneider2018; Scott et al. Reference Scott, Brown, Frasure and Pinderhughes2021). Second, our findings provide a corrective to narratives that portray minority and youth underrepresentation as stemming from a lack of candidate supply. Contrary to stereotypes of youth political apathy, our results show that younger generations are eager to take on leadership roles, at least in a political climate where the issues they care about are salient. Third, and more broadly, policies and recruitment strategies that fail to account for the types of dynamics documented herein risk overlooking key segments of the population. Political parties and organizations aiming to enhance representation should focus on recruiting from the diverse and politically ambitious pool of younger Americans. Efforts to encourage candidacy should not only address systemic barriers (relating to recruitment, financing, and endorsement, for example), but could also leverage the enthusiasm and engagement cultivated through social movements. Even after accounting for core resources and engagement factors that explain who participates politically (e.g., Verba et al. Reference Verba, Schlozman and Brady1995), involvement in racial justice protests is associated with higher levels of nascent political ambition, suggesting that protest participation may capture an additional mobilizing process beyond traditional participation pathways.
Moving forward, future qualitative and quantitative work should explore the mechanisms through which activism may translate into candidacy and examine the specific barriers that prevent young, racially diverse individuals from turning their ambitions into formal political campaigns. While our findings illustrate the potential of applying an intersectional lens to the study of political ambition, they rely on large-scale quantitative observational data. Certainly, more qualitative research is needed to understand the motivations of young potential candidates for public office, as well as work that exploits rigorous causal designs to trace the mobilizing impact of specific movements and mobilizing events. Moreover, possible avenues moving forward can build on more recent scholarship (e.g., Deckman Reference Deckman2024) to examine how gender and sexuality intersect to shape not only individuals’ political participation surrounding racial justice movements, but also their willingness to participate in elite-level politics in the future. Finally, future work should examine whether the patterns found here hold by gender and intersectional (race × gender) subgroups, among other segments of the minority population like Afro-Latinos, and study whether they hold as new social movements (e.g., the Gaza campus protests) arise and potentially translate into future activism and political ambition.
Supplementary material
The supplementary material for this article can be found at https://doi.org/10.1017/rep.2026.10074.
Acknowledgements
We are grateful to conference participants at the 2024 WPSA and 2024 MPSA as well as three anonymous reviewers for helpful comments and suggestions.
Funding statement
This work was supported by the Swedish Research Council (grant number 2023–00827).
Competing interests
None.
Ethical standards
This research includes the use of third-party survey data: the Collaborative Multiracial Post-election Survey (CMPS). The principal Investigators of the CMPS acquired ethical approval prior to fielding the survey.


 Open access

