

1. INTRODUCTION
The lower limit of permafrost elevation on the northern slope of the Himalaya is generally considered as 5100–5300 a.s.l. (Cheng and Wang, Reference Cheng and Wang1982; Gruber, Reference Gruber2012; Zou and others, Reference Zou2017). Above the lower limit, there are thousands of moraine-dammed lakes (Nie and others, Reference Nie, Liu and Liu2013; Wang and others, Reference Wang, Xiang, Gao, Lu and Yao2014a; Zhang and others, Reference Zhang, Yao, Xie, Wang and Yang2015). These moraine dams are generally composed of poorly sorted sediment, frozen soil, and buried ice. Changes in the hydraulic and thermal states within a dam, which are the key parameters for assessing the dam stability and probability of moraine-dammed lake outburst flood (Wang and others, Reference Wang2012), are closely related to the ground freezing and thawing processes. It has been reported that the permafrost has been gradually degrading in the Tibetan Plateau (TP) during the past decades, and it is presumed that this degradation will continue or accelerate in the coming decades (Wu and Zhang, Reference Wu and Zhang2008, Reference Wu and Zhang2010; Zhang and Wu, Reference Zhang and Wu2012; Wang and others, Reference Wang, Jin and Shi2014b). At global scale, this degradation can affect climate (Cheng and Wu, Reference Cheng and Wu2007), lake volume changes (Li and others, Reference Li, Liao, Guo, Liu and Shen2014; Zhang and others, Reference Zhang2017), hydrology and water resources (Woo and others, Reference Woo, Kane, Carey and Yang2008; Niu and others, Reference Niu, Ye, Li and Sheng2010), slope stability (Gruber and Haeberli, Reference Gruber and Haeberli2007; Gruber and others, Reference Gruber2016; Haeberli and others, Reference Haeberli, Schaub and Huggel2016), ecology and engineering projects (Yang and others, Reference Yang, Nelson, Shiklomanov, Guo and Wan2010; Wu and Niu, Reference Wu and Niu2013) in the TP. Many models have been developed for simulating the ground freezing and thawing processes over the last decades, and they are frequently used to reproduce the historical behavior of permafrost and forecast future changes of frozen ground and associated impacts on relevant processes, e.g. permafrost stability (Riseborough and others, Reference Riseborough, Shiklomanov, Etzelmüller, Gruber and Marchenko2008; Wang and others, Reference Wang2017). Permafrost degradation has led to decreased stability and changes in the internal structure of moraine dams. Melting of buried ice within a moraine dam can reduce the height of the freeboard and make the seepage increase (Richardson and Reynolds, Reference Richardson and Reynolds2000a, Reference Richardson and Reynoldsb). Thawing permafrost in a moraine dam can weaken the dam, which will cause these dams to fail more easily if they are overtopped by a displacement wave or offer less resistance to outflow erosion (Balmforth and others, Reference Balmforth, Hardenberg, Provenzale and Zammett2008; Westoby and others, Reference Westoby2014). Therefore, in the context of general permafrost degradation and increasingly serious threats of glacial lake outburst floods (GLOFs) in the TP, it is of great practical significance to analyze the states of water and heat in the moraine dams and associated impacts on the dam stability.
Studies of the typical glacial lake moraine dams have mainly focused on the qualitative assessments of dam stability and hazard risk of GLOFs with respect to geometry and internal structure (e.g. ice cores or interstitial ice) (McKillop and Clague, Reference McKillop and Clague2007; Wang and others, Reference Wang2012). It is usual to use a ratio of moraine width to height to describe the shape of a moraine dam, i.e. the smaller the ratio, the higher the likelihood of moraine-dammed lake failure (Huggel and others, Reference Huggel, Haeberli, Kääb, Bieri and Richardson2004; Wang and others, Reference Wang2012; Rounce and others, Reference Rounce, McKinney, Lala, Byers and Watson2016). Fujita and others (Reference Fujita2013) developed a dam geometry parameter to indicate the potential danger of a moraine-dammed lake. The proposed parameter, the steep lakefront area, on which a depression angle is steeper than the threshold of 10°, can describe the stability of a dam and its capacity to resist hydrostatic pressure. Buried ice is one of the most important factors for assessing the stability and susceptibility of a moraine dam to failure. For example, accelerated melting of buried ice will damage the integrity of a dam and subsequently compromise its ability to resist the hydrostatic pressure, expand the piping/seepage flow and reduce the freeboard (Clague and Evans, Reference Clague and Evans2000; Emmer and Cochachin, Reference Emmer and Cochachin2013). Although geophysical soundings (seismic refraction, geoelectrical resistivity, gravimetry, radio-echo sounding) have been used to determine the inner structure of ice-cored moraine dams (Richardson and Reynolds, Reference Richardson and Reynolds2000a; Haeberli and others, Reference Haeberli, Kääb, Vonder Mühll and Teysseire2001; Janský and others, Reference Janský2009; Moore and others, Reference Moore, Boleve, Sanders and Glaser2011), most current work has focused on GLOFs hazard identification from remote sensing by defining the geometry and topographic/morphological environment of dams, the geometrical shape of the dam or changes in the permafrost of the dam. It was consistently reported that buried ice within a dam increased its susceptibility to failure (Huggel and others, Reference Huggel, Haeberli, Kääb, Bieri and Richardson2004; McKillop and Clague, Reference McKillop and Clague2007; Bolch and others, Reference Bolch2011; Wang and others, Reference Wang2012; Rounce and others, Reference Rounce, McKinney, Lala, Byers and Watson2016).
However, in a permafrost area, the ability of moraine dams with similar geometric shape and internal structure to resist hydrostatic pressure, seepage- or piping-induced failure may be different, due to changing hydrothermal status (Haeberli and others, Reference Haeberli, Kääb, Vonder Mühll and Teysseire2001; Wang and others, Reference Wang2012). Monitoring and simulating variations in hydrothermal regimes within a dam are foundational to a further assessment of dam stability. Because moraine dams are often found in remote alpine areas, field surveys of moraine dams are difficult and, to date, there are few studies focusing on their changing hydrothermal states. In this study, we present the hydrothermal states within the active layer of a perennially frozen moraine dam and analyze the aspects of the related dam stability at Longbasaba Lake on the north side of the Himalaya, based on in situ observation from 2012 to 2016.
2. STUDY AREA
The moraine-dammed Longbasaba Lake (27°57′17″N, 88°04′55″E, 5520 m a.s.l.) is located at the source of the Pumqu River watershed in the northern Himalaya (Fig. 1a). Annual average air temperature is −3.6°C and average humidity is 40%. The morphology of the dam exhibits the features of viscous flow in ice-rich sediments and thermokarst features (Fig. 1b). The lake is 2210 m long from south to north and 685 m wide from east to west with an average depth of 47.5 m and a total water volume of 6.4 × 10⁷ m3 (Yao and others, Reference Yao, Liu, Sun, Wei and Guo2012). On the east of the lake, two debris-covered glaciers with ice cracks and serac pillars extend into the lake. The lake area has expanded rapidly during the past decades from 0.33 km2 in 1977 to 1.43 km2 in 2015 surveyed by aerial photography map and Landsat image. The moraine dam, mainly composed of coarse-grained granite with ice cores, is 163 m wide and 388 m long on average on the top, and 100 m high from bottom to top (Wang and others, Reference Wang, Liu, Guo and Xu2008). There are many depressions in the moraine dam where several small ponds have developed (Fig. 1b). The outlet flow continues laterally eroding the moraine dams. Longbasaba Lake is reported to have a very high probability of dam failure (Wang and others, Reference Wang2012). If the dam fails under the ‘worst-case’ scenario, peak discharge will reach 1 × 10⁴ to 1 × 10⁵ m3 s−1 at the breach site (Wang and others, Reference Wang, Liu, Guo and Xu2008).
Map showing the location of Longbasaba Lake and Dingri Weather Station. (a) Observation site and Automatic Weather Station on the moraine dam at Longbasaba Lake, (b) landscape of the moraine dam (Google earth image, January, 2017), (c) overtopping flow and seepage flow of the Longbasaba Lake moraine dam (the outlet of seepage flow marked by yellow circle).

3. DATA AND METHODOLOGY
An automatic meteorological station was installed to record the air temperature, solar radiation, humidity and other variables on the moraine dam. Two ground heat flux probes (Campbell HFP01SC with an error of ±3%) at the depths of 5 and 20 cm; five soil temperature probes (Campbell 109-L with an error of ±0.2°C) at the depths of 5, 20, 50, 100 and 150 cm; and four soil moisture probes (Campbell CS616 with an error of ±2.5%) at the depths of 5, 20, 50 and 150 cm (Table 1) were installed in the moraine dam near the outlet of Longbasaba Lake to record thermal and hydrological transfer processes from 11 November 2012 to 23 September 2016 (Fig. 1a). All the sensors are connected to a data logger (Campbell CR3000-XT) for automatic recording every 10 min. Additionally, the daily average air temperature was collected from Dingri weather station (28°38′, 87°05′, 4300 m a.s.l., Fig. 1) in 1960–2016.
Descriptions of the soil hydrothermal state probes used at depths of the moraine dam

The Stefan equation has been widely implemented in engineering for calculating the freezing or thawing depth in permafrost regions (Jumikis, Reference Jumikis1977). This equation is useful for estimating the ground freezing and thawing depths from a small number of parameters (Nelson and others, Reference Nelson1997; Woo and others, Reference Woo, Arain, Mollinga and Yi2004; Xie and Gough, Reference Xie and Gough2013). The simplest form of the Stefan equation is:
 $$D = \sqrt {\displaystyle{{2{K} \cdot I{(}t)} \over {L \cdot \omega \cdot \rho}}}, $$
 $$I(t) = \int \limits_{t_1}^{t_2} T_{\rm s}{\rm d}t,$$
where D is the freezing or thawing depth, K is the thermal conductivity of the soil (W m−1°C−1), L is the mass-based latent heat of fusion for water (J kg−1), ω is the volumetric moisture content (%), ρ is the bulk density of the soil (kg m−3), t is the time, T s is the soil temperature at a depth of 5 cm (°C) and I(t) is the surface freeze/thaw index. Li and Koike (Reference Li and Koike2003) proposed and evaluated a modified approximation solution for the Stefan equation in a framework of a multilayer system and properly dealt with the influences of soil freezing and thawing on the ground thermal conductivity and capacity. In this study, we use the modified approximation Stefan solution to calculate the freezing and thawing processes based on the temperature and water content data observed from different depths in the Longbasaba Lake moraine dam.
To reconstruct the surface temperature of the moraine dam during the period 1960–2012, a linear regression model (soil temperature = 0.72 × air temperature − 1.86, R 2 = 0.88, α < 0.001) is established based on daily mean air temperature data from Dingri station and daily mean soil temperatures at the depth of 5 cm in the moraine dam from 2012 to 2016 (Fig. 2). According to this equation, the daily mean soil temperature at the depth of 5 cm for the moraine dam was extended backwards by daily mean air temperature data from Dingri station for the period 1960–2012 (Fig. 3). Then we simulate the ground freezing and thawing processes over the past 55 years based on the modified Stefan model and the reconstructed data.
Relationship between daily mean air temperature from Dingri Weather Station and daily mean soil temperature at the depth of 5 cm in the Longbasaba Lake moraine dam during the period of 2012–2016.

Variations of air temperature from Dingri Weather Station and the reconstructed soil temperature at the depth of 5 cm in the Longbasaba Lake moraine dam shown by monthly mean temperature in 1960–2016 (the dashed line is the directly measured soil temperatures).

4. RESULTS
4.1. Surface heat flux
The diurnal variation curves for the ground heat flux at the depths of 5 and 20 cm peaked once each year during the study period (Fig. 4a). The minimum monthly mean values at the depths of 5 and 20 cm occurred in January and are −8.5 and −3.9 W m−2, respectively, whereas the maximum monthly mean values occurred in June and are 14.6 and 7.9 W m−2. The ground heat flux was positive during April–September, indicating that heat was transferred from the atmosphere to the soil. From October to the following March it was negative, suggesting that the moraine dam released heat to the atmosphere (Fig. 4b). During the entire observation period, the mean yearly ground heat flux at the depth of 5 cm varied from 0.4 to 1.7 W m−2, with an average value of 1.1 W m−2 (Table 2), indicating a yearly surplus of heat transported from the surface into the dam.
(a) Diurnal and (b) monthly variations of soil heat flux in the Longbasaba Lake moraine dam from 2012 to 2016.

Mean soil temperature, heat flux and moisture of moraine dam at all depths in the time of summer (May to October), winter (November to next April) and annual from 2012 to 2016

* Soil humidity data outside the range 0 to +70°C were considered invalid according to the manual provided by Campbell Scientific, Inc.
4.2. Soil temperature
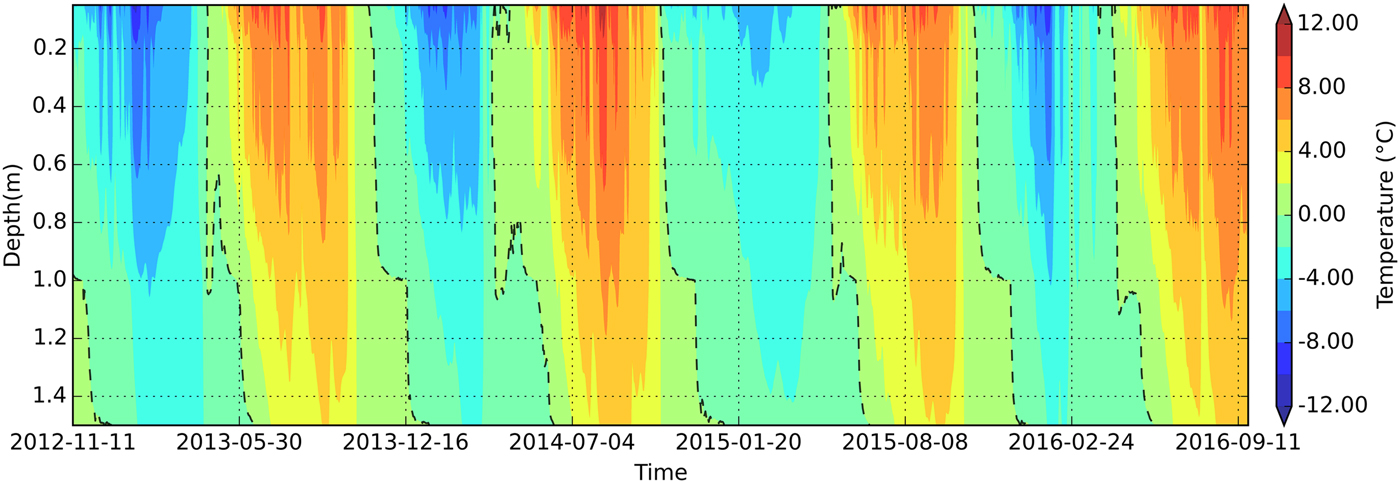
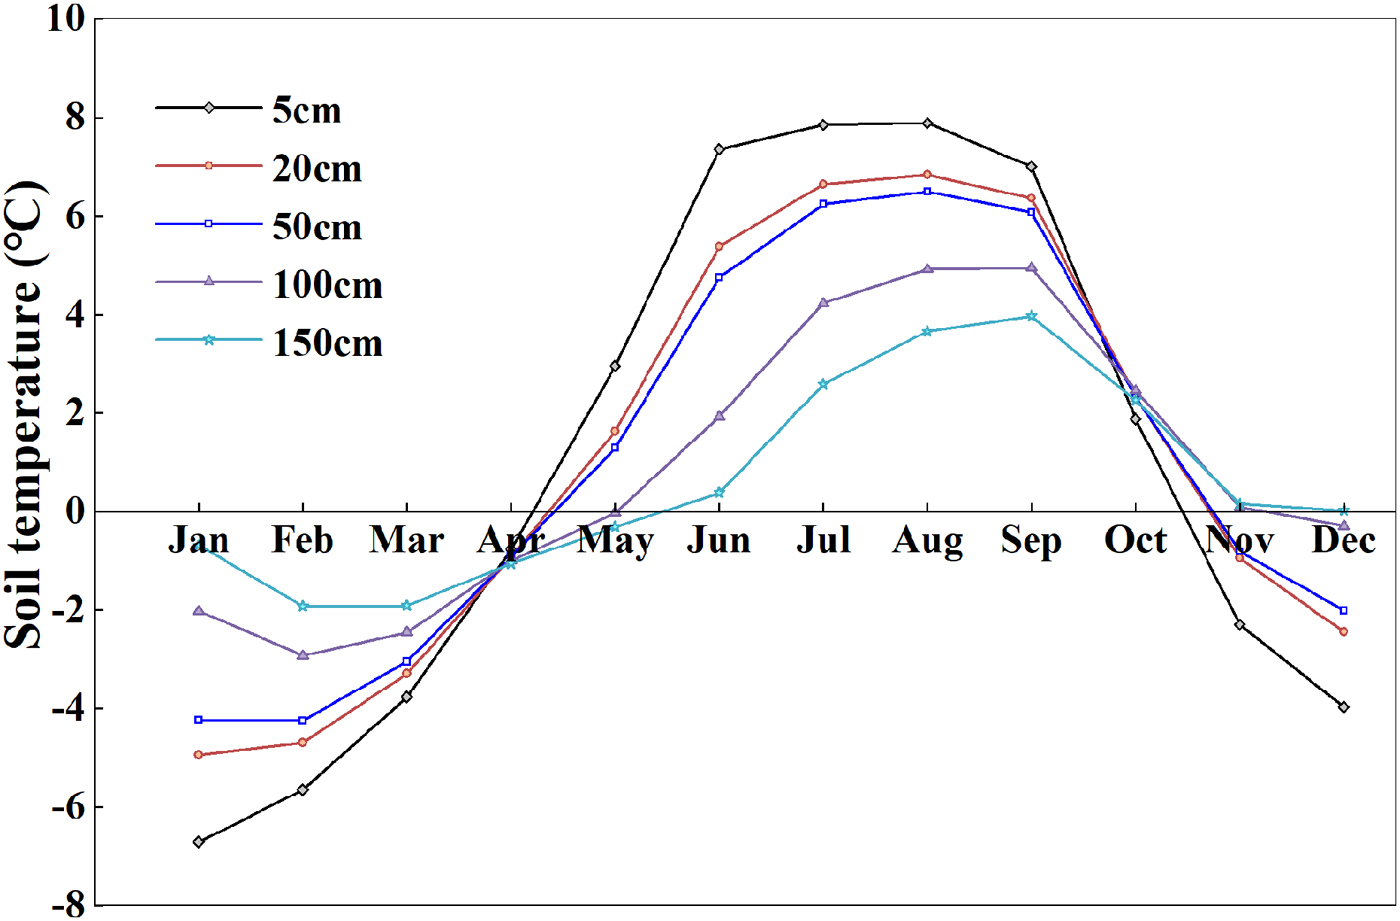
During the observation period, the mean annual ground temperature of the moraine dam at the depths varied from 0.9°C at 5 cm to 0.5°C at 150 cm, which was higher than the mean annual air temperature over the dam surface (−3.6°C) (Table 2). At the depths of 0–50 cm, the ground temperature was positive during the period May–October and negative from November to the following April. The emergence of positive temperature and the highest soil temperature were gradually retarded with depth. At the depth of 150 cm, the time interval with positive temperatures shifted to June–December. The 0°C isotherm of ground temperature appeared from the last 10 d of April to the middle of June. The highest ground temperature occurred in July at the dam surface and in September at the depth of 150 cm (Fig. 5). In summer months, the average ground temperature decreased from 5.8°C at 5 cm to 1.9°C at 150 cm, whereas in winter months, the average ground temperature rose from −3.9°C at 5 cm to −1.0°C at 150 cm (Fig. 6).
Diurnal variations of soil temperature in the Longbasaba Lake moraine dam from 2012 to 2016 (the dashed line is 0°C isotherm of soil temperature).
Monthly mean soil temperature at different depths in the moraine dam of Longbasaba Lake from 2012 to 2016.
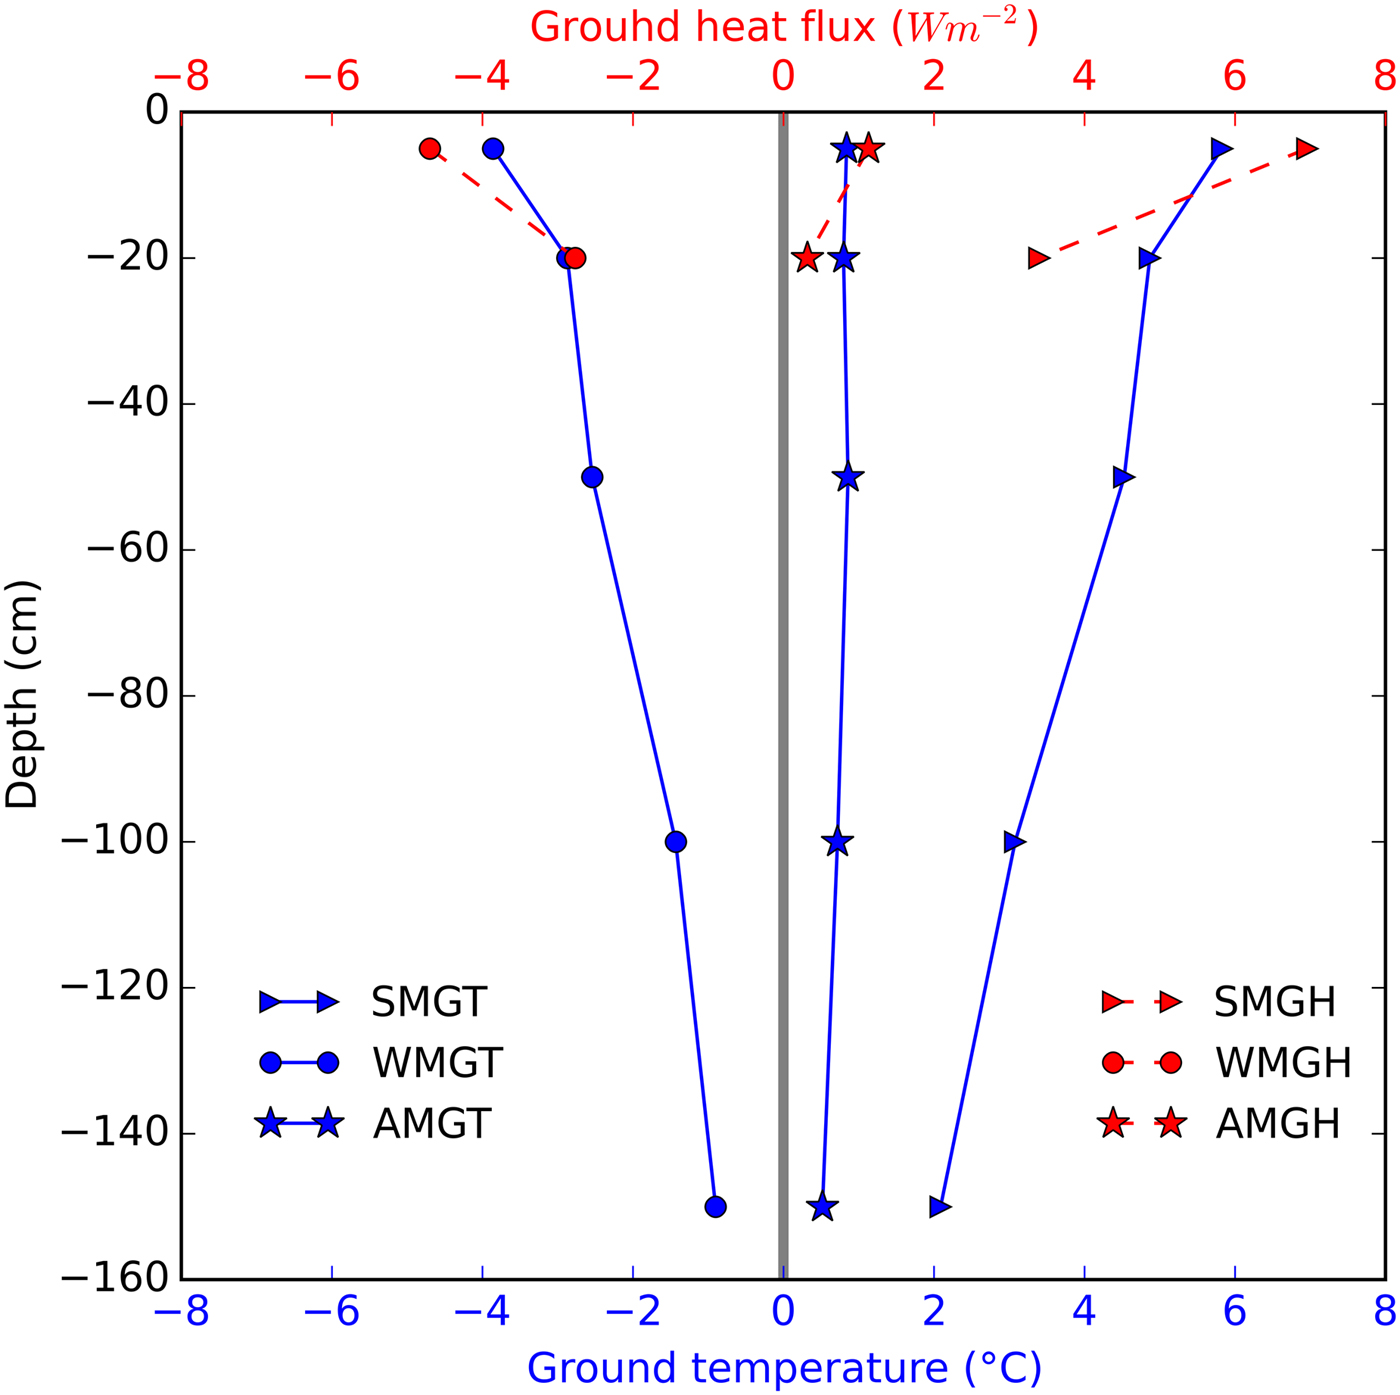
The vertical ground temperature gradients varied dramatically within the depths from 0 to 20 cm (Fig. 5), with the largest amplitude of variation at the shallowest depth (varied between −0.12 and +0.13°C cm−1). The variation gradually decreased with depth (fluctuating between −0.04 and +0.06°C cm−1 from 20 to 150 cm). The vertical ground temperature gradients were positive in summer (i.e. soil temperature at lower depths was lower than that at upper depths), with the maximum value (+0.13°C cm−1) appearing in June at the depths from 5 to 20 cm. In winter, the gradients were negative (i.e. soil temperature at lower depths was higher than that at upper depths), with the maximum negative value (−0.12°C cm−1) appearing in January at the depths from 5 to 20 cm. On average, the summer, winter and annual mean variation trends of temperature and ground heat flux against depths were largely consistent with each other (Fig. 7).
Profiles of measured mean ground temperature and ground heat flux against different depths in the moraine dam of Longbasaba Lake from 2012 to 2016 (SMGT, summer (May to October) mean ground temperature; WMGT, winter (November to next April) mean ground temperature; AMGT, annual mean ground temperature; SMGH, summer mean ground heat flux; WMGH, winter mean ground heat flux; AMGH, annual mean ground heat flux).
4.3. Soil moisture
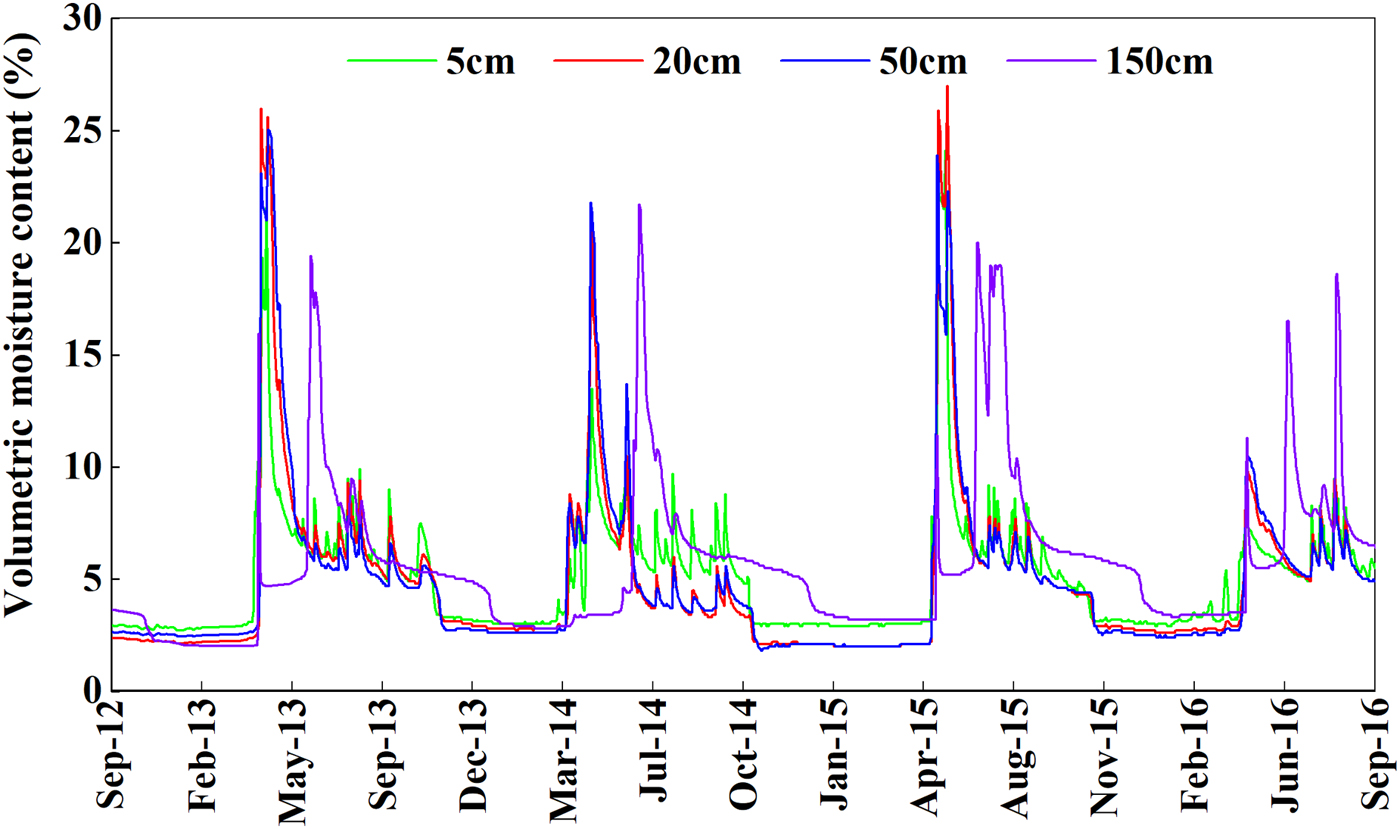
During the observation period, the volumetric soil water content of the moraine dam was relatively low, varying from −2 to 27% (soil humidity data outside the range 0 to +70°C were considered invalid according to the manual provided by Campbell Scientific, Inc), with an annual average of 5% (Fig. 8). The variations in water content at different depths were largely consistent, as the dam was mainly composed of mixed sand and gravel. The average annual value at the depth of 150 cm (6%) was slightly higher than that at the depths from 5 to 50 cm (5%). The water content at the depths from 5 to 50 cm peaked sharply from the end of April to late May. With the depth increasing, the peak values of water content were delayed and corresponded with the progress of the active thawing front further inside the dam. At the depth of 150 cm, peak water content generally occurred from mid-June to mid-July.
Daily mean soil moisture variations at different depths in the moraine dam from 2012 to 2016 (soil humidity data outside the range 0 to +70°C were considered invalid according to the manual provided by Campbell Scientific, Inc).
4.4. Freezing and thawing
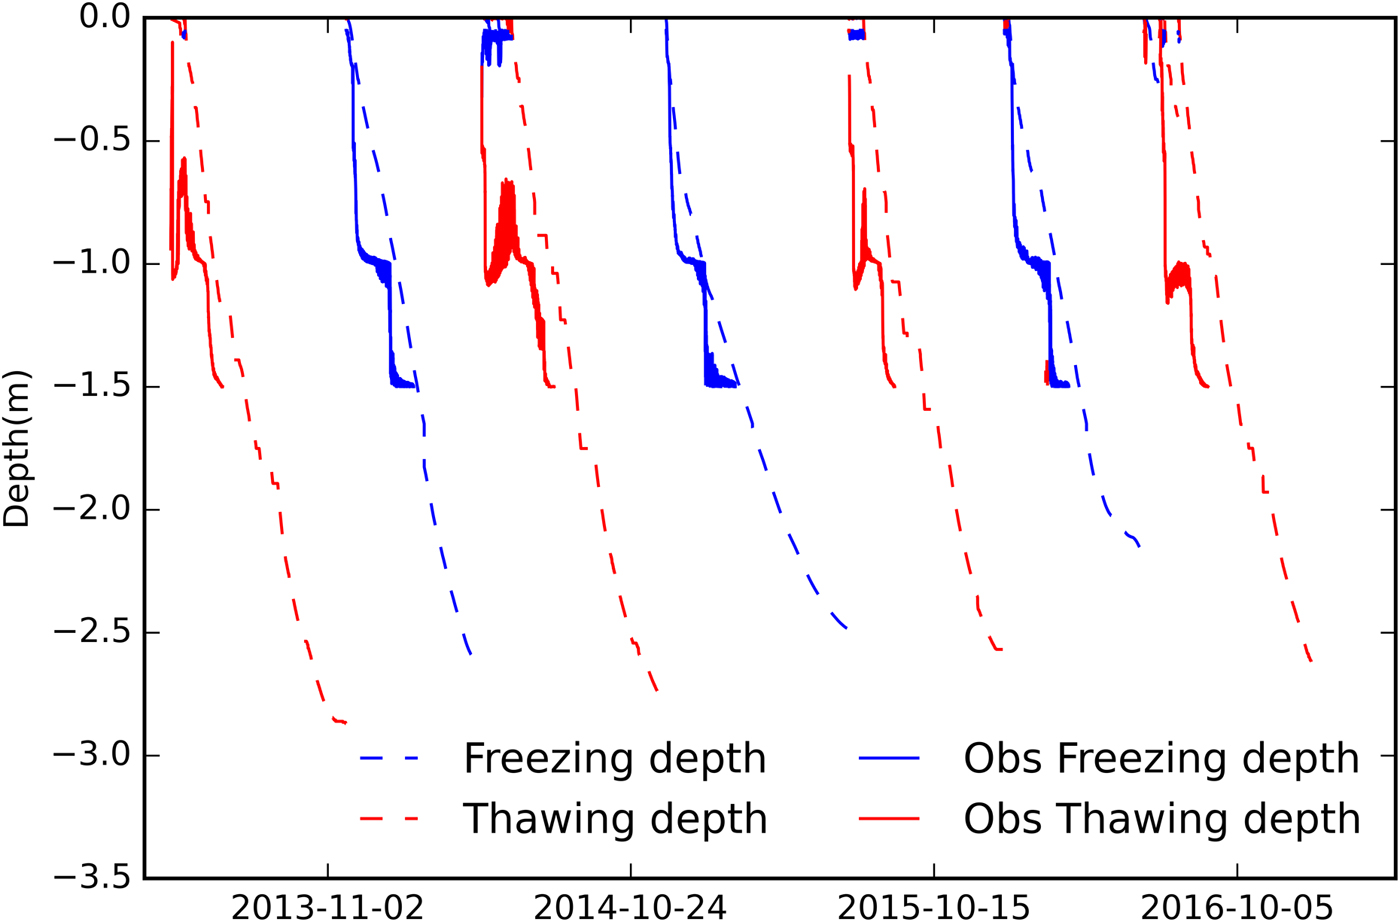
According to the depth variations of the 0°C isotherm based on observed soil temperatures, the active layer of the moraine dam generally began to thaw in April and the thawing front reached the depth of 150 cm in mid-to-late June. The surface started to freeze in mid-to-late October and froze to the depth of 150 cm in mid-to-late January. The freezing and thawing cycle curves simulated by the modified Stefan model based on the hourly ground temperature and water content at the depth of 5 cm from 2012 to 2016 were similar to the observed ones at the depths of 0–150 cm (Fig. 9). The thawing front reached its maximum depth between 280 and 290 cm in mid-to-late October, and the freezing front reached its maximum depth between 250 and 260 cm in early April to early May (Fig. 9), i.e. the moraine dam reached its yearly maximum freezing depth at the time when frozen soil at the surface began to thaw. The calculated annual maximum thawing depth was 30 cm deeper than the maximum freezing depth on average, which verified that there was an overall surplus of the heat transferred from the surface into the lower dam. The change from freezing to thawing every year occurred in April. Yet, freezing and thawing alternated often in the surface layer of the moraine dam in April due to extreme fluctuations of air temperature and/or the absence of an insulating snow cover.
Comparison of observed (interpolated from soil temperature profiles) and simulated freeze and thaw depths for the Longbasaba Lake moraine dam, from 2012 to 2016.
5 DISCUSSION
5.1. Stratification in the top layer of the moraine dam
Given the continued atmospheric temperature rise, it is to be expected that the diversity of conditions and phenomena encountered in the mountain permafrost exceed what has previously been described and investigated (Noetzli and Gruber, Reference Noetzli and Gruber2009; Gruber and others, Reference Gruber2016). The hydrothermal state of the moraine dam presented evident heterogeneity indicated by the ground heat flux, temperature and moisture content observed at different depths in the dam. In general, the signal of diurnal soil temperature variations can only reach a depth of about 30–50 cm (Hirota and others, Reference Hirota, Pomeroy, Granger and Maule2002). At the depths from 0 to 20 cm, soil temperature fluctuations coincided well with the variations of air temperature. In summer, a diurnal temperature cycle is evident in the depths, characterized by a positive soil temperature gradient (relatively higher temperature at the top than at the bottom) during the day and a negative gradient (relatively lower temperature at the top than at the bottom) at night. The average thawing rate exceeds 3 cm d−1 during the thawing period. The amplitude of diurnal ground temperature variation was less than that of the air temperature in winter, and vice versa in summer. The energy entering the dam is larger than the amount of energy escaping inferred from an annual average surplus of 1.1 W m−2 in the ground heat flux. At the depths from 20 to 100 cm, the diurnal ground temperature cycle gradually disappeared. The amplitude of ground temperature diurnal fluctuations is <1/5 to 1/10 that of air temperature. The thawing rate was about 2–3 cm d−1 between these depths. At the depths from 100 to 150 cm, the ground temperature was higher than the air temperature and that at other depths in winter, and diurnal variations of ground temperature were almost unobservable. The thawing rate was the smallest (1–2 cm d−1) because the ground heat flux attenuated with increasing depth. Peak moisture content occurs 1–2 months later than at other observed depths as the thawing front moves down over time. Thus, the observed depths of the moraine dam from 0 to 150 cm can be roughly divided into three layers according to the changes in hydrothermal indicators: a surface layer (0–20 cm), a middle layer (20–100 cm) and a deep layer (>100 cm). Relatively small differences were observed in both moisture content and soil temperature within the middle layer, and this could be regarded as a transitional layer between the surface layer and the deep layer of the moraine dam.
The Longbasaba Lake moraine dam is mainly composed of sandy soils and gravels with little difference in terms of material composition at the depths from 0 to 150 cm, indicated by a manually excavated profile. The freezing or thawing, changes of moisture content and layered phenomena of the observed depth in the moraine dam result from differences in hydrothermal exchanges in the processes of water and heat transfer from the dam surface to the interior. The external energy input is a key factor in determining the thermal and hydrological dynamics in the active layer of the dam. Furthermore, the observed stratification is generally dynamic and the depths of surface, middle and deep layers would vary with the changes of water and heat transfer from the dam surface. Additionally, the insulating effect of snow cover reaching to a certain thickness in winter would dampen the ground temperature variations in permafrost (Zhang, Reference Zhang2005; Zhang and others, Reference Zhang2013; Magnin and others, Reference Magnin2017). Similarly, the thick snow cover on the moraine dam would result in a decrease or even disappearance of diurnal soil temperature variations and in the stratification of the moraine dam in winter. For example, an obviously less drastic variation of temperature was recorded in the winter of 2014–2015 possibly indicating a more significant snow cover insulating effect than the other year during 2012–2016 (Fig. 5); the depth of the freezing isotherm remained nearly horizontal but increased gradually from the top to the bottom, suggesting that the stratification of the moraine dam from 0 to 150 cm depth disappeared during this period.
The observed stratification in the Longbasaba Lake moraine dam may affect hydrological processes of the dam. Field investigations showed that overtopping flow occurred in the Longbasaba Lake, which was continually eroding the surface of the moraine dam, and that there was an obvious seepage flow near the outlet (Wang and others, Reference Wang, Liu, Guo and Xu2008) (Fig. 1c). In the moraine dam, the surface and middle layers (from 0 to 100 cm) are greatly affected by daily air temperature variation and are characterized by a higher thawing rate (>2 cm d−1) in summer. The loose sandy soil and gravels of these two layers are easily eroded by overtopping waves, which will lower or partly lower the freeboard of the lake in summer. For example, an overtopping flood lowered the middle part of the dam near the outlet by 20–30 cm in June and July 2011. From 100 cm to the yearly maximum thawing depth (~290 cm), the dam is in a thawing state from the end of summer to autumn. Piping or seepage flow will likely occur in the deep layer due to the thawed loose sandy soil and gravels overlain by a relatively greater hydrostatic pressure from the lake water at this time (seepages were often found below ~1 m from the dam surface from August to October in the investigation period of 2011–2015).
5.2. Changes and implications of freezing/thawing depths
In the coming decades, the main forms of permafrost degradation will be underground ice melting and conversion of low temperature, stable permafrost to warmer permafrost. This process will lead to freezing–thawing disasters related to permafrost changes, such as thaw slumping, frost heaving, thaw subsidence, landslides, destabilization of rock glaciers and frost boils (Lin and others, Reference Lin, Niu, Ge, Wang and Dong2010; Yao and others, Reference Yao2013; Haeberli and others, Reference Haeberli, Schaub and Huggel2016; Scotti and others, Reference Scotti, Crosta and Villa2017). Changes in shallow soil temperatures can reflect variations in the thickness of the active layer. It was reported that the annual cumulative temperature at the depth of 50 cm has been rising and the permafrost table has been lowering in the TP over the last decades, leading to more unstable permafrost (Zhao and others, Reference Zhao2011; Li and others, Reference Li2012; Wu and others, Reference Wu and Niu2013). Our study site is located in a permafrost area (Cheng and Wang, Reference Cheng and Wang1982; Zou and others, Reference Zou2017) with an elevation of 5520 m a.s.l. The mean annual air temperature increased at a rate of more than 0.03°C a−1 over the period from 1970 to 2010 in this region (Zhang and others, Reference Zhang, Xiao and Liu2012), whereas the nearest meteorological station to the Longbasaba Lake, Dingri station, has recorded a mean annual air temperature increase of 0.062°C a−1 (α < 0.001) in the past decades. Under the evidently warming climatic scenario, the Longbasaba Lake area was continuously expanding with an average rate of 0.028 km2 a−1 since the 1970s (Yao and others, Reference Yao, Liu, Sun, Wei and Guo2012). Furthermore, air temperature rising in the coming decades will be likely to accelerate the degradation of permafrost (Noetzli and Gruber, Reference Noetzli and Gruber2009) in the dam, which in turn will increase the instability of the dam slope and the possibility of a GLOF (Haeberli and others, Reference Haeberli, Schaub and Huggel2016).
The ground freezing and thawing processes simulated by the modified Stefan model at the Longbasaba Lake moraine dam indicate that the yearly maximum freezing depth decreased, while the yearly maximum thawing depth increased during 1960–2016 (Fig. 10). Three stages can be identified. (1) From 1960 to 1970, the yearly maximum freezing depth is 0.5 m greater than the yearly maximum thawing depth on average. (2) From 1971 to 1997, there is little difference between the yearly maximum freezing and thawing depths. (3) From 1998 to 2016, the yearly maximum freezing depth is 0.4 m less than the yearly maximum thawing depth on average. Thus, it can be seen clearly that the permafrost in the Longbasaba Lake moraine dam has degenerated over the past 55 years. A layer that is thawing might have developed since the late 1990s in winter, at the depths of about 2.5–2.9 m between the frozen surface and the permafrost, indicating that the permafrost at the dam site is becoming inactive. The corresponding permafrost degradation is likely to affect the internal structure and stability of the dam.
Freezing and thawing processes of the Longbasaba Lake moraine dam from 1960 to 2016 (FD, freezing depth; TD, thawing depth; YMFD, yearly maximum freezing depth; YMTD, yearly maximum thawing depth; TYMFD, trend of yearly maximum freezing depth; TYMTD, trend of yearly maximum thawing depth).

A significant snow cover exists on the dam in winter, reducing the correlation between the ground and air temperatures due to its insulating effects (Haeberli and others, Reference Haeberli2010; Staub and Delaloye, Reference Staub and Delaloye2017). Therefore, the evolution of snow cover would invalidate the linear regression model for reconstructing the surface temperature on the dam and bring errors in the simulation of ground thawing and freezing depths. To delineate the snow insulating effects, a physical-based frozen soil model incorporating a snow cover is necessary. In this study, due to the lack of sufficient data such as precipitation and snow depth on the dam, the relative simple Stefan model was adopted. In addition, the dam site and Dingri station are located in the rain shadow of Mount Everest with low annual and winter precipitation, e.g. about 280 and 5 mm, respectively, at Dingri station. Observations from 1959 to 2016 indicate that there is no significant trend in annual precipitation and winter snow at Dingri. That is, although the snow cover has implications for the ground freezing and thawing depths, it would not significantly change their simulated trends. However, more data will be collected and a physically based model will be used to assess the permafrost evolution of the moraine dam with consideration for factors including snow cover and solar radiation.
The moraine dam failure usually involves the aspects of material strength and permeability, slope stability, piping and/or retrogressive erosion, morphological features and geometric parameters of the dam. The degradation of frozen soil and increased thawing depth are important factors related to decreased moraine dam stability (McKillop and Clague, Reference McKillop and Clague2007; Wang and others, Reference Wang2012), and to slope or dam failure during earthquakes (Kargel and others, Reference Kargel2015). An in situ survey indicated that the dam is composed of unconsolidated and mixed grain-size moraine with high permeability and low shearing resistance. On average, the distal dam flank is steeper than 20°and there is no freeboard (Wang and others, Reference Wang, Liu, Guo and Xu2008). The outside flank of the moraine dams is being eroded due to more frequent overtopping events (Fig. 1c). The ratio of dam width to height is about 1.6. The dam crest was characterized by striking structures indicating cohesive deformation of ice-rich subsurface material with small lakes indicating thermokarst well developed inside the dam (Fig. 1b). Buried ice covered by debris about 1–3 m thick is exposed in the central part of the inside flank of the moraine. The visible seepages and viscous flow in ice-rich sediments likely enhance the probability of the dam's failure. In conclusion, with the increase of maximum thawing depth in summer and the emergence of a thawed layer in winter in the interior of the Longbasaba Lake moraine dam, the capacity for water blocking, anti-piping and erosion prevention of the moraine dam would decrease. Meanwhile, melting of buried ice in the dam would be accelerated, which is caused by the annual surplus of heat reaching the inner layers. Such ice melting and thawing of permafrost is likely to produce considerable thaw settlement and surface subsidence at sites with ice-supersaturated materials (excess ice) at depth. Such surface subsidence in the perennially frozen lake dam may affect lake levels, consequently resulting in a further decrease in the stability of the dam body. So far, the hydrothermal state of the frozen moraine dam could only be documented within a shallow surface layer. Important parameters such as the depth of the active layer or the amount and location of buried ice, etc., remain to be investigated and further continuous precision surveying (for instance by drones) would be an important option for continued monitoring at the site.
6 CONCLUSIONS
The annual mean soil temperature was above 0°C at different depths from 0 to 150 cm, although the annual mean air temperature was as low as −3.6°C over the Longbasaba Lake moraine dam from 2012 to 2016. Observed soil moisture content at the dam is relatively lower than that of other investigated sites in TP (Yang and others, Reference Yang2013) and usually peaked during snowmelt from the end of April to late May. At the depth of 5 cm in the moraine dam, there is an annual surplus of heat transported from the surface to the depths, which may result in permafrost degradation. The seasonal snow cover at the dam surface affects the ground heat flux in winter to some degree due to its insulating effects and further investigations of snow depth and its implication on the dam are needed in future work.
As a result of attenuation of water and heat transfer from the dam surface to the interior, the hydrothermal conditions appear layered at observed depth in the moraine dam. Erosion frequently occurs in the surface and middle layers because they thaw rapidly and suffer from overtopping flow during the entire summer season. Seepage flows most likely occur in the deep layer to the maximum thawing depth (100–290 cm) as the structure is that of a loose, thawing moraine integrated by a relatively large hydrostatic pressure from lake water at these depths.
The yearly maximum thawing depth (280–290 cm) of the dam occurs from mid-to-late October. The yearly maximum freezing depth (250–260 cm) occurs from the beginning of April to the beginning of May. Over the past 55 years, the yearly maximum thawing depth has been increasing, while the yearly maximum freezing depth has been decreasing, indicating a permafrost degradation in the Longbasaba Lake moraine dam. However, the moraine dam failure usually involves the aspects of material strength and permeability, morphological features and geometric parameters of the dam, and further investigation and more comprehensive analysis are strongly proposed to investigate the deteriorating stability of the moraine dam.
ACKNOWLEDGEMENTS
The authors would like to thank Kunpeng Wu (Northwest Institute of Eco-Environment and Resources, Chinese Academy of Sciences), MSc students Meihai Shu (Hunan University of Science and Technology) and Xiaofeng Li (Northwest Normal University, Lanzhou, China) for their support in fieldwork, and the daily air temperature data (Dingri meteorological station) were obtained freely from the China Meteorological Administration (http://data.cma.cn/site/index.html). We thank W. Haeberli and two other anonymous reviewers for insightful comments that improved the manuscript greatly. This study was supported financially by the National Natural Science Foundation of China (grant Nos. 41771075, 41271091 and 41261016) and Fund of Sate Key Laboratory of Cryosphere Science (SKLCS-OP-2017-05).


 Open access