


Introduction
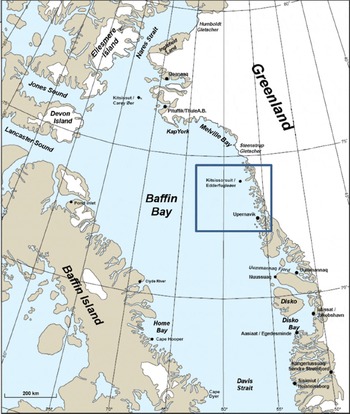
Prior to the acquisition of a three-dimensional (3-D) seismic survey in the ∼12000 km2 offshore hydrocarbon exploration license ‘Block 9 (Tooq)’ northwest of Upernavik, North Greenland, the operator Maersk Oil Kalaallit Nunaat A/S, together with its joint venture partners Tullow Oil Ltd and Nunaoil A/S, initiated in September 2011 a field investigation of iceberg drift pattern and drift speed in Baffin Bay, North Greenland. The reason for the study was to mitigate the risk hazards for operations in ice-infested waters, with the aim of incident-free future operations, and to enhance the limited database of knowledge of the ‘iceberg habitat’ in the area (Reference Robe and ColbeckRobe, 1982a; Reference Valeur, Hansen, Hansen, Rasmussen and ThingvadValeur and others, 1996; Reference Hansen and HartmannHansen and Hartmann, 1998). The fieldwork was performed by the Danish Meteorological Institute (DMI) and formed part of a larger study that, among several glaciological and meteorological aspects, also involved satellite-based iceberg analysis utilizing high-resolution synthetic aperture radar (SAR) satellite data. These studies will be published elsewhere. In this paper the focus is on the description, tracking and monitoring of ten large icebergs equipped with GPS transponders during the field campaign in September 2011 (Fig. 1).
Baffin Bay, Davis Strait and Nares Strait. Greenland town names are followed by the former Danish names. The box indicates the study area.
General Iceberg Drift Patterns and Sources in Baffin Bay
The general iceberg drift patterns and sources in eastern Baffin Bay have been summarized by Reference Valeur, Hansen, Hansen, Rasmussen and ThingvadValeur and others (1996). Most icebergs observed in Baffin Bay originate from glaciers located between Disko Bay and Kap York in the northern part of Melville Bay (Figs 1 and 2). Between 69° N and 73° N from Disko Bay to Upernavik, large fast-moving glaciers calve about 10 000–15 000 icebergs a−1, or a total of about 95 km3, many of which drift into Baffin Bay. These glacial outlets are very important for the iceberg input to the northern Davis Strait and Baffin Bay. Further north, the 19 major glaciers between Upernavik and Kap York are also very productive, shedding >10 000 icebergs or about 60 km3 of ice into Baffin Bay each year. Nine of these glaciers are >8 km wide across their front (Steenstrup Gletscher is 26 km wide) and produce icebergs up to ∼1 km in length. Total annual production of icebergs calved in Baffin Bay and northern Davis Strait is therefore about 25 000–30 000, but estimates vary as high as 40 000. Almost no icebergs are produced south of Disko Bay. The fjords are longer, narrower and shallower than in Baffin Bay and the calving is in the form of growlers and bergy bits, which often melt before reaching the open sea.
Iceberg sources and drift patterns (from Reference Valeur, Hansen, Hansen, Rasmussen and ThingvadValeur and others, 1996). The box indicates the study area.

Reference Valeur, Hansen, Hansen, Rasmussen and ThingvadValeur and others (1996) state that iceberg production on a volume basis varies little from year to year. However, recent studies suggest that some variability exists both seasonally and decadally (Reference Rignot, Velicogna, Van den Broecke, Monagham and LenaertsRignot and others, 2011; Reference SoleSole and others, 2011; Reference Box and ColganBox and Colgan, 2013; Reference BiggBigg and others, 2014). The ‘normal’ life cycle of icebergs is as follows. During the summer and autumn, after calving, the icebergs are carried seawards from the fjord and begin anticlockwise drift around Baffin Bay (Fig. 2). Rates of motion along the Greenland coast are 3–5 nmi (nautical miles) d−1 (5.6–9.3 km d−1) so that a total drift before freeze-up will vary from about 200 to 600 nmi. Survival rates during the open-water season are low: only about one in five icebergs survive long enough to pass Kap York. Naturally, the large icebergs are the survivors.
The basic sea currents of Baffin Bay are not complicated. There is a warm north-moving current along the Greenland coast (the West Greenland Current) and a cold south-moving current along Baffin Island shore, giving an anti-clockwise drift pattern (Fig. 2). However, in Davis Strait and near 70° N, major westwards branches are found, and these may have a significant impact on the iceberg population and residence time in Baffin Bay (Reference Hansen and BuchHansen and Buch, 1996a,Reference Hansen and Hartmannb; Reference Valeur, Hansen, Hansen, Rasmussen and ThingvadValeur and others, 1996; Reference BuchBuch, 2002). During winter and spring, ocean currents (at all depths) in Baffin Bay are generally weaker than during summer and fall (e.g. Reference Tang, Ross, Yao, Petrie, DeTracey and DunlapTang and others, 2004). During this period the drift of sea ice and encapsulated icebergs thus tends to be more wind-driven. The resulting drift is therefore mainly southwards due to the northerly winds predominating offshore in the region (Reference Valeur, Hansen, Hansen, Rasmussen and ThingvadValeur and others, 1996; Reference Kimura and WakatsuchiKimura and Wakatsuchi, 2000). The relations are documented further in animations of daily sea-ice drift in the region at: http://ocean.dmi.dk/arctic/icedrift_anim/index.uk.php.
This paper describes the 2011 tracking project of ten icebergs in Baffin Bay. The results will be discussed and compared with past studies from the 1980s and 1990s. Several studies of ocean circulation models have been made in recent years for the northernmost parts of Baffin Bay and the Canadian Archipelago and Nares Strait (Reference Van Scheltinga, Meyers and PietrzakVan Scheltinga and others, 2010; Reference McGeehan and MaslowskiMcGeehan and Maslowski, 2012; Reference Wekerle, Wang, Danilov, Jung and SchröterWekerle and others, 2013; Reference Lu, Higginson, Nudds, Prinsenberg and GarricLu and others, 2014). Unfortunately, no measurements of the local sea currents have been undertaken in association with the present study and therefore no attempt has been made to conduct any ocean circulation modelling. Instead, however, a comparison of iceberg drift with wind speed and direction has been performed for four of the icebergs. All wind data are taken from DMI-HIRLAM G05, which is a 5 km regional numerical weather prediction model covering Greenland, including Baffin Bay (http://hirlam.org/index.php/hirlam-programme-53/general-model-description/synoptic-scale-hirlam).
Iceberg Drift Patterns and Speed Study 2011
The fieldwork for the present iceberg-tracking study was conducted from a base in Upernavik during 21–29 September 2011. The overall goal of the fieldwork was to physically place GPS transponders on ten icebergs in order to achieve in situ knowledge of iceberg drift patterns and speed in relation to their size and shape.
Planning and preparation
In the specific area of interest for the study, satellite images were used for pre-planning helicopter flight routes for mounting the tracking GPS transponders. Two types of equipment were used for the tracking of the icebergs. Eight Geoforce XS-TA GPS transponders were mounted with construction foam in a plastic tube equipped with steel legs to prevent sliding off the iceberg and to ensure that the GPS transponder always pointed skywards. The low end of the plastic tube was filled with stones (Fig. 3a–d). The construction was very stable; it was possible to drop it from several metres above the iceberg and still be sure that it landed at the right angle (Fig. 3g). The second type used was the Canatec GPS beacon specially designed for measuring drift of sea ice and icebergs in polar regions. The two Canatec GPS beacons were deployed vertically in holes drilled manually in the iceberg (Fig. 3e and f).
Preparation and installation of equipment for the field expedition conducted 21–29 September 2011: (a) the Geoforce XS-TA GPS; (b–d) construction of case for GPS transponder; (e) drilling hole in the iceberg for deployment of Canatec GPS beacons; (f) deploying Canatec GPS beacons; (g) dropping off a small GPS transponder from a height of ∼1 m.

Flight tracks and deployment of gps transponders
A floating iceberg rarely melts uniformly because icebergs are not uniform in shape. Furthermore, there are differences in the temperature above and below the waterline, exposure of one side of the iceberg toward the sun, strains, cracks, mechanical erosion, etc. The inclusion of rocks, silt and other foreign material further accentuates the differences. As a result, changes in equilibrium take place that may cause the iceberg to tilt or capsize at irregular intervals. Parts may break off or calve, forming separate smaller icebergs. Owing to the very dynamic nature of icebergs, GPS tagging is not a routine operation, and represents a challenge to any helicopter pilot who is able and willing to land on an iceberg.
The flight routes were planned together with the helicopter pilot. Based on the pre-planned flight routes and the newest satellite images over the area, a reconnaissance flight was conducted on 23 September 2011 in order to locate suitable icebergs for deployment of tracking devices. However, most icebergs had steep slopes and irregular shapes and were thus impossible to land on. The icebergs selected for deployment of GPS transponders were therefore more or less tabular, without visible cracks, and had an adequate horizontal surface to allow a helicopter to land. Finally they were large enough to give the impression of stability. Despite various challenges such as time pressure, two Canatec GPS beacons and eight Geoforce XS-TA GPS transponders were deployed successfully during 26–27 September 2011 (Fig. 4).
Flight tracks and positions of icebergs on which GPS transponders were installed. The flights were performed on 23, 26 and 27 September 2011 in and around exploration license Block 9 (Tooq) (red polygon).

The accuracy of the logged iceberg positions is partly related to the placement of the GPS transponder on the iceberg (due to iceberg rotation) and partly to the accuracy of the transponder. Position accuracies guaranteed by manufacturers are 100 and 2.5 m for the Geoforce XS-TA GPS transponders and Canatec GPS beacons, respectively. In order to reduce position uncertainties as much as possible the GPS transponders were generally placed as close as possible to the center positions of the icebergs. The length of the ten tracked icebergs ranged between 95 and 450 m. Thus, we assess that the maximum position uncertainty (for the largest iceberg) is ∼200 m and in most (other) cases of the order of 100 m or less. Note that for the calculation of iceberg velocities, the impact of inaccuracy in position determination will be more significant at low than at high drift speeds.
Procedure for measurement of iceberg dimensions and mass
During the helicopter flights a series of photographs and videos was recorded. The photographs were taken with a digital GPS camera combined with a pressure altimeter. This made it possible to georeference and estimate the size of the photograph targets.
Owing to density differences between ice and water, ∼10% of an iceberg is above the sea surface. Thus, by knowing the surface area, height, approximate density of the iceberg and density of sea water, it is possible to calculate the underwater mass. Ice has a density of ∼916.7 kg m−3, and sea water typically has a density of ∼1027 kg m−3. The volume of sea water needed to displace this amount of ice is 916.7/1027 = 0.892 m3. Thus, 1m3 of ice will have 0.892 m3 of ice under the sea surface and 0.108 m3 of ice above the sea surface, i.e. ∼89.2% of the ice will be submerged and 10.8% will be above the sea surface.
Measurements and estimates of iceberg length and width were scaled using geometrical rectification of the digital photographs taken during the field campaign. Iceberg height above water level was measured using a GPS/pressure altimeter when the helicopter had landed on the iceberg surface or was hovering a few metres above it. The measurements of iceberg height in some cases might have been influenced by wind pressure from the helicopter rotors and had to be corrected. The approximate masses of the ten icebergs with GPS transponders were estimated using

where M is mass (t), 7.12 is the ratio of the density of glacial ice to sea water, L is length (m), W is width (m), H is height (m) and Va is a factor (depending on iceberg shape; see Table 1). The approximate drafts of the icebergs were estimated using (Reference Hotzel and MillerHotzel and Miller, 1983)

Shape factors for mass calculation (from Reference Hotzel and MillerHotzel and Miller, 1983)

where D is draft (m) and L is length (m). In some cases iceberg drafts were estimated on the basis of grounding events. For grounded icebergs, both grounding depth and calculated draft will be presented.
Results
Here we present the dimensions and types of the ten icebergs with mounted GPS transponders. In addition, the observed speeds and drift tracks are outlined for the whole period during which position data were collected. Furthermore, detailed description of drift and speed is given for each individual tracked iceberg, and for one of the icebergs we demonstrate how the wind acts as a driving force for the drift speed and pattern. The relationship between size and drift speed is investigated for four icebergs located in the same area when the GPS transponders were installed.
Dimensions of icebergs with GPS transponder
The positions of the icebergs at the time the GPS transponders were installed are shown in Figure 5.
The positions of the ten icebergs at the time the GPS transponders were installed. The outline of the exploration license Block 9 (Tooq) is shown by the large red polygon. The location of the 3-D seismic survey is outlined by the smaller red polygon. Bathymetry (m) is also indicated.

Following the definitions of iceberg size and shape of Reference Barker, Sayed and CarrieresBarker and others (2004), the icebergs with GPS transponders installed were classified into four size categories (medium (M), large (L), very large (VL) and giant icebergs (GB)) and three shape classes (tabular (TAB), blocky (BLK) and wedged (W)) (see Tables 1 and 2).
Classified sizes and shapes of the tracked icebergs. For icebergs 001, 002 and 003, estimated masses and drafts are based on grounding events. For all icebergs, parameters have been estimated using Eqn (2)

GPS transponder 001_646995 (Figs 5 and 6) was deployed on 26 September 2011 at 19:19 UTC on a giant tabular iceberg at 73.0062° N, 56.2169° W. The iceberg originated from Upernavik glacier and was identified just at the outlet of Upernavik Isfjord ∼40 km from the glacier front. At the time of observation, the iceberg showed no sign of tumbling as the surface had not been submerged, indicating that only a short time had passed since calving. The GPS transponder was placed approximately at the center of the iceberg. Approximate iceberg dimensions were length 450 m, width 300 m and mean height 35 m. The iceberg mass was estimated at ∼17 000 000 t and the draft at 260 m/ 180 m, based on grounding depth and Eqn (2), respectively.
Iceberg 001_646995.

GPS transponder 002_646997 (Figs 5 and 7) was deployed on 27 September 2011 at 17:19 UTC on a very large tabular iceberg at 72.9007° N, 54.6558° W. The iceberg originated from Upernavik glacier and was found very close to the glacier front with a lot of bergy bits, growlers and sea ice floating around. The iceberg showed no sign of tumbling as the surface had not been submerged and there was a thin layer of new snow (∼5 cm) on the top surface. Approximate iceberg dimensions were length 230 m, width 150 m and mean height 30 m. The iceberg mass was estimated at ∼3 700 000 t and the draft at 220 m/120 m, based on grounding events and Eqn (2), respectively.
Iceberg 002_646997.

GPS transponder 003_646998 (Figs 5 and 8) was deployed on 26 September 2011 at 12:40 UTC on a giant tabular iceberg at 73.0062° N, 56.2169° W. When the GPS transponder was installed, the iceberg was grounded in 200 m water depth in the central part of Block 9 (Tooq). The main part of the iceberg was tabular with some terraces on one side (see Fig. 8). The iceberg showed clear signs of erosion and partial tumbling since the terraces were rounded and previous waterlines could be seen on its side. Approximate iceberg dimensions were length 305 m, width 220 m and mean height 30 m. The iceberg mass was estimated at 7 200 000 t and the draft at 200 m/140 m, based on grounding depth and Eqn (2), respectively.
Iceberg 003_646998.

Icebergs 004, 005 and 006 had similar morphologic characteristics, with very steep and well-defined edges and a flat surface. The surface appearance was very smooth, with many drainage channels and melt ponds, and had clearly been influenced by solar radiation and melting over time. The icebergs showed no sign of tumbling, although iceberg 005 was slightly tilted and is classified as wedged. Icebergs 004 and 005 were intersected with refrozen meltwater. Based on the very similar morphology of the three icebergs, we conclude that they originate from the same glacier outlet.
GPS transponder 004_647000 (Figs 5 and 9) was deployed on 26 September 2011 at 13:02 UTC on a giant tabular iceberg at 73.5213° N, 58.81711° W. The iceberg was situated approximately in the middle of Block 9 (Tooq) when the GPS transponder was installed. Approximate iceberg dimensions were length 305 m, width 275 m and mean height 20 m. The iceberg mass was estimated at ∼6 000 000 t and the draft at 140 m, using Eqn (2). The iceberg drifted freely in areas with 120 m water depth, showing that the maximum possible draft was 120 m.
Iceberg 004_647000.

GPS transponder 005_647003 (Figs 5 and 10) was deployed on 26 September 2011 at 16:23 UTC on a large wedged iceberg at 73.5166° N, 58.3459° W. The iceberg was situated in the eastern part of the 3-D seismic focus area when the GPS transponder was installed. Approximate iceberg dimensions were length 130 m, width 115 m and mean height 30 m. The iceberg mass was estimated at ∼800 000 t and the draft at 80 m, using Eqn (2). The iceberg drifted freely in areas with ∼120 m water depth, showing that the maximum possible draft was 120 m.
Iceberg 005_647003.

GPS transponder 006_647004 (Figs 5 and 11) was deployed on 26 September 2011 at 15:36 UTC on a medium-sized tabular iceberg at 73.21708°N, 57.68473° W. The iceberg was situated in the southeastern part of Block 9 (Tooq) when the GPS transponder was installed. Approximate iceberg dimensions were length 110 m, width 105 m and mean height 20 m. The iceberg mass was estimated at ∼820 000 t and the draft at 70 m, using Eqn (2). The iceberg drifted over areas with ∼120 m water depth, showing that the maximum possible draft was 120 m.
Iceberg 006_647004.

GPS transponder 007_647050 (Figs 5 and 12) was deployed on 26 September 2011 at 16:07 UTC on a medium-sized tabular iceberg at 72.9995° N, 59.2453° W. The iceberg was situated in the southern part of Block 9 (Tooq) when the GPS transponder was installed. The iceberg had been exposed to solar radiation and erosion from sea water over time, indicating that it had been in open sea for a long period. It had not tumbled but was slightly tilted and the previous waterline could be seen on the sides. Approximate iceberg dimensions were length 95 m, width 65 m and mean height 15 m. The iceberg mass was estimated at ∼330 000 t and the draft at 70 m, using Eqn (2).
Iceberg 007_647050.

GPS transponder 008_647056 (Figs 5 and 13) was deployed 26 September 2011 at 19:13 UTC on a medium-sized tabular iceberg at 73.0283° N, 56.3549° W. The iceberg originated from Upernavik glacier and was found at the outlet of Upernavik Isfjord ∼60 km from the glacier front and very close to iceberg DMI_2310. The surface shape was hilly, varying between ∼10 and 40 m a.s.l. The iceberg showed no sign of tumbling as the surface had not been submerged, indicating that a short time had passed since calving. Approximate iceberg dimensions were length 110 m, width 110 m and mean height 20 m. The iceberg mass was estimated at ∼860 000 t and the draft at 70 m, using Eqn (2).
Iceberg 008_647056.

GPS transponder DMI_2310 (Figs 5 and 14) was deployed on 26 September 2011 at 19:13 UTC on top of a very large tabular iceberg at 73.0283° N, 56.3549° W. The iceberg originated from Upernavik glacier and was found at the outlet of Upernavik Isfjord ∼60 km from the glacier front. The iceberg was hilly with abrupt escarpments of >20 m. It showed no sign of tumbling as the surface had not been submerged, indicating that a short time had passed since calving. Approximate iceberg dimensions were length 290 m, width 230 m and mean height 20 m. The iceberg mass was estimated at ∼4 800 000 t and the draft at 130 m, using Eqn (2).
Iceberg DMI_2310.

GPS transponder DMI_3310 (Figs 5 and 15) was deployed on 26 September 2011 at 19:13 UTC on top of a very large tabular iceberg at 73.0283° N, 56.3549° W. The iceberg originated from Upernavik glacier and was found at the outlet of Upernavik Isfjord ∼60 km from the glacier front. The iceberg showed no sign of tumbling as the surface had not been submerged, indicating that a short time had passed since calving. Approximate iceberg dimensions were length 275 m, width 130 m and mean height 20 m. The iceberg mass was estimated at ∼2 500 000 t and the draft at 130 m, using Eqn (2).
Iceberg DMI_3310.

Iceberg drift registered by the GPS transponders
In this subsection the general drift trajectories and speeds for the ten icebergs studied are presented for the whole data-logging period (Table 3). Subsequently, the drift paths and speeds are presented in more detail for each individual iceberg.
First and last dates of tracking (position logging) plus the total number of logging days for the individual icebergs with GPS transponders installed. Date format is dd/mm/yyyy

The length of the logging period for the individual transponders/icebergs depends mainly on two factors: (1) the battery capacity of the transponders and (2) the stability of the icebergs. The Geoforce XS-TA GPS transponders were expected to have battery capacity for ∼6 months under normal temperature conditions. However, the Geoforce XS-TA GPS transponders on icebergs 001, 002 and 004 transferred data for 138, 148 and 145 days, respectively (Table 3). These transponders apparently all stopped transmitting data due to low battery capacity and they were located far from each other when the transmission stopped.
The GPS transponders on icebergs 003, 005, 006, 007, 008 and DMI_3310 presumably stopped transmitting due to the fact that the icebergs tumbled or broke into smaller parts. This has been verified for iceberg 003, which was seen disintegrating on successive satellite images covering the area. These transponders all stopped transmitting within a period of 25 days after deployment. The Canatec GPS beacon on iceberg DMI_2310 transmitted data until summer 2012. However, this transmitter must have fallen off the iceberg during the winter or spring, since after sea-ice break-up in spring 2012 no iceberg could be observed on satellite images of the location at which the signal from the transmitter was recorded. It is assumed that the transponder at that point in time was floating in water.
Despite the fact that the general iceberg drift regime prevailing in the West Greenland waters is northwards, followed by deviation of the flow to the west towards the Canadian coast (Fig. 2), this study has shown that iceberg drift will in some cases differ significantly from this overall pattern. Two of the icebergs (001 and 002) drifted southward because they were trapped by the advancing sea ice forming in the region (Fig. 16). Iceberg 001 drifted as far south as west of Disko Island, >450 km south of the initial position at which the GPS transponder was deployed.
Drift patterns of the ten icebergs with GPS transponders installed. Note that iceberg 001 drifted 450 km south to a position west of Disko Island.

The maximum and mean drift speeds for the ten icebergs ranged from 9 to 68 cm s−1 and from 0.5 to 37 cm s−1, respectively (Table 4). Mean speed for all icebergs over the entire period was 10 cm s−1. The total iceberg drift distance was 3141 km calculated as the sum of the lengths of all the line segments making up each individual iceberg track in question. However, it should be noted that when using a 1 hour sampling frequency not all the details of the iceberg trajectory will be revealed.
Maximum drift speed, mean drift speed and drift distance for the ten icebergs

Drift speed and pattern for iceberg 001_646995
After deployment of the GPS transponder, iceberg 001 stayed in the same area at the outlet of Upernavik Isfjord between 27 September and 5 November (Fig. 17). It drifted with a mean speed of 3 cm s−1 and a maximum speed of 19 cm s−1. Between 5 and 25 November it drifted west with a mean speed of 11 cm s−1 and a maximum speed of 64 cm s−1, which was observed on 14 November 2011. It was grounded at ∼260 m water depth for 10 days between 25 November and 5 December. It was trapped in the sea ice during this period. After the iceberg started drifting again on 5 December, the drift became clockwise circular towards the western part of Block 9 (Tooq). Between 21 December 2011 and 11 February 2012 the drift direction was primarily southwards for >450 km until the signal was lost west of Disko Island. The southerly drift direction was probably driven by wind and sea ice. The mean and maximum drift speeds during this period were 14 and 58 cm s−1, respectively. Based on the available data, it has not been possible to estimate the relative importance of wind and sea ice for this southward motion.
Drift speed and pattern for iceberg 001_646995 (27 September 2011 to 11 February 2012): (a) drift pattern, (b) drift speed, (c) drift direction latitude (blue line) and longitude (green line). Date format is dd.mm.yy.

Drift speed and pattern for iceberg 002_646997
Within the first couple of days iceberg 002 was located in front of the Upernavik Isfjord glacier front (Fig. 18). Between 1 and 25 October the iceberg drifted west and northwest out of the fjord, with a mean speed of 5 cm s−1 and a maximum speed of 19 cm s−1. It stayed in the same area outside the outlet of Upernavik Isfjord between 25 October and 7 November. After 7 November and until 15 November it drifted southwest and then north, with a mean speed of 9 cm s−1. A maximum speed of 59 cm s−1 was observed on 14 November 2011. For iceberg 001, the maximum drift speed was observed on the same date. The strong acceleration of the two icebergs was due to very strong southerly winds between 12 and 15 November. The iceberg was nearly stationary for >6 weeks between 15 November 2011 and 11 January 2012 and was most likely grounded at 220 m depth. During this period it was encapsulated by the advancing sea ice, and after 11 February 2012 the drift direction was primarily southerly for >60 km until the signal was lost.
Drift speed and pattern for iceberg 002_646997 (27 September 2011–22 February 2012): (a) drift pattern; (b) drift speed; and (c) drift direction latitude (blue line) and longitude (green line). Date format is dd.mm.yy.

Drift speed and pattern for iceberg 003_646998
Iceberg 003 was grounded in 220 m water depth when the GPS transponder was installed, and the signal was lost only 13 days after deployment (Fig. 19). Based on observations from satellite images over the area in the same period, the iceberg grounded on 13 September and was released on 11 October, probably because it tumbled or broke into smaller icebergs. During the measurement period it rotated on a radius of ∼200 m and at a mean speed <1 cm s−1. The rotation was caused by the tidal current and changing wind direction.
Drift speed and pattern for iceberg 003_646998 (26 September–10 October 2011): (a) drift pattern and (b) drift speed. Date format is dd.mm.yy.

Drift speed and pattern for iceberg 004_647000
Immediately after deployment of the GPS transponder, iceberg 004 drifted west and then in a northerly direction until 18 October, with a mean speed of 17 cm s−1 (Fig. 20). The maximum drift speed observed in this period was 68 cm s−1 on 29 November. Between 18 October and 6 November the iceberg remained in the same area, drifting in circles with a mean speed of 8 cm s−1. It was surrounded by sea ice during this period. It continued drifting northwest, following the coastline and turning northwest with a mean speed of 14 cm s−1 and a maximum speed of 42 cm s−1 on 14 November, until it stopped 70 km east of Kap York on 20 November. It remained in the area and moved very little until the signal finally stopped on 17 February 2012 due to low battery power.
Drift speed and pattern for iceberg 004_647000 (26 September 2011 to 17 February 2012): (a) drift pattern; (b) drift speed; and (c) drift direction latitude (blue line) and longitude (green line). Date format is dd.mm.yy.

Drift speed and pattern for iceberg 005_647004
After deployment of the GPS transponder on 26 September, iceberg 005 started drifting in a large clockwise circle, first south then west and eventually north (Fig. 21). From 1 October it drifted in an easterly direction towards the coast; the mean speed in this period was 17 cm s−1 and the maximum speed was 45 cm s−1 observed on 29 September. The drift speed decreased between 3 and 5 October to a mean of 12 cm s−1. Between 6 and 13 October the iceberg drifted in a northeasterly direction until it stopped on 13 October, probably due to grounding. Unfortunately, it grounded in an area where the bathymetry is poorly known and therefore not useful for estimating the draft. The GPS signal was lost between 14 and 17 October, probably due to heavy precipitation, but the signal came back on 17 October and then finally disappeared on 18 October.
Drift speed and pattern for iceberg 005_647003 (26 September–18 October 2011): (a) drift pattern; (b) drift speed; and (c) drift direction latitude (blue line) and longitude (green line). Date format is dd.mm.yy.

Drift speed and pattern for iceberg 006_647004
The drift pattern for iceberg 006 was similar to that for iceberg 005, but iceberg 006 started drifting in a north-westerly direction after deployment of the GPS transponder on 26 November (Fig. 22). Between 1 and 6 October the iceberg drifted in small circles and then continued drifting clockwise towards land. It was probably grounded between 11 and 17 October, but was released on 17 October. It probably grounded again 21 October and was in the same position until the signal was lost on 13 November 2011.
Drift speed and pattern for iceberg 006_647004 (26 September 2011 to 13 November 2011): (a) drift pattern; (b) drift speed; and (c) drift direction latitude (blue line) and longitude (green line). Date format is dd.mm.yy.

Drift speed and pattern for iceberg 007_647050
After deployment of the GPS transponder on 26 November the iceberg drifted in a big anticlockwise circle, first west then north and finally eastwards until the GPS signal was lost on 30 September after only 5 days of data collection (Fig. 23). The drift speed generally increased throughout the period from about 10 cm s−1 at the start (daily mean speed on 26 and 27 November) to ∼25 cm s−1 at the end (daily mean speed on 29 and 30 November). The mean drift speed was 17 cm s−1 during the period, with a maximum speed of 45 cm s−1 on 30 November.
Drift speed and pattern for iceberg 007_647050 (26–30 September 2011): (a) drift pattern; (b) drift speed; and (c) drift direction latitude (blue line) and longitude (green line). Date format is dd.mm.yy.

Drift speeds and patterns for icebergs 008_647056, DMI_2310 and DMI_3310
Observations of the drift patterns and speeds for icebergs 008_647056, DMI_2310 and DMI_3310 are presented in Figures 24, 25 and 26 since the three icebergs were located in the same area when the GPS transponders were installed. Icebergs 008_647056 and DMI_2310 were located <300 m from the outlet in Upernavik Isfjord, ∼60 km from the glacier front. The first recordings from the GPS transponders were available on 27 and 26 September, respectively. Iceberg DMI_3310 was ∼90 km from the glacier front when the first data from the GPS transponder were available on 26 September.
Drift pattern for iceberg 008_647056 (27 September–16 October 2011), iceberg DMI_2310 and iceberg DMI_3310 (29 September–16 October 2011). Date format is dd/mm/yy.

Drift speed for iceberg 008_647056 (27 September–16 October 2011), iceberg DMI_2310 and iceberg DMI_3310 (29 September–16 October 2011). Date format is dd.mm.yy.

Drift direction latitude (blue line) and longitude (green line) for iceberg 008_647056 (27 September–16 October 2011), iceberg DMI_2310 and iceberg DMI_3310 (29 September–16 October 2011). Date format is dd.mm.yy.

After deployment of the GPS transponders, icebergs 008 and DMI_2310 drifted northeast and then stopped in the same area, drifting in circles (Figs 24–26). Iceberg 008 continued drifting in a northerly direction with an increasing speed of up to 20 cm s−1 observed on 7 October. From 8 October and until the GPS signal disappeared on 16 October, the iceberg remained in approximately the same position. Iceberg DMI_2310 stayed in the same area between 28 September and 31 October, drifting in circles with a mean speed of 2 cm s−1 and maximum speed of 10 cm s−1. After 31 October the iceberg drifted west with a very low drift speed until 11 November. Between 11 and 15 November the drift speed increased due to strong southerly winds, reaching a maximum of 30 cm s−1 on 14 November. Between 15 November and 19 December, the iceberg drifted around inshore, only 30 km north of Upernavik Isfjord where the GPS transponder was installed. The iceberg was surrounded by sea ice in that period and was either grounded or locked in the sea ice from 19 December. After deployment of the GPS transponder on iceberg DMI_3310, it drifted north with a mean speed close to 0.5 cm s−1 and a maximum drift speed of 9 cm s−1 observed on 10 October. The GPS signal was lost on 16 October after only 21 days of data collection.
Relationship between iceberg size and drift speed
Relationships between iceberg size and drift speed have been investigated for four icebergs (004, 005, 006 and 007). These icebergs were located in the same area at the same time and it is assumed that they must have been exposed to approximately the same wind and current effects. The icebergs were located within a maximum radius of 60 km between 27 September at 07:11 UTC and 30 September at 14:17 UTC (Fig. 25).
The four icebergs drifted at approximately the same speed, <30 cm s−1, during the first period (Fig. 27), when the wind speed varied between 4 and 7 m s−1 and the wind direction changed from northerly to southerly (Fig. 28). The wind speed increased at the beginning of period 2. The iceberg drift speed also increased during this period and the various icebergs started to drift at different speeds. Iceberg 004 had the greatest mass and length (Table 5) and showed the greatest variation in drift speed; the maximum speed observed was 68 cm s−1. All icebergs were clearly influenced by changes in wind speed, and there appeared to be a time difference of about 4 hours between increase in wind speed and increase in iceberg drift speed. The observations presented here are based on a very limited number and type of icebergs and thus should be treated with caution. Further investigations of several icebergs and current patterns in the area should be included in future studies.
Maximum drift speed, mean drift speed and drift distance for the period 27 September 2011 07:11 UTC to 30 September 2011 14:17 UTC

Drift pattern for icebergs 004, 005, 006 and 007.

(a) Drift speed for icebergs 004 (dark blue), 005 (green), 006 (red) and 007 (light blue), (b) wind speed and (c) wind direction for 27 September 2011 07:11 UTC to 30 September 2011 14:17 UTC. Date format is dd.mm.

Discussion of Results
In the 1980s the International Ice Patrol deployed a number of satellite-tracked buoys on icebergs in eastern Baffin Bay to study their drift patterns (Reference RobeRobe, 1982b). From the study of all the buoys tracked, it was concluded that the drift speed of icebergs along the Greenland coast of Baffin Bay rarely exceeds 20 cm s−1. Speeds up to 50 cm s−1 can be attained if current, wind, waves and tide all act in the same direction. Most of the time, icebergs drift in Greenland waters at speeds <10 cm s−1 (<∼5 nmi d−1). The larger icebergs ground frequently and for long periods during their journey. The study indicated that south of 74°30’ N but north of Davis Strait, icebergs moved erratically, with little evidence of mean drift. It was proposed that this was probably due to the fact that local currents in the area were governed mainly by local winds.
The conclusions of Reference RobeRobe (1982b) have been supported by the present study. However, three of the ten icebergs in the present study attained maximum speeds in excess of 60 cm s−1, greater than found in the study in the 1980s. The average speed for seven of the ten icebergs in the present study was in the same range (<10 cm s−1) as found in the 1980s study. However, high mean speeds of 10, 15 and 37 cm s−1 were recorded for three of the icebergs in the present study (Table 4). It should be noted that these three high average velocities were recorded as a mean value over very long drifting distances (1083, 246 and 363 km, respectively). The observation in the 1980s about the erratic movement of icebergs is also repeated here. Only one of the ten studied icebergs showed behaviour that follows the general prediction of northern flow and anticlockwise movement in Baffin Bay (Figs 2 and 16). Two icebergs even drifted far southwards after they were caught in the winter sea ice.
In 1997 the DMI conducted an iceberg study in Baffin Bay (Berg Watch 97), which was initiated by the Mineral Resources Administration for Greenland (Reference Hansen and HartmannHansen and Hartmann, 1998). A total of nine beacons was deployed and tracked on icebergs from June to November 1997 (Fig. 29). The 1997 study supported the general coastwise and anticlockwise drift pattern in eastern Baffin Bay. Average drift of large icebergs was, as in the 1980s study, <10 cm s−1 in eastern Baffin Bay. In western Melville Bay, the average drift increased significantly and three icebergs passed Kap York at average speeds of 15–20 cm s−1. Two icebergs drifted into western Baffin Bay, and the drift rates were generally several times higher (20–40 cm s−1 or more) than in eastern Baffin Bay. In periods with strong winds (>10 m s−1), ‘new’ current systems developed several times simultaneously and drift rates of 10–20 cm s−1 were in the same direction as the dominant wind, mostly coastwise. When the wind dropped, the observed drift rate decreased quickly. The coupling between drift and surface winds was not investigated in detail.
Summary of the recorded iceberg drift tracks during the Berg Watch project for the period 12 June–12 November 1997. The general drift pattern in eastern Baffin Bay is coastwise and anticlockwise from south to north. The box indicates the main area for the present study.

The present study indicates that some relationship exists between wind and iceberg drift speed. Four icebergs within the same local area drifted approximately at the same speed, <30 cm s−1, during the first period, when the wind speed varied between 4 and 7 ms−1 and the wind direction changed from northerly to southerly. The wind speed increased during the beginning of the second period. The iceberg drift speed also increased during the second period, and the various icebergs started to drift at different speeds. Iceberg 004 had the greatest mass and length (Table 5) and showed the greatest variation in drift speed; the maximum speed observed was 68 cm s−1. All icebergs were clearly influenced by changes in wind speed, and there seemed to be a time difference between the increase in wind speed and the increase in iceberg drift speed of about 4 hours. This observation should be treated with caution, and further investigations of several icebergs and current patterns in the area should be included in future studies.
The Berg Watch 97 study did not include a systematic survey of the distribution of type and size (including extremes) of icebergs in eastern Baffin Bay. Likewise the present study is biased by large tabular icebergs that were easily accessible for deployment of the GPS tracking devices. The 1997 icebergs tracked by beacons were several hundred metres in horizontal scale but their heights were 25–40 m a.s.l., with a maximum height of 61 m. This is generally the same size class as the ten icebergs investigated here; however, this study included tracking of three giant icebergs of up to 17 × 106 t (Table 2). The largest tracked iceberg in the 1997 study had a draft of ∼225–230 m, estimated from grounding events and the local bathymetry. The largest tracked iceberg in the present study had a draft of 260 m.
As indicated in Table 2, the equation established for calculating iceberg draft in western Baffin Bay based on shape and subaerial size factors (Reference Hotzel and MillerHotzel and Miller, 1983) proved to be inadequate to describe the draft of icebergs in eastern Baffin Bay studied in this paper. In three cases the draft was underestimated by 80, 100 and 60 m (icebergs 001, 002 and 003; Table 2) and in one case the calculated draft exceeded the actual observed grounding depth by 20 m (iceberg 004; Table 2). No firm conclusions with regard to the calculated and actual draft sizes could be made for the remaining six icebergs. They were all calculated to have drafts less than the observed water depth over which they had drifted, and the icebergs did not ground during the observation period. The four icebergs not conforming to the modelled drafts were all tabular and characterized to be in the giant or very large size category. Since the icebergs in western Baffin Bay studied by Reference Hotzel and MillerHotzel and Miller (1983) were older than the icebergs studied here (all with a possible similar Greenlandic origin), there might be change in the iceberg drafts in relation to their shapes when, over time, they drift anticlockwise from eastern to western Baffin Bay and progressively undergo melting and disintegration.
Conclusions
In the current field study of ten icebergs in Baffin Bay, northwest of Upernavik, conducted in September 2011, the iceberg drift patterns and speeds were measured using GPS transponders, continuously logging the position at 1 hour intervals. The study is biased by large tabular icebergs that were easily accessible for deployment of the GPS tracking devices. Sizes and above-waterline dimensions (length, width, height) of the icebergs were measured using a GPS/ pressure altimeter and geometrically rectified digital photographs taken during the field campaign.
The iceberg lengths, masses and drafts ranged from 95 to 450 m, 330 000 to 17 000 000 t and 70 to 260 m, respectively. The drift patterns differed significantly from iceberg to iceberg. Two icebergs drifted south after they were captured by sea ice. One iceberg drifted north into Melville Bay. Six of the icebergs drifted towards the shore in northeasterly directions. Finally, three grounding events were observed offshore within Block 9 (Tooq) during the tracking period. The GPS signal was lost from six of the icebergs within the first 23 days of logging. Three transponders transferred data for more than 5 months until the battery ran out of power. One GPS transponder continued to transmit data until April 2012. The measured maximum drift speed was 68 cm s−1 (2.4 km h−1) and the mean drift speed for all ten icebergs was 10 cm s−1 (0.4 km h−1).
Relations between iceberg size and drift speed were investigated, showing that icebergs with large surface areas moved at the highest speeds and that particularly high drift speeds occurred during strong wind conditions.
The equation established for calculating iceberg mass and draft based on shape and subaerial size factors (Reference Hotzel and MillerHotzel and Miller, 1983) in western Baffin Bay was inadequate to describe the draft of icebergs in eastern Baffin Bay studied here. In three cases the draft was underestimated by 60, 80 and 100 m and in one case the calculated draft exceeded the actual observed grounding depth by 20 m. No conclusions could be made for the remaining six icebergs. The icebergs that did not conform to the modelled drafts were all tabular and in either the giant or very large size category. It is therefore proposed that there might be an evolution in the iceberg drafts in relation to their shapes when, over time, they drift anticlockwise from eastern to western Baffin Bay before eventually disintegrating.
As shown by this study, at present only very few generalized statements with regard to iceberg drift and speed can be made, since icebergs occasionally ground, get caught in sea ice and act relative to local conditions such as currents, tides, etc. Future modelling and forecasting of iceberg drift direction and speed will require further detailed observations both in space and time for all iceberg size classes and shapes (both above and below sea level) in order to separate these into drift classes. In addition, studies of wind speed and direction as well as sea current speed and direction at different depths will be needed in order to fully understand the motion process for icebergs in general.
Acknowledgements
We thank the Greenland Mineral License and Safety Authority (MLSA), the Danish Meteorological Institute (DMI) and Maersk Oil Kalaallit Nunaat A/S and its joint venture partners in license Block 9 (Tooq), Tullow Oil Ltd and Nunaoil A/S, for permission to publish this paper. We also thank two anonymous referees for suggested improvements to and comments on an earlier version of the manuscript.



