




I. INTRODUCTION
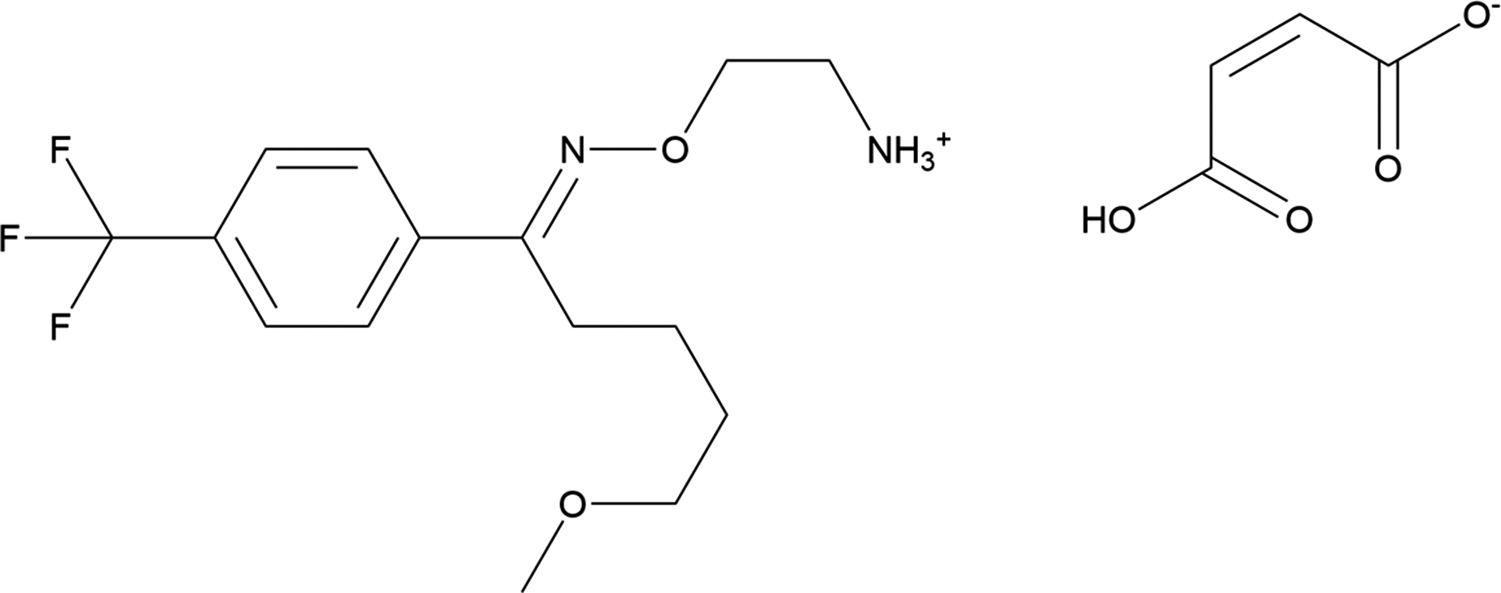
Fluvoxamine maleate (sold under the brand names Luvox® and Faverin®, among others) is an antidepressant, used to treat major depressive disorder and obsessive–compulsive disorder, but is also used to treat other mental disorders, including anxiety, panic, social anxiety, and post-traumatic stress. The systematic name (CAS Registry Number 61718-82-9) is 2-[(E)-[5-methoxy-1-[4-(trifluoromethyl)phenyl]pentylidene]amino]oxyethanammonium hydrogen (Z)-but-2-enedioate. Conventional naming is fluvoxamine maleate, though it is a 1:1 salt and is more correctly named fluvoxamine hydrogen maleate. A two-dimensional molecular diagram of fluvoxamine hydrogen maleate is shown in Figure 1.
The two-dimensional structure of fluvoxamine hydrogen maleate.

A powder diffraction pattern for fluvoxamine maleate from a flat plate specimen on a Philips diffractometer is reported by Foda et al. (Reference Foda, Radwan and Al Deeb1996), along with other chemical and physical data. Differential scanning calorimetry (DSC) and X-ray diffraction results indicated the presence of polymorphism, but infrared spectroscopy (IR) spectra were less clear. The Foda et al. (Reference Foda, Radwan and Al Deeb1996) powder pattern is limited, missing the low-angle portion (Figure 2). It is not completely clear that the patterns represent the same material. Our synchrotron pattern seems to contain additional peaks, so it may represent a mixture.
Comparison of the synchrotron pattern of fluvoxamine maleate (black) to that reported by Foda et al. (Reference Foda, Radwan and Al Deeb1996) (green). The Foda et al. (Reference Foda, Radwan and Al Deeb1996) pattern (measured using Cu Kα radiation) was digitized using UN-SCAN-IT (Silk Scientific, 2013) and converted to the synchrotron wavelength of 0.819826(2) Å using JADE Pro (MDI, 2024). Image generated using JADE Pro (MDI, 2024).

This work was carried out as part of a project (Kaduk et al., Reference Kaduk, Crowder, Zhong, Fawcett and Suchomel2014) to determine the crystal structures of large-volume commercial pharmaceuticals and include high-quality powder diffraction data for them in the Powder Diffraction File (Kabekkodu et al., Reference Kabekkodu, Dosen and Blanton2024).
II. EXPERIMENTAL
Commercial reagent fluvoxamine maleate was purchased from TargetMol (Batch #T1077) and was used as-received. The white powder was packed into a 0.5-mm-diameter Kapton capillary and rotated during the measurement at ~2 Hz. The powder pattern was measured at 298(1) K at the Wiggler Low Energy Beamline (Leontowich et al., Reference Leontowich, Gomez, Diaz Moreno, Muir, Spasyuk, King, Reid, Kim and Kycia2021) of the Brockhouse X-ray Diffraction and Scattering Sector of the Canadian Light Source using a wavelength of 0.819826(2) Å (15.1 keV) from 1.6 to 75.0° 2θ with a step size of 0.0025° and a collection time of 3 minutes. The high-resolution powder diffraction data were collected using eight Dectris Mythen2 X series 1K linear strip detectors. NIST SRM 660b LaB6 was used to calibrate the instrument and refine the monochromatic wavelength used in the experiment.
The pattern was difficult to index. DICVOL06 (Louër and Boultif, Reference Louër and Boultif2007) as incorporated into EXPO2014 (Altomare et al., Reference Altomare, Cuocci, Giacovazzo, Moliterni, Rizzi, Corriero and Falcicchio2013) yielded a cell with a reasonable (integral number of formula units) volume only when up to three unindexed lines were permitted. This primitive monoclinic cell had a = 21.6506, b = 5.3443, c = 19.5852 Å, β = 100.071°, V = 2,231.5 Å3, and Z = 4. A reduced cell search of the Cambridge Structural Database (Groom et al., Reference Groom, Bruno, Lightfoot and Ward2016) yielded four hits, but no structures of fluvoxamine or its derivatives.
This cell does not account for all of the peaks in the pattern. Other indexing programs suggested larger cells (Z = 8 or 16), but they did not yield chemically reasonable crystal structures, particularly where one expects to observe N–H···O cation–anion hydrogen bonds. We examined the 2× supercells calculated by NBS*LATTICE (Karen and Mighell, Reference Karen and Mighell1985). A triclinic supercell with a = 10.674, b = 20.304, c = 22.320 Å, α = 76.86, β = 76.17, and γ = 74.76° yielded the best LeBail fit among the seven supercells, and was roughly similar to a triclinic cell suggested by some indexing programs. Using the transformation matrices reported by NBS*LATTICE, the monoclinic cell was transformed into this 2× triclinic cell. The monoclinic structure (see below) was transformed into the triclinic P-1 cell using Materials Studio (Dassault Systèmes, 2024). Although a slightly better fit to the pattern was obtained, the bonds and angles deviated widely from normal values. This doubled cell model was found to be a false path.
A fluvoxamine molecular structure was downloaded from PubChem (Kim et al., Reference Kim, Chen, Cheng, Gindulyte, He, He and Li2023) as Conformer3D_COMPOUND_CID_5324396.sdf. It was converted to a *.mol2 file using Mercury (Macrae et al., Reference Macrae, Sovago, Cottrell, Galek, McCabe, Pidcock and Platings2020). The additional hydrogen atom was added to the amino group using Materials Studio to create the cation. The structure of a maleate anion was extracted from that of rosiglitazone maleate hydrate (CSD Refcode KIWVUI; Cuffini et al., Reference Cuffini, Faudone, Ferro, Garland and Baggio2008). The structure was solved by Monte Carlo-simulated annealing techniques as implemented in EXPO2014 (Altomare et al., Reference Altomare, Cuocci, Giacovazzo, Moliterni, Rizzi, Corriero and Falcicchio2013), using the cation (-NH3+) and anion (-O−) as fragments and including a bump penalty. The suggested space group was P21/c, which was confirmed by the successful solution and refinement of the structure. The torsion angles of the anion were fixed, making it a rigid body.
Rietveld refinement was carried out with GSAS-II (Toby and Von Dreele, Reference Toby and Von Dreele2013). Only the 1.5–45.0° portion of the pattern was included in the refinements (d min = 1.071 Å). All non-H-bond distances and angles were subjected to restraints, based on a Mercury/Mogul Geometry Check (Bruno et al., Reference Bruno, Cole, Kessler, Luo, Motherwell, Purkis and Smith2004; Sykes et al., Reference Sykes, McCabe, Allen, Battle, Bruno and Wood2011). The Mogul average and standard deviation for each quantity were used as the restraint parameters. The aromatic ring system in the cation was restrained to be planar. The restraints contributed 5.7% to the overall χ 2. Lowering the restraint weights resulted in an unreasonable geometry (long C–C bonds in the side chains of the cation). The hydrogen atoms were included in calculated positions, which were recalculated during the refinement using Materials Studio (Dassault Systèmes, 2024). The U iso of the heavy atoms were grouped by chemical similarity. Attempts to refine the displacement coefficients led to very large values (0.3–0.5 Å2), so they were fixed at reasonable values, at the cost of slightly higher residuals. The high U iso values suggested possible disorder in the trifluoromethyl groups and the side chains, but since an ordered model is necessary for the density functional theory (DFT) calculations, we chose not to model any disorder. The peak profiles were described using a uniaxial microstrain model, with [010] as the unique axis, based on the anisotropy of the lattice parameters. The background was modeled using a six-term shifted Chebyshev polynomial, with peaks at 3.03 and 11.23° 2θ to model the narrow and broad scattering from the Kapton capillary and any amorphous component of the sample.
The final refinement of 118 variables using 17,401 observations and 66 restraints yielded the residual R wp = 0.11279. The largest peak (0.94 Å from F1) and hole (1.41 Å from F1) in the difference Fourier map were 0.74(17) and −0.75(17) eÅ−3, respectively. The final Rietveld plot is shown in Figure 3. The largest features in the normalized error plot are in the shapes, positions, and intensities of some of the strong low-angle peaks, as well as at weaker higher-angle peaks, and the unindexed peaks. The sample seems to contain at least one additional crystalline phase and has probably changed during the measurement.
The Rietveld plot for fluvoxamine maleate. The blue crosses represent the observed data points, and the green line is the calculated pattern. The cyan curve is the normalized error plot, and the red line is the background curve. The blue tick marks indicate the fluvoxamine maleate peak positions. The vertical scale has been multiplied by a factor of 5× for 2θ > 17.5̊.

The crystal structure of fluvoxamine maleate was optimized (fixed experimental unit cell) with density functional theory techniques using VASP (Kresse and Furthmüller, Reference Kresse and Furthmüller1996) through the MedeA graphical interface (Materials Design, 2024). The calculation was carried out on 32 cores of a 144-core (768 GB memory) HPE Superdome Flex 280 Linux server at North Central College. The calculation used the GGA-PBE functional, a plane-wave cutoff energy of 400.0 eV, and a k-point spacing of 0.5 Å−1, leading to a 1 × 3 × 1 mesh, and took ~31.0 hours. Structure optimization and population analysis density functional theory calculations (fixed experimental cell) were carried out using CRYSTAL23 (Erba et al., Reference Erba, Desmarais, Casassa, Civalleri, Donà, Bush and Searle2023). The basis sets for the H, C, N, and O atoms in the calculation were those of Gatti et al. (Reference Gatti, Saunders and Roetti1994), and that for F was that of Peintinger et al. (Reference Peintinger, Vilela Oliveira and Bredow2013). The calculations were run on a 3.5 GHz PC using eight k-points and the B3LYP functional, and took ∼18.7 days.
III. RESULTS AND DISCUSSION
The sample of fluvoxamine maleate studied here appears to be a mixture and has probably suffered some beam damage. We propose a chemically reasonable crystal structure (with the expected features), which is consistent with the DFT optimizations. It should serve for the purposes of phase identification and quantitative phase analysis until a better sample can be characterized.
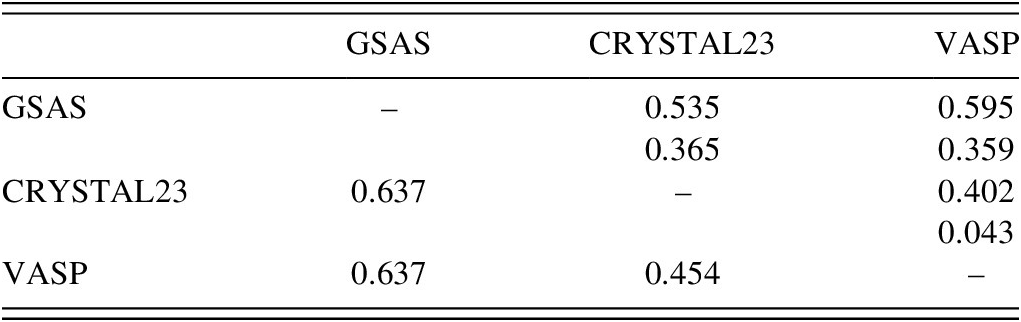
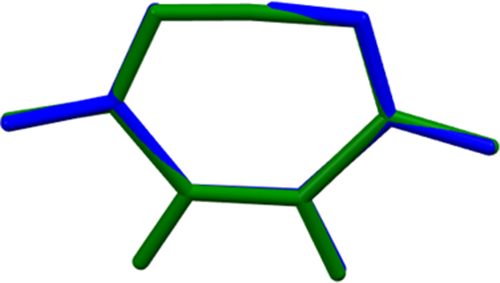
The availability of computer time permitted separate DFT geometry optimizations of the crystal structure of fluvoxamine maleate using both CRYSTAL23 and VASP. The structures differ significantly. The root-mean-square (rms) difference of the non-H atoms in the two optimized structures, calculated using the Mercury CSD-Materials/Search/Crystal Packing Similarity tool, is 0.454 Å (Table I and Figure 4). The rms Cartesian displacements of the non-H atoms in the optimized structures of the cation, calculated using the Mercury Calculate/Molecule Overlay tool, are 0.402 Å (Table I). The main differences are in the conformation of the methoxybutyl side chain (Figure 5). The difference in the optimized anions is much smaller at 0.043 Å (Figure 6). It is noteworthy that CRYSTAL23 yields a more asymmetric intramolecular O–H···O hydrogen bond in the maleate anion (O–H = 1.054 and 1.402 Å) than does VASP (1.111 and 1.322 Å). These results demonstrate that the results of a DFT optimization also contain some uncertainty. Because we analyze the hydrogen bonds using the CRYSTAL23 results, we will emphasize that structure in the remaining discussion.
Root-mean-square Cartesian displacements of non-H atoms in fluvoxamine maleate.

Top/right = molecule overlay; top = cation, bottom = anion; bottom/left = crystal packing similarity.
Comparison of the CRYSTAL23-optimized structure of fluvoxamine maleate (colored by atom type) to the VASP-optimized structure (green). The comparison was generated by the Mercury CSD-Materials/Search/Crystal Packing Similarity tool; the root-mean-square displacement is 0.454 Å. Image generated using Mercury (Macrae et al., Reference Macrae, Sovago, Cottrell, Galek, McCabe, Pidcock and Platings2020).

Comparison of the CRYSTAL23-optimized structure of the fluvoxamine cation (blue) to the VASP-optimized structure (green). The comparison was generated using the Mercury Calculate/Molecule Overlay tool; the root-mean-square difference is 0.402 Å. Image generated using Mercury (Macrae et al., Reference Macrae, Sovago, Cottrell, Galek, McCabe, Pidcock and Platings2020).

Comparison of the CRYSTAL23-optimized structure of the hydrogen maleate anion (blue) to the VASP-optimized structure (green). The comparison was generated using the Mercury Calculate/Molecule Overlay tool; the root-mean-square difference is 0.043 Å. Image generated using Mercury (Macrae et al., Reference Macrae, Sovago, Cottrell, Galek, McCabe, Pidcock and Platings2020).

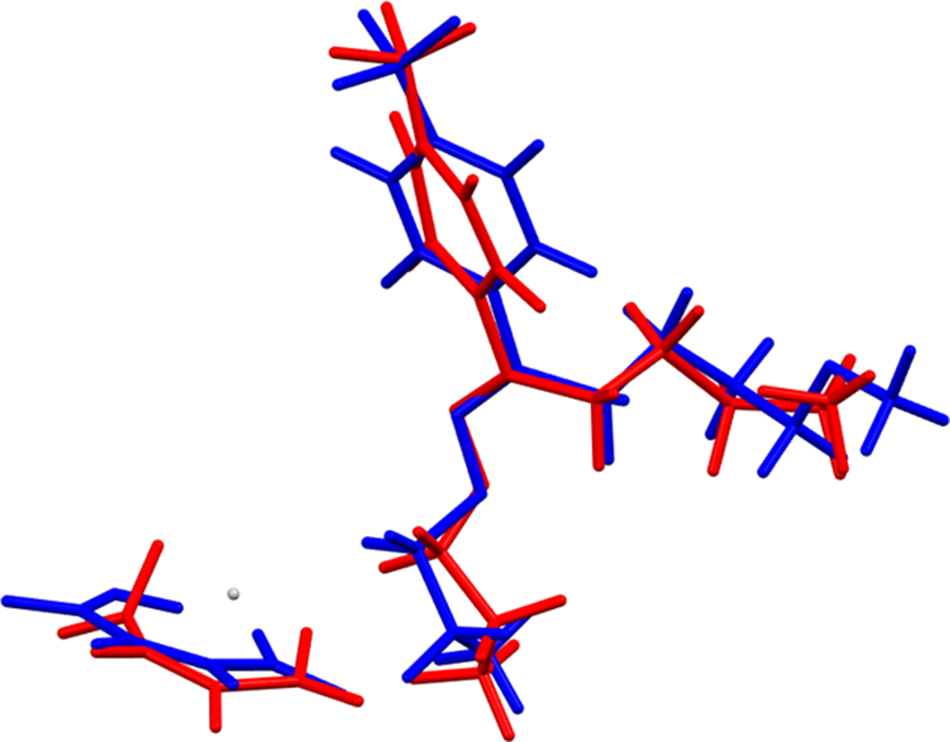
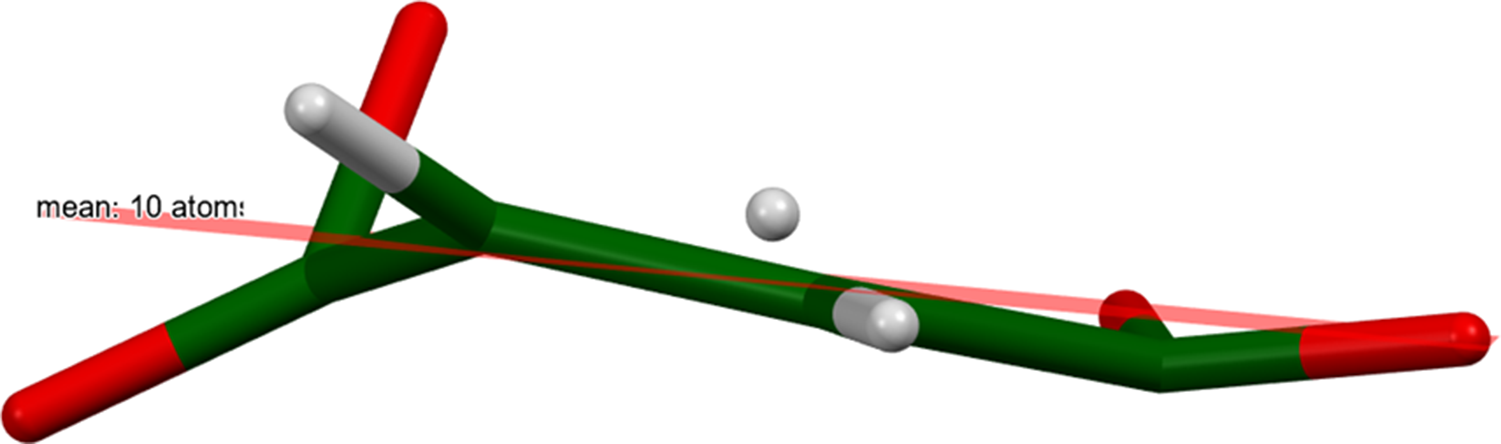
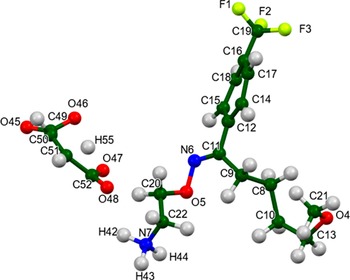
The rms difference of the non-H atoms in the Rietveld-refined and CRYSTAL23-optimized structures, calculated using the Mercury CSD-Materials/Search/Crystal Packing Similarity tool, is 0.637 Å (Table I). The rms Cartesian displacements of the non-H atoms in the Rietveld-refined and CRYSTAL23-optimized structures of the cation and anion, calculated using the Mercury Calculate/Molecule Overlay tool, are 0.535 and 0.365 Å (Figure 7). The agreements are outside the normal range for correct structures (van de Streek and Neumann, Reference van de Streek and Neumann2014). The main differences in the cation lie in the side chains. The maleate anion in the refined structure differs considerably from the expected planar conformation (Figure 8), and is chemically unreasonable. Correlations among variables almost certainly propagate this unreasonableness to the cation. Since this organic compound was measured on a wiggler beamline, the specimen almost certainly changed during the measurement, making the experimental structure less reliable than might be desired. We believe that the optimized structure is reliable. The asymmetric unit is illustrated in Figure 9.
Comparison of the Rietveld-refined (red) and CRYSTAL23-optimized (blue) structures of fluvoxamine hydrogen maleate. The root-mean-square differences are 0.535 and 0.365 Å for the cation and the anion, respectively. Image generated using Mercury (Macrae et al., Reference Macrae, Sovago, Cottrell, Galek, McCabe, Pidcock and Platings2020).

The deviation of the refined structure of the hydrogen maleate anion from the mean plane. Image generated using Mercury (Macrae et al., Reference Macrae, Sovago, Cottrell, Galek, McCabe, Pidcock and Platings2020).

The experimental asymmetric unit of fluvoxamine hydrogen maleate, with the atom numbering. The atoms are represented by 50% probability spheroids. Image generated using Mercury (Macrae et al., Reference Macrae, Sovago, Cottrell, Galek, McCabe, Pidcock and Platings2020).

All of the bond distances and bond angles, and most of the torsion angles, fall within the normal ranges indicated by a Mercury Mogul Geometry check (Macrae et al., Reference Macrae, Sovago, Cottrell, Galek, McCabe, Pidcock and Platings2020). The C11–C9–C8–C10 torsion angle of −145.5° lies on the tail of the major trans fraction of a trans/gauche distribution of similar torsion angles. The C12–C11–C9–C8 torsion angle of −56.6° lies on the tail of a distribution. The conformation of the cation is slightly unusual.
Quantum chemical geometry optimization of an isolated fluvoxamine cation (DFT/B3LYP/6-31G*/water) using Spartan‘24 (Wavefunction, 2023) indicated that the observed conformation is 6.7 kcal/mol higher in energy than the local minimum, which has a different conformation of the methoxybutyl chain. The global minimum-energy conformation is more compact (folded on itself), indicating that intermolecular interactions are important in determining the solid-state conformation.
The crystal structure (Figure 10) consists of alternating double layers of cations and anions parallel to the bc-plane. The trifluoromethyl groups are adjacent to each other. Hydrogen bonds (discussed below) link the layers of anions and cations parallel to the bc-plane. The Mercury Aromatics Analyser indicates only a weak interaction between the phenyl rings, with a distance of 9.87 Å.
The VASP-optimized crystal structure of fluvoxamine hydrogen maleate, viewed down the b-axis. Image generated using Diamond (Crystal Impact, 2023).

As expected, each of the three protons in the ammonium group N7 acts as a donor in a strong N–H···O hydrogen bond to the anion (Table II). The charge on O48 is larger than that on O45 (−0.59 vs. 0.49), making it reasonable that it is an acceptor in two hydrogen bonds. H44 also participates in a weaker intramolecular N–H···O hydrogen bond. The energies of the N–H···O hydrogen bonds were calculated using the correlation of Wheatley and Kaduk (Reference Wheatley and Kaduk2019). Intramolecular C–H···O and C–H···N hydrogen bonds, as well as an intermolecular C–H···O hydrogen bond between the cation and anion, also contribute to the crystal energy. As expected, there is a very strong O–H···O hydrogen bond in the hydrogen maleate anion. The energy of this hydrogen bond was calculated using the correlation of Rammohan and Kaduk (Reference Rammohan and Kaduk2018). There are also C–H···O hydrogen bonds between the maleate anions. The N–H···O hydrogen bonds between the cations and the anions link them in a two-dimensional layer parallel to the bc-plane (Figure 11). Prominent in these layers are rings with a graph set R2,4(8) (Etter, Reference Etter1990; Bernstein et al., Reference Bernstein, Davis, Shimoni and Chang1995; Motherwell et al., Reference Motherwell, Shields and Allen2000) and chains with graph set C2,2(9).
Hydrogen bonds (CRYSTAL23) in fluvoxamine maleate.

* Intramolecular.
The hydrogen-bonded layers in the crystal structure of fluvoxamine hydrogen maleate. The bc-plane is horizontal. Image generated using Mercury (Macrae et al., Reference Macrae, Sovago, Cottrell, Galek, McCabe, Pidcock and Platings2020).

The volume enclosed by the Hirshfeld surface of fluvoxamine maleate (Figure 12; Hirshfeld, Reference Hirshfeld1977; Spackman et al., Reference Spackman, Turner, McKinnon, Wolff, Grimwood, Jayatilaka and Spackman2021) is 544.40 Å3, 98.26% of one-fourth of the unit cell volume. The packing density is thus typical. The only significant close contacts (red in Figure 12) involve the hydrogen bonds. The volume/non-hydrogen atom is slightly larger than usual at 18.5 Å3.
The Hirshfeld surface of fluvoxamine hydrogen maleate. Intermolecular contacts longer than the sum of the van der Waals radii are colored blue, and contacts shorter than the sum of the radii are colored red. Contacts equal to the sum of radii are white. Image generated using CrystalExplorer (Spackman et al., Reference Spackman, Turner, McKinnon, Wolff, Grimwood, Jayatilaka and Spackman2021).

The Bravais–Friedel–Donnay–Harker (Bravais, Reference Bravais1866; Friedel, Reference Friedel1907; Donnay and Harker, Reference Donnay and Harker1937) algorithm suggests that we might expect platy morphology for fluvoxamine maleate, with {100} as the major faces. A fourth-order spherical harmonic model was included in the refinement. The texture index was 1.109(6), indicating that the preferred orientation was significant in this rotated capillary specimen.
DEPOSITED DATA
The powder pattern of fluvoxamine hydrogen maleate from this synchrotron dataset has been submitted to the International Centre for Diffraction Data (ICDD) for inclusion in the Powder Diffraction File. The Crystallographic Information Framework (CIF) files containing the results of the Rietveld refinement (including the raw data) and the DFT geometry optimization were deposited with the ICDD. The data can be requested at pdj@icdd.com.
ACKNOWLEDGEMENTS
We thank Adam Leontowich for his assistance in the data collection. We also thank the ICDD team – Megan Rost, Steve Trimble, and Dave Bohnenberger – for their contribution to research, sample preparation, and in-house XRD data collection and verification.
FUNDING STATEMENT
Part of the research described in this paper was performed at the Canadian Light Source, a national research facility of the University of Saskatchewan, which is supported by the Canada Foundation for Innovation (CFI), the Natural Sciences and Engineering Research Council (NSERC), the Canadian Institute of Health Research (CIHR), the Government of Saskatchewan, and the University of Saskatchewan. This work was partially supported by the International Centre for Diffraction Data.
COMPETING INTERESTS
The authors have no competing interests.






 Open access

