


Introduction
Microcrystalline TiO2 pigment is produced from rutile (TiO2) and ilmenite (FeTiO3) (Filippou and Hudon, Reference Filippou and Hudon2009; Zhang et al., Reference Zhang, Zhu and Cheng2011; Perks and Mudd, Reference Perks and Mudd2019, Reference Perks and Mudd2021). Its opacity makes it the best pigment for white paint and ceramics; it is also used in plastic, paper, printing ink, nanocrystalline thin-film electrodes for solar cells and electrochromic devices and whitener agent for food (Granqvist et al., Reference Granqvist, Azens, Isidorsson, Kharrazi, Kullman, Lindström, Niklasson, Ribbing, Rönnow and Mattsson1997; Meacock et al., Reference Meacock, Taylor, Knowles and Himonides1999; Grätzel, Reference Grätzel2003; Dondi et al., Reference Dondi, Cruciani, Guarini, Matteucci and Raimondo2006; McNulty, Reference McNulty2008). Ninety-three percent of the global titanium production is used for TiO2 pigments (Murphy and Frick, Reference Murphy and Frick2006). Every year ∼5.7 Mt of TiO2 pigment are produced (Filippou and Hudon, Reference Filippou and Hudon2009). However, the titania slag used for TiO2 pigment production is commonly slightly radioactive with environmental concerns (Haridasan et al., Reference Haridasan, Pillai, Tripathi and Puranik2007; Chadirji-Martinez et al., Reference Chadirji-Martinez, Hudon, Chernikov, Heredia, Feng, Crawford and Pan2024).
The radioactivity of titania slag is related to the presence of heavy minerals such as monazite in ilmenite concentrates, typically recovered by dredge mining from placer deposits (Dumouchel et al., Reference Dumouchel, Giroux, Mead, Yule, Akser and Elder2005; Williams and Steenkamp, Reference Williams and Steenkamp2006; Chadirji-Martinez et al., Reference Chadirji-Martinez, Hudon, Chernikov, Heredia, Feng, Crawford and Pan2024). For example, monazite with an average ThO2 content of 8 wt.% has been documented in ilmenite concentrates from a placer deposit processed off the coast of Chavara, India (Haridasan et al., Reference Haridasan, Pillai, Tripathi and Puranik2007). Similarly, placer ilmenite ores from the Mandena Deposit, Madagascar, contain 2 wt.% monazite (Dumouchel et al., Reference Dumouchel, Giroux, Mead, Yule, Akser and Elder2005). The resulting ilmenite concentrate (known as the QIT Madagascar Mineral or QMM sand) contains 0.075 modal% monazite-(Ce) (Chadirji-Martinez et al., Reference Chadirji-Martinez, Hudon, Chernikov, Heredia, Feng, Crawford and Pan2024, Table 1). The QMM ilmenite concentrate contains an average of 133 ppm Th and 12.8 ppm U. Monazite-(Ce) containing 11.42 wt.% Th accounts for ∼45% of the total Th content in the QMM, whereas the remaining 55% is hosted by colloidal thorianite on the surface of altered ilmenite (Chadirji-Martinez et al., Reference Chadirji-Martinez, Hudon, Chernikov, Heredia, Feng, Crawford and Pan2024).
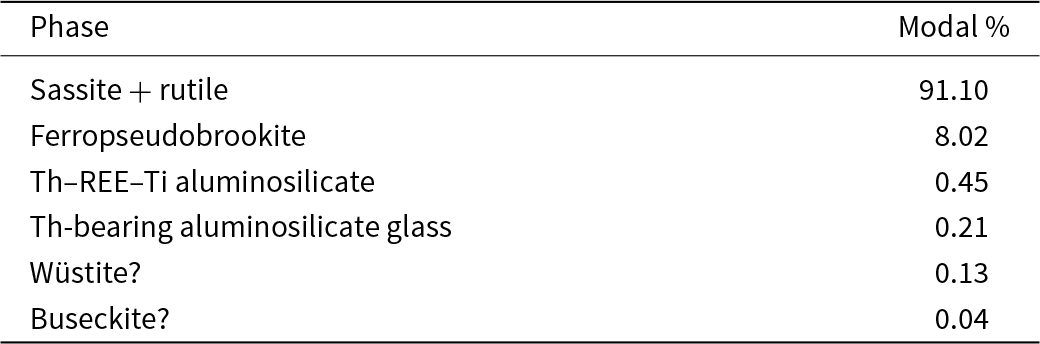
Major and minor phases in the RTCS from QEMSCAN
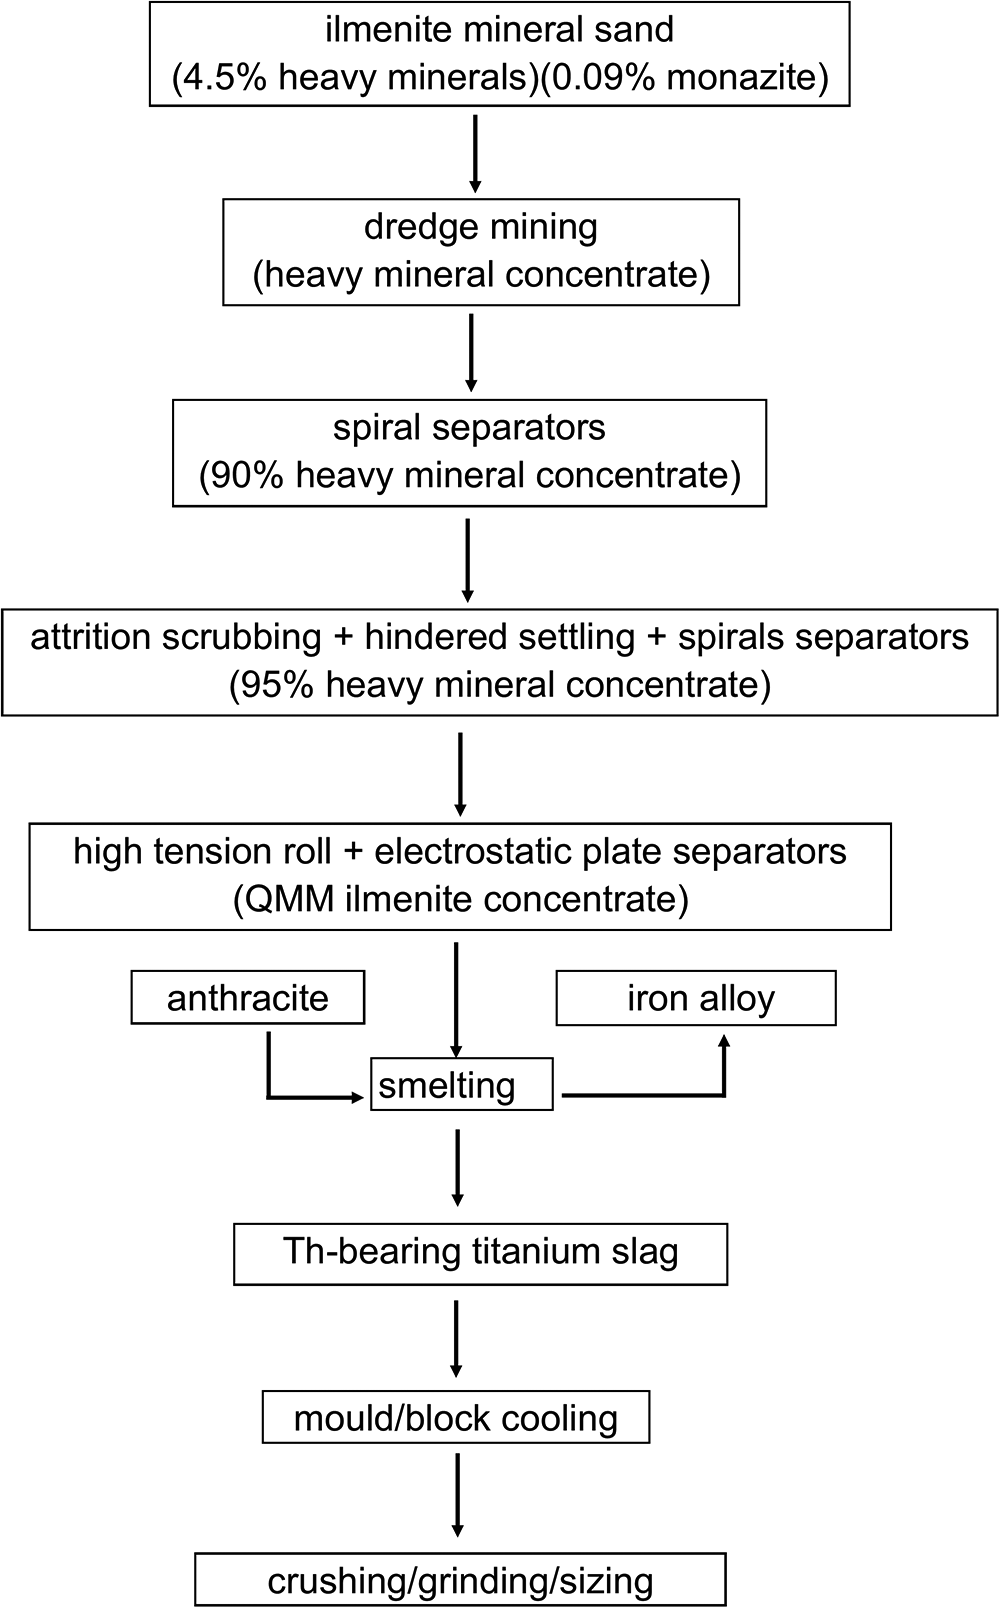
Titania slag containing greater than 80 wt.% TiO2 and sometimes >90 wt.% TiO2 is produced from smelting of ilmenite concentrates with the removal of iron alloy (Murphy and Frick, Reference Murphy and Frick2006; Williams and Steenkamp, Reference Williams and Steenkamp2006; Guéguin and Cardarelli,Reference Guéguin and Cardarelli2007). For example, the Rio Tinto chloride slag (RTCS) from the Rio Tinto Fer et Titane (RTFT) operation in Quebec, Canada, is produced from the smelting of the QMM ilmenite concentrates from the Mandena placer deposit to a grade of at least 90 wt.% TiO2. During the smelting process, the QMM ilmenite concentrates are first reduced in alternating current (AC) electric arc furnaces at 1923 to 1973 K using anthracite as a reductant to produce 80–85% TiO2 slag and iron alloy (Fig. 1) (Murphy and Frick, Reference Murphy and Frick2006; Williams and Steenkamp, Reference Williams and Steenkamp2006; Guéguin and Cardarelli, Reference Guéguin and Cardarelli2007; Filippou and Hudon, Reference Filippou and Hudon2009). The AC electric arc furnace consist of steel walls that are water cooled to form a cold slag layer on the periphery of the furnace to prevent the slag from melting the furnace (Murphy and Frick, Reference Murphy and Frick2006). The titania slag and iron alloy are tapped through holes into mould carts and ladles, respectively, for cooling (Williams and Steenkamp, Reference Williams and Steenkamp2006). The titania slag is quenched over two steps. The mould carts dump the hot titania slag onto an outdoor slag yard and are left to cool for days. This is known as primary cooling. The slag is then hosed with water for secondary cooling. The blocks of titania slag are then crushed, ground, dried and sized. To obtain high-purity TiO2, the titania slag feedstock is digested using either hydrochloric or sulfuric acids in what are known as the chloride and sulfate routes, respectively (McNulty, Reference McNulty2008).
Generalised flow diagram for the smelting process of the ilmenite concentrates from the Mandena deposit (Dumouchel et al., Reference Dumouchel, Giroux, Mead, Yule, Akser and Elder2005; Filippou and Hudon, Reference Filippou and Hudon2009; Murphy and Frick, Reference Murphy and Frick2006).
Previous studies established that the titania slag produced from QMM ilmenite concentrates is mostly composed of an ideal mixture of the solid-solution series FeTi2O5–Ti3O5, in which the Ti3+ end-member (Ti3+2Ti4+O5) is sassite and the Fe2+ end-member (Fe2+Ti4+2O5) is ferropseudobrookite, in addition to rutile and minor other phases (Pistorius and Coetzee, Reference Pistorius and Coetzee2003; Guéguin and Cardarelli, Reference Guéguin and Cardarelli2007; Pistorius and Kotzé, Reference Pistorius and Kotzé2009). Haridasan et al. (Reference Haridasan, Pillai, Tripathi and Puranik2007) showed that ilmenite concentrates from placer deposits and their corresponding slag are radioactive due to the presence of thorium and uranium. However, no further study has elucidated the chemistry of thorium-bearing species in the titania slag. The only notable study on thorium in the titania slag was the discovery of an acicular thorium-rich silicate phase from two South African smelter plants by Nell (Reference Nell2008).
On the other hand, several patents have been published on thorium extraction from titania slags (Aral et al., Reference Aral, Bruckard, Freeman, Grey, Houchin, McDonald, Sparrow, Hart and Harris1998; Hollitt et al., Reference Hollitt, McCelland and Tuffley2003). Existing titania slags such as RTCS contain low levels of radioactivity due to a combination of trace amounts of thorium and uranium left in ilmenite concentrates and a strong partitioning of these radionuclides into the titania slag during the smelting process. However, optimisation of the existing methods for thorium extraction from titania slags is hampered by the knowledge gap about the distribution and speciation of thorium in the titania slags. Accordingly, this study seeks to bridge this knowledge gap by conducting a comprehensive investigation on the distribution and speciation of thorium in the RTCS, using a large variety of analytical techniques from powder X-ray diffraction (PXRD) analysis to laser ablation inductively coupled plasma mass spectrometry (LA-ICP-MS), electron microprobe analysis (EMPA), quantitative evaluation of materials by scanning electron microscopy (QEMSCAN), Raman spectroscopy, microbeam synchrotron X-ray fluorescence (µsXRF) mapping, synchrotron Laue X-ray diffraction (LXRD), and synchrotron X-ray absorption spectroscopy (XAS). These data are used to identify the major carrier of thorium and its distribution in the RTCS, which are then discussed in terms of their applications for mitigating the radionuclides in the titania slag on the one hand and potentially recovering thorium for future nuclear power generation on the other hand (Schaffer Reference Schaffer2013; Humphrey and Khandaker, Reference Humphrey and Khandaker2018; Jyothi et al., Reference Jyothi, Gadelha Tumajan Costa de Melo, Santos and Yoon2023).
Materials and analytical methods
Sample preparation and characterisation
One kilogram of RTCS powder and a block of the original RTCS were supplied by RTFT for this study. Grains from the powder sample were mounted and polished in epoxy pucks, and a polished thin section was made from the RTCS block. The powder sample was further pulverised for PXRD analyses on a Rigaku Ultima IV diffractometer at the Saskatchewan Structural Sciences Centre (SSSC), Canada, using a CuKα source (λ = 1.5406) operated at 40 kV and 44 mA. The PXRD patterns were collected at room temperature in the 2θ range of 10°–90° with a uniform 2θ step of 0.02° and a dwell time of 0.06 s.
A sample of the RTCS powder was dissolved in dilute nitric acid after lithium metaborate fusion and analysed for major and trace elements on a Perkin-Elmer SCIEX Elan DRC II ICP-MS system at the Saskatchewan Research Council (SRC). Syenite SY3 was used as a standard (Abbey, Reference Abbey1979).
Raman spectra of selected grains in both polished epoxy pucks and the polished thin section were collected on a Renishaw Invia Reflex Microscope, which uses a Leica DC2500M optical microscope and a Modulaser StellarPro-50 514 nm Ar+ Laser at SSSC. The laser with a power of 1.17 mW was focused with a 100× objective to a spot size of 1 µm in diameter.
The abundances of major and minor phases in RTCS were also calculated using QEMSCAN mapping. The QEMSCAN method is based on energy-dispersive X-ray (EDX) spectra that were collected over 5 µm steps from 14,091 grains for a total of 535,135 spot analyses on a FEI Quanta 650 scanning-electron microscope (SEM) at SRC, operated at an accelerating voltage of 25 kV and a beam current of 10 nA. This SEM system was equipped with a 10 nm resolution field emission gun and dual Bruker XFlash 5030 EDX spectrometers.
A JEOL 8600 Superprobe at the Department of Geological Sciences, University of Saskatchewan, Canada, was used to collect back-scattered electron (BSE) images and EDX spectra, operated at an accelerating voltage of 15 kV and a beam current of 50 nA. Quantitative compositional analyses of the main Ti–Fe oxides in the RTCS were made by using wavelength dispersive X-ray (WDX) spectra on a Cameca SX-100 electron microprobe at the Department of Geological Sciences, University of Manitoba, Canada. An accelerating voltage of 15 kV and a beam current of 20 nA was used. Mean atomic number, absorption and fluorescence (ZAF) corrections were applied using the PAP model (Pouchou and Pichoir, Reference Pouchou and Pichoir1984) and the ɸ(ρZ) function from Merlet (Reference Merlet, Boekestein and Pavićević1992, Reference Merlet1994). A count time of 20 s was used for all peaks except for the SiKα peak, in which a 30 s count time was used. The following standards and analytical crystals were used for EMPA: manganese fluoride (FKα, TAP); olivine (MgKα, TAP); andalusite (AlKα, TAP); apatite (PKα, LPET); orthoclase (KKα, LPET); titanite (CaKα, PET); ilmenite (TiKα, PET); manganese fluoride (MnKα, LLIF); and ilmenite (FeKα, LLIF).
The thorium-rich phases in the RTCS, identified by BSE imaging and QEMSCAN mapping, were analysed by the WDX method on a JEOL 8230 SuperProbe, at the University of Ottawa-Canadian Museum of Nature MicroAnalysis Laboratory. The analytical conditions included an accelerating voltage of 20 kV and a beam current of 40 nA. A count time of 10 s was used for all elements. These standards and analytical crystals were used for EMPA: NaInSi2O6 (NaKα, TAP); diopside (MgKα, TAP); sanidine (AlKα, TAP); sanidine (SiKα, TAP); sanidine (KKα, PETJ); diopside (CaKα, PETJ); rutile (TiKα, PETJ); manganocolumbite (MnKα, LIFL); hematite (FeKα, LIFL); yttrium iron garnet (YLα, TAP); zircon (ZrLα, TAP); manganocolumbite (NbLα, PETJ); sanbornite (BaLα, PETJ); lanthanum phosphate (LaLα, LIFL); cerium phosphate (CeLα, LIFL); praseodymium phosphate (PrLα, LIFL); neodymium phosphate (NdLα, LIFL); hafnon (HfMα, TAP); NiTa2O6 (TaMα, TAP); crocoite (PbMα, PETJ); thorium oxide (ThMα, PETJ); and uranium oxide (UMα, PETJ).
The same main Ti–Fe oxides in the RTCS epoxy puck used for EMPA were also analysed by LA-ICP-MS, using a Thermo Finnigan Element 2 High Resolution system at the Department of Geological Sciences, University of Manitoba, Canada. Titanium concentrations from the EMPA were used as the internal standards for LA-ICP-MS calibration, while USGS BCR2G was used as an external calibration standard. The laser used had a frequency of 5 Hz, a spot size of 30 µm and a fluence of 5 J/cm2, using a counting time of ∼1 s per element analysed. The Iolite software was used to process all LA-ICP-MS data (Paton et al., Reference Paton, Hellstrom, Paul, Woodhead and Hergt2011).
Microbeam synchrotron X-ray fluorescence mapping and in situ Laue-X-ray diffraction
All µsXRF and LXRD data were collected at the Very Sensitive Elemental and Structural Probe Employing Radiation from a Synchrotron (VESPERS) beamline at the Canadian Light Source (CLS). The X-ray beam used for µsXRF mapping has a spot size of ∼3 µm in diameter, so maps were collected using 3 µm steps with 1 s dwell times. The RTCS puck was angled at 45° to the incident X-ray beam. The µsXRF maps were collected on a single-element Vortex silicon drift detector positioned perpendicular to the X-ray beam. In situ LXRD patterns were collected using a Pilatus 1M pixel area detector angled at 89° to the X-ray beam and positioned 228 mm from the sample. The M-blank software (Crawford et al., Reference Crawford, Deb and Penner-Hahn2019) was used for background correction of µsXRF maps and the XMAS software (Tamura, Reference Tamura2014) was used to index LXRD patterns. Note that the M-blank software uses branching ratios of all emission lines associated to all absorption edges with the same initial energy level. For this reason, µsXRF maps are reported as a group of X-ray absorption edges, e.g. ThL fluorescence is discussed rather than ThLα1 fluorescence (Crawford et al., Reference Crawford, Deb and Penner-Hahn2019; Chadirji-Martinez et al., Reference Chadirji-Martinez, Grosvenor, Crawford, Chernikov, Heredia, Feng and Pan2022).
An artificial colour QEMSCAN map of RTCS grains in a polished epoxy puck. Grains have a size fraction of –1000/0. The red circle, top-left marks an ∼0.09 mm patch of the Th–REE–Ti aluminosilicate.
Synchrotron X-ray absorption spectroscopy
Synchrotron X-ray absorption spectra of the ThLIII edge (16,300 eV) from a finely ground RTCS powder were collected at the Biological Spectroscopy X-ray Absorption Spectroscopy (BioXAS) beamline, CLS. The RTCS powder was pressed and sealed into plastic and aluminium sample holders with Kapton tape. This beamline uses a 1.9 T wriggler source with two rhodium-coated X-ray mirrors and a silicon (220) cut double monochromator. Energy calibration was conducted downstream from the sample using the SrK edge from lanthanum strontium cobaltite (16,117 eV). X-ray absorption spectra were collected at room temperature for the RTCS sample and model compounds (Chadirji-Martinez et al., Reference Chadirji-Martinez, Hudon, Chernikov, Heredia, Feng, Crawford and Pan2024) using the fluorescence and transmission modes, respectively. Fluorescence X-rays were measured using the 32-element germanium Canberra detector positioned at 90° to the beam. Three energy scans were collected for the RTCS sample for signal averaging. The following energy regions and their corresponding edge steps were chosen: 16,090–16,150 eV, 0.5 eV; 16,150–16,270 eV, 10 eV; 16,270–16,340 eV, 0.5 eV; and 16,340 to 15 Å–1, 0.05 Å–1. Dwell times of 1 s were used for each step in all these energy regions. Model compounds were diluted using reagent-grade boron nitride to optimise their edge steps.
All XAS data were processed using the Demeter software suite (Ravel and Newville, Reference Ravel and Newville2005). Afterwards EXAFS data were fitted to cubic spline functions and replotted in terms of the photoelectron wave vector (k). The upper bound of k used for the Fourier transform was chosen based on the signal-to-noise ratio seen in k 3 weighted EXAFS plots. The Fourier-transform functions from EXAFS spectra fit theoretical muffin-tin potential models generated using structural data published on relevant phases using FEFF6 (Mustre de Leon et al., Reference Mustre de Leon, Rehr, Zabinsky and Albers1991; Rehr et al., Reference Rehr, Albers and Zabinsky1992). Any peaks present in the Fourier transform functions below 2.3 Å were assumed to be artifacts: i.e. the shortest distance for Th–O bonds (Östhols et al., Reference Östhols, Manceau, Farges and Charlet1997), and were removed using the AUTOBK algorithm in the Demeter suite (Ravel and Newville, Reference Ravel and Newville2005). A Hanning window was used for all EXAFS curve fits.
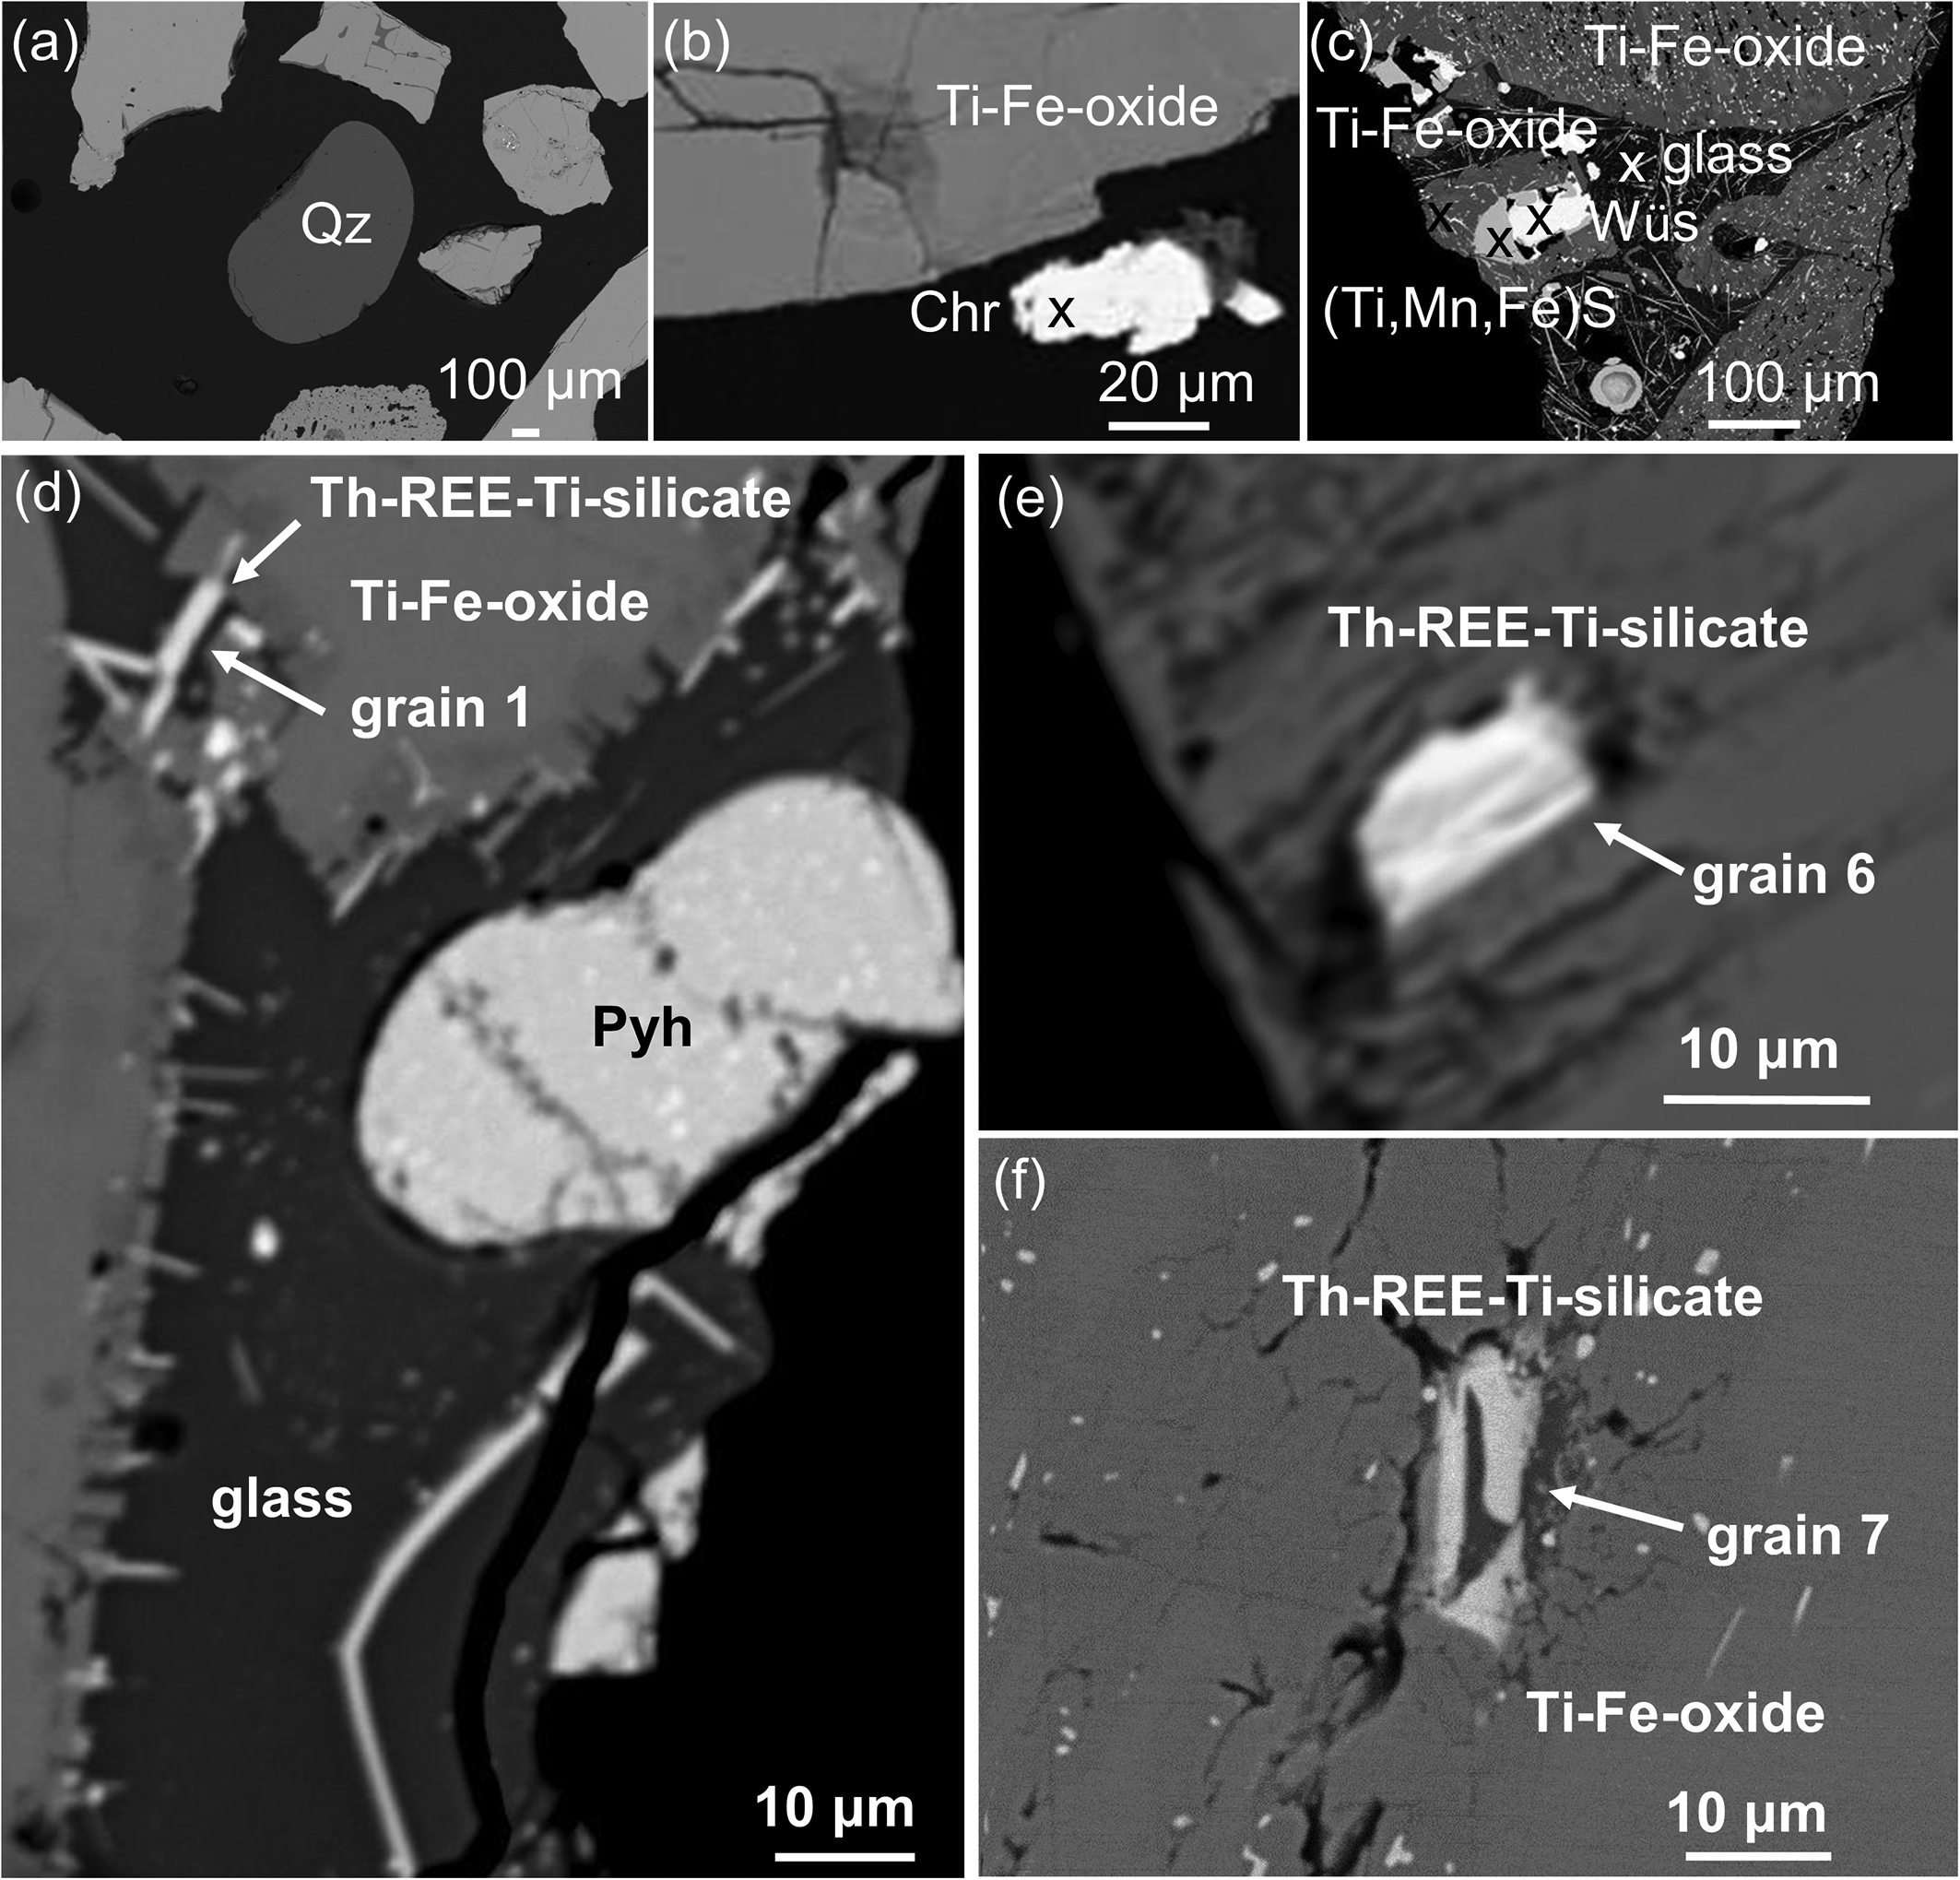
Back-scattered electron (BSE) images showing the occurrences of minor phases in the RTCS: (a) a rounded quartz (Qz) grain surrounded by main Ti–Fe oxides; (b) a white chromite (Chr) grain close to a ferropseudobrookite grain; (c) grey porous ferropseudobrookite grain containing quenched aluminosilicate glass with wüstite forming a core with buseckite and Ti–Fe-oxide rims; (d) acicular Th–REE–Ti aluminosilicate (Th–REE–Ti-silicate) grain 1 from Table S5; and tabular Th–REE–Ti aluminosilicate grains (e) 6 and (f) 7 along the fractures of Ti–Fe oxides.
Variables were kept to a minimum for EXAFS curve fittings by fixing the amplitude reduction factor, S 02, to 0.977, which was determined by fitting the first shell of the thorianite model compound (Chadirji-Martinez et al., Reference Chadirji-Martinez, Hudon, Chernikov, Heredia, Feng, Crawford and Pan2024); fixing degeneracy, N, one uniform energy shift value, E0, was used for all paths in a fit, all single scattering paths in the same shell with the same atomic number were assigned the same Debye-Waller factors, σ2, and the interatomic distances, R, of all single scattering paths that were within the same distance from the back-scattering atom in terms of their spatial resolution (equation 1) were grouped.
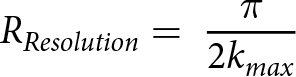 \begin{equation}{R_{Resolution}} = {\text{ }}\frac{{{\pi }}}{{2{k_{max}}}}\end{equation}
Results
Phase characterisation by PXRD, BSE/EDX, QEMSCAN and Raman
The PXRD pattern (Supplementary Fig. S1) supports previous studies that the RTCS is composed of dominantly the sassite–ferropseudobrookite solid-solution series, with minor amounts of rutile (Pistorius and Coetzee, Reference Pistorius and Coetzee2003; Guéguin and Cardarelli, Reference Guéguin and Cardarelli2007; Pistorius and Kotzé, Reference Pistorius and Kotzé2009). Similarly, QEMSCAN further supports that the main Ti–Fe oxides in the RTCS are sassite and ferropseudobrookite (Fig. 2; Table 1). However, the smelting process for the production of the RTCS (Fig.1) uses anthracite as a reductant, resulting in anomalous oxidation states of transition metals such as Ti3+ under highly reduced conditions. This makes the QEMSCAN technique with mineral standards not completely satisfactory for the identification and quantification of phases in the RTCS. For example, sassite and rutile could not be differentiated by QEMSCAN and are grouped together (Fig. 2; Table 1). On the other hand, ferropseudobrookite is readily distinguished from sassite by QEMSCAN based on its elevated Fe contents in the EDX spectra (Fig. 2).
Raman spectra of (a) the main Ti–Fe oxides in the RTCS (black), in comparison with that of pseudobrookite (red, b) from Dave Bunk Minerals (2023); (c) the Th–REE–Ti aluminosilicate (black), in comparison with that of dingdaohengite-(Ce) (red, d) from Botha (Reference Botha2023).
Minor phases in the RTCS, first detected by conventional BSE imaging and EDX spectra, have been quantified by QEMSCAN, in order of decreasing modal percentage, including Th–REE–Ti aluminosilicate, Th-bearing aluminosilicate glass, iron oxide (wüstite?), and an unknown Ti,Fe,Mn sulfide (buseckite?) (Table 1; Fig. 2). Interestingly, one single grain of quartz observed during conventional BSE imaging and EDX analysis (Fig. 3a) was not detected by QEMSCAN, probably due to its exceedingly low abundance. Similarly, Ni-bearing chromite identified as a trace phase by BSE imaging and EDX spectra (Fig. 3b) was not quantified by QEMSCAN (Table 1). The Ti–Fe–Mn sulfide forms a rim around the core of iron oxide and is often surrounded by a Ti–Fe oxide, which in turn is surrounded by Th-bearing aluminosilicate glass (Fig. 3c).
It is in this Th-bearing aluminosilicate glass that acicular crystals of Th–REE–Ti aluminosilicate (<0.3×12 µm) commonly occur (Fig. 3c). Most of these trace phases such as Th–REE–Ti aluminosilicate (Fig. S2), Th-bearing aluminosilicate glass, wüstite and buseckite typically occur together as interstitial infillings to the main Ti–Fe oxides (Fig. 3c). In a few cases, the Th–REE–Ti aluminosilicate occur as tabular crystals (up to ∼5×15 µm) along the fractures in the main Ti–Fe oxides (Fig. 3d–f). Similarly, the Th–REE–Ti aluminosilicate in substantial patches up to ∼0.09 mm in length (see discussion below) has been detected by QEMSCAN (Fig. 2). Also, the acicular Th–REE–Ti aluminosilicate crystals between ferropseudobrookite and Th-bearing aluminosilicate glass are commonly oriented perpendicular to the boundaries (Fig. 3d). QEMSCAN also shows that the Th–REE–Ti aluminosilicate and Th-bearing aluminosilicate glass are associated preferentially with ferropseudobrookite and wüstite (Fig. 2).
The Raman spectra of the main Ti–Fe oxides in the RTCS are characterised by the vibrational bands at 190, 345, 445, 640 and 780 cm–1, in comparison with the diagnostic bands at 215, 345 and 665 cm–1 for pseudobrookite (Fig. 4). The Raman spectrum of the Th–REE–Ti aluminosilicate in the RTCS is characterised by the vibrational bands at 286, 435, 541 and 671 cm–1 (Fig. 4), similar to those in dingdaohengite-(Ce) and other chevkinite-group minerals (Botha, Reference Botha2023). Due to the exceedingly small grain sizes (i.e. the narrow dimensions often smaller than the laser beam of ∼1 µm in diameter, the Raman spectrum of the Th–REE–Ti aluminosilicate contains additional vibration bands at 173 and 400 cm–1, attributable to interferences from neighbouring sassite, ferropseudobrookite, or other minor phases (Fig. 3c).
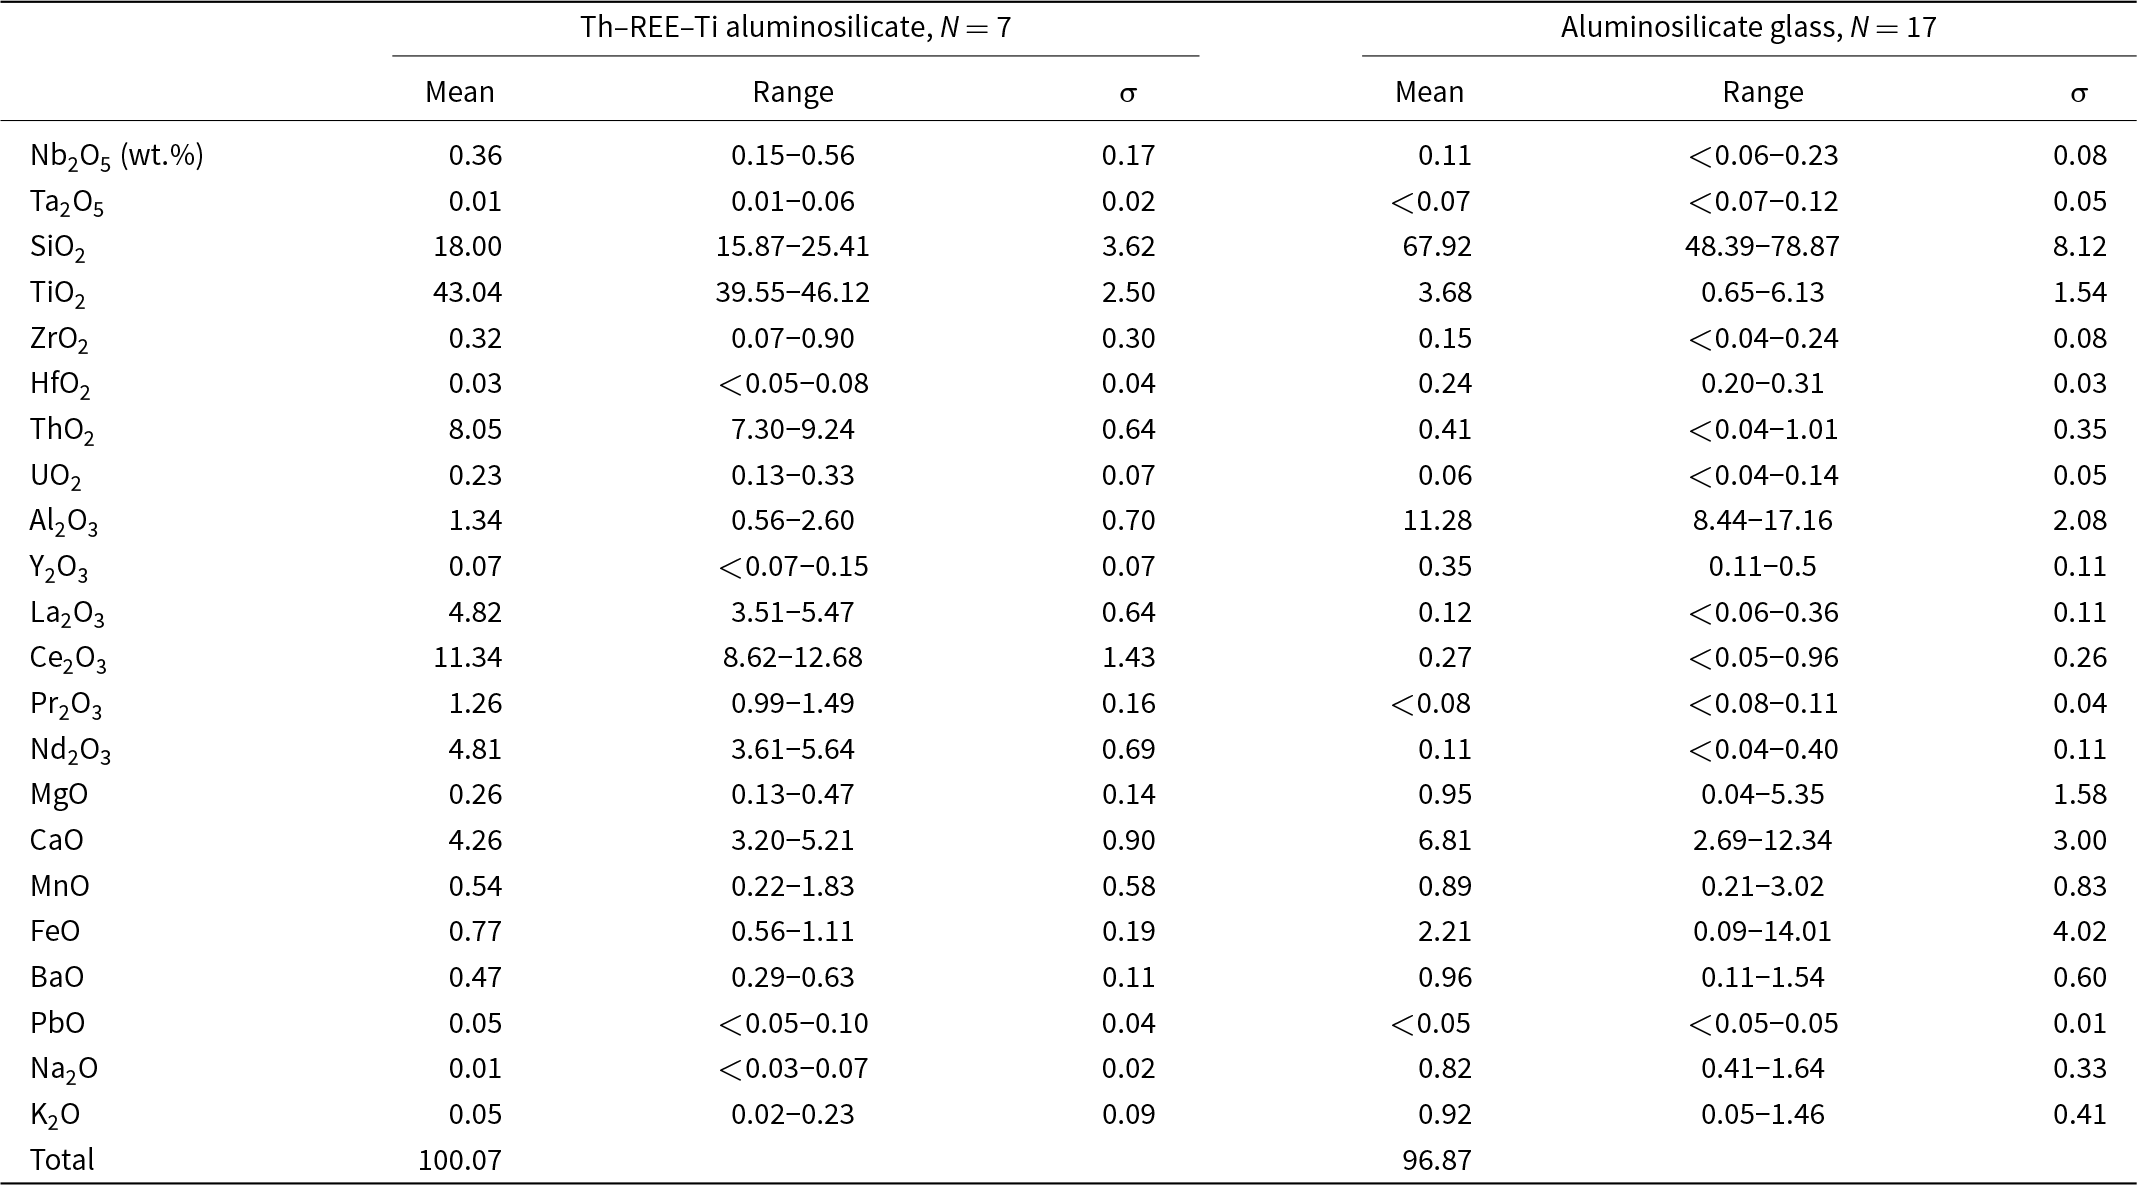
Chemical composition of the RTCS
Bulk ICP-MS analyses show that the RTCS is composed of dominant titanium followed by iron (Table 2). Titration analyses of the RTCS by RTFT (Table 2) indicated that all iron is present as Fe2+, whereas titanium occurs in both the Ti3+ and Ti4+ oxidation states at 72% and 28%, respectively (Table 2). Other minor constituents in the RTCS include 4.8 wt.% SiO2, 2.91 wt.% Al2O3, 1.27 wt.% MgO and 0.49 wt.% MnO (Table 2). Notable trace elements include 1610 ppm V, 526 ppm Cr, 89 ppm Ni, 57.6 ppm Cu, 915 ppm Zr, 1630 ppm Nb, 28.4 ppm Hf, 124 ppm Ta, 11.8 ppm Y and elevated REE contents (e.g. 175 ppm Ce; Table 2). The thorium content of 199 ppm in the RTCS determined by ICP-MS at SRC is slightly higher than the average of 170 ppm Th supplied by RTFT, while the uranium content of 15.4 ppm is similar to the average of 16 ppm (Table 2). The former discrepancy is probably attributable to a slightly heterogeneous distribution of this radionuclide in the RTCS. The range of minor and trace elements present in the RTCS is consistent with the presence of quartz and heavy mineral (monazite, thorianite and zircon) impurities in the QMM ilmenite concentrates (Chadirji-Martinez et al., Reference Chadirji-Martinez, Hudon, Chernikov, Heredia, Feng, Crawford and Pan2024).
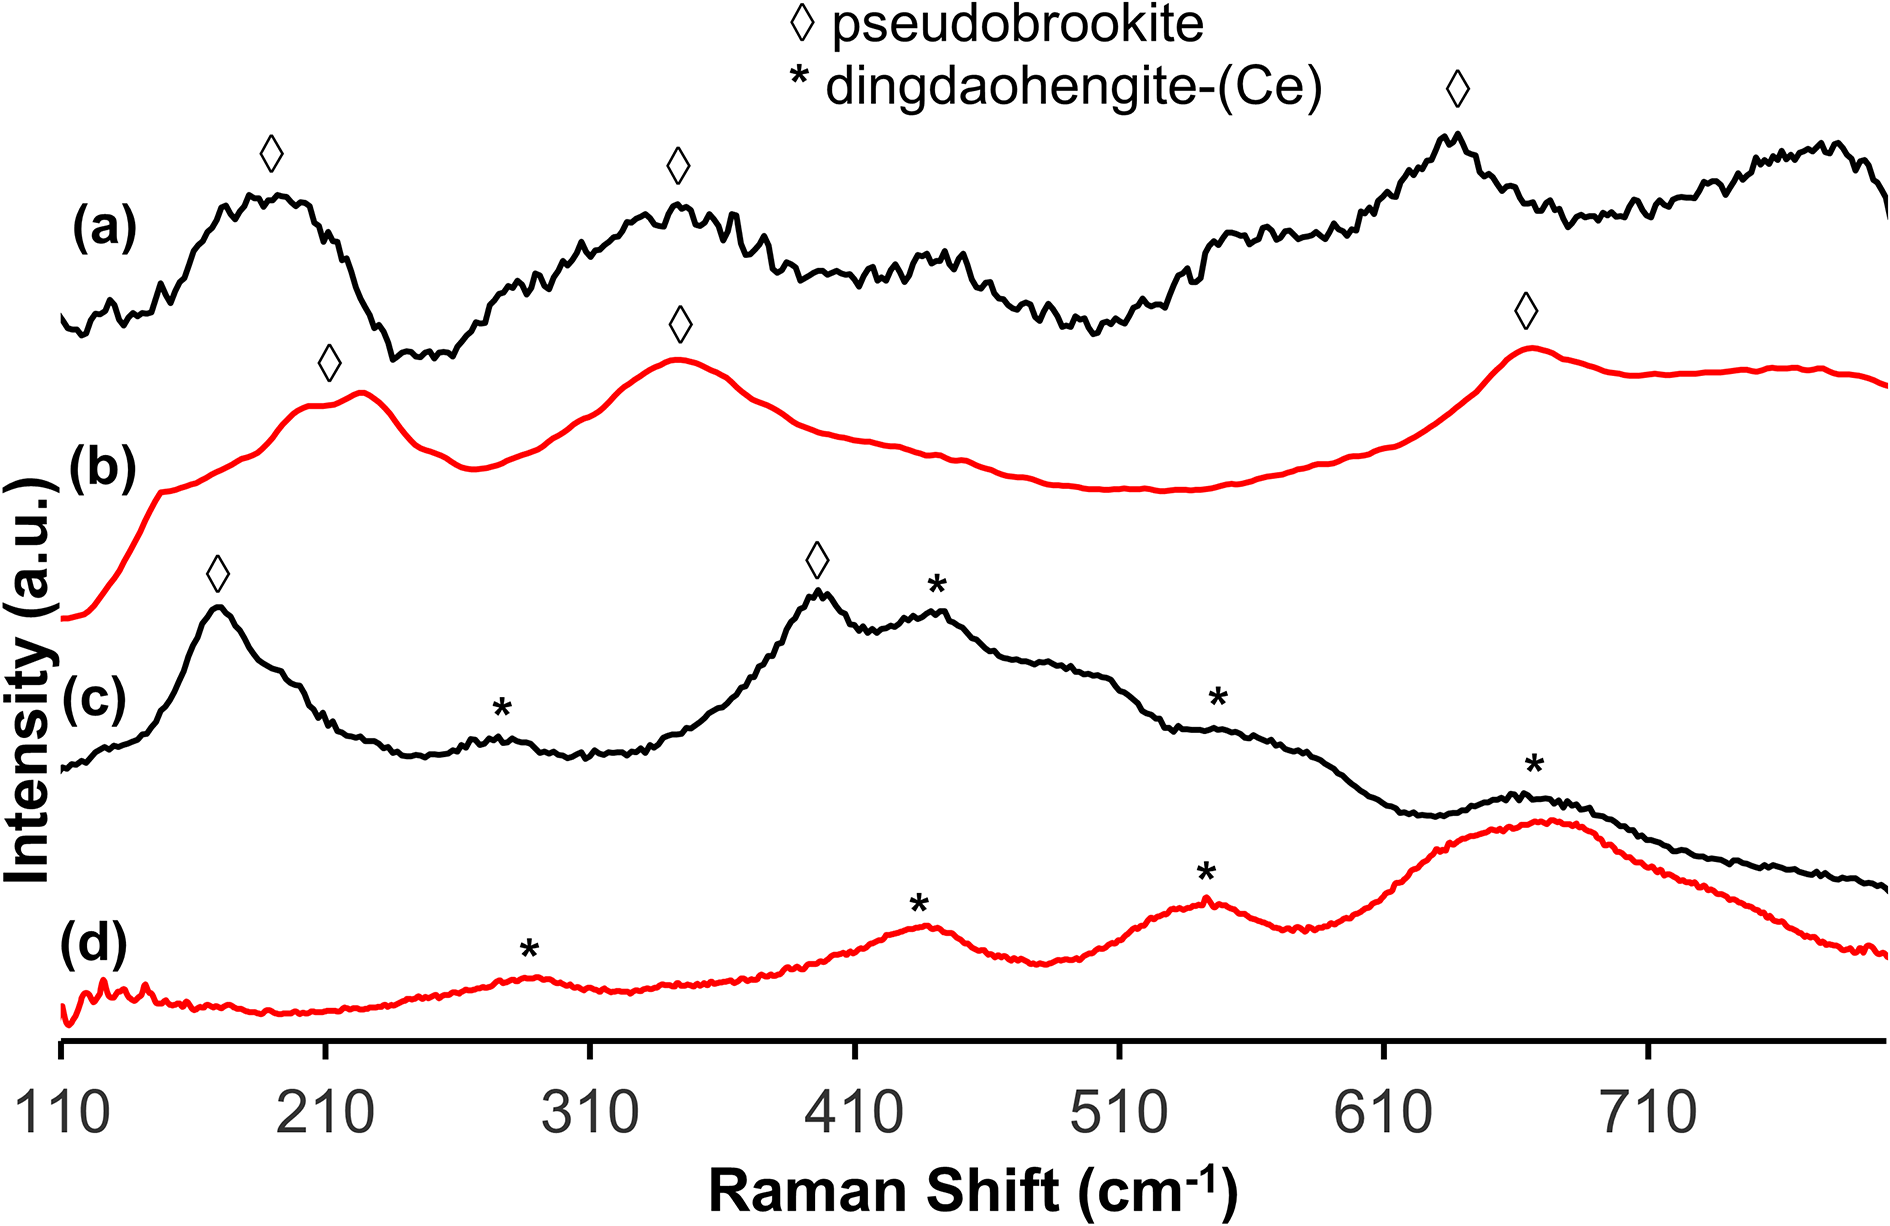
Ternary (Ti4+–Ti3+–Fe2+) plot illustrating the compositions of the main Ti–Fe oxides in the RTCS. in comparison with those of ideal rutile, ferropseudobrookite, and sassite. Titanium oxidation states were calculated by assuming the M3O5 stoichiometry and electrostatic neutrality.
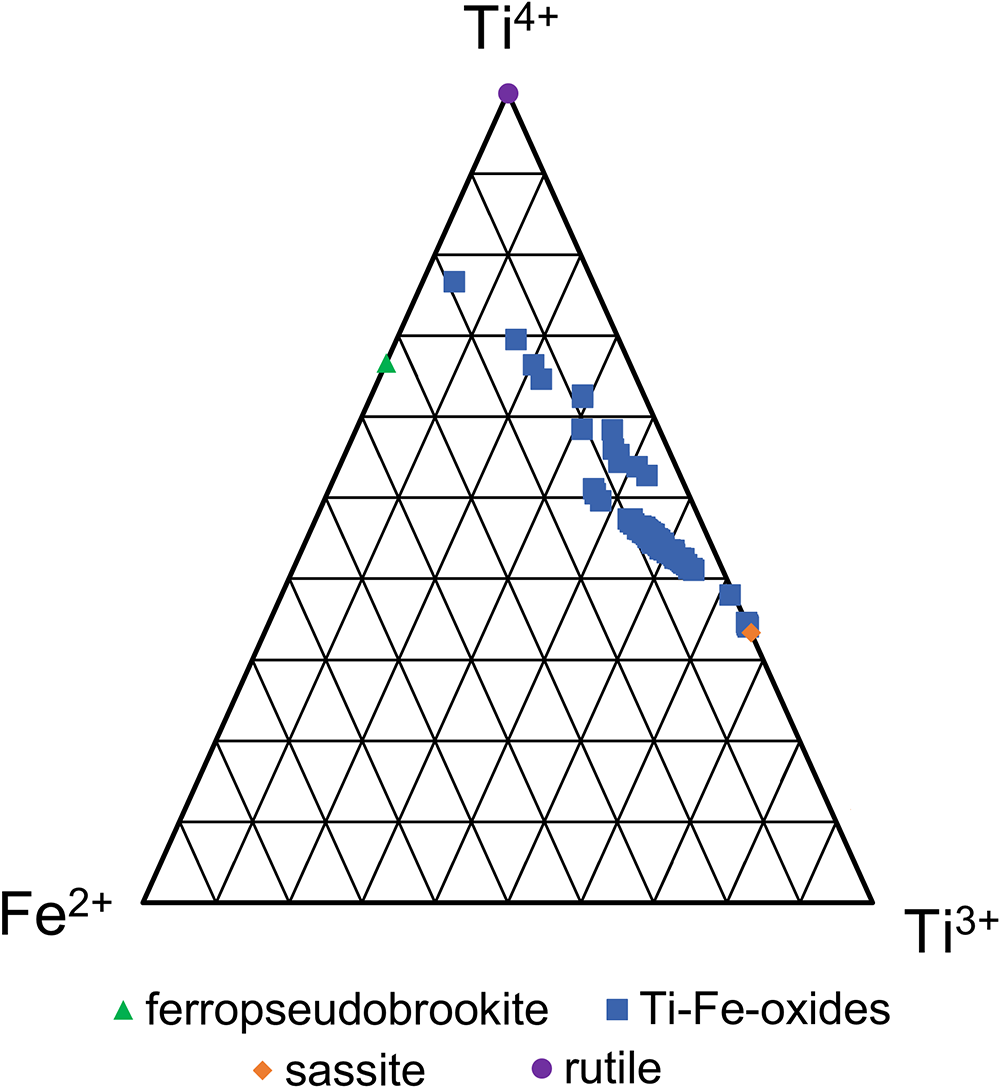
Compositions of the bulk RTCS and main Ti–Fe oxides
* No data on the valence of titanium was collected, as all titanium is presented as in the Ti4+ state even though Ti3+ occurs in sassite–ferropseudobrookite based on bulk RTCS data supplied by Rio Tinto Fer et Titane (RTFT).
SRC – determined by ICP-MS at the Saskatchewan Research Council (SRC); b.d.l below the detection limit. n.a not analysed for.
Compositions of the major and trace phases in the RTCS
The compositions of the main Ti–Fe oxides in the RTCS are summarised in Table 2 and illustrated in Fig. 5. The individual EMPA and LA-ICP-MS analyses of 100 spots measured on the main Ti–Fe oxides are given in Supplementary Data (Supplementary Tables S1–4). The EMPA data of all 100 main Ti–Fe oxides, including four containing anomalously Nb contents from LA-ICP-MS (referred to as ‘outliers’ in Tables 2, S3–S4), have been calculated based on five oxygen atoms and two assumptions: (1) all iron as Fe2+ and (2) titanium as both Ti3+ and Ti4+ to maintain the electrostatic neutrality (Table 2). The calculated Ti3+/Ti4+ values of the Ti–Fe-oxides from 1.93 to 0.06, spanning from the sassite end-member to the ferropseudobrookite end-member (Table 2; Fig. 5).
The LA-ICP-MS analyses show that the main Ti–Fe oxides of the RTCS contain elevated V, Ni, Cr, Cu, Zr, Hf, Nb and Ta contents (Tables 2 and S3). However, the REE, Th and U contents in the main Ti–Fe oxides are usually very low (Table 2). The notable exceptions are 3 of the 4 Nb-rich (up to 22,470 ppm) Ti–Fe analyses, which contain 13.7 to 19.7 ppm Th and are accompanied by elevated Hf, Ta and Zr (up to 134, 1125 and 5430 ppm, respectively). These outliers most probably arise from LA-ICP-MS spots containing Nb-rich inclusions at depth. After removing these outliers the average Th concentration in the main Ti–Fe oxides (N = 96) is 0.32±0.60 ppm (Table 2), which is further reduced to 0.27±0.35 ppm if the single spot analysis of 5.1 ppm Th is also excluded.
The major and minor element compositions of the Th–REE–Ti aluminosilicate (Fig. S2) and Th-bearing aluminosilicate glass in the RTCS are summarised in Table 3, and their individual EMPA are given in Tables S5 and S6. The major element compositions of the Th–REE–Ti aluminosilicate are similar to those of the chevkinite-group minerals, especially dingdaohengite-(Ce) (Table 3). Considering the general formulae of A4BC2D2(Si2O7)2O8 for the chevkinite-group minerals and the ideal formulae of Ce4Fe2+Ti2Ti2(Si2O7)2O8 for dingdaohengite-(Ce), the average EMPA composition of the Th–REE–Ti aluminosilicate in the RTCS has been converted to the following formula based on 22 oxygen atoms:
Compositions of Th–REE–Ti alunminosilicate and Th-bearing aluminosilicate glass
(Ti1.37Ca0.79Ce0.72Th0.36La0.31Nd0.30Pr0.08Ba0.03K0.02Y0.01U0.01)□(Ti1.41Al0.27Fe2+0.11Mn0.08Mg0.07Nb0.03Zr0.03)(Ti1.91□0.09)(Si3.05Ti0.95)O22. Note that the total number of cations of Th–REE–Ti aluminosilicate is consistently under the ideal number of 13 apfu for chevkinite-group minerals (Table 3), suggesting the presence of vacancies in the structure (Fig. S3, Table 4). The vacancies in Th–REE–Ti aluminosilicate can be assigned to either B or D sites, based on the ideal formula of [REE,Ca]4[Fe3+,Ti,Fe2+,□][Fe3+,Fe2+,Nb,Ti]2Ti2Si4O2 and Ce4Mg[Fe3+2W]□[Si2O7]2O6[OH]2 for maoniupingite-(Ce) and delhuyarite-(Ce), respectively (Yang et al., Reference Yang, Fleck, Smith, Tao, Song and Zhang2002; Shen et al., Reference Shen, Yang and Xu2005). In this study, we tentatively assigned the vacancies to the B site in Th–REE–Ti aluminosilicate because its composition (Table 3) is closer to maoniupingite-(Ce) (Holtstam et al., Reference Holtstam, Bindi, Hålenius and Andersson2017) than delhuyarite-(Ce).
Curve-fitting parameters for ThLIII edge EXAFS data of the RTCS*
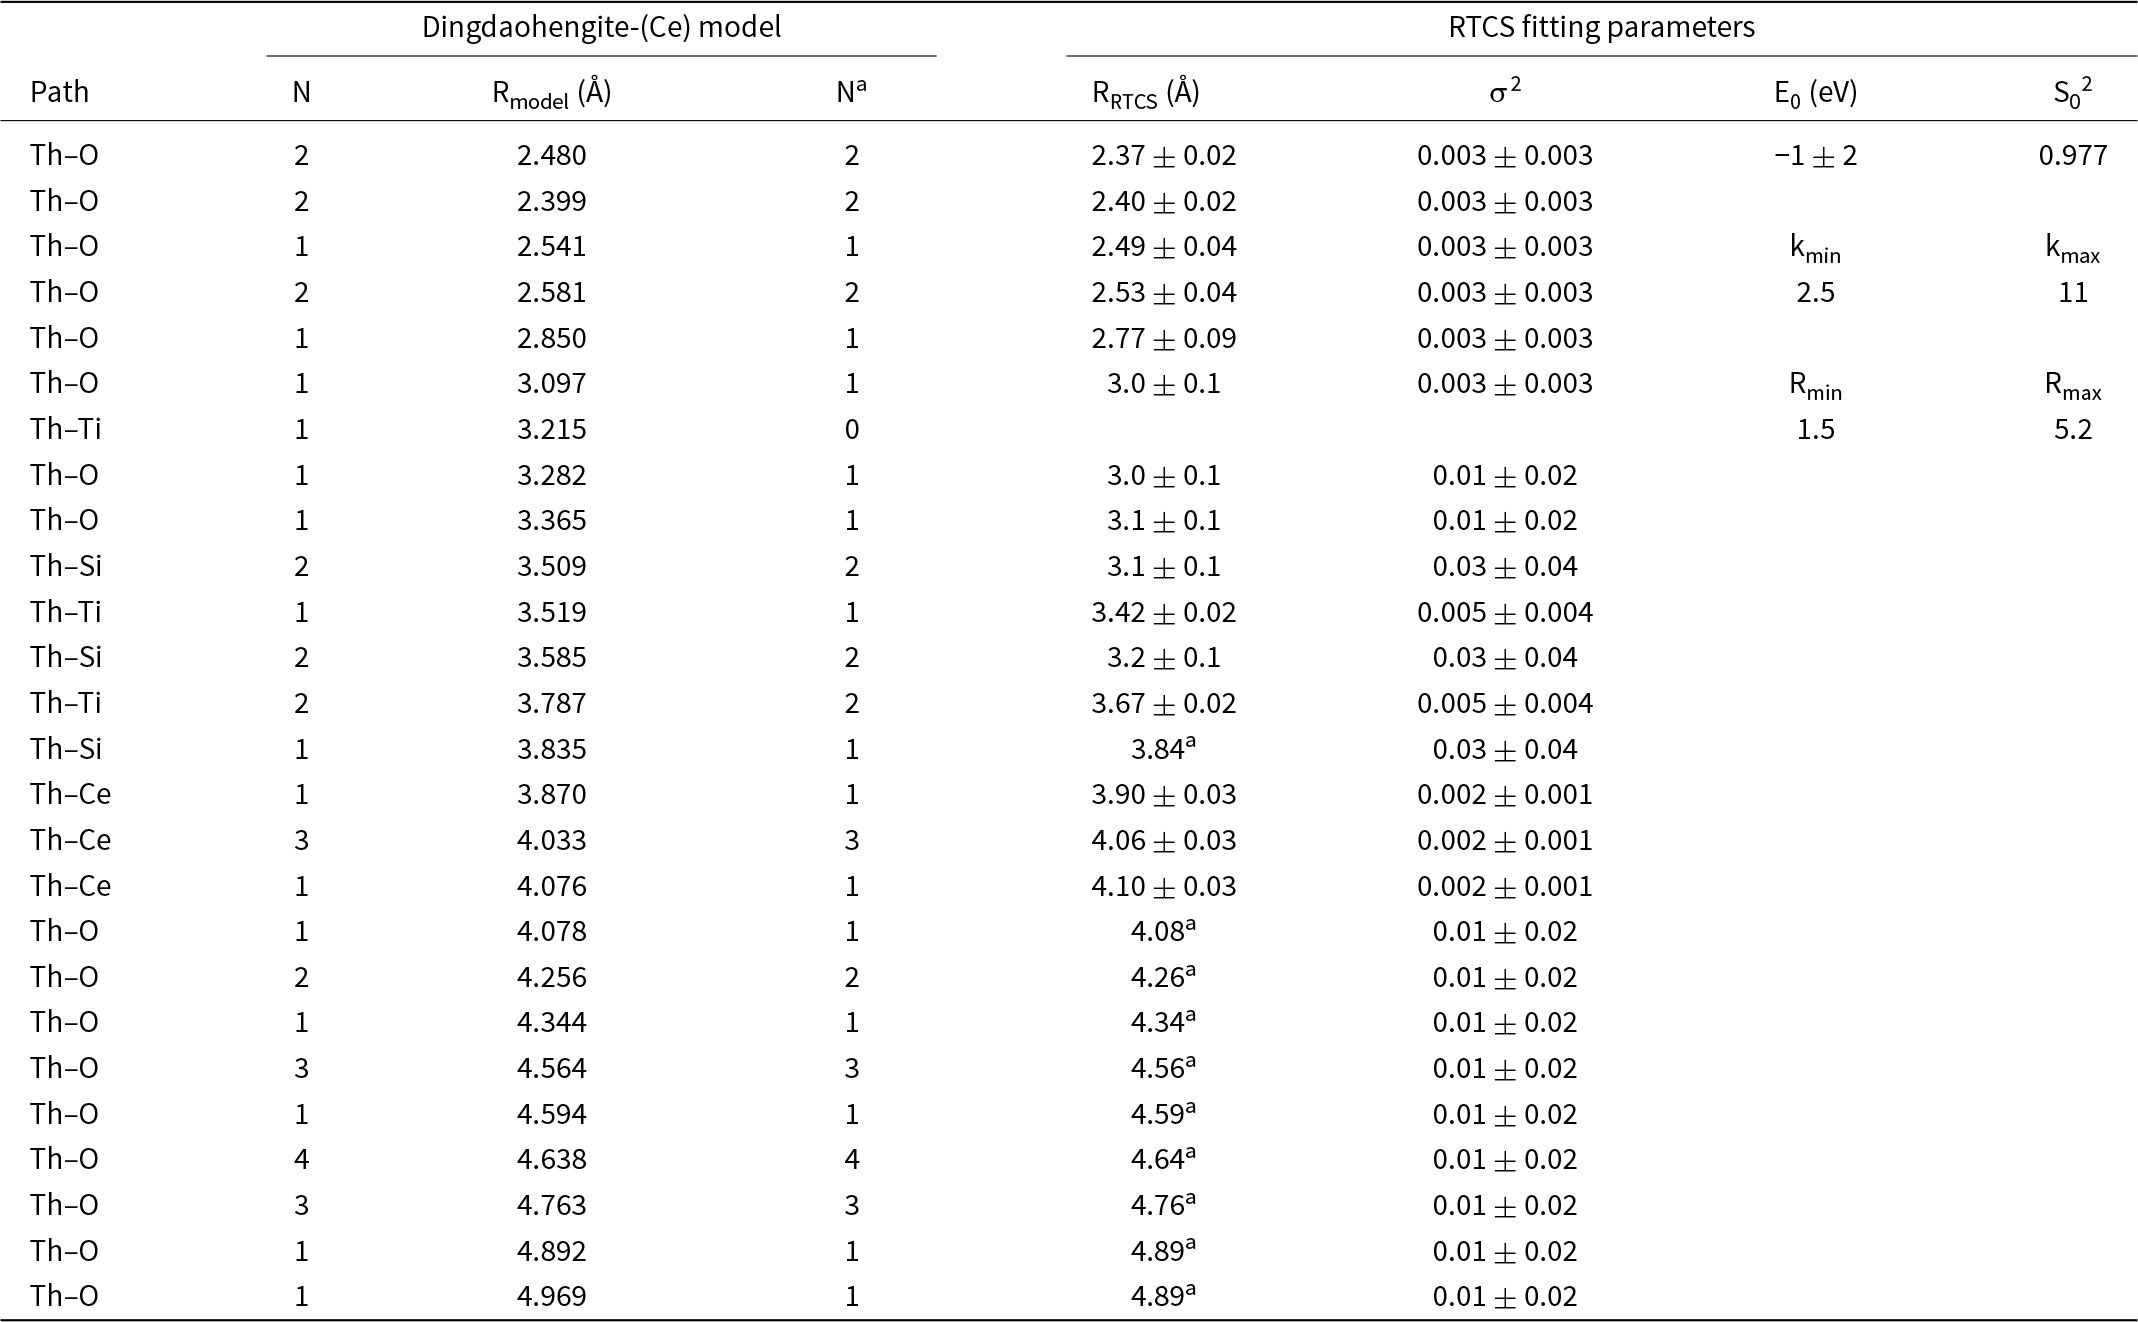
* The Na and Ra values were fixed to those from the dingdaohengite-(Ce) model of Li et al. (Reference Li, Yang, Ma, Shi, Xiong, Sheng and Fan2005).
A combination of the average 8.05 wt.% ThO2 in Th–REE–Ti aluminosilicate from EMPA (Table 3) and its modal abundance of 0.45% from QEMSCAN (Table 1) yields a calculated thorium abundance of 318 ppm, significantly greater than the range of 170–199 ppm Th from bulk chemical analyses of the RTCS (Table 2). This discrepancy is readily attributed to the fact that the narrow dimensions of the acicular Th–REE–Ti aluminosilicate crystals (Fig. 3c,d,e,f) are often much smaller than the pixel dimensions (5 µm) used in the QEMSCAN data collection, which undoubtedly causes the modal percentage of the Th–REE–Ti aluminosilicate to be grossly overestimated (Fig. 2). An alternative approach is to calculate the amounts of thorium hosted in the main Ti–Fe oxides (0.3 ppm or 0.18%) and the Th-bearing aluminosilicate glass (7.56 ppm or 4.45%). Assuming the remaining 162 ppm Th (or 95.4%) is entirely hosted by the Th–REE–Ti aluminosilicate, the maximum modal abundance of the Th–REE–Ti aluminosilicate in the RTCS is then only 0.23%. Also, the Th–REE–Ti aluminosilicate and the Th-bearing aluminosilicate glass are calculated to contain 9.1 ppm and 1.1 ppm U, respectively, and collectively account for ∼64% of the total uranium content in the RTCS.
Thorium distribution and speciation in the RTCS from µsXRF and XAS
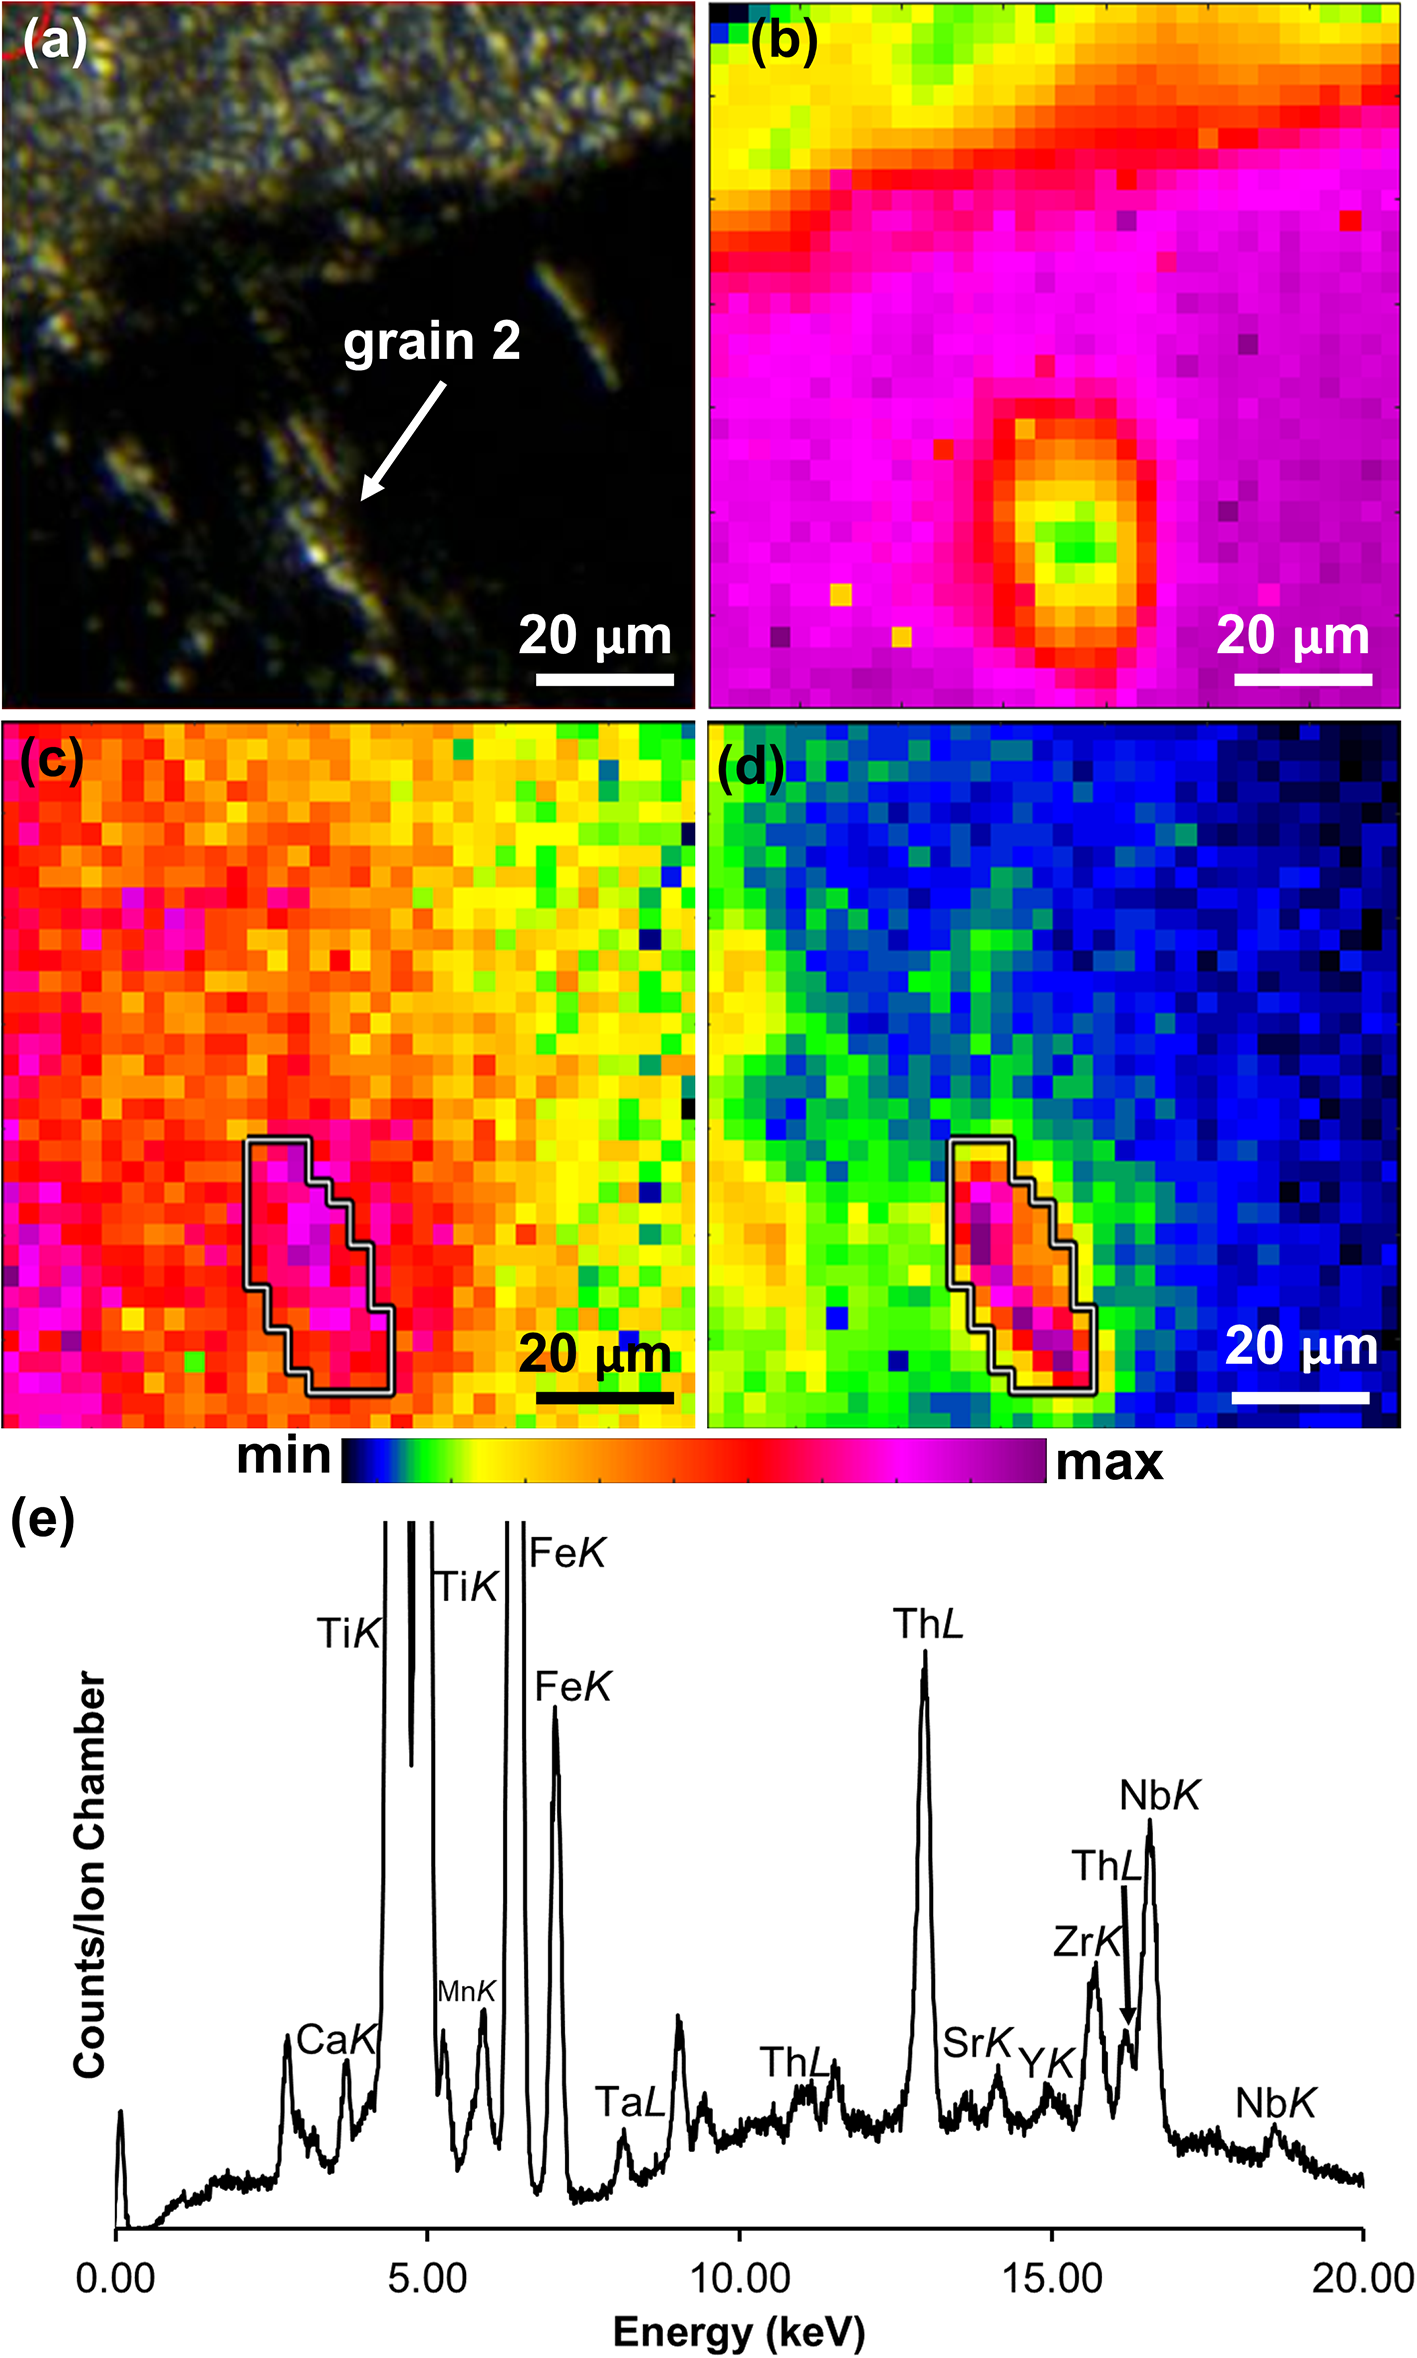
The µsXRF maps of the selected regions containing the Th–REE–Ti aluminosilicate and Th-bearing aluminosilicate glass in the RTCS support the QEMSCAN results (Fig. 2) in that they are preferentially associated with iron-rich phases (Fig. 6). The µsXRF spectra from spots of elevated FeK signals surrounding the Th–REE–Ti aluminosilicate are also consistent with ferropseudobrookite (Fig. 6). Moreover, the µsXRF map of a Th–REE–Ti aluminosilicate crystal in the RTCS shows a positive correlation between SrK and ThL signals (Fig. 7a,b,c,d). In addition, an LXRD pattern (Fig. S4) collected from the main Ti–Fe oxide in the RTCS has been successfully indexed with the crystallographic data of the sassite–ferropseudobrookite solid-solution series. However, repeated attempts of in situ LXRD analyses of the Th–REE–Ti aluminosilicate crystals after detailed µsXRF mapping were not successful because the measured LXRD patterns are invariably dominated by the main Ti–Fe oxides.
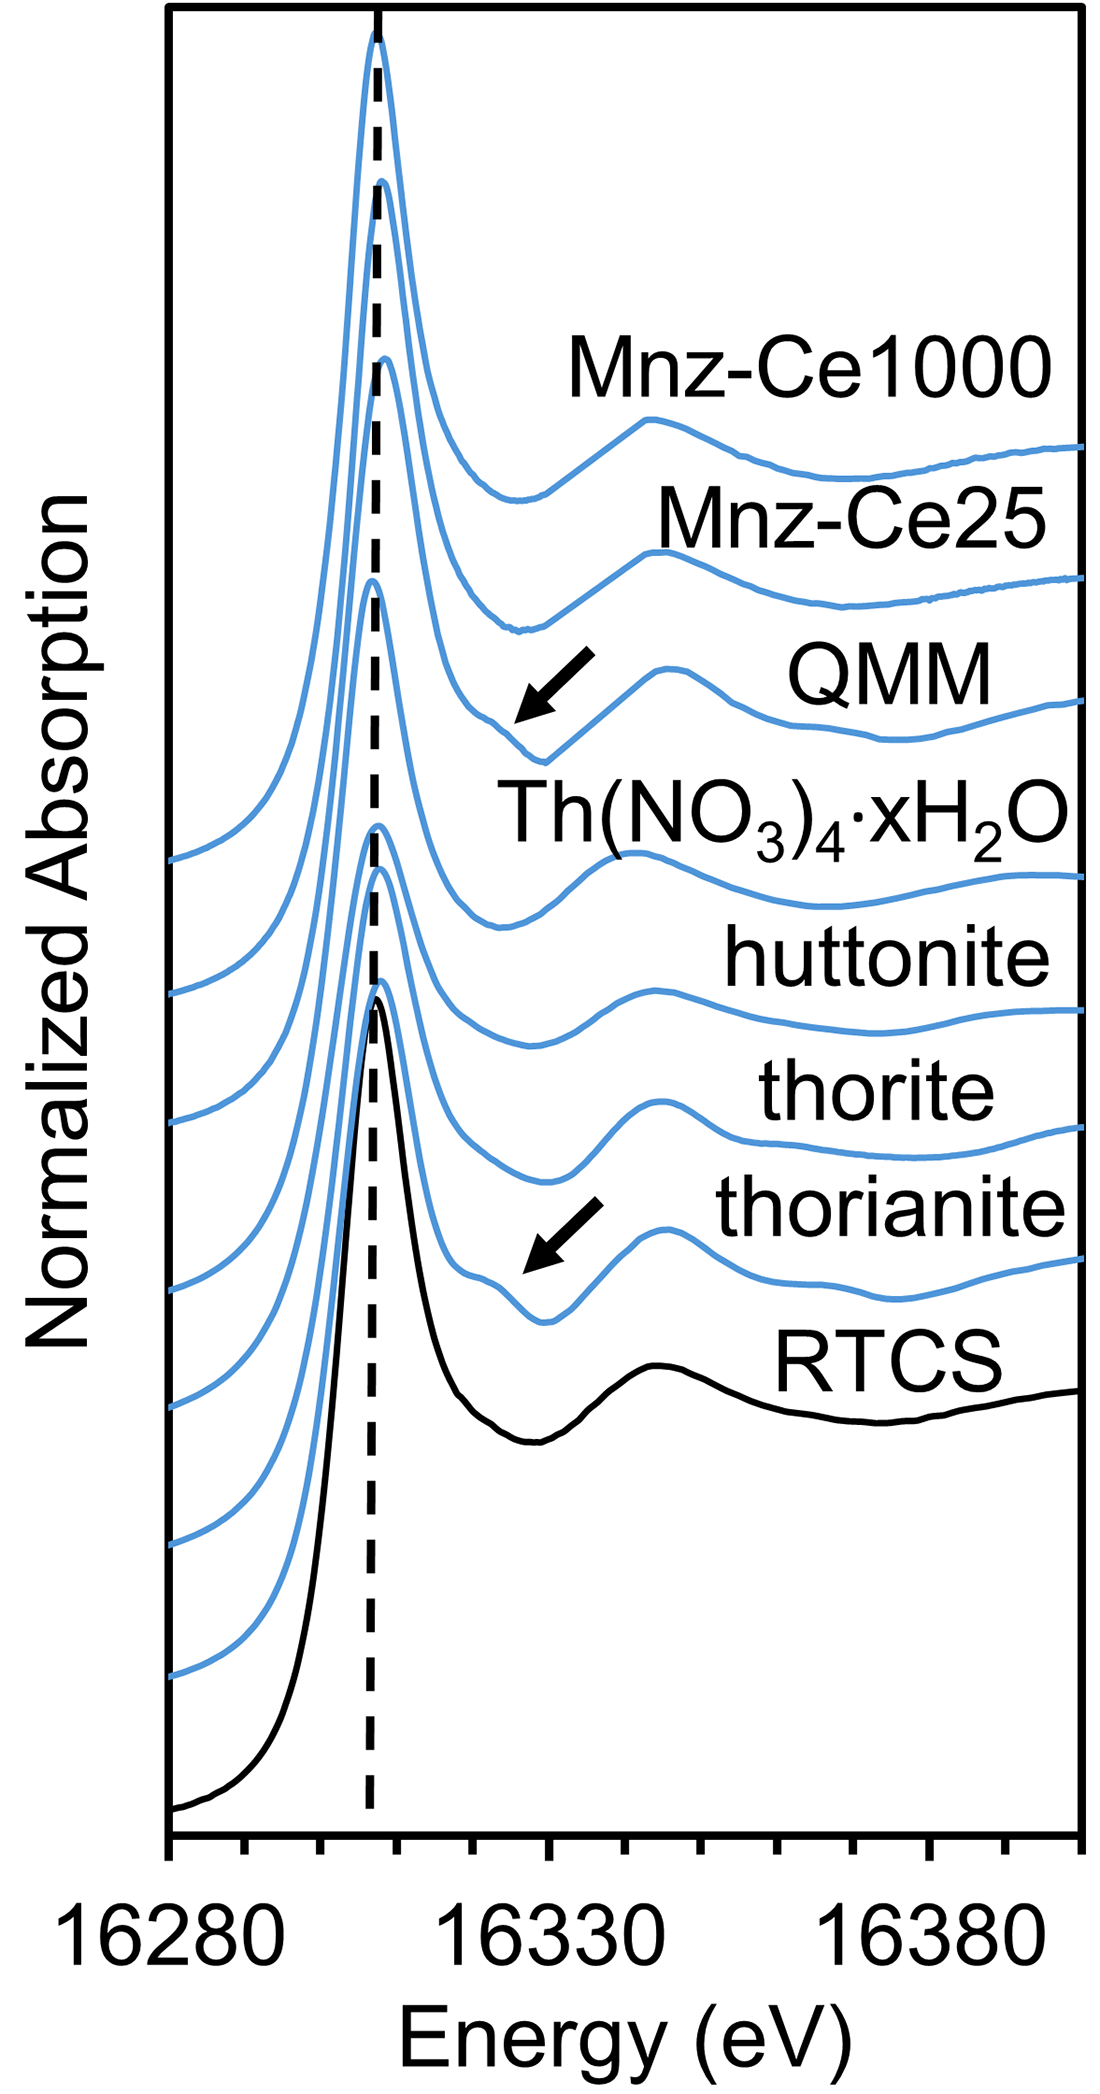
Figure 8 shows that the ThLIII edge XANES spectrum of the RTCS has the same whiteline position of ∼16,307 eV as those of all Th4+ model compounds (Gamaletsos et al., Reference Gamaletsos, Godelitsas, Mertzimekis, Göttlicher, Steininger, Xanthos, Berndt, Klemme, Kuzmin and Bárdossy2011; Chadirji-Martinez et al., Reference Chadirji-Martinez, Grosvenor, Crawford, Chernikov, Heredia, Feng and Pan2022, Reference Chadirji-Martinez, Hudon, Chernikov, Heredia, Feng, Crawford and Pan2024), suggesting that thorium in the RTCS is dominant of the tetravalent state, despite the highly reduced condition during the smelting process (Fig. 1; Murphy and Frick, Reference Murphy and Frick2006; Filippou and Hudon, Reference Filippou and Hudon2009). Also of interest is the fact that the ThLIII edge XANES spectrum of the RTCS has different post-edge features from those of the QMM ilmenite concentrate, a natural monazite-(Ce) with and without annealing at 1273 K for 24 hours, and a synthetic thorianite (Chadirji-Martinez et al., Reference Chadirji-Martinez, Hudon, Chernikov, Heredia, Feng, Crawford and Pan2024). This result supports the data from BSE and QEMSCAN imaging (Figs 2,3) and EMPA (Table 2) that the two major Th carriers (monazite and thorianite) in the QMM ilmenite concentrate had reacted to form other Th phases with different local structural environments during the smelting process.
(a) Photomicrograph showing the grain boundary of Ti–Fe-oxide and epoxy along top edge; (b and c) µsXRF FeK and ThL maps of an area close to the grain boundary outlined in (a); and (d–e) µsXRF FeK and ThL maps of another area close the grain core outlined in (a).
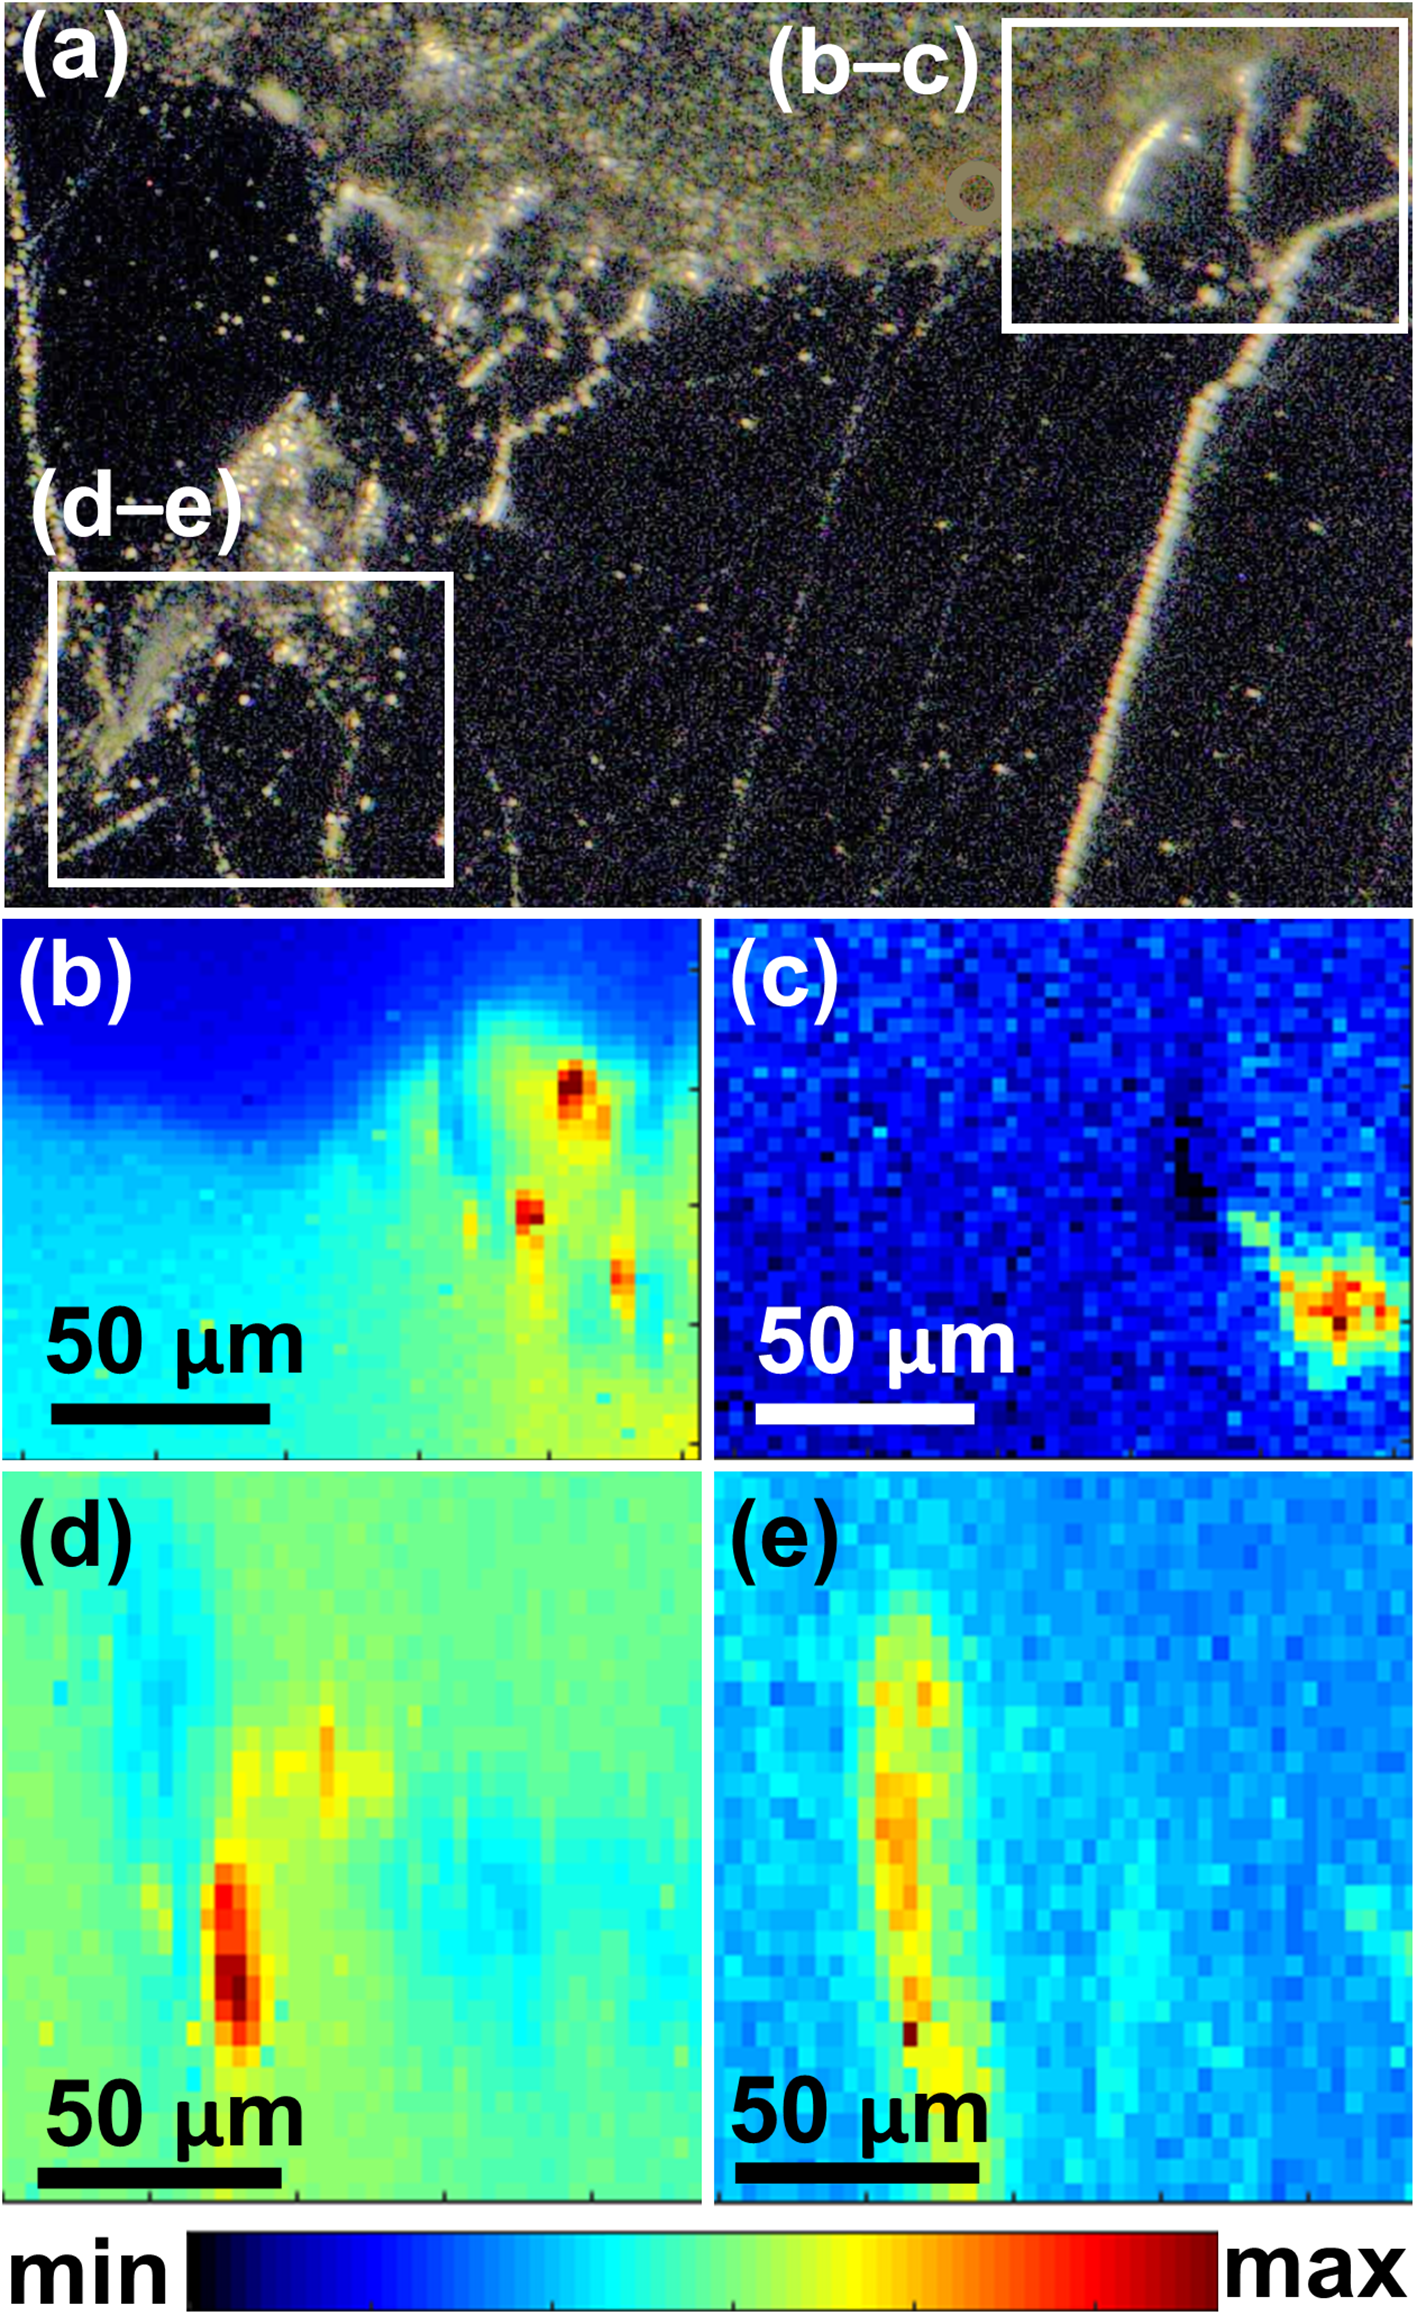
(a) Optical image of grain 2 in Table S.1; µsXRF maps of grain 2 showing (b) TiK, (c) SrK and (d) ThL X-ray fluorescence signals. The white outline in (c) and (d) marks the boundary of grain 2 based on the area of increased ThL fluorescence; (e) µsXRF spectrum from the Th–REE–Ti aluminosilicate perpendicular to a ferropseudobrookite/aluminosilicate glass interface (Fig. 3d); note that a full µsXRF spectrum without any truncation in vertical coordinate is shown in Figure S5 in Supplementary Data.
ThLIII XANES spectra of the RTCS and selected model compounds: huttonite, thorite, thorianite, natural monazite-(Ce) with (Mnz-Ce1000) and without (Mnz-Ce25) annealing at 1273 K for 24 hours. The QMM ilmenite concentrate is also included for comparison (Chadirji-Martinez et al., Reference Chadirji-Martinez, Hudon, Chernikov, Heredia, Feng, Crawford and Pan2024). The dashed line marks the whiteline position, while the arrows denote the distinct post-edge region among the RTCS, model compounds, and the QMM ilmenite concentrate.
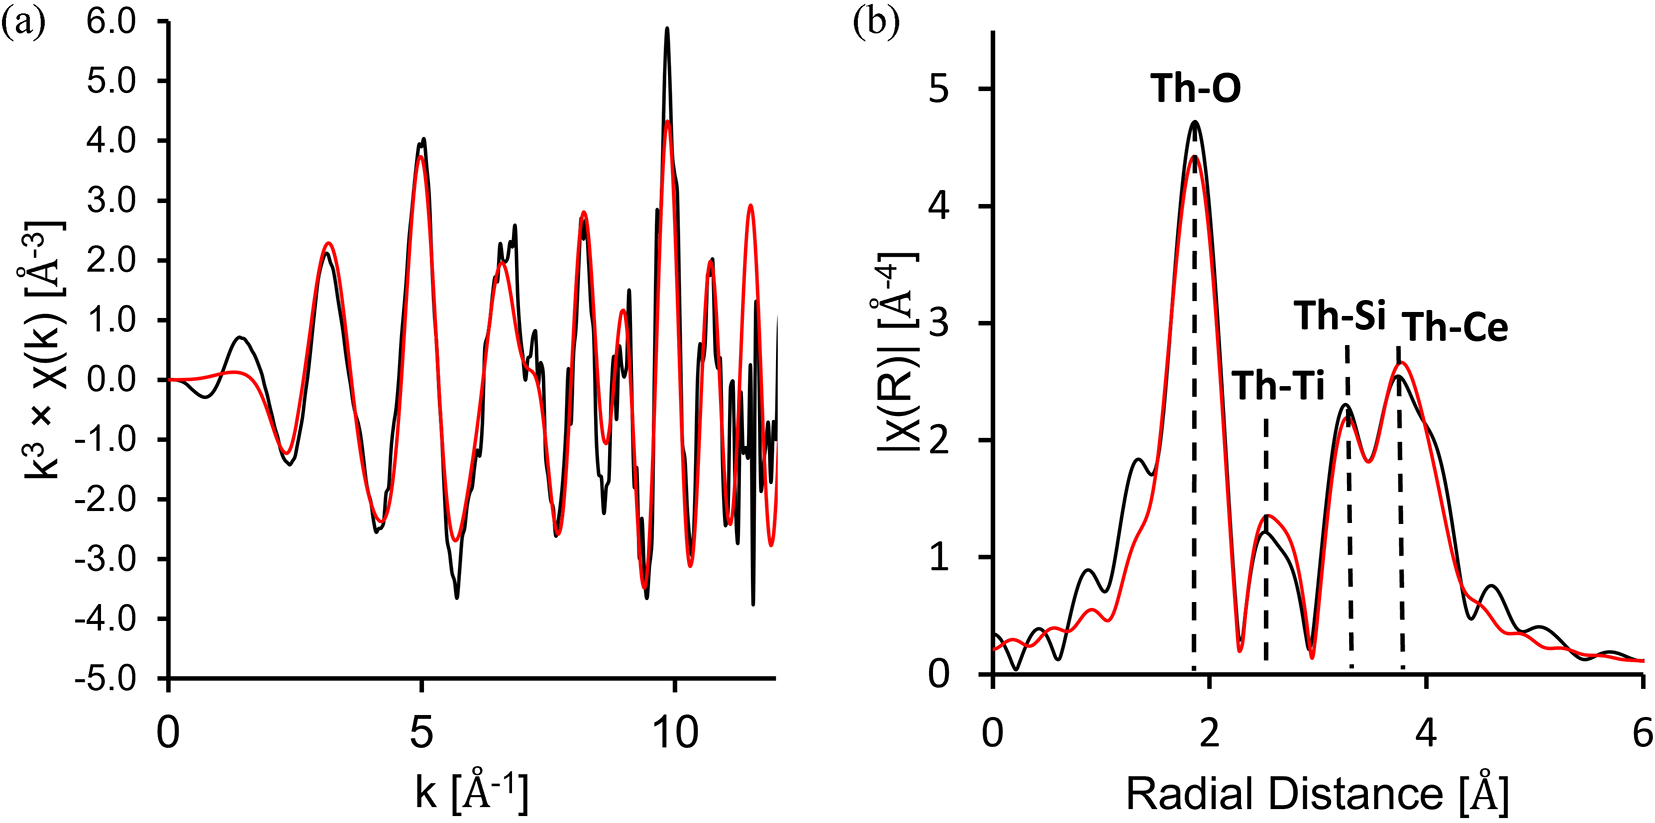
Following the identification of Th–REE–Ti aluminosilicate as the dominant carrier of thorium in the RTCS by combined EMPA and QEMSCAN analyses, the ThL III edge EXAFS data of the RTCS have been successfully fitted to a dingdaohengite-(Ce) model with an R-factor of 0.0245 (Fig. 9; Table 4). The P21/a dingdaohengite-(Ce) model (Fig. S3) used was populated with Ce atoms in the A site and Ti atoms at the B and D sites (ideally Ce4Ti5[Si2O7]2O8). Furthermore, the EXAFS curve fit to the dingdaohengite-(Ce) model was done by placing the thorium back-scattering atom in the A2 site only. Placing thorium back-scattering atoms in the A1 site, or doing a hybrid fit with thorium at both the A1 and A2 sites resulted in poor fits. Additional EXAFS curve fittings with other models (e.g. thorite and substitutional thorium at the Ca site in titanite) resulted in poor fits. The fittings of RTCS EXAFS data to the dingdaohengite-(Ce) model also support our assignment with vacancies at the B site because attempts of EXAFS curve fitting with no vacancies or with vacancies at the C or D site resulted in poor fits.
(a) ThL III k3-weighted EXAFS from the RTCS sample showing experimental data (black) and fit to the dingdaohengite-(Ce) model (red) (Li et al., Reference Li, Yang, Ma, Shi, Xiong, Sheng and Fan2005); (b) corresponding Fourier-transform function with the dominant single scattering path in each shell labelled.
Discussion
Distribution and formation of the Th–REE–Ti aluminosilicate in RTCS
Experimental studies by Haggerty and Lindsley (Reference Haggerty and Lindsley1969) and Haggerty (Reference Haggerty1973) showed that ferropseudobrookite undergoes subsolidus decomposition to iron-rich ferropseudobrookite (Fe1.5Ti1.5O5) and rutile at 1410 K. Therefore, the observed main Ti–Fe oxide assemblage of the sassite–ferropseudobrookite series and rutile in the RTCS most probably represents subsolidus decomposition products formed during the cooling of the titania slag. Detailed BSE imaging along with µsXRF mapping and QEMSCAN analyses show that the Th–REE–Ti aluninosilicate occurs in close association with the Th-bearing aluminosilicate glass and other trace iron-rich phases such as wüstite and buseckite (Figs 2, 3c,d, 7), as infillings interstitial to or along the fractures of the main Ti–Fe oxides. This association suggests that the Th–REE–Ti aluminosilicate most probably formed during the last stages of the quenching process. In particular, the acicular crystals of the Th–REE–Ti aluminosilicate most probably crystallised from an aluminosilicate melt that was quenched to form the Th-bearing aluminosilicate glass. This suggestion is consistent with the occurrences of the acicular crystals of the Th–REE–Ti aluminosilicate being perpendicular to the ferropseudobrookite/glass boundaries (Fig. 3d). Interestingly, Nell (Reference Nell2008) also noted acicular silicate crystals in South African titania slags with similar textural relationships to the major phases and concluded that they formed in the late stages of cooling.
Our identification of the Th–REE–Ti aluminosilicate as a chevkinite-type phase, similar to dingdaohengite-(Ce) (Li et al., Reference Li, Yang, Ma, Shi, Xiong, Sheng and Fan2005), is based on its chemical composition (Table 3), Raman vibrational bands (Fig. 3), and the fitting result of the ThLIII edge EXAFS data (Fig. 9; Table 4). Stachowicz et al. (Reference Stachowicz, Welch, Bagiński, Kartashov, Macdonald and Woźniak2019a, Reference Stachowicz, Bagiński, Welch, Kartashov, Macdonald, Balcerzak, Tyczkowski and Woźniak2019b) showed that the P21/a polymorph of dingdaohengite-Ce is stable at temperatures above 1026 K, also consistent with the formation of the Th–REE–Ti aluminosilicate in the RTCS during the quenching process.
Implications for remediating radionuclides and recovering thorium
The Th and U contents in the RTCS are higher by a factor of ∼1.3 times than the QMM ilmenite concentrate used for smelting (Chadirji-Martinez et al., Reference Chadirji-Martinez, Hudon, Chernikov, Heredia, Feng, Crawford and Pan2024), indicating that these radionuclides are preferentially partitioned into the titania slag during the smelting process. Chadirji-Martinez et al. (Reference Chadirji-Martinez, Hudon, Chernikov, Heredia, Feng, Crawford and Pan2024) showed the QMM ilmenite concentrate contains ∼0.075 modal% Th-rich monazite-(Ce), which was reduced from 2 wt.% monazite in the original ilmenite ore (Dumouchel et al., Reference Dumouchel, Giroux, Mead, Yule, Akser and Elder2005). Chadirji-Martinez et al. (Reference Chadirji-Martinez, Hudon, Chernikov, Heredia, Feng, Crawford and Pan2024) further showed that this residual monazite accounts for ∼54% of the total Th content in the QMM ilmenite concentrate, whereas the remaining ∼46% Th occurs as secondary thorianite on the surfaces of altered ilmenite. Therefore, one obvious approach to remediating the radionuclides in the RTCS is to reduce the Th and U contents in the original QMM ilmenite concentrates. Chadirji-Martinez et al. (Reference Chadirji-Martinez, Hudon, Chernikov, Heredia, Feng, Crawford and Pan2024) suggested that further development of permanent and superconducting magnetic separation (Kim and Jeong, Reference Kim and Jeong2019; Dieye et al., Reference Dieye, Thiam, Geneyton and Gueye2021) or chemical processes to minimise both detrital monazite and secondary thorianite in the ilmenite concentrates would be beneficial to reduce the Th content and radioactivity in the RTCS. In addition, the removal of monazite and thorianite from the ilmenite concentrates as byproducts for the recovery of rare earth elements and thorium represents additional economic gains.
The present discovery of the Th–REE–Ti aluminosilicate and Th-bearing aluminosilicate glass as the dominant Th and U carriers and their occurrences as quenching products interstitial to or along fractures of the main Ti–Fe oxides in the RTCS point to preferential acid dissolution of these aluminosilicate phases as an effective approach for remediating radionuclides and possibly recovering Th as a byproduct. Xu et al. (Reference Xu, Yang, Li, Wu and Shen2008) noted that dingdaohengite-(Ce) is highly insoluble in various acids such as aqua regia, hydrochloric acid and nitric acid. On the other hand, hydrofluoric acid is well known for preferentially dissolving silicates and silicate glasses (Mitra and Rimstidt, Reference Mitra and Rimstidt2009). Thorium-based fuel cycles have been suggested to improve fuel sustainability within the nuclear power industry due to their advantages over conventional uranium-based reactors because of (1) thorium being far more abundant than uranium and (2) superior physical, chemical and environmental properties (e.g. higher energy density, thermal conductivity, and less long-lived radioactive waste (Bell et al., Reference Bell, Chan and Prudil2019; Jyothi et al., Reference Jyothi, Gadelha Tumajan Costa de Melo, Santos and Yoon2023). Therefore, preferential dissolution of the Th–REE–Ti aluminosilicate with hydrofluoric acid, albeit highly toxic, is potentially effective for remediating radionuclides from the RTCS, whereas Th can be recovered as a byproduct for further nuclear power generation (Schaffer Reference Schaffer2013; Humphrey and Khandaker, Reference Humphrey and Khandaker2018; Bell et al., Reference Bell, Chan and Prudil2019; Jyothi et al., Reference Jyothi, Gadelha Tumajan Costa de Melo, Santos and Yoon2023). Therefore, this study also contributes to recent efforts in the valorisation of existing mine wastes for Th production (e.g. Th-rich tailings from rare-earth extraction processes), rather than direct mining and extraction of Th as a primary product (Aziman and Ismail, Reference Aziman and Ismail2020; Chadirji et al., Reference Chadirji-Martinez, Grosvenor, Crawford, Chernikov, Heredia, Feng and Pan2022, Reference Chadirji-Martinez, Hudon, Chernikov, Heredia, Feng, Crawford and Pan2024; Jyothi et al., Reference Jyothi, Gadelha Tumajan Costa de Melo, Santos and Yoon2023). On the other hand, acid dissolution treatment of the titania slag is expected to release Cr, Pb, and other heavy metals with adverse effects (Table 2). Therefore, a comprehensive strategy for the remediation and valorisation of the titania slag must be implemented.
Conclusion
This study used combined pXRD, BSE imaging, QEMSCAN and µsXRF mapping, EMPA, LA-ICP-MS, Raman and synchrotron XAS analyses to collectively demonstrate that a Th–REE–Ti aluminosilicate is the dominant carrier of Th and U in the RTCS titania slag. Its occurrences as mainly acicular crystals in close association with a Th-bearing aluminosilicate glass as infillings interstitial to or along the fractures of the main Ti–Fe oxides suggest that it formed most probably during the last stages of the quenching process. This discovery of the almost exclusive occurrence of Th with the Th–REE–Ti aluminosilicate and the Th-bearing aluminosilicate glass in the quenching products points to their preferential acid dissolution as an effective method for not only mitigating radioactivity in the titania slag and its downstream consumer products but also potentially recovering this radionuclide as a byproduct for further nuclear power generation.
Supplementary material
The supplementary material for this article can be found at https://doi.org/10.1180/mgm.2024.69.
Acknowledgements
We thank the Principal Editor Dr. Stuart Mills and three reviewers for constructive comments and helpful suggestions. We also thank the University of Saskatchewan, Rio Tinto Fer et Titane, and the Natural Science and Engineering Research Council of Canada for funding this study. Dr. Jinru Lin and Eli Wiens assisted in collecting synchrotron XAS data. We thank Blaine Novakovski for preparing the polished thin sections and epoxy pucks. We thank the Saskatchewan Research Council for collecting ICP-MS, EMPA, and QEMSCAN data and Dr. Panseok Yang of the University of Manitoba for collecting EMPA and LA-ICP-MS data.
Competing interests
Guillaume Hudon works for RTFT from which the RTCS sample was supplied.


 Open access