


Sulco-gyral patterns are thought to form through minimisation of axonal tension during cortico–cortical connection formation (Reference Van EssenVan Essen, 1997; Reference Hilgetag and BarbasHilgetag & Barbas, 2005). This process results in morphological differences in the gyri and sulci, which include the number and shape of cells. Early disruption of axonal tracts can affect later development of the cortical mantle. Assessing differences in the cortical integrity of sulci compared with gyri may index neurodevelopmental abnormalities in cortical development in schizophrenia. Recent advances in brain imaging methods now allow efficient measurement of both sulci and gyri, including cortical thickness (e.g. Reference Fischl, van der Kouwe and DestrieuxFischl et al, 2004). Investigations of the cortical mantle have demonstrated thickness abnormalities in temporal gyri and in frontal, temporal and parietal sulci in children and adolescents with schizophrenia-spectrum disorders (Reference White, Andreasen and NopoulosWhite et al, 2003); increased right temporal cortical folding (Reference Harris, Yates and MillerHarris et al, 2004a ) and reduced posterior cingulate folding in patients with schizophrenia (Reference Wheeler and HarperWheeler & Harper, 2007); and increased right frontal cortical folding in high-risk individuals who later developed schizophrenia (Reference Harris, Whalley and YatesHarris et al, 2004b ). Studying adult non-psychotic relatives of patients provides a way to investigate the potential effects of genes or gene–environment interactions not confounded by the illness process or medication. Family studies have found increased frontal cortical folding in unaffected relatives (Reference Falkai, Honer and KamerFalkai et al, 2007) and reduced left frontal cortical folding in high-risk individuals (Reference Jou, Hardan and KeshavanJou et al, 2005). We previously investigated gyri in the same sample of non-psychotic relatives of people with schizophrenia and found abnormalities in the cingulate, superior temporal, middle temporal and parahippocampal regions (Reference Goghari, Rehm and CarterGoghari et al, 2007). To characterise further the potential effect of susceptibility genes on cortical folding, we evaluated sulcal thickness, surface area and grey-matter volume in frontal and temporal regions. This complementary focus on sulci allows a more complete understanding of the potential structural abnormalities of the cortical mantle related to the schizophrenia diathesis.
METHOD
Participants
Twenty-two first-degree relatives of patients with schizophrenia and 23 controls participated. First-degree relatives were recruited by first identifying probands receiving treatment through the Western Psychiatric Institute and Clinic in Pittsburgh, Pennsylvania. Diagnosis for probands was confirmed using the Structured Clinical Interview for DSM–IV (Reference First, Spitzer and GibbonFirst et al, 1996). Control group participants were recruited from the general population. Individuals were excluded if they had experienced head trauma, seizures or had a diagnosis of substance misuse or dependence within the preceding 6 months. Control group candidates were excluded additionally if they had a family history of psychosis. Relatives and controls were screened for psychiatric symptoms or disorders using the Structured Clinical Interview for DSM–III–R, Non-patient version (Reference Spitzer, Williams and GibbonSpitzer et al, 1990). Relatives were additionally assessed with the Structured Interview for DSM–III Personality Disorders–Revised (SID–P) for cluster A personality disorders (Reference Pfohl, Stagl and ZimmermanPfohl et al, 1982). One control met criteria for DSM–IV diagnosis in the past month (intermittent explosive disorder). Three relatives and three controls met criteria for lifetime diagnosis for major depressive disorder. In addition, one relative met criteria for schizotypal personality disorder. This protocol was approved by the University of Pittsburgh institutional review board. After complete description of the study to the participants, written informed consent was obtained.
Image acquisition and processing
Spoiled gradient recalled magnetic resonance imaging (MRI) scans were acquired in the axial plane using a GE Signa (General Electric, Milwaukee, Wisconsin, USA) 3 T magnetic resonance scanner (0.9375 mm × 0.9375 mm × 1.5 mm voxel size, 124 slices). Whole-brain volumes were extracted using McStrip, an automated, consensus-based stripping algorithm (Reference Rehm, Schaper and AndersonRehm et al, 2004). Whole-brain volumes were intensity-corrected using non-parametric nonuniform intensity normalisation (N3) to improve the accuracy of tissue classification and cortical surface extraction (Reference Sled, Zijdenbos and EvansSled et al, 1998). An automatic algorithm labelled the left and right hemispheres, cerebellum and brain-stem (Reference Rehm, Goghari and RottenbergRehm et al, 2005). Defects were manually edited where necessary. These stripped, intensity-corrected brain images and grossly subdivided volumes were used in the subsequent steps.
Surface extraction and cortical parcellation were conducted using FreeSurfer version 1.3 (Reference Fischl, van der Kouwe and DestrieuxFischl et al, 2004) (DS1, see data supplement to online version of this paper). Briefly, the stripped, intensity-corrected, subdivided volume was segmented to classify white matter and to approximate the grey–white matter boundary for each cortical hemisphere, from which a topologically correct grey-white matter boundary surface triangulation was generated (Reference Dale, Fischl and SerenoDale et al, 1999; Reference Fischl, Liu and DaleFischl et al, 2001). Subsequently, a pial surface was generated using a deformable surface algorithm (Reference Fischl and DaleFischl & Dale, 2000). All surfaces were visually inspected and defects leading to major topological errors were manually corrected. The grey–white boundary surface was inflated and individual differences in curvature were normalised. For each brain examined the inflated surface was morphed into a sphere and registered to an average spherical surface that optimally aligned sulci and gyri across participants (Fischl et al, Reference Fischl, Sereno and Dale1999a ,Reference Fischl, Sereno and Tootell b ). Surfaces were successfully extracted for 41 participants (22 controls and 19 relatives) using standard parameters.
Parcellation for each individual's left and right hemisphere surface was transmitted from the parcellation of the reference spherical surface to which they were aligned. Each parcellated region was mapped back onto each individual brain's inflated surface by inverting the algorithm that morphed the inflated surface to the average spherical surface representation (Reference Kuperberg, Broome and McGuireKuperberg et al, 2003; Reference Fischl, van der Kouwe and DestrieuxFischl et al, 2004). Eighty-five parcellation units were provided by FreeSurfer, based on the conventions of Duvernoy (Reference Duvernoy1991).
Thicknesses were calculated using Free-Surfer software; they were computed for each vertex in the triangulated surfaces by finding the point on the white-matter surface that was closest to a given point of the pial surface (and vice versa) and the average was taken between these two values. Surface areas were calculated for both the white–grey boundary and pial surface using the formula of Heron (Reference Gellert, Kustner and HellwichGellert et al, 1975). The average of the two surface areas at each triangle was computed and was used in analyses to simulate an intermediate cortical surface. Grey-matter volumes were calculated by constructing a closed mesh joining a pair of linked triangles and computing the enclosed volume (Reference Eberly, Lancaster and AlyassinEberly et al, 1991). Individual triangle volumes were aggregated to compute cortical grey-matter volume for each region of interest. This methodology has been extensively validated (Reference Kuperberg, Broome and McGuireKuperberg et al, 2003; Reference Fischl, van der Kouwe and DestrieuxFischl et al, 2004). A trained rater manually traced regions of interest on ten white–grey boundary inflated surfaces. An index of similarity between the automated and hand-drawn regions was calculated. This index was defined as the ratio of twice the common area between the two methods relative to the sum of the individual areas; a value above 0.7 was considered excellent correspondence (Reference Zijdenbos, Dawant and MargolinZijdenbos et al, 1994). All three sulcal regions had acceptable correspondence (superior frontal 0.71, cingulate 0.82, superior temporal, 0.87).
Analyses
All sulcal regions of interest were assessed using mixed-model analysis of covariance (ANCOVA), with hemisphere (left, right) entered as an intra-individual effect and group (control, relative) entered as an inter-individual effect. Age, gender and average cortical thickness were entered as covariates when analysing regional thicknesses; age, gender and total cortical surface area were entered as covariates when analysing regional surface areas; and age, gender and intracranial volume were entered as covariates when analysing regional volumes. All analyses were also conducted with education as an additional covariate; as this did not affect the results, the findings reported below do not include it as a covariate. Greenhouse–Geisser correction is reported for the mixed-model ANCOVAs. These planned comparisons were set to a significance threshold of P=0.05. Because of concerns related to multiple comparisons, effect sizes are reported as a supplemental indicator to significance values. Partial eta-squared effect sizes are presented: 0.01 is considered a small effect, 0.06 is considered a medium effect and 0.14 is considered a large effect (Reference StevensStevens, 2002).
RESULTS
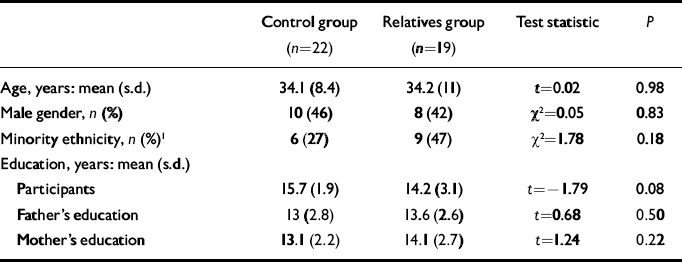
Data for the final sample are presented in Table 1. No significant difference between groups was found for any demographic variable. Although relatives tended to have slightly less educational attainment than the controls, parents were matched for education. The imaging data from three relatives and one control had to be excluded owing to poor quality. As one relative met criteria for schizotypal personality disorder, all analyses were conducted both with and without this participant: none of the findings changed substantially when this participant's data were removed.
Demographic characteristics of the sample
| Control group (n=22) | Relatives group (n=19) | Test statistic | P | |
|---|---|---|---|---|
| Age, years: mean (s.d.) | 34.1 (8.4) | 34.2 (11) | t=0.02 | 0.98 |
| Male gender, n (%) | 10 (46) | 8 (42) | χ2=0.05 | 0.83 |
| Minority ethnicity, n (%) 1 | 6 (27) | 9 (47) | χ2=1.78 | 0.18 |
| Education, years: mean (s.d.) | ||||
| Participants | 15.7 (1.9) | 14.2 (3.1) | t=-1.79 | 0.08 |
| Father's education | 13 (2.8) | 13.6 (2.6) | t=0.68 | 0.50 |
| Mother's education | 13.1 (2.2) | 14.1 (2.7) | t=1.24 | 0.22 |
1. African American
MRI analyses
Frontal sulcal measures
Planned comparisons of middle and inferior frontal sulcal thickness, surface area and volume revealed no significant main effect of group or hemisphere by group interactions (all P>0.2).
Cingulate sulcal measures
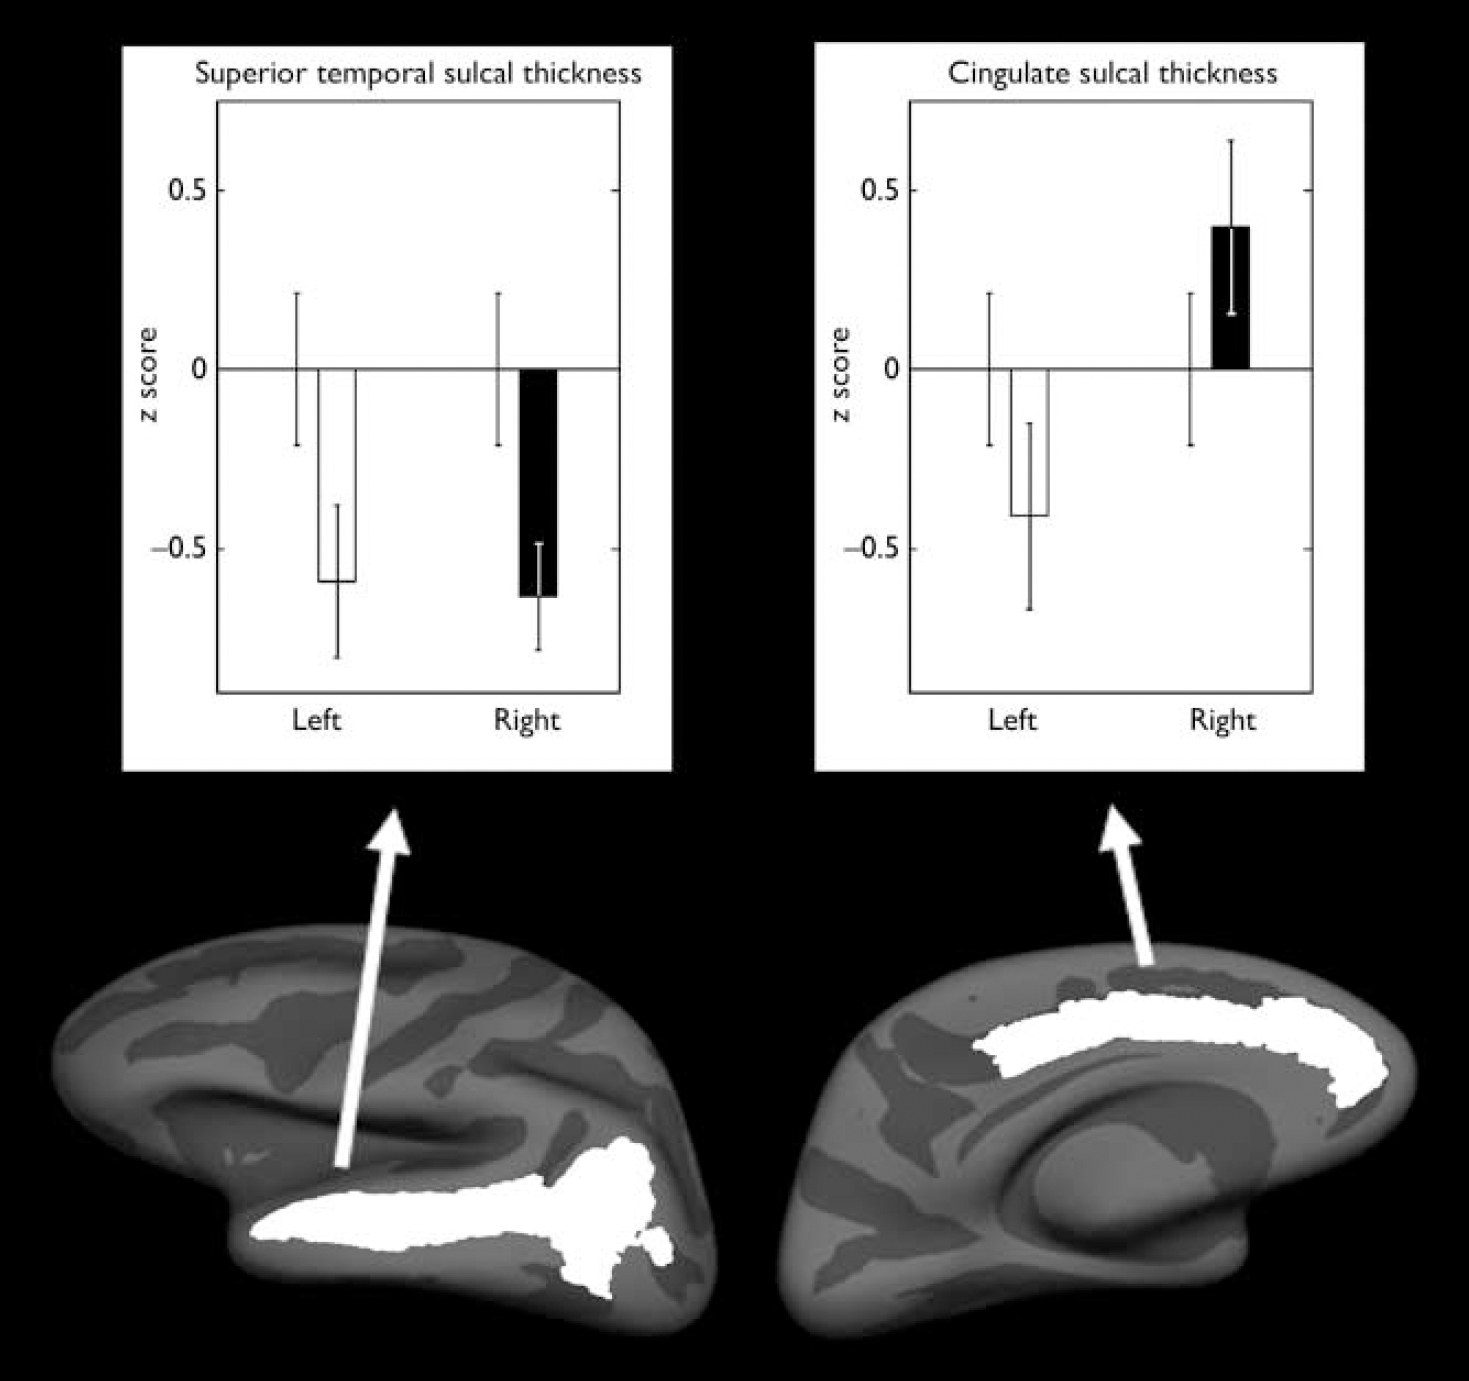
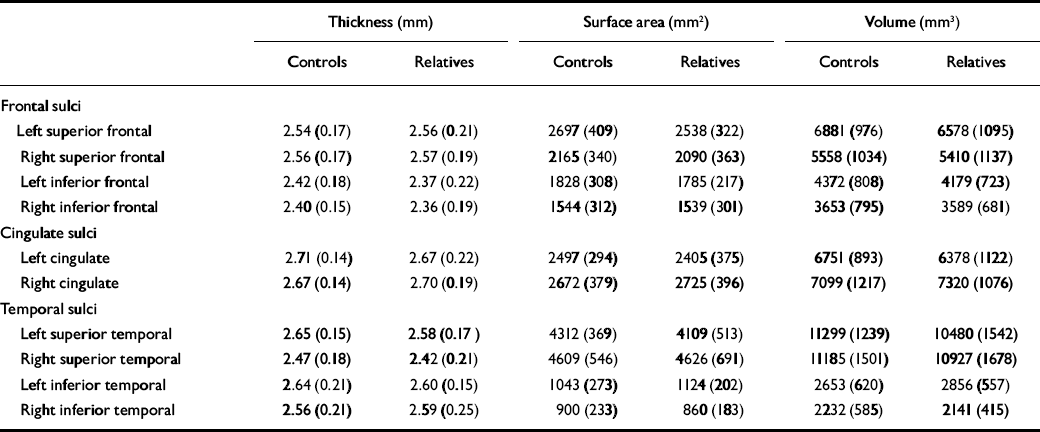
A significant hemisphere by group interaction was found in cingulate sulcal thickness (F=5.50, d.f.=1,36, P=0.03; partial η2=0.13), with the relatives group having a reversal in hemispheric asymmetry pattern compared with the control group. The control group had thicker sulci in the left hemisphere, whereas those in the relatives group had thicker sulci in the right hemisphere (Fig. 1, Table 2). There were also significant effects of age (F=7.26, d.f.=1,36, P=0.01) and average cortical thickness (F=23.85, d.f.=1,36, P<0.001) covariates. No significant difference was found in surface area or volume (all P>0.1).
Mean z scores for the thicknesses that demonstrated a significant difference between the control group (n=22) and the relatives group (n=19). Left-hand panel, superior temporal sulcal thickness; right-hand panel, cingulate sulcal thickness. Mean scores for the relatives group for the left and right hemispheres are compared with the control group score (mean=0); bars indicate standard error of the mean.
Thickness, surface area and grey-matter volume (raw values; mean, s.d.)
| Thickness (mm) | Surface area (mm2) | Volume (mm3) | |||||||
|---|---|---|---|---|---|---|---|---|---|
| Controls | Relatives | Controls | Relatives | Controls | Relatives | ||||
| Frontal sulci | |||||||||
| Left superior frontal | 2.54 (0.17) | 2.56 (0.21) | 2697 (409) | 2538 (322) | 6881 (976) | 6578 (1095) | |||
| Right superior frontal | 2.56 (0.17) | 2.57 (0.19) | 2165 (340) | 2090 (363) | 5558 (1034) | 5410 (1137) | |||
| Left inferior frontal | 2.42 (0.18) | 2.37 (0.22) | 1828 (308) | 1785 (217) | 4372 (808) | 4179 (723) | |||
| Right inferior frontal | 2.40 (0.15) | 2.36 (0.19) | 1544 (312) | 1539 (301) | 3653 (795) | 3589 (681) | |||
| Cingulate sulci | |||||||||
| Left cingulate | 2.71 (0.14) | 2.67 (0.22) | 2497 (294) | 2405 (375) | 6751 (893) | 6378 (1122) | |||
| Right cingulate | 2.67 (0.14) | 2.70 (0.19) | 2672 (379) | 2725 (396) | 7099 (1217) | 7320 (1076) | |||
| Temporal sulci | |||||||||
| Left superior temporal | 2.65 (0.15) | 2.58 (0.17) | 4312 (369) | 4109 (513) | 11299 (1239) | 10480 (1542) | |||
| Right superior temporal | 2.47 (0.18) | 2.42 (0.21) | 4609 (546) | 4626 (691) | 11185 (1501) | 10927 (1678) | |||
| Left inferior temporal | 2.64 (0.21) | 2.60 (0.15) | 1043 (273) | 1124 (202) | 2653 (620) | 2856 (557) | |||
| Right inferior temporal | 2.56 (0.21) | 2.59 (0.25) | 900 (233) | 860 (183) | 2232 (585) | 2141 (415) | |||
Temporal sulcal measures
A significant effect of group was found in the superior temporal sulcal thickness (F=8.17, d.f.=1,36, P=0.007; partial η2=0.19) with the relatives group having 2.4% bilateral decrease (Fig. 1, Table 2). There was also a significant effect of average cortical thickness (F=119.87, d.f.=1,36, P<0.001) covariate. No significant difference was found in surface area or volume (all P>0.1). Planned comparisons of inferior temporal sulci thickness, surface area and volume revealed no significant main effect of group or hemisphere by group interactions (P>0.1).
DISCUSSION
This study evaluated whether frontal and temporal sulcal abnormalities were associated with a possible genetic vulnerability to schizophrenia. To examine possible grey-matter abnormalities comprehensively we measured cortical thickness, surface area and volume. The principal findings were that non-psychotic relatives of patients with schizophrenia demonstrated abnormalities in thickness in the cingulate and superior temporal sulci.
Consistent with previous findings of cingulate cortex abnormalities, we found that cingulate sulcal thickness was abnormal among the relatives, who were observed to have a reversed asymmetry pattern with the right hemisphere being thicker than the left. Similar to our findings, studies have demonstrated that controls had more leftward asymmetry in their paracingulate sulci compared with patients with schizophrenia (Reference Yücel, Stuart and MaruffYücel et al, 2002; Reference Le Provost, Bartrés-Faz and Paillère-MartinotLe Provost et al, 2003), whereas the patients with schizophrenia had more rightward asymmetry in their paracingulate sulci (Reference Le Provost, Bartrés-Faz and Paillère-MartinotLe Provost et al, 2003). Compared with a control group, individuals with a high risk of developing schizophrenia tended to have a significantly more interrupted left cingulate sulcus and less well-developed left paracingulate sulcus (Reference Yücel, Wood and PhillipsYücel et al, 2003). Recent MRI studies of cortical thickness have found the cingulate cortex to be thinner in people with first-episode schizophrenia (Reference Narr, Toga and SzeszkoNarr et al, 2005) and specifically the anterior cingulate gyri to be thinner in patients with chronic schizophrenia (Reference Kuperberg, Broome and McGuireKuperberg et al, 2003). A study assessing the gyrification index, defined as the ratio of the length of the contour of the gyri and sulci compared with the length connecting the gyral surface, demonstrated significant reductions in posterior cingulate cortical folding in schizophrenia (Reference Wheeler and HarperWheeler & Harper, 2007). Consistent with neuroimaging results of cortical thinning, post-mortem work on the anterior cingulate cortex of people with schizophrenia has demonstrated glial cell loss and changes in cell size and density (Benes et al, Reference Benes, McSparren and Bird1991, Reference Benes, Vincent and Todtenkopf2001; Reference Stark, Uylings and Sanz-ArigitaStark et al, 2004). However, a greater number of axons in layer II and sub-lamina IIIA has also been reported (Reference Benes, Davidson and BirdBenes et al, 1986). The cingulate gyri in the current sample have also been noted to be thinner and have reduced surface area and volume in the relatives group (Reference Goghari, Rehm and CarterGoghari et al, 2007). Taken together these results suggest neurodevelopmental abnormalities in this limbic region, which has an essential role in affective, cognitive and motor control systems (Reference Vogt, Finch and OlsonVogt et al, 1992).
Consistent with temporal cortex abnormalities reported in the literature, we found a bilateral reduction in thickness in the superior temporal sulci in the non-psychotic relatives of patients with schizophrenia compared with controls. Consistent with this finding, the cell density in a variety of temporal lobe sulci was reduced in schizophrenia (Reference Chance, Tzotzoli and VitelliChance et al, 2004). A study of male patients with chronic schizophrenia demonstrated faster cerebrospinal fluid volume expansion in posterior superior temporal sulci compared with controls over a span of 4 years (Reference Mathalon, Sullivan and LimMathalon et al, 2001). The superior temporal sulci border both the superior and middle temporal gyri. Previously in the current sample, only surface area and not thickness was decreased in the superior temporal gyri (Reference Goghari, Rehm and CarterGoghari et al, 2007). In addition, the left middle temporal and bilateral parahippocampal gyri were greater in surface area and volume in the relatives group. Superior temporal lobe gyrus volume has also been shown to be reduced in the young offspring of patients (Reference Rajarethinam, Sahni and RosenbergRajarethinam et al, 2004). Together, these findings suggest that the temporal sulci and gyri are globally affected. Thus, the temporal cortex may be an important indicator of the schizophrenia diathesis.
We failed to find any significant structural differences in the middle and inferior frontal regions, although functional MRI data collected on the same sample of relatives and controls suggest abnormalities in prefrontal activity (Brodmann areas 9, 8 and 6) (Reference MacDonald, Becker and CarterMacDonald et al, 2006). In contrast to our structural findings, Falkai et al (Reference Falkai, Honer and Kamer2007) conducted a gyrification study of patients with schizophrenia and unaffected relatives and found both groups to have a higher frontal gyrification index than a control group. Findings have been inconsistent, however, with one study finding that high-risk individuals who later developed schizophrenia had a higher gyrification index in the right frontal lobe (Reference Harris, Whalley and YatesHarris et al, 2004b ), and another study finding that high-risk individuals had no difference in the right frontal lobe, but rather a reduced gyrification index in the left frontal lobe (Reference Jou, Hardan and KeshavanJou et al, 2005). These discrepancies in findings may be sample-specific or due to methodological differences. Our sample size is modest and might not have been sufficient to detect smaller group differences. However, in our sample, the effect sizes indicated the magnitude of the difference between the groups was small: superior and inferior frontal sulcal thickness, partial η2=0–0.06; surface area, partial η2=0.01–0.03; volume, partial η2=0–0.01.
Limitations
We attempted to control for multiple comparisons by restricting our analyses to five planned comparisons of regions consistently associated with schizophrenia. There is a need for caution when interpreting results that derive from multiple comparisons. However, this caution has to be balanced by the need to be sensitive to group differences. Our approach to this balance was to report effect sizes, which reflect the magnitude of the difference between groups regardless of sample size. Our results indicated the abnormality in the cingulate sulcal thickness (effect size 0.13) and the bilateral reduction in superior temporal sulci (effect size 0.19) are both noteworthy findings. This study compared the non-psychotic relatives of patients with schizophrenia and controls. It would have been useful in addition to have collected patient pedigree information to quantify genetic liability on a continuum. We used an automated method to measure cortical thickness and to parcellate the cerebral cortex. The accuracy of the thickness values depends on the accuracy of the grey–white segmentation and therefore can be influenced by various artefacts. However, we followed validated data processing procedures provided by the FreeSurfer manual and all analyses were performed in consultation with a magnetic resonance physicist (K.R.).
Implications
Sulci and gyri are thought to form together, with gyri forming between densely connected regions and sulci forming between weakly connected regions (Reference Hilgetag and BarbasHilgetag & Barbas, 2006). In addition, structural differences exist between the gyri and sulci, with gyri having significantly greater number of neurons in deep layers. The process of cortical folding can lead to differences in cell and dendrite morphology and the layout of cortical blood vessels in the gyri and sulci, thereby potentially resulting in further differences in functioning (Reference Hilgetag and BarbasHilgetag & Barbas, 2005). Assessing gyri and sulci may reflect a further way to index neurodevelopmental abnormalities of cortical development in schizophrenia.
In this study we found the cingulate and the superior temporal sulci to be the most affected, and these may serve as useful structural endophenotypes relating the pathology to the aetiology. In addition, our results indicate that thickness, surface area and volume are differentially affected in the sulci and gyri. Combined with our previous gyral findings, these sulcal results suggest that cortical thickness abnormalities are more prominent in the sulci and that surface area abnormalities are more prominent in the gyri. A number of factors could change the formation of sulci and gyri. Differential growth of cortical regions could displace adjacent gyral regions. Alternatively, growth of brain regions could affect the trajectories of migrating axons, affecting sulci and gyri formation patterns. Lastly, time course disruption of interhemispheric and intercortical white-matter tracts, especially of the thalamocortical fibre system, might affect sulci and gyri formation patterns, even in distant areas (Reference Welker, Jones and PetersWelker, 1990). The schizophrenia diathesis most likely has an impact on all these processes, thereby having a complex effect on the neurodevelopment of cortical topography.
Acknowledgements
V.M.G. was supported by a Postgraduate Scholarship Master's and Doctoral Award from the Natural Sciences and Engineering Research Council of Canada and by the Graduate Research Partnership Program, University of Minnesota. Additional support was provided by the National Institute of Mental Health (MH45156) and the University of Minnesota. The authors gratefully acknowledge the assistance of the International Neuroimaging Consortium: Dr David Rottenberg, Kirt Schaper, Kristi Boesen and Tim Jarvis; the University of Pittsburgh Medical Center, Department of of Radiology; the Cognitive Control Neuroscience Laboratory; the Western Psychiatric Institute and Clinic, University of Pittsburgh; and Theresa Becker, Jill Stanton, Ryan Walter, and Bruce Fischl. We especially thank James Porter for his help with reliability analyses.




eLetters
No eLetters have been published for this article.