

1. INTRODUCTION
Glaciers in many parts of the Himalaya have lost mass in recent decades in response to warming climate (Berthier and others, Reference Berthier2007; Bolch and others, Reference Bolch, Buchroithner, Pieczonka and Kunert2008, Reference Bolch, Pieczonka and Benn2011; Quincey and others, Reference Quincey, Luckman and Benn2009; Gardelle and others, Reference Gardelle, Berthier, Arnaud and Kääb2012; Kääb and others, Reference Kääb, Berthier, Nuth, Gardelle and Arnaud2012). The summer accumulation type glaciers of the eastern Himalaya are particularly sensitive to climate change, because a rise in temperature can both increase ablation and reduce the proportion of monsoon precipitation falling as snow (Fujita and Ageta, Reference Fujita and Yutaka2000; Benn and others, Reference Benn2012). Glacier response to climate change is also affected by debris cover, which is widespread on many glaciers in the region. Debris cover can either increase or decrease ablation rates depending on its thickness (Østrem, Reference Østrem1959; Nicholson and Benn, Reference Nicholson and Benn2006), and the formation of supraglacial lakes on low-gradient debris-covered glacier tongues can locally increase ablation by orders of magnitude (Sakai and others, Reference Sakai, Takeuchi, Fujita, Nakawo, Nakawo, Fountain and Raymond2000a, Reference Sakai, Chikita and Yamadab, Reference Sakai, Nakawo and Fujita2002, Reference Sakai, Nishimura, Kadota and Tekeuchi2009; Benn and others, Reference Benn, Wiseman and Hands2001; Röhl, Reference Röhl2008). Debris cover is therefore an important control on regional variations in glacier mass balance (Scherler and others, Reference Scherler, Bookhagen and Strecher2011; Kääb and others, Reference Kääb, Berthier, Nuth, Gardelle and Arnaud2012). The response of debris-covered glaciers to climate warming can have a substantial impact at the local and regional catchment scales, including affecting long-term water availability and frequency of glacier related hazards, such as glacial lake outburst floods (GLOFs).
Numerous studies have investigated processes of mass loss on debris-covered glaciers, including sub-debris melting (Nakawo and Rana, Reference Nakawo and Rana1999; Nicholson and Benn, Reference Nicholson and Benn2006, Reference Nicholson and Benn2013; Reznichenko and others, Reference Reznichenko, Davies, Shulmeister and McSaveney2010), backwasting of exposed ice cliffs (Sakai and others, Reference Sakai, Nakawo and Fujita1998; Benn and others, Reference Benn, Wiseman and Hands2001), growth of supraglacial ponds and lakes (Sakai and others, Reference Sakai, Takeuchi, Fujita, Nakawo, Nakawo, Fountain and Raymond2000a, Reference Sakai, Chikita and Yamadab; Benn and others, Reference Benn, Wiseman and Hands2001; Röhl, Reference Röhl2008) and internal ablation in englacial conduits (Gulley and Benn, Reference Gulley and Benn2007; Gulley and others, Reference Gulley, Benn, Luckman and Müller2009). In a few cases, spatial patterns of mass loss have been determined, allowing the relative contribution of different processes (e.g. sub-debris melting vs. ice cliff retreat) to be established (Sakai and others, Reference Sakai, Nakawo and Fujita2002; Han and others, Reference Han, Wang, Wei and Liu2010; Immerzeel and others, Reference Immerzeel2014; Juen and others, Reference Juen, Mayer, Lambrecht, Han and Liu2014; Reid and Brock, Reference Reid and Brock2014). Such studies, however, require labor-intensive field campaigns, placing limits on spatial and temporal coverage (Sakai and others, Reference Sakai, Nakawo and Fujita1998, Reference Sakai, Nishimura, Kadota and Tekeuchi2009; Nuimura and others, Reference Nuimura2011; Immerzeel and others, Reference Immerzeel2014). Greater coverage is possible using remote sensing techniques, although the relatively low resolution of readily available DEM products (e.g. ASTER) limits the level of detail that can be achieved. There is thus a need for studies that bridge the gap between detailed, local-scale process studies and glacier-wide assessments of mass change.
In this paper, we use a series of high-resolution DEMs and repeat lake bathymetric surveys to study processes and patterns of mass loss on a Himalayan debris-covered glacier in unprecedented detail. The study focuses on Ngozumpa Glacier, Nepal, which has been the subject of a series of process studies dating from 1998 (Benn and others, Reference Benn, Wiseman and Hands2001; Thompson and others, Reference Thompson, Benn, Dennis and Luckman2012; Nicholson and Benn, Reference Nicholson and Benn2013). We use stereo GeoEye-1 and WorldView-3 imagery from June 2010, December 2012 and January 2015 to construct three DEMs with a spatial resolution of 1 m for 17.4 km2 of the ablation area of the glacier. In addition, volume changes in a lake complex on the lower glacier were obtained by field surveys over a similar period. Velocities on the glacier tongue and the extent of stagnant ice were determined by feature tracking using TerraSAR-X images. In combination, these data allow us to investigate ablation processes on the glacier and assess their relative contribution to mass loss. Our results provide a high-resolution snapshot of Ngozumpa Glacier at a critical stage of its evolution, and data necessary for modeling the future response of Himalayan debris-covered glaciers to climate change (Rowan and others, Reference Rowan, Egholm, Quincey and Glasser2015).
2. STUDY AREA
Ngozumpa Glacier is located in the Khumbu Himal of Eastern Nepal (27°57′N, 85°42′E; Fig. 1). The glacier flows southward from cirques below Cho Oyu (8188 m a.s.l.) and Gyachung Kang (7922 m a.s.l), where most accumulation occurs by ice and snow avalanching. Ngozumpa Glacier is ~18 km long, extending down to ~4659 m a.s.l, ~500 m lower than clean-ice glaciers in the area. The lower 15 km is extensively debris covered, with debris increasing in thickness from zero at the equilibrium line (c. 5500 m a.s.l) to 1–3 m towards the terminus (Nicholson, Reference Nicholson2005). In the ablation zone, the glacier surface lies <150 m below the Little Ice Age lateral moraines (Benn and others, Reference Benn, Wiseman and Hands2001; Sakai and Fujita, Reference Sakai and Fujita2010) due to surface lowering. Mass loss rates are lower near the terminus than up-glacier, reflecting the influence of debris cover on the mass-balance gradient. This spatial pattern of surface lowering has resulted in an overall reduction of the surface gradient in the ablation area, leading to a reduction in driving stress and flow speed (Quincey and others, Reference Quincey, Luckman and Benn2009). Feature tracking in the late 1990s has shown the lower ~6.5 km of the Ngozumpa to be stagnant (Quincey and others, Reference Quincey, Luckman and Benn2009).
Study of Ngozumpa Glacier, Nepal, insert shows the regional location. Image is orthorectified GeoEye-1, December 2012 with Spillway Lake highlighted.

Surface topography in the glacial ablation area is highly irregular, with a typical local relief of 30–50 m. Numerous hollows are occupied by so called ‘perched lakes’, because they are perched above the elevation of the terminal moraine that acts as the hydrological base level of the glacier. The majority of these lakes are ephemeral, typically persisting for 2–3 a before drainage via englacial conduits (Benn and others, Reference Benn, Wiseman and Hands2001). The englacial drainage system of Ngozumpa Glacier has been investigated by speleological techniques (Gulley and Benn, Reference Gulley and Benn2007; Gulley and others, Reference Gulley, Benn, Luckman and Müller2009), and largely consists of ‘cut and closure’ conduits formed by the incision of surface streams followed by roof closure. Many of these are relict features that are only intermittently active during lake drainage events. Enlargement of conduits during the discharge of warm lake water can create large voids within the glacier, which can collapse and form new hollows on the glacier surface. Englacial conduits are therefore important for both the drainage and formation of supraglacial lakes (Gulley and Benn, Reference Gulley and Benn2007; Thompson and others, Reference Thompson, Benn, Dennis and Luckman2012).
In the early 1990s a system of lakes began to form close to the terminus of Ngozumpa Glacier. The level of these lakes (informally known as Spillway Lake) is controlled by the elevation of a spillway through the western frontal-lateral moraine (Benn and others, Reference Benn, Wiseman and Hands2001; Thompson and others, Reference Thompson, Benn, Dennis and Luckman2012). Unlike the perched lakes, this system is not susceptible to drainage via englacial conduits and can continue to expand while the spillway remains at its current level. The lake system entered a major period of expansion after 2001 when it increased in area by ~10% a−1 (Thompson and others, Reference Thompson, Benn, Dennis and Luckman2012).
3. DATA AND METHODS
High-resolution stereo multispectral satellite imagery (0.5 m panchromatic) was acquired in June 2010 and December 2012 (GeoEye-1) and January 2015 (WorldView-3), for a region of 100 km2, covering 17.4 km2 of the ablation area of Ngozumpa Glacier (Table 1). These data were used to construct three DEMs, which were then differenced to determine spatial patterns of elevation change. In addition, three field bathymetric surveys were conducted over Spillway Lake in December 2009, 2012 and 2014. The results of the 2009 bathymetric survey are published in Thompson and others (Reference Thompson, Benn, Dennis and Luckman2012). Finally, ice velocities were determined by feature tracking a pair of TerraSAR-X images, acquired in September 2014 and January 2015 (Table 1).
Satellite images and acquisition information

3.1. DEM construction
The PCI Geomatica Software Package was used to automatically construct three stereoscopic DEMs from the stereo multispectral imagery. The Rational Functions math model was employed to transform to epipolar geometry and convert parallaxes to elevations, building a correlation between pixels and their ground location and elevation. The technique is based on rational polynomial coefficients (RPCs) supplied with the imagery and does not require the input of ground control points. A correlation value between each of the images in the stereo pair was generated for each DEM pixel, with a value of between 0 (no data) and 100 (full correlation). This correlation value allowed the identification of areas of no or poor correlation between each stereo pair. All areas with a correlation value <50 were classified as poor correlation and used to create a mask for the relevant DEM. At a later stage any areas of cloud cover or shadow still evident in the data were added to the DEM mask. All pixel values falling within the relevant masks were removed from the datasets and any calculations (Fig. 2). However, no major areas of poor correlation occurred on the glacier surface (Fig. 2).
Edited DEM constructed from each of the three sets of stereo imagery, including the areas of no data, poor correlation, cloud and shadow shown in black and classified as no data and the location of all delineated ice cliffs and lake perimeters.

Each DEM was resampled to provide a final pixel resolution of 1 m. Kääb (Reference Kääb2005) showed that producing a DEM of coarser resolution than the original stereo image can decrease errors and data voids within the DEM. Initially DEMs at 0.5 m resolution were also generated but the level of detail on such a heterogeneous surface made classification of processes and identification of features more difficult than in the 1 m DEM, due to the increased soothing of the 1 m DEM. The DEMs were manually edited prior to geocoding, any erroneous elevations from areas delineated as lakes. Available check-points, collected in 2006, 2010 and 2014 using a Leica Geosystems 1200 differential GPS (dGPS), were not used in DEM generation due to a locational bias of points (Fig. 3), but were used subsequently in an assessment of the generated DEMs. The DEMs were geocoded based on the supplied RPCs, yielding a geopositioning accuracy of close to 0.10 m (0.2 pixels) in planimetry and 0.25 m (0.5 pixels) in height in tests (Frazer and Ravanbakhsh, Reference Frazer and Ravanbakhsh2009).
Initial difference map from 2010 to 2012 used to identify areas of off-glacier stable ground for DEM co-registration; areas classified as no data are shown in white. The glacier area and suitable stable areas are highlighted, with the additional location of the >6000 off-glacier check points. Adjustments for 2010–2012 were x = +1.2, y = −3.8, z = −0.1 and based on the initial difference map for 2012–2015, x = −0.4, y = +5.3, z = +3.0.

3.2. Planimetric and vertical adjustments
A series of steps was followed to accurately detect glacier surface elevation changes for the periods 2010–2012 and 2012–2015, largely following the procedures set out by Nuth and Kääb (Reference Nuth and Kääb2011). Firstly, inconsistencies in the geolocation of the DEMs were detected and corrected. This step is vital as a small horizontal offset between two DEMs can produce a large elevation error where the local slope is steep, as is often the case on debris-covered glaciers (Berthier and others, Reference Berthier, Arnaud, Baratoux, Vincnet and Rémy2004). Both the correlation analysis and check-point comparison gave better results for the 2012 DEM than the others, so we chose to adjust the position of the 2010 and 2015 DEMS to the 2012 DEM. The adjustment is based on a characteristic relationship between the residuals of the elevation difference and the elevation derivatives of slope and aspect of two DEMs that are not perfectly aligned (Kääb, Reference Kääb2005). This relationship is precisely related to the x–y shift vector between them, such that
 $${\rm d}h = a \cdot \cos \;(b - {\rm \Psi} ) \cdot \tan \;(\alpha ) + \overline {{\rm d}h} $$
where dh is the individual elevation difference, a is the magnitude of horizontal shift, b is the direction of shift, α is the terrain slope, Ψ is the terrain aspect and $\overline {{\rm d}h} $
is the overall elevation bias between the two DEMs (Kääb, Reference Kääb2005). The equation is applied to off-glacier areas, assumed to be areas of little or no change in surface elevation. To provide a successful correction, off-glacier areas were carefully identified to exclude zones of debris slumping, rock fall or erroneous data values, most common in steeply sloping areas. The horizontal shift was determined by minimising the RMSE of the chosen elevation differences using iterative shifting of the DEM until improvement in the SD of the off-glacier pixel values was <2% (Nuth and Kääb, Reference Nuth and Kääb2011). The correction improved the SD of the difference value of the off-glacier area by 24% (2010–2012) and 74% (2012–2015). We investigated the elevation dependent bias but there was no clear relationship between bias and elevation, and the magnitudes are not enough to attempt a correction (Nuth and Kääb, Reference Nuth and Kääb2011). In addition, we investigated the presence of along/cross track bias, associated with the satellite acquisition geometry but no bias could be identified.
$\overline {{\rm d}h} $
is the overall elevation bias between the two DEMs (Kääb, Reference Kääb2005). The equation is applied to off-glacier areas, assumed to be areas of little or no change in surface elevation. To provide a successful correction, off-glacier areas were carefully identified to exclude zones of debris slumping, rock fall or erroneous data values, most common in steeply sloping areas. The horizontal shift was determined by minimising the RMSE of the chosen elevation differences using iterative shifting of the DEM until improvement in the SD of the off-glacier pixel values was <2% (Nuth and Kääb, Reference Nuth and Kääb2011). The correction improved the SD of the difference value of the off-glacier area by 24% (2010–2012) and 74% (2012–2015). We investigated the elevation dependent bias but there was no clear relationship between bias and elevation, and the magnitudes are not enough to attempt a correction (Nuth and Kääb, Reference Nuth and Kääb2011). In addition, we investigated the presence of along/cross track bias, associated with the satellite acquisition geometry but no bias could be identified.
The three optical stereo images pairs were acquired in June 2010, December 2012 and January 2015. Changes in surface elevation or ice mass derived from the three DEMs are reported over their relevant time periods. Annual rates of change were calculated only for the December 2012 to January 2015 period, assumed to represent 2 balance years. Glacier perimeters and ponds were manually digitised in each of the images. The bathymetry data were all collected in early December. Because little lake expansion occurs in the winter months, each survey is expected to be representative of the lake at the end of the preceding ablation period.
The DEMs also allowed automatic orthorectification of the multispectral imagery. This was used to delineate a precise glacier area and identify other features of interest on the glacier surface. Identifying the margin of debris-covered glaciers is a common issue in both remote sensing and field surveys, as debris layers can obscure the extent of underlying ice (Bolch and others, Reference Bolch, Buchroithner, Pieczonka and Kunert2008). The ablation zone of Ngozumpa Glacier is flanked by lateral moraines, and the topographic lows at the base of the ice-proximal slopes of the moraines were adopted as a convenient and consistent choice of glacier limit. The GeoEye-1 (9 June 2010 and 23 December 2012) and WorldView-3 (5 January 2015) optical imagery (Table 1) were used in combination with the corresponding DEM to estimate the ice-moraine boundary for the whole ablation area. For each dataset, classification of supraglacial lakes was conducted manually, because variability in suspended sediment concentration, frozen and unfrozen lake surfaces and variable snow cover both within and between images precluded automatic classification. In addition, lake-perimeter length, lake area and their evolution through the intervening period (areal expansion/reduction, drainage/filling) were recorded. Where possible, the top of the ice cliffs was delineated using a combination of DEM elevations and slope and aspect characteristics (Fig. 4). Slope measured in degrees was calculated for each cell deriving the maximum rate of change in elevation from that cell to its neighbors, the maximum change in elevation over the distance between the cell and its eight neighbors identified the steepest downhill descent from the cell. Aspect was calculated in a similar way, identifying the downslope direction of the maximum rate of change in value from each cell to its neighbors. Aspect was measured clockwise (°) from 0° (due north) to 360° (again due north), flat areas have no downslope direction. Aspect of an individual ice cliff was then classified as North (315°–45°), East (45°–135°), South (135°–225°) or West (225°–315°) based on the mean aspect of the area identified. Length, maximum height, aspect and persistence through consecutive datasets were recorded.
Identification of ice cliffs from the 2012 DEM and derived DEM slope and aspect. Maximum height was derived from the DEM, length from the DEM and slope. Aspect was identified from the derived aspect and classified as flat, north, south, east or west based on the mean value (°).

3.3. Assessment of errors
Error or uncertainty in surface elevation changes depends on both the quality of the DEMs and their co-registration. Over 6000 off-glacier dGPS points collected between 2006 and 2014 (Fig. 3) were used to estimate the RMSE z . by extracting the elevation values from each DEM at the location of each point. The nominal accuracy of the post-processed dGPS data is ±1 cm in the horizontal and ±2 cm in the vertical. This gives RMSE z values of 1.9, 1.4 and 2.3 m for the 2010, 2012 and 2015 DEMs, respectively. However, we cannot take into account the error in the x, y location. In light of this, we focus on an accurate assessment of the uncertainty in the elevation difference values derived from the co-registered DEMs. A first estimate of the uncertainty of the DEM differencing results can be derived from the SDof the off-glacier areas. However previous studies suggest this will likely overestimate errors (Berthier and others, Reference Berthier2007; Bolch and others, Reference Bolch, Pieczonka and Benn2011). We follow Bolch and others (Reference Bolch, Pieczonka and Benn2011) in using the standard error (SE) and the mean elevation difference (MED) of the non-glaciated area as an estimate of error, where SE is calculated from the SD of the off-glacier differences σ sg and the number of pixels n used
 $${\rm SE} = {\rm \;} \displaystyle{{\sigma _{{\rm sg}}} \over {\sqrt n}} $$
and the error E is calculated by
 $$E = {\rm \;} \sqrt {{\rm S}{\rm E}^2 + {\rm ME}{\rm D}^2} \;. $$
Surface elevation changes on the glacier were converted into ice volume change by summing the difference between DEMs for areas of interest. Volume change errors were calculated by multiplying the error E by the area over which the volume change occurs (Barrand and others, Reference Barrand, James and Murray2010; Bolch and others, Reference Bolch, Pieczonka and Benn2011).
3.4. Sonar data 2009, 2012 and 2014
Bathymetric surveys were conducted on Spillway Lake in early December 2009, 2012 and 2014 when the lake surface was frozen. In each case the lake perimeter and any adjoining ice cliffs were mapped using Leica Geosystems 1200 dGPS, recording points at 2 m intervals in kinematic mode. All data were post processed to a base station located on the eastern side of the glacier (27.941 N, 86.719 E; 4648 m a.s.l.). Bathymetric measurements were made using a Hummingbird 385ci echo-sounder deployed through the frozen lake surface and located using the dGPS. Good contact between the sonar transceiver and the lake surface was achieved by wetting the ice prior to each measurement. The accuracy of the sonar measurements was regularly assessed by chipping through the frozen lake surface and comparing the depth measurement from the echo sounder at the ice surface and the water surface (including the ice thickness) with that of a weighted line. Maximum difference between the results of the two methods was ~1%. Each survey consisted of a quasi-regular grid of ~15 m spacing, but with closer spacing in areas with high-depth variability. A bathymetric map was derived for each survey by interpolating the depth measurements in a GIS package using a natural neighbor interpolation, which ensures the preservation of all measurement points. The interpolations were constrained by the relevant lake perimeter outline set to a depth of 0 m. The interpolated bathymetry maps were each re-sampled to 1 m pixel size to allow better incorporation into the relevant DEM by mosaic.
3.5. Velocity measurements
Glacier surface velocities were derived using feature tracking between synthetic aperture radar images acquired by the TerraSAR-X satellite on 19 September 2014 and 18 January 2015 (Table 1) (e.g. Luckman and others, Reference Luckman, Quincey and Bevan2007). The method searches for a maximum correlation between evenly-spaced subsets (patches) of each image giving the displacement of glacier surface features, which are converted to speed using time delay between images. Image patches were ~400 m in size and sampled every 40 m producing a spatial resolution of between 40 and 400 m depending on feature density. Estimated precision is ~0.015 m d−1.
4. RESULTS
Between 2010 and 2015 substantial changes in surface elevation were measured over the area covered by the three DEMs (Fig. 5). Between June 2010 and December 2012, overall volume losses were 50.8 ± 2.2 × 10⁶ m3; and between December 2012 and January 2015, 31.8 ± 5.7 × 10⁶ m3. When aggregated over the whole area, this indicates mean surface lowering of 2.9 ± 0.13 m and 1.8 ± 0.33 m, respectively, implying an annual rate of 0.92 ± 0.33 m a−1 for the latter period. However substantial variability in both spatial pattern and magnitude of elevation change is evident in both DEM difference maps. On the basis of the visual appearance in optical imagery and the DEM difference maps, we define six morphometric categories: (1) areas where surface elevation change is influenced by glacier movement (2) ice cliffs, (3) debris-covered ice, (4) lateral moraines and ice-marginal troughs, (5) perched lakes (6) Spillway Lake. These are discussed in turn below.
Final DEM differences between (a) June 2010 and December 2012 and (b) December 2012 and January 2015, regions classified as no data are shown in white. The scale shows the difference in elevation between the two images with the blue positive numbers indicating areas of elevation increase and red negative numbers indicating elevation decrease. The location of delineated ice cliffs and lake perimeters are also illustrated.

4.1. Dynamic vs. mass change
Ice velocities on the glacier tongue for September 2014–January 2015 are shown in Figure 6a. Both the western (Cho Oyu) and eastern (Gyachung Kang) branches of the glacier have maximum velocities of ~0.1 m d−1 for the 2014/15 autumn–early winter period, equivalent to annual speeds of 36 m a−1. The two branches appear to be dynamically disconnected, and the main tongue is fed by the western tributary only. Velocities diminish down-glacier, falling to <0.015 m d−1 (~5 m a−1) 7 km from the terminus. Below this point, measured speeds are indistinguishable from error and the glacier is essentially stagnant.
(a) Velocity map derived using feature tracking between synthetic aperture radar images acquired by the TerraSAR-X satellite on 19 September 2014 and 18 January 2015. (b) The inactive lower ablation area, with the location of delineated ice cliffs and lake perimeters from each of the 3 years of investigation, highlighting patterns of elevation change associated with: a – ice cliff retreat, b – distance from terminus, c – the glacier margins, d – apparent uplift of debris covered areas, e – changes in lake level.

Both DEM difference maps show a marked transverse striped pattern on the dynamically active part of the glacier tongue at distances >7 km from the terminus (Fig. 5). The striping consists of areas of surface lowering alternating with regions of apparent uplift, with values up to ±50 m. We interpret the striped pattern as the result of displacement of surface topography down-glacier by ice flow, superimposed on elevation changes due to mass loss. The striping is absent from the lower, stagnant part of the tongue. On the basis of the velocity map and the striping pattern, we define a boundary between active and inactive parts of the glacier (Fig. 6a). For the lower stagnant part, we calculated volume changes associated with different processes, such as ice cliff retreat and melt of debris-covered ice. We did not attempt this for the dynamically active part, due to the difficulty of accurately separating dynamic and mass-balance components of elevation change.
Total volume loss in the area affected by ice motion is 40.1 ± 1.5 × 10⁶ m3 and 24.7 ± 3.3 × 10⁶ m3 for 2010–12 and 2012–15, respectively. The lower stagnant region covers an area of 5.6 km2, and has undergone volume losses of 10.6 ± 0.7 × 10⁶ m3 and 7.1 ± 1.8 × 10⁶ m3 for the periods 2010–2012 and 2012–2015, respectively. When aggregated over the areas, mean surface lowering for the entire period in the upper portion of the glacier is substantially greater (5.4 m) than in the lower region (3.1 m). In the following paragraphs, we focus on the stagnant, lower 7 km of the ablation area (Fig. 6b).
4.2. Ice cliffs
Cliffs of bare ice were manually delineated on the basis of their optical characteristics and steep slope. Over 100 individual ice cliffs were identified in the lower ablation area in 2010, with a total top of ice cliff length of 10.5 km. Both number and total length reduced to 65 individual cliffs in 2012 with a total top of ice cliff length of 9 km, and to 42 cliffs with a total top of ice cliff length of 7 km by 2015. 75.3% of ice cliffs mapped in 2010 bordered a supraglacial lake or pond. The mean height of ice faces was 15.5 m but the maximum was substantially higher at ~45 m. 44.8% of the identified ice cliffs in 2010 were north-facing and only 10.5% south-facing. East- and west-facing accounted for 20.9 and 23.8%, respectively. Little difference was measured in mean height across all aspects but the maximum height of 45 m was measured on a south-facing cliff (all other aspects have a maximum of 30 m). In addition, 40% of the ice cliffs facing north, east and west persist in some form and were identifiable in both the 2012 and 2015 orthorectified images, but only 18.2% of those facing south persisted throughout the study period.
The DEM difference maps show that the largest observed surface elevation changes occur at ice cliffs, with typical surface lowering of 20–50 m (Figs 6b, 7). This lowering results from rapid backwasting of exposed ice faces, often but not always in contact with supraglacial ponds or lakes. Throughout the lower ablation area, backwasting of ice cliffs accounted for volume losses of 4.3 ± 0.03 × 10⁶ m3 and 3.2 ± 0.07 × 10⁶ m3 in 2010–2012 and 2012–2015, respectively. Backwasting affected ~5% of the glacier area but contributed over 40% of the total volume lost.
High-magnitude elevation changes over small area changes are observed between ice cliffs of consecutive datasets. Elevation profiles (a) and (b), extracted from each of the three DEMs, illustrate the magnitude of ice cliff retreat.

4.3. Debris-covered ice
Areas of debris-covered ice are characterized by rough, heterogeneous surface textures and slopes <25° (based on DEM derived slopes). These areas typically experienced low magnitude elevation lowering during both periods, interpreted as sub-debris ice melt or surface lowering (Fig. 6b). These areas cover much of the lower ablation area outside of the areas classified as rapidly retreating ice cliffs, lakes formation and drainage and channel subsidence. Total surface lowering of 0.5–5 m occurred over the 4.5 a period of investigation, with increasing magnitude with distance from the terminus (Figs 6b, 8). Within 1 km of the terminal moraine lowering was between 0.5 and 1 m (Fig. 8, profile c), increasing to a maximum of ~5 m close to the northern extent of the study area (Fig. 8, profile a).
Elevation profiles a, b and c, located in Figure 6b at b1, b2 and b3, respectively, extracted from the 3 DEMs illustrate that this pattern of mass loss typically increases with distance from the terminus.

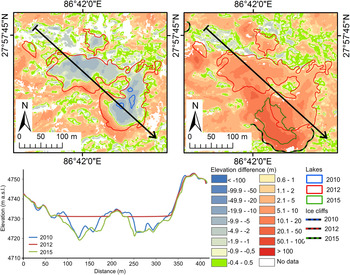
Areas of elevation increase were also identified on the stagnant lower tongue of the glacier (Fig. 6b). These are of two types: (1) increases in the elevation of debris-covered ice in a topographic low (Fig. 9); and (2) increase in the level of a supraglacial lake (Section 4.5). On actively flowing glaciers, uplift can also be caused by ice-dynamic factors such as compressive flow. However, the observed areas of uplift are in stagnant ice far down-glacier of the actively-flowing part (Fig. 6b), so this process can be ruled out.
Areas of elevation increase, in the absence of glacier lakes, were identified to persist across the difference map 2010–2015. The extracted DEM values across profile a illustrates the process of debris re-distribution downslope, while profile b suggests an increase due to debris infilling of a topographic low point.

Areas of elevation increase in debris-covered areas are typically bounded by relatively steep slopes exhibiting surface lowering. Elevation profiles from the three DEMs show that the pattern of elevation change is consistent with re-distribution of surface debris (Fig. 9). In places, downslope translation of transverse ridge-trough features could be detected in areas of elevation increase, supporting the interpretation that they record redistribution of surface debris. Debris redistribution is particularly evident below retreating, non-calving ice cliffs and in some cases, infilling of topographic lows resulted in >6 m of elevation increase (Fig. 9, profile b). Areas of elevation increase cover ~10% of the lower ablation area, suggesting that even where the debris layer is continuous and relatively thick there is noticeable re-distribution of surface debris. Areas of elevation increase were included in the estimate of volume loss due to surface lowering and reduced the total volume loss by sub-debris melt by ~14%. Debris-covered ice occupied 75–89% of the lower ablation area, and sub-debris melt contributed ~5.2 ± 0.5 × 10⁶ m3 and 4.3 ± 1.5 × 10⁶ m3 to volume loss over the two consecutive periods.
4.4. Lateral moraines and ice-marginal troughs
Most of the lower tongue is bounded by lateral moraines that stand up to 150 m above the adjacent glacier surface. The ice-distal slopes of the moraines exhibit little or no elevation change, consistent with their stable, vegetated appearance in the field. In contrast, the ice-proximal slopes typically show large reductions in elevation, with localized areas of uplift (Fig. 5). In the field, these slopes consist of unvegetated, unconsolidated till, which undergoes active erosion by a range of processes including rockfall and rotational landslipping (Benn and others, Reference Benn2012). The observed patterns of elevation change are consistent with slope retreat and block displacement. Crestline retreat rates are up to 20 m in isolated locations, with an overall mean of 0.5 m a−1. The total volume lost (2010–2015) from the moraines is 2.8 ± 0.6 × 10⁶ m3.
Despite this large loss of mass from the ice-proximal slopes of the moraines, we do not observe a corresponding increase in surface elevation at the base of the slopes. Instead, linear troughs extend along both margins of the glacier at the base of the moraine slopes, with surface lowering of 6–9 m over the whole period of study (Figs 6b, 10). Elevation profiles across the trough and moraine slope show a steep slope from the glacier towards the margin, with the greatest surface lowering at the lowest point of the trough (Fig. 10). Debris eroded from the overlying moraine slopes must have been transferred into the trough, implying that subsidence has occurred along both margins of the glacier. Linear zones of subsidence have been observed on Ngozumpa Glacier prior to our study, and shown to be associated with surface collapse into englacial conduits (Gulley and others, Reference Gulley, Benn, Luckman and Müller2009; Benn and others, Reference Benn2012; Thompson and others, Reference Thompson, Benn, Dennis and Luckman2012). We conclude that sub-marginal conduits extend along both margins of Ngozumpa Glacier, and that these undergo episodic enlargement and collapse. Lateral streams could also transport sediment, contributing to mass loss from the troughs.
An enhanced surface lowering signal is observed towards the margins of the glacier over the entire period. Extracted elevation profiles from each of the DEMs illustrate surface lowering at the topographic low point >10 m. Substantial displacement in the lateral moraine is also evident particularly in profile b.

We estimate the implied internal ablation along the lateral margins by summing the volume losses in the trough and adjacent moraine, for the area between 1.5 and 7 km from the terminus on both margins where the troughs are most clearly defined. For the whole period (2010–2015), moraine volume loss was 2.8 ± 0.6 × 10⁶ m3 and trough volume losses were 0.36 ± 0.05 × 10⁶ m3. Losses for 2012–2015 are 0.7 ± 0.32 × 10⁶ m3 (moraine) and 0.11 ± 0.03 × 10⁶ m3 (trough), with a total implied annual mass loss of ~0.4 ± 0.035 × 10⁶ m3. Because this figure encompasses any sediment flushed out of the system via the lateral streams, it represents a maximum estimate of internal ice ablation.
4.5. Perched lakes
Over the period of investigation, the total area classified as perched supraglacial lakes in the lower ablation area underwent a decrease from 1.8 × 10⁵ m2 in 2010 through 1.6 × 10⁵ m2 in 2012 to 1.4 × 10⁵ m2 by 2015. The June acquisition date of the 2010 image, falling within the early monsoon and ablation season, makes it difficult to assess the significance of this trend, however, because there may be seasonal cycles of lake expansion and contraction (Fig. 11). Of the 120 supraglacial lakes identified in the lower ablation area in 2010, 74 were evident in some form in 2012, and 32 new lakes were added. In 2015, 64 of the 106 lakes identified in 2012 were visible, 54 lakes remained and 12 additional lakes were identified. It is likely that lakes also formed and drained in between the image acquisitions. Surface elevation changes in areas identified as lakes or ponds (excluding area of change attributed to backwasting at the perimeter of lakes or ponds) indicate a net loss of stored surface water of 0.58 ± 0.02 × 10⁶ m3 in the period 2010–2012 and 0.53 ± 0.05 × 10⁶ m3 between 2012 and 2015.
Differences in elevation relating to supraglacial lake formation and drainage were identified. The 2010–2012 difference map and extracted DEM profile shows an increase in surface elevation associated with the filling of a topographic low with melt water; the resulting lake is evident in 2012. By 2015 this lake has largely drained and the 2012–2015 difference map shows a region of elevation lowering. The elevation difference between 2010 and 2015 in the DEM profile also suggests melting at the bed during lake occupation.
4.6. Spillway Lake
The three Spillway Lake surveys illustrate a reduction in the areal extent of the base level Spillway Lake, from 3.0 × 10⁵ m2 in 2009 to 2.5 × 10⁵ m2 in 2012 and 2.4 × 10⁵ m2 in 2014 (Fig. 12). Some areas of lake expansion occurred (e.g. in the chain of lakes in the western part of the complex (1 in Fig. 12), and towards the elongated lake at the eastern lateral margin (3 in Fig. 12), but these were more than offset by loss of lake area in the central part (2 in Fig. 12)). This net loss of lake area is marked in contrast to the 2001–2009 period, during which lake area increased by ~10% a−1 (Thompson and others, Reference Thompson, Benn, Dennis and Luckman2012). In the area surveyed in all 3 years, the lake also underwent a reduction in volume, from 11.3 × 10⁴ m3 in 2009 to 10.3 × 10⁴ m3 in 2012 and 9.5 × 10⁴ m3 in 2014.
The evolution of the base level Spillway Lake from 2009 to 2014, illustrating lake area, lake bathymetry and ice cliff position. The inflow close to profile d in the 2009 map is the location of an upwelling identified in 2001 (Benn and others, Reference Benn, Wiseman and Hands2001). The inflow into the north-eastern basin evident in all three maps evolved from a conduit exiting into the lake in 2009 to a sub-aerial meltwater stream in 2010 and 2014. The inflow into the western margin of the lake in 2014 is the site of an upwelling. The photo insert from 2012 provides evidence for lake level change, the location of the image is shown by the green star in the 2012 bathymetric map. Each of the four profiles a, b, c and d corresponds to the arrows on the map and are represented in the same directions. The dashed line illustrates the water level of the subaqueous areas: 1 – Northward expansion and coalescence of ponds, 2 – Substantial reduction of lake area. 3 – Lateral pond connection to the main lake system.

The bathymetry surveys from 2012 and 2014 show a complex pattern of lake evolution, with areal expansion and deepening in some locations but reductions in both area and depth in others. Contrasting patterns of depth change are illustrated using four cross profiles through the Spillway Lake complex (Fig. 12).
-
(1) The small lake to the southeast of the main Spillway Lake (‘Blue Lake’) has no identifiable inflow and stable low-gradient shorelines, and has remained stable in areal extent since, first identified in 1984 (Thompson and others, Reference Thompson, Benn, Dennis and Luckman2012). The bathymetric profiles for 2009 and 2012 are essentially identical (Fig. 12, profile a), indicating no substantial change in lake depth. Small differences between the profiles may have resulted from interpolation errors. (Only a partial survey was conducted in 2014 due to unfavorable ice conditions.)
-
(2) Profile b (Fig. 12) is in the southern part of the Spillway Lake complex, most of which underwent little change in shoreline position from 2009 to 2014. Along most of the profile, depth differences are small and may be due to interpolation errors. At the northern end of the profile, however, two basins underwent shallowing by up to 4 m between 2012 and 2014. The pattern of shallowing is consistent with sediment infilling. Because there are no identifiable local sources of sediment on the stable lake shorelines, the most likely source is suspended silt and sand transported by through-passing meltwater.
-
(3) Profile c (Fig. 12) crosses the central basin of the lake system from west to east, and illustrates an area of substantial change in both the subaerial and subaqueous surfaces. Backwasting of large ice cliffs caused slope retreat at each end of the profile, and the disappearance of a promontory in the center. Conversely, infilling of lake basins occurred adjacent to the former ice cliffs. The pattern of infilling is consistent with deposition of local supraglacial debris from retreating ice cliffs. In addition, a drop in lake level, on the order of 1.5 m was observed between 2009 and 2012.
-
(4) Profile d (Fig. 12) traverses the northern and central parts of the Spillway Lake complex from northwest to southeast. Backwasting of subaerial ice cliffs is evident at both ends of the profile. In addition, a high point on the lake floor in the southern part of the profile disappeared between 2009 and 2012, possibly reflecting subaqueous calving at the base of the subaerial ice cliff. The northern lake basin displays a localised area of shallowing, again consistent with deposition of local supraglacial debris from retreating ice cliffs. This basin also experienced a drop in lake level of ~1 m between 2009 and 2012 but regained the 2009 level by 2014. This is linked to the connection between two lake basins, which narrowed from 25 to 35 m in 2009 to a rocky channel <5 m wide in 2012, then vanished completely by 2014. The central part of the profile displays emergence of the lake bed above lake level, relating to a lake level drop of 1 m between 2009 and 2012 and a further 1.5 m drop towards the south eastern extent between 2012 and 2014.
5. ANALYSIS AND DISCUSSION
The results presented above reveal patterns and rates of mass loss on a stagnant, debris-covered Himalayan glacier tongue in unprecedented detail. Rates of mass change have been quantified for well-known processes, such as backwasting and sub-debris melt of debris-covered ice, and also for hitherto poorly known processes, such as sediment redistribution, internal ablation and depth change in supraglacial lakes. Taken together, these data provide a detailed portrait of current state of the glacier, and a greatly improved understanding of the key processes that will determine its future evolution.
5.1. Mass-balance gradients
Inverted ablation gradients, in which melt rates decrease with elevation in the lower ablation zone, have long been recognised as a fundamental factor underpinning the unique response of debris-covered glaciers to climate change (Benn and Lehmkuhl, Reference Benn and Lehmkuhl2000; Berthier and others, Reference Berthier2007; Scherler and others, Reference Scherler, Bookhagen and Strecher2011; Benn and others, Reference Benn2012; Rowan and others, Reference Rowan, Egholm, Quincey and Glasser2015). The data presented in this paper allow the first detailed measurements of this important glaciological variable for a Himalayan debris covered glacier.
To assess the relationship between surface elevation change and glacier altitude the lower ablation area was divided into 50 m long sections, extending across the width of the glacier. The total volume change by both melting of debris-covered ice and ice cliff backwasting was calculated, together with the associated glacier areas (Fig. 13). For the actively flowing part of the ablation area, total mass loss was calculated for 300 m long sections; this is approximately two wavelengths of the striping pattern, and thus should eliminate the effect of glacier movement on patterns of elevation change (Fig. 5).
Relative contributions to volume change from ice cliff retreat, lake change and sub-debris melt for the whole investigation period across the lower ablation area. Note there is a clear increase in the contribution from sub-debris melt with distance from the terminus, this is noticeably lacking in the contribution from lakes of backwasting.

For the period December 2012–January 2015 (assumed to represent 2 balance years), the mass losses by sub-debris melt were converted into mean annual rates and a mass-balance gradient calculated from linear regression (Cogley and others, Reference Cogley2012). Even though the surface lowering shows an increase with elevation (Fig. 13), total surface lowering exhibits a much more complex and heterogeneous pattern, with no clear relationship between mass loss and elevation or distance from the terminus (Fig. 14b). At higher elevations, the addition of backwasting processes results in a highly irregular balance gradient, with local peaks of up to 2.2 m w.e. a−1 of ice loss (assuming an ice density of 900 kg m−3) (glacier-wide mean). It is clear that the overall distribution of ablation on the glacier is very sensitively dependent on the distribution of ice faces and their persistence through time.
(a) The theoretical modeled ablation balance for Ngozumpa Glacier (from Benn and others, Reference Benn2012). The blue box highlights the zone of the gradient shown in (b). (b) The total annual ablation gradient for the lower ablation area is calculated from the DEM difference maps. The ablation gradients shown in (b) are calculated assuming an ice density of 900 kg m−3.

5.2. Backwasting of ice cliffs
The heterogeneity in surface elevation change and ablation rate is a direct result of rapid backwasting of exposed ice cliffs, mostly around the margins of supraglacial lakes (Figs 13, 14c). In the lower ablation area this process accounted for ~40% of the observed volume loss over both periods of investigation, although ice cliffs occupy only 5% of the glacier area. It is instructive to compare these results with those of other studies of ablation on debris-covered glaciers. To allow direct comparison we convert reported results to a backwasting-sub-debris melt ratio BDR, which measures the relative rates of the two processes:
 $$ {\rm BDR} = \displaystyle{\matrix{({\rm \%} \;{\rm total}\;{\rm ablation}\;{\rm by}\;{\rm backwasting}/{\rm \%} \;{\rm ice}\;{\rm cliff}\;{\rm area}) \cr {\rm \%} \;{\rm total}\;{\rm ablation}\;{\rm by}\;{\rm sub} - {\rm debris}\;{\rm melt}} \over {\rm \%} \;{\rm debris}\;{\rm covered}\;{\rm area}}.$$
The results are shown in Table 2, and indicate (1) inter-glacier variability in the area covered by ice cliffs and (2) large variations in the ratio between backwasting and sub-debris melt rates. Variability in ice cliff area reflects processes of ice cliff formation and factors determining their persistence. Ice cliffs on debris-covered glaciers have been observed to form by ice exposure from debris slumping, surface subsidence into englacial voids and calving into supraglacial ponds and lakes (Kirkbride, Reference Kirkbride1993; Benn and others, Reference Benn, Wiseman and Hands2001; Sakai and others, Reference Sakai, Nakawo and Fujita2002). On Ngozumpa Glacier >75% of ice cliffs in the lower ablation area bordered supraglacial lakes or ponds in 2010. Factors influencing the development and persistence of ice cliffs on Lirung Glacier were investigated by Sakai and others (Reference Sakai, Nakawo and Fujita2002). They found that melt rates on non-calving ice cliffs depended predominantly on solar radiation and therefore on the orientation of the ice cliff. South-facing cliffs received more shortwave radiation at the top of the cliff than the bottom due to shading. North-facing cliffs receive less shortwave radiation and their energy balance is dominated by long wave receipts, which are greater towards the base. As a result, north-facing ice cliffs tend to be larger, steeper, generally debris free and therefore longer lived than south-facing cliffs. Although initial backwasting could be rapid on south-facing cliffs, ice faces become less steep and, once an angle of <30° was achieved, faces became increasingly debris-covered (Sakai and others, Reference Sakai, Nakawo and Fujita2002). On Ngozumpa Glacier, north-facing ice faces are most common and also persist for much longer than south-facing ice faces, probably for similar reasons.
Volume loss and mean surface lowering for the periods 2010–2012 and 2012–2015

Values for the whole area of investigation, the upper section experiencing ice flow and the lower area of stagnant ice are all included.
The BDR on Ngozumpa Glacier is similar to that on Lirung Glacier found by Sakai and others (Reference Sakai, Nakawo and Fujita2002), but is higher than values determined on Koxkar and Miage Glaciers (Juen and others, Reference Juen, Mayer, Lambrecht, Han and Liu2014; Reid and Brock, Reference Reid and Brock2014; Table 2). High ratios likely reflect the low background sub-debris melt rates in the lower ablation area of Ngozumpa Glacier, in contrast with sites where debris layers are thinner and less continuous (cf. Reid and Brock, Reference Reid and Brock2014). However, high ratios also reflect high backwasting rates, reflecting the importance of calving into supraglacial lakes (Figs 5, 6b, 7). At Koxkar Glacier, China, Han and others (Reference Han, Wang, Wei and Liu2010) reported a mean ice cliff backwasting rate of 7.4 m a−1. A similar value was reported for Tasman Glacier (11 m a−1) before the onset of calving, which increased to 34 m a−1 after full height slab calving onset (Röhl, Reference Röhl2008). At a number of ice cliffs on Ngozumpa glacier, generally those <15 m in height, annual backwasting rates are ~10 m a−1. However, backwasting rates 2–3 times greater were measured in a number of areas (Fig. 5; Table 3).
Reported values for ablation on debris-covered glaciers converted to the backwasting-sub-debris melt ratio by Eqn (4).

Previous work on Ngozumpa Glacier found the threshold for full height slab calving to be an ice cliff height of 15 m, possibly related to the minimum stress gradients required to reactivate relict crevasses (Benn and others, Reference Benn, Wiseman and Hands2001). Thermal under-cutting of ice cliffs at the water line has also been observed to increase stress concentrations and increase ice cliff calving rates (Kirkbride and Warren, Reference Kirkbride and Warren1997; Röhl, Reference Röhl2006, Reference Röhl2008; Benn and others, Reference Benn, Warren and Mottram2007; Sakai and others, Reference Sakai, Nishimura, Kadota and Tekeuchi2009). Under-cutting is accelerated by wind-driven currents, and modeling carried out using ideal landform conditions concluded the onset of calving due to undercutting is controlled by wind driven currents and occurs when the fetch is >80 m (Sakai and others, Reference Sakai, Nishimura, Kadota and Tekeuchi2009). This criterion is met by many of the supraglacial lakes in Ngozumpa Glacier, particularly the base level Spillway Lake, which has potential fetches of several hundreds of meters (Fig. 10). The high backwasting to sub-debris melt ratio at Ngozumpa Glacier, therefore, likely reflects a high proportion of lake-contact ice cliffs, which have higher backwasting rates than non-lake-contact cliffs (Fig. 15). In turn, this may be symptomatic of the stage of retreat of Ngozumpa Glacier, in which thermokarst processes are well advanced.
The location of the top of delineated ice cliffs surrounding the upper basin of Spillway Lake in (a) 2010, (a) 2012 and (a) 2015, overlain on the orthorectified image in each instance. The ice cliff position of previous years is shown in both (b) and (c) to illustrate the change. (d) The evolution of an individual ice cliff from 2009 through 2012, the location of which is marked by the red star in (a) and (b).

5.3. Internal ablation
The measured volume changes along the lateral margins of the glacier imply annual losses by internal ablation and sediment evacuation of 0.4 × 10⁶ m3 (Section 4.4). Here, we compare this figure with calculated internal ablation rates due to drainage of supraglacial lakes and loss of potential energy by runoff of meltwater.
Over the 2012–15 period, there was an annual net loss of water from supraglacial lakes of 0.26 × 10⁶ m3. The volume of internal melt caused by drainage of this water through englacial conduits can be calculated, on the assumption that all water was reduced from its initial temperature to 0°C during its passage through the glacier. Observed surface temperatures of Himalayan supraglacial ponds lie in the range, 0.7–6.6°C, with a mean of ~3°C (summer and early autumn; Wessels and others, Reference Wessels, Kargel and Kieffer2002; Sakai and others, Reference Sakai, Nishimura, Kadota and Tekeuchi2009). The ice mass M l that draining lake water can melt is:
 $$M_{\rm l} = M_{\rm w}{\rm d}T{\rm \;} \left( {\displaystyle{C \over L}} \right),$$
where M w is the water mass, dT the temperature drop to the melting point, C the specific heat capacity of water (4.2 kJ kg−1 K−1) and L the latent heat of melting (334 kJ kg−1 K−1). This shows that 0.26 × 10⁶ m3 (2.6 × 10⁸ kg) of water can melt 7300 m3 (6.5 × 10⁶ kg) of ice for a temperature drop of 2°C, and 18 200 m3 (16.3 × 10⁶ kg) of ice for a temperature drop of 5°C. This calculation represents a minimum for internal ablation by this process during the study period because it only includes the net volume of surface lake water lost from the glacier, and not the total flux of water through the supraglacial lakes. This could be much larger than the net change, as some lakes may have experienced episodes of filling and drainage between the dates of our images.
Internal ablation by potential energy losses during meltwater runoff M r can be calculated from:
 $$M_{\rm r}{\rm \;} = \displaystyle{{\sum {M_{\rm m}g\;{\rm d}H}} \over {\rho _{\rm i}L}}{\rm,} $$
where M m and dH are the meltwater mass and elevation above base level for successive sections of the glacier (cf. Oerlemans, Reference Oerlemans2013). Taking the annual mass losses for 2012–2015, this yields an annual internal melt volume of ~115 000 m3. Combining this with the previous values of 7300 to 18 200 m3 for internal ablation by lake drainage, the total annual internal ablation is ~0.12–0.13 × 10⁶ m3. This compares well with the measured volume loss, 0.4 × 10⁶ m3 in the lateral moraine/trough systems, which represents a combination of internal ablation and sediment evacuation.
The estimated internal ablation is small, compared with the total volume losses across the lower ablation area, but this process exerts a major influence on the evolution of the glacier. The collapse of englacial voids can form new supraglacial lake basins and determine patterns of lake expansion (Benn and others, Reference Benn2012; Thompson and others, Reference Thompson, Benn, Dennis and Luckman2012). Furthermore, sediment evacuation may have important consequences for the evolution of Spillway Lake, as discussed in the following section.
5.4. Spillway Lake: implications for evolution of base level lakes
Spillway Lake underwent a period of dramatic expansion between 2001 and 2009, when an area of 3 × 10⁵ m2 and a volume of 2.2 × 10⁶ m3 (covering 85% of the area) was attained (Thompson and others, Reference Thompson, Benn, Dennis and Luckman2012). In comparison, the period covered by the present study (2009–2014) is one of relative quiescence (Fig. 16b). Interruptions in the growth of base-level lakes have been observed on other Himalayan glaciers. For example, both Tsho Rolpa and Lugge Tsho went through similar cycles of rapid areal expansion punctuated by a period of shrinkage or very slow expansion (Sakai and others, Reference Sakai, Nishimura, Kadota and Tekeuchi2009; Fig. 16a). Our data allow the causes of the reversal at Spillway Lake to be examined in detail. Two main processes can be identified: (1) reduction in the number of ice cliffs around the lake periphery and (2) deposition into the lake. These two processes appear to have been closely linked, and together acted to reduce both the expansion rate and volume increase of the lake.
(a) shows the areal extent of Spillway Lake in the context of a number of other glacial lakes in the region. The pattern of rapid expansion punctuated by periods of relative quiescence is evident on a number of other lakes adapted from Thompson and others (Reference Thompson, Benn, Dennis and Luckman2012); Sakai and others (Reference Sakai, Nishimura, Kadota and Tekeuchi2009). (b) The rapid increase in Spillway Lake area from the late 1990s to 2010 and more recent period of quiescence from 2010 to 2014. The reduction in area is largely related to a drop in lake levels.

Mean debris cover thickness on the lower Ngozumpa Glacier is 1.8 m with a maximum of >7 m (Nicholson, Reference Nicholson2005). Thus, melting and calving of ice cliffs around Spillway Lake transfers substantial volumes of debris from the top of the cliffs into the lake. Accumulation of debris at the base of ice cliffs can separate the ice cliff from the lake, switching off calving and halting lake expansion. Spillway Lake is an important sink for fine-grained sediment transported from up-glacier. The bathymetric profiles shown in Figure 12 suggest sedimentation rates up to ~1 m a−1 in basins that do not receive direct debris input from the adjacent slopes. High-sedimentation rates are consistent with the evacuation of sediment from the lateral margins of the glacier, as noted in Section 4.4. We conclude that sediment redistribution can act as an important brake on the growth of supraglacial base-level lakes, delaying their transition to full-depth lakes. In addition, parts of Spillway Lake dropped in elevation during the study period. The pattern and magnitude of lake level change indicated the adjustment of lake basins more recently integrated into the Spillway Lake complex to the hydrological base level.
5.5. Evolution of the glacier
Our results catch Ngozumpa Glacier at a key moment in its evolution. Benn and others (Reference Benn2012) proposed that, during periods of negative mass balance, large debris-covered glaciers cross thresholds between three regimes. In Regime 1, the whole glacier is dynamically active, ablation is dominated by sub-debris melting and meltwater is readily evacuated via efficient drainage systems. The transition to Regime 2 occurs when ablation on the lower tongue exceeds influx of ice from up-glacier. Progressive reduction of the ice surface gradient (due to the inverted ablation gradient) results in ice stagnation and retention of meltwater in perched lakes. Melting and calving of bare ice faces becomes increasingly dominant. Regime 3 occurs when the lowering ice surface intersects the hydrologic base level, and rapid ablation occurs by the growth of a base-level lake. Initially, base-level lakes occupy supraglacial positions, but can transition into full-depth lakes that can expand up-glacier by calving (Sakai and others, Reference Sakai, Nishimura, Kadota and Tekeuchi2009).
According to this scheme, Ngozumpa Glacier crossed the threshold into the initial phase of Regime 3 in the 1990s, when Spillway Lake began to form at base level. The lake underwent a period of rapid expansion from 2001 to 2009 (Thompson and others, Reference Thompson, Benn, Dennis and Luckman2012), but since then has undergone a reduction in both area and volume. Such hiatuses in the growth of base-level lakes have been noted before (e.g. Sakai and others, Reference Sakai, Nishimura, Kadota and Tekeuchi2009), but the data presented in this paper provide the first detailed view of their character and possible cause. For Spillway Lake, the key process appears to be redistribution of sediment, both dumping of debris at the base of retreating ice cliffs and deposition of fine sediment transported from up-glacier.
By analogy with other debris-covered glaciers in the Himalaya, it can be expected that Spillway Lake will transition into a full depth lake in the coming years (Sakai and others, Reference Sakai, Nishimura, Kadota and Tekeuchi2009; Thompson and others, Reference Thompson, Benn, Dennis and Luckman2012). Observations on similar glacier systems in New Zealand suggest that buoyant calving may play a major role in this transition, consequent upon a reduction of overburden pressures by surface lowering (Dykes and others, Reference Dykes, Brook and Winkler2010).
6. CONCLUSIONS
The combination of high-resolution optical stereo imagery and lake bathymetry have allowed a detailed assessment of the patterns of mass loss occurring on the lower ablation area of Ngozumpa Glacier. Evolution of the lower ablation area results from a complex suite of processes and feedbacks. Our principal conclusions are as follows.
-
(1) Most mass loss occurs by melt below supraglacial debris, and melt and calving of ice cliffs (backwasting). For the period 2012–2015, annual losses by these processes on the stagnant lower tongue are 2.15 ± 1.5 × 10⁶ m3 and 1.6 ± 0.07 × 10⁶ m3, respectively, accounting for 52 and 39% of total volume loss. Ice cliffs cover ~5% of the area of the lower tongue, but account for almost 40% of the ablation. The implied ratio of backwasting and sub-debris melt rates is at the upper end of values reported in the literature, probably as the result of thick debris cover (low sub-debris melt rates) and rapid calving around lake margins.
-
(2) Subsidence of lateral troughs along both margins of the glacier indicates internal ablation in association with sub-marginal drainage channels. Calculated melt rates yield internal ablation rates >0.1 × 10⁶ m3 a−1, while measured volume changes indicate that internal ablation plus sediment evacuation is 0.4 × 10⁶ m3 a−1, providing an upper bound for internal ablation, accounting for 9% of the total annual glacial ablation.
-
(3) The surface debris layer is subject to frequent re-distribution by slope processes. This can result in large differences in debris-layer thickness, enhancing or inhibiting local ablation rates and encouraging continuous topographic inversion.
-
(4) The base level lake, Spillway Lake is in a period of relative quiescence, following a period of rapid expansion from 2001 to 2009. Reduction in lake area and volume between 2009 and 2015 resulted from lake level lowering and redistribution of sediment from both local and non-local sources (backwasting ice cliffs and suspended sediment transported by melt streams, respectively). Sediment redistribution therefore acts as an important, though likely temporary, brake on lake expansion.
-
(5) It is likely that rapid lake growth will resume in the near future, although it is not possible to make precise predictions due to the complexity of the system and the existence of both positive and negative feedbacks between key processes. Mass loss on the lower glacier averages ~1 m w.e. a−1 (Fig. 12c). Approximately 7.0 × 10⁵ m2 of the glacier has an elevation within 10 m of the hydrological base level. Combined with the 2014 lake area of 2.4 × 10⁵ m2, this suggests lake expansion to an areal extent of 1 km2 within the next 10 a. Because of its low gradient and stagnant nature, if a fully formed moraine dammed lake does develop in the future, it is possible that the lake may eventually become up to 7 km long if the moraine dam remains in place.
-
(6) The lowermost 1 km of the glacier (below Spillway Lake) is largely stable, and very little change was identified over the entire period of investigation. The zone of stability includes the spillway through the western lateral moraine, which has maintained a constant elevation since our first survey in 2001 (Benn and others, Reference Benn, Wiseman and Hands2001). While the developing base level lake remains separated from the terminal moraine by ~1 km, there is unlikely to be any major risk of GLOFs from the glacier.
-
(7) High-resolution stereo imagery is a powerful tool for monitoring volume change on large debris-covered glaciers, allowing quantification of processes not visible on lower resolution imagery and difficult to observe in the field due to the scale and complexity of the terrain.
ACKNOWLEDGEMENTS
This research was supported financially by the University Centre in Svalbard (UNIS), National Geographic Society GRANT #W135-10, The Natural Environmental Research Council and the European Commission FP7-MC-IEF. Thanks to Duncan Quincey and Akiko Sakai for their thorough reviews that greatly improved the manuscript. We thank Joe Alexander, Alia Kahn and Wes Farnsworth for help in the field, Rijan Bhakta Kayastha for invaluable assistance in obtaining the correct permits for work in Nepal, Endra Rai Bahing, Ani Bhattarai and Sujan Bhattarai for logistical support and Lhakpa Nuru Sherpa and all of the staff at the Cho La Pass Resort for fantastic hospitality, logistical support and general assistance in all fieldwork.


 Open access