

1. Introduction
In most developed economies, changes in Social Security pension benefits and public health provisions and the shift from defined-benefit to defined-contribution private pension plans have placed more saving and investment responsibility on households. As a result, individuals have been confronted with increasingly complex financial planning and decisions, while having to navigate a financial landscape of sophisticated products. In such a scenario, it is crucial to know how well-equipped individuals are to deal with complicated financial decisions, how this capability differs across groups in the population, and how people can be helped to make good choices.
Academics and policy makers are interested in acquiring this information, which requires reliable measures of individuals' financial knowledge. Pioneering work by Lusardi and Mitchell (Reference Lusardi and Mitchell2008, Reference Lusardi, Mitchell, Lusardi and Mitchell2011a, Reference Lusardi and Mitchell2011c) has defined a standard approach to measuring financial literacy. In the United States, financial literacy assessment questions have been administered in a number of national surveys: the Health and Retirement Study (Lusardi and Mitchell, Reference Lusardi, Mitchell, Lusardi and Mitchell2011a), the National Longitudinal Survey of Youth (Lusardi et al., Reference Lusardi, Mitchell and Curto2010), the National Financial Capability Study (NFCS) (Lusardi and Mitchell, Reference Lusardi and Mitchell2011b), the American Life Panel (Angrisani et al., Reference Angrisani, Kapteyn and Lusardi2016), and the Understanding America Study (Angrisani and Casanova, Reference Angrisani and Casanova2021). National surveys in more than 15 countries have also used the original Big Three financial literacy questions, designed by Lusardi and Mitchell, and an international survey has collected similar financial literacy information in more than 140 countries (Klapper and Lusardi, Reference Klapper and Lusardi2020).
The available financial literacy measures reveal worrisomely low levels of financial knowledge in the U.S. population at large, with substantial heterogeneity by age, sex, and education (Lusardi and Mitchell, Reference Lusardi and Mitchell2014). Importantly, these measures have been shown to correlate strongly with financial behaviors and outcomes. While a substantial amount of work has examined the contemporaneous relationship between financial literacy and behavior, very little research has investigated how financial literacy changes over time and predicts future financial outcomes. We contribute to the literature in three important ways. First, we collect longitudinal data and document how financial literacy evolves over time. Given the paucity of panel data, this is an important contribution and provides useful insights. Second, we link financial literacy to future financial outcomes in a way that overcomes the reverse causality concerns affecting much of the existing empirical work. Third, we are able to control for a wide range of individual characteristics related to financial knowledge and outcomes that, if omitted, could bias estimates, and to explore heterogeneous effects of financial literacy on financial outcomes by demographics, such as gender, age, and income. It is important to do so, given the many differences observed in micro data across segments of the population.
The identification and estimation of the causal effect of financial literacy on financial outcomes pose important empirical challenges. Individual traits, abilities, and circumstances may impact the likelihood of financial skill acquisition. At the same time, it is plausible to think that these traits and abilities directly affect financial outcomes. Because of this, it is likely that cross-sectional estimates of the effect of financial literacy on financial outcomes suffer from omitted variable bias. The availability of repeated observations on individuals' financial literacy score and financial outcomes permits accounting for this heterogeneity through fixed-effects regressions. However, fixed-effects estimates may still be biased due to reverse causality: Individuals with higher wealth may have more opportunity and more incentives to acquire financial skills. This, in turn, may increase their wealth (Lusardi et al., Reference Lusardi, Michaud and Mitchell2017). Such a mechanism makes it hard to disentangle cause from effect.
In this paper, we examine changes in individuals' financial literacy and outcomes over time. For this purpose, we rely on two waves of the FINRA Foundation's NFCS, which we administered as part of the RAND American Life Panel (ALP) in 2012 and 2018 to a sample of about 1,500 panel members representative of the U.S. adult population.Footnote 1 Repeated observations on the same individuals approximately six years apart allow us to analyze how financial knowledge evolves over time and how levels of financial literacy influence future financial behaviors. Since an individual's financial outcomes in 2018 cannot affect his/her level of financial knowledge in 2012, we can circumvent the reverse causality problem, which, as mentioned above, would potentially bias both cross-sectional and fixed-effects estimates. At the same time, the richness of our data allows us to control for many individual traits and characteristics that may drive financial knowledge and financial outcomes, thereby reducing biases from omitted variables. Thus, with reasonable confidence, we can interpret any observed, significant relationship between financial literacy and financial outcomes as evidence of a causal effect of the former on the latter.
Panel surveys on financial literacy are rare. This paper represents one of the few attempts to collect and analyze longitudinal data on financial literacy and financial outcomes.Footnote 2 Because the NFCS questionnaire provides comparable measures of individuals' financial knowledge and financial behavior, we are able to offer further insights into what shapes household saving and planning, with a specific focus on the role that financial literacy plays in financial decisions and outcomes. While many studies find a positive relationship between financial literacy and financial outcomes in cross-sectional data (Lusardi and Mitchell, Reference Lusardi and Mitchell2014), it is largely unknown whether the gap in financial outcomes between those with low and high financial literacy widens or narrows over time. Such knowledge is crucial for devising and implementing interventions that can effectively improve financial decision making and financial well-being of households, particularly among those for whom resources are relatively scarce and/or financial decisions are affected by psychological and other hurdles.Footnote 3 Thus, our paper can be of importance not only to academics but also to policy makers and the financial and pension industry.
Our data show limited within-individual variation in financial literacy over our six-year window of analysis. On a 0–5 scale, the average level of financial literacy in the panel is 3.53 in 2012 (wave 1) and 3.42 in 2018 (wave 2). Approximately half of the sample have the same financial literacy score in both waves, and for about 90% of study participants, the score in 2018 is within one point of that in 2012. The correlation between financial literacy in 2012 and 2018 is about 70%.Footnote 4 The slight decline in financial literacy score observed in the panel is mainly driven by individuals over the age of 60, a fact that may reflect cognitive aging, which has been shown to affect the level of financial literacy (Finke et al., Reference Finke, Howe and Huston2017), financial decision-making capability more generally (Gamble et al., Reference Gamble, Boyle, Yu and Bennett2015), and actual financial outcomes (Angrisani and Lee, Reference Angrisani and Lee2019).
We regress 2018 financial outcome variables, all of which proxy for different dimensions of financial well-being, on the level of financial literacy observed in 2012. We find that financial literacy has significant predictive power for a set of future outcomes, including household satisfaction with finances, ability to meet unexpected financial needs, and planning for retirement, even after controlling for baseline outcomes. Thus, financial literacy matters for financial decision making and financial security in both the short and medium term.
We also analyze how the relationship between financial literacy and future outcomes varies across distinct demographic groups. This exercise suggests heterogeneity, with financial literacy affecting financial outcomes relatively more for older individuals, for women and for those with lower income. In view of the strong contemporaneous correlation between financial literacy and financial outcomes found in previous studies, our results indicate not only that individuals with higher financial literacy have better current financial well-being but also that their well-being will differentially improve in the future. Since we find that financial literacy is relatively constant at young and middle ages, our findings suggest that differences in the relatively fixed stock of financial knowledge contribute to increasing disparities in financial outcomes over the life cycle. Our empirical results add substantive evidence to the important discussion on how to reduce inequality in saving and wealth in America.
The remainder of the paper proceeds as follows. Section 2 briefly describes the data used for this study. Section 3 documents the evolution of financial literacy over time in the whole sample and separately by age and cognitive ability. Section 4 investigates the extent to which financial literacy is predictive of future financial outcomes, while Section 5 explores heterogeneity in this relationship across distinct demographic groups. Section 6 concludes.
2. Data
Our data come from two waves of the FINRA Foundation's NFCS fielded as part of the RAND ALP, which is a probability based, nationally representative online panel of U.S. adults age 18 and above. The first wave was fielded in 2012 to a sample of about 2,000 adults. In July 2018, we invited the 1,455 active ALP members who had answered the 2012 NFCS questionnaire to retake the survey. Of these respondents, 1,232 started the survey and 1,170 completed it. In the analyses that follow, we include respondents who participated in both waves, even if they did not finish the survey, as long as they have a financial literacy score.Footnote 5 The final sample includes 1,197 individuals and 2,394 individual-time observations.Footnote 6 The summary statistics for the main demographic variables in the panel at baseline (in 2012) are shown in Table 1. An analysis of sample attrition, provided in the Appendix, shows that the probability of participating in the second wave of the NFCS ALP is relatively higher for Whites, middle-aged and older individuals, those with at least a Bachelor's degree, and with annual household incomes greater than $60,000 in 2012 (these demographic characteristics will be controlled for in our regression analysis).
Sample characteristics in 2012

Source: 2012 American Life Panel.
This table reports sample averages (in 2012) of the variables used in the empirical work.
Individuals who participated in both waves are also older, more educated, and with higher incomes than the population at large.Footnote 7 In our 2012 sample, average age is about 50, versus 47 in the population; the proportion of female respondents is 58%, versus 51% in the population; and the proportion of White respondents is 73%, versus 67% in the population. Nearly half the sample has a college degree; in the general population, this fraction is 30%. Our sample is more closely representative of the population in terms of household income, with 54% of our sample from households earning less than $60,000, versus 57% in the population at large. These documented differences are consistent with the changes in the composition of the ALP population over time, with younger, less educated, and less affluent respondents having shown higher attrition and non-response rates. Over the six-year time span covered by our two waves of data, there are no significant changes in the demographics shown in Table 1 (most of which are constant by definition), except for a mechanical increase in age and a slight increase in household income.
3. The evolution of financial literacy over time
In both waves, respondents were administered a set of five financial literacy questions covering fundamental economics and finance concepts. These questions have become known as the Big Five (Hastings et al., Reference Hastings, Madrian and Skimmyhorn2013) and are one of several commonly used financial literacy measures. The Big Five consist of three multiple choice questions assessing aptitude with simple interest calculations (related to savings accounts and inflation) and understanding of the relationship between interest rates and bond prices and two true/false questions testing individuals' knowledge of the relationship between the length of a mortgage and the overall interest paid over the life of the loan and the concept of risk diversification. The exact wording of the questions is reported in Appendix B. We construct a financial literacy index by summing the correct responses to the financial literacy questions.
Over our six-year analysis timeframe, we find that financial literacy declines slightly in aggregate, though remains quite stable overall. Differences between the proportion of correct responses across survey waves are muted, with the largest difference being a five percentage point decline in the fraction correctly answering the risk diversification question (p-value = 0.01, other differences between correct responses are not statistically significant). Reduced correct responses are largely driven by an increase in ‘don't know’ responses. For all but the interest rate questions, there were fewer incorrect responses in 2018 than 2012 (Table 2).Footnote 8
Fraction of correct and don't know responses across waves
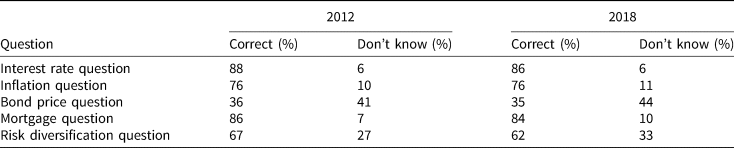
Source: 2012 and 2018 American Life Panel.
This table reports the fraction of correct and don't know responses to the five financial literacy questions in 2012 and 2018.
Figure 1 highlights the distribution of financial literacy scores (number of correct answers) across the two waves. The average financial literacy level in 2012 is 3.53, and it drops slightly to 3.43 in 2018. Using a paired sample t-test, we reject the null that the average difference across waves is zero at any conventional significance level (p-value = 0.001). There is little difference in the proportion of respondents answering all questions correctly across the two years, though a general leftward shift of the distribution between 2012 and 2018 for scores below five is observed. Nearly half of the respondents (48%) have the same score in 2018 as in 2012, and 87% have a score in 2018 that is within one point of their score in 2012.
Distribution of Financial Literacy across Years.
Source: 2012 and 2018 American Life Panel.

The slight decline in average financial literacy between the two survey waves is driven primarily by reduced financial literacy among older adults. Table 3 documents the mean difference in financial literacy score between waves by age/cohort (we adopt a paired-sample t-test to assess the statistical significance of the observed difference within each cohort). The youngest cohort is 18–24 in 2012, the oldest is 65 or older in 2012. As can be seen, financial literacy decreased over the six-year observation period for all cohorts, except for the youngest, for whom it increased by 0.25 points between 2012 and 2018. The sizeable, positive change is however not statistically different from zero due to the limited number of individuals in this 18–24 age group (40 individuals) and should be interpreted with caution. The largest and only statistically significant declines in financial literacy occurs among adults above the age of 60. This is consistent with cross-sectional evidence suggesting that financial literacy declines late in life, and that the decline may be driven in part by cognitive aging (Finke et al., Reference Finke, Howe and Huston2017).
Change in financial literacy by age cohort in 2012

Source: American Life Panel.
This table reports the average financial literacy score for the age cohort indicated in the first column in 2012 (second column) and six years later in 2018 (third column). For each age cohort, the change in the financial literacy score between 2018 and 2012 is reported in the fourth column.
**p < 0.01, *p < 0.05.
We have information on cognition from the ALP, but only at one point in time, elicited between September 2012 and May 2013 for all participants. This information is in the form of test scores on a series of computer-adaptive cognitive tests, which we aggregate in a comprehensive cognition index by summing scores across all tests (we standardize this index to have mean 0 and standard deviation 1 in the sample).Footnote 9 We then assign respondents to four groups corresponding to the quartiles of the index distribution in the sample. As can be seen in Table 4, we find a relationship between cognition and future decline in financial literacy. Individuals in the bottom three cognitive ability quartiles all experience slight declines in financial literacy, with the largest decline experienced by those with the lowest cognition. Those in the highest cognitive ability quartile have financial literacy scores that remain relatively unchanged across the survey waves.Footnote 10
Financial literacy by cognition

Source: American Life Panel.
This table reports the average financial literacy score by cognitive ability quartiles. For each quartile, the second column shows the average financial literacy score in 2012, while the third column shows the average financial literacy score six years later, in 2018. The fourth column presents the change in the financial literacy score between 2018 and 2012.
**p < 0.01, *p < 0.05.
4. Financial literacy and future financial outcomes
In addition to measuring changes over time, a key feature of our longitudinal data is that they allow us to examine the predictive power of financial literacy several years into the future. The question we explore is: Controlling for observable characteristics, individual-specific traits, and current financial outcomes, does financial literacy predict future financial outcomes? The survey elicits a range of variables that can proxy for financial well-being, from subjective satisfaction with current financial situation to the capacity to face a shock, as well as variables that capture aspects of financial capability, such as retirement planning and credit/debt management. We divide these variables into positive and negative financial outcomes. The positive set includes satisfaction with overall financial situation, measured on a 10-point scale; lack or low level of financial fragility, measured by one's confidence in their ability to come up with $2,000 if an unexpected need arose within a month; and an indicator that respondents have (ever) tried to figure out how much they need to save for their retirement, which is known to be a strong predictor of wealth accumulation (Lusardi and Mitchell, Reference Lusardi and Mitchell2007). Among the negative or detrimental outcomes, we consider the extent to which respondents agree – using a 7-point scale with 1 indicating strong disagreement and 7 strong agreement – with the statement ‘I have too much debt right now,’ whether they have used alternative financial services (payday loans, pawn shops, tax-refund loans, car title loans, and rent-to-own shops) in the past five years, and whether they use credit cards in an expensive way (paying the minimum only, making a late payment, going over the limit, or using the card for a cash advance). All of these latter measures capture, to a varying degree, financial distress and difficulties with personal finances (for detail see Lusardi and Tufano, Reference Lusardi and Tufano2015).
We perform OLS regressions using each of these outcomes in 2018 as dependent variables and financial literacy as observed in 2012 as the main explanatory variable of interest. Other regressors include demographic characteristics measured in 2012 (gender, race, age, marital status, education, income, and labor force status); a composite index score for cognitive ability preferences and individual traits, namely aversion to risk and attitude toward planning; and the dependent variable itself measured at baseline (in 2012).Footnote 11 We use two specifications, a parsimonious one, which only includes demographics and the lagged dependent variable, and one that accounts for individual attitudes and preferences. The estimated relationship between financial literacy and future financial outcomes is reported in Tables 5 and 6. To ensure that the sample size remains the same across specifications, we exclude from the analysis respondents with missing values of either the dependent variable or any of the explanatory variables used in the regressions. Due to skip patterns within the questionnaire, information about retirement planning and credit card use is available for only about 80% of the original sample. Hence, the regressions featuring these two outcomes as dependent variable show a reduced sample size.
Financial literacy and future outcomes (I)

Note: This table reports the estimates of the regressions of positive financial outcome (in 2018) on financial literacy and a set of demographics. Demographics include gender, race, age, education, marital status, labor force status, and income. All explanatory variables are measured in 2012, except risk aversion and planning attitude, which are treated as constant individual traits. The set of explanatory variables also includes the dependent variable as measured in 2012. The full set of estimated coefficients is reported in Table A3 in Appendix C. Robust standard errors in parentheses **p < 0.01, *p < 0.05.
Financial literacy and future outcomes (II)

Note: This table reports the estimates of the regressions of negative financial outcome (in 2018) on financial literacy and a set of demographics. Demographics include gender, race, age, education, marital status, labor force status, and income. All explanatory variables are measured in 2012, except risk aversion and planning attitude, which are treated as constant individual traits. The set of explanatory variables also includes the dependent variable as measured in 2012 The full set of estimated coefficients is reported in Table A4 in Appendix C. Robust standard errors in parentheses **p < 0.01, *p < 0.05.
Overall, we find that financial literacy has significant predictive power for future financial outcomes, even after controlling for current outcomes, a wide set of demographics, and individual-specific traits. Specifically, those who have higher financial literacy are more likely to be satisfied with their financial situation, more likely to be able to face a mid-size shock, and more likely to plan for retirement in the future. Estimates are sizeable. For example, a one-unit increase in the 2012 financial literacy index is associated with a 0.13-point increase in financial satisfaction in 2018. This corresponds to an almost 2.5% increase relative to mean financial satisfaction in the sample (about 6 on a 10-point scale). Thus, the effect is not only statistically significant but also economically meaningful. Similarly, individuals with higher financial literacy are about 5 percentage points more likely to be able to meet an unexpected $2,000 shock, representing a sizeable 8% increase relative to a sample proportion of 61%, consistent with the findings of Hasler et al. (Reference Hasler, Lusardi and Oggero2018). Finally, answering one more financial literacy question correctly in 2012 is associated with about a 3.5 percentage-point increase in the likelihood of having done any retirement planning in 2018, a 6% positive change from a sample proportion of 57%.
On the other hand, we find little effect of financial literacy on negative financial behavior, mostly related to debt and debt management. This suggests that poor financial decision making may be driven by factors like shocks and resource scarcity and not as much by lack of financial knowledge. In view of previous research, there exists evidence that, irrespective of financial literacy, the majority of people recognize that carrying a lot of debt, not making credit card payments on time, or using alternative financial services (which tend to charge high interest rates and fees) have negative consequences. Failure to avoid these behaviors is more plausibly driven by behavioral factors (e.g., present bias), resource constraints, and financial shocks than by lack of financial knowledge.Footnote 12 We also estimate regressions where indicators for answering each financial literacy question correctly replace the composite financial literacy score. The results of these regressions are reported in Table A5 in the Appendix.Footnote 13
In the interest of space and since our focus is on financial literacy, we will comment on just a few other estimated coefficients (the complete set of estimated coefficients is provided in Appendix C): Financial outcomes do not vary significantly by gender, with the exception of the use of alternative financial services, which is less likely among women, but outcomes are very different by race, with White respondents faring much better than minorities. As might be expected, financial outcomes are generally better for those with higher income and higher education. Cognitive ability is not correlated with positive financial outcomes that have a significant association with financial literacy. In contrast, cognitive ability correlates with some negative outcomes, for which no association with financial literacy is detected. We estimate that a higher cognition score in 2012 is positively associated with the perception of having too much debt in 2018. While possibly surprising, this result may reflect the fact that individuals with better cognitive functions are also better able to assess when their debt level is excessive. More in line with expectations, cognitive ability correlates negatively with the use of AFS. Interestingly, financial outcomes are better for those who are older or retired, while risk aversion and planning attitude are not statistically significant in our regressions.
While our empirical approach addresses potential reverse causality from financial literacy to financial outcomes and vice versa, we are unable to rule out all possible sources of bias stemming from the omission of variables that correlate with financial knowledge and financial outcomes. However, since we take into account some of the traits most relevant for individual financial decision making (e.g., attitude toward financial risk and planning and cognitive ability) in our regressions, we interpret our results as evidence of a causal link between financial literacy and financial outcomes.Footnote 14 As noted above, considerable prior research has documented that higher levels of financial literacy are associated with higher levels of contemporaneously measured financial outcomes.Footnote 15 Our finding that financial literacy is relatively constant over our six-year observation period indicates that differences in the stock of financial knowledge lead to increasing disparities through the life cycle. Individuals with higher levels of current financial knowledge tend to have higher current and future levels of financial well-being relative to those with lower current levels of financial knowledge. Thus, financial literacy may be a key driver of widening inequality.
5. Heterogeneity in the relationship between financial literacy and future financial outcomes
Next, we investigate the extent to which the observed relationship between financial literacy and future financial outcomes varies across distinct segments of the population. To do this, we use our richer specification, including as explanatory variables demographics, cognitive ability, individual-specific traits (risk aversion and planning attitude), the dependent variable and financial literacy as of 2012, and estimate it separately by gender, age (individuals younger than 55 and individuals age 55 or older in 2012), and income group (households with yearly income below $60,000 and $60,000 or above in 2012). In Table 7, we report the estimated financial literacy coefficients for men and women and for the two aforementioned age and income groups, separately.
Financial literacy and future outcomes by gender and age

Note: This table reports the estimates of the regressions of financial outcome (in 2018) on financial literacy and a set of demographics and the dependent variable in 2012 by age and gender. Separate regressions for men and women and for individuals below age 55 and age 55 or older are estimated. The set of controls is the same as in columns (2) of Tables 5 and 6. Robust standard errors in parentheses **p < 0.01, *p < 0.05.
The observed positive effect of financial literacy on an individual's future satisfaction with their financial situation detected in the entire sample appears to be mainly driven by men and individuals age 55 and older. For these two groups, one more financial literacy question answered correctly is associated with a 0.22-point increase in the future level of satisfaction with financial situation. While still positive, the corresponding coefficient is much smaller and not statistically different from zero for women and individuals younger than 55. Due to relatively small sample sizes, we cannot, however, reject the null that the effect of financial literacy on future financial satisfaction is the same between groups. The relationship between financial literacy and future financial satisfaction is similar for households with income below and above $60,000 per year, but is statistically significant only for households with income below $60,000. The link between financial literacy and future ability to meet an unexpected $2,000 expense is rather homogenous between men and women and between age groups. On the other hand, it is substantially larger for those with income below $60,000, for whom a higher financial literacy score increases the probability of being able to meet a $2,000 expense by about 6 percentage points (a sizeable 14% increase from the sample proportion of 42%), than it is for richer individuals (income greater than $60k) for whom the estimated effect is smaller (about 3 percentage points) and not statistically significant.
Women, individuals age 55 and older, and high-income households seem to benefit the most from better financial knowledge when it comes to retirement planning. For women, a one-unit increase in the financial literacy score in 2012 results in a 4.5 percentage point increase in the likelihood of planning for retirement (an effect significant at 5%) compared to only a 2 percentage point increase for men (a non-statistically significant effect). These estimates correspond to a 9% and 3% increase from the corresponding sample proportions of 51% and 63%. Similarly, the estimated 2012 financial literacy coefficients indicate an increase of nearly 5.5 percentage points in the probability of retirement planning among individuals age 55 or older (a 9% increase from the sample proportion) and of barely 2 percentage points (3.5% increase from the sample proportion) among those younger than 55. For individuals with income at or above $60,000, a higher financial literacy score in 2012 is associated with a 5.6 percentage-point increase in the likelihood of having done some retirement planning by 2018 (an 8% increase from the sample proportion of 69%); for those with income below $60,000, the estimated increase is only 1.7 percentage points and is not statistically significant. Despite such large differences, we fail to reject the null that these effects are the same between groups due to relatively large standard errors.
Concerning negative outcomes, we find evidence of some heterogeneous effects. Consistent with most of the patterns already described, women, older, and less affluent individuals appear to benefit the most from increasing levels of financial knowledge. For women, answering one more financial literacy question correctly in 2012 results in a decrease of 0.13 points on the 1–7 scale measuring having too much debt in 2018. This corresponds to a 4% decrease from a sample mean of 3.6. Conversely, there is little effect for men. Similarly, among individuals age 55 or older, a one-point increase in the financial literacy score in 2012 is associated with a decrease of 0.19 points on the having too much debt scale in 2018, representing a negative 7% change from the sample mean of 2.6. For individuals younger than 55, financial literacy is not linked to future debt management. Among those with income below $60,000, a one-unit increase in the financial literacy score in 2012 results in a decrease of 0.17 points on the having too much debt scale in 2018, which constitutes a negative 4.5% change from the sample mean of 3.8. Once again, because of relatively large standard errors, the effects by gender and age are not statistically different. We do reject the null that the effects of financial literacy on having too much debt are the same between income groups at the 5% significance level. Finally, we do not find an effect of financial literacy on either use of alternative financial services or expensive credit card behavior across demographic groups, apart from when looking at distinct age groups. Overall, the estimated coefficients are similar to those in the whole sample.
In summary, although differences among groups are generally not statistically significant, the results presented in this section point to three main patterns. One, higher financial literacy tends to benefit women more than men, which is consistent with the findings of previous work by Lusardi and Mitchell (Reference Lusardi and Mitchell2008). Two, a higher level of financial knowledge appears to be more advantageous for individuals approaching retirement age than for their younger counterparts, confirming the key role that financial knowledge plays in planning for the future and accumulating wealth over the life cycle. Three, financial knowledge seems more beneficial for low-income individuals, especially in the domains of satisfaction with finances, emergency savings, and debt management. Our empirical evidence highlights the importance of taking heterogeneity into account when assessing the effects of financial literacy, and of considering distinct financial behaviors and outcomes, which may be differentially affected by the level of financial knowledge.Footnote 16
6. Conclusions
We administered the NFCS questionnaire to members of the RAND ALP in 2012 and again in 2018. As a result, we have at our disposal longitudinal, individual-level information on financial literacy and a broad set of financial outcomes, which is rarely found in other data sets. Importantly, we are able to complement this information with a rich set of socio-economic variables, cognitive ability measures, preference parameters and individual traits available in the ALP and that are known to influence both financial knowledge and behavior.
Exploiting this unique longitudinal data set, we investigate the evolution of financial literacy over a six-year period and identify the causal effects of financial knowledge on a set of financial outcomes that proxy for financial well-being. For this purpose, we regress financial outcomes as measured in 2018 on the level of financial literacy observed in 2012, controlling for baseline demographics, baseline financial outcomes, and individuals' traits. This empirical approach allows us to rule out reverse causality from financial outcomes to financial literacy, and to account for most of the individual-specific characteristics influencing financial decision making, thereby reducing bias from the omission of relevant variables. While existing studies find a positive correlation between financial literacy and financial outcomes in the cross-section, it is largely unknown whether the gap in financial outcomes between those with low and high financial literacy widens or narrows over time. Our study tackles this question and provides empirical evidence on this issue, which has important policy implications.
Over our relatively long (2012–2018) observation period, financial literacy exhibits very limited within-individual variation. It appears to be rather stable, with a slight tendency to decline at older ages only. There is good news and bad news about this finding. The good news is that the Big Five Financial Literacy questions are a robust measure of financial literacy, which remains stable over time. The bad news is that financial literacy improves very little over time; this indicates a need to do more to bolster financial knowledge, especially among young and middle-age individuals.
We also find that financial literacy has significant predictive power for future financial outcomes, especially satisfaction with one's own financial situation, the ability to face shocks, and planning for retirement, even after controlling for baseline levels of these outcomes. These results, combined with the observed stability of financial literacy over time, suggest that differences in the stock of financial knowledge among individuals can lead to increasing disparities in financial well-being over the life course. Thus, differential levels of financial literacy may contribute to widening inequality among distinct segments of the population.
We investigate how the general relationship between financial literacy and future financial well-being varies across distinct demographic groups. We find evidence suggestive of a stronger effect of financial literacy on future outcomes for older individuals than for their younger counterparts. This highlights the importance of equipping the young to make critical financial decisions so that they can continue down a path toward financial security. We also observe that women who have higher financial literacy experience better downstream financial outcomes than men. This indicates that higher levels of financial literacy for women may help close the gender gap in financial well-being. Similarly, we find that low-income individuals who have higher levels of financial literacy are better able to meet unexpected shocks and manage debt.
Our study represents progress toward a better understanding of the ways in which household financial behavior and financial literacy are linked. This knowledge is crucial for devising and implementing interventions that can effectively improve household financial decision making and financial well-being, particularly among more disadvantaged and vulnerable groups in the population. Our results suggest that financial knowledge may be an important contributor to increasing disparities over the life course, highlighting the need to find effective strategies for improving financial literacy at early stages in the life cycle.
Acknowledgements
We would like to thank Gerri Walsh and participants to the CIPHER2020 conference for many helpful suggestions and comments. We also acknowledge financial support from the FINRA Foundation. All errors are our responsibility.
Appendix A – Sample Attrition Analysis
The number of individuals who answered the NFCS questionnaire in 2012 and were still active ALP members in 2018 is 1,455. All these individuals were invited to re-take the NFCS questionnaire in 2018. Considering this pool of potential respondents, we create an indicator taking the value of 1 if the invited ALP member answered the 2018 NFCS questionnaire and 0 otherwise. We then estimate a Probit model using this indicator as a dependent variable and the following set of regressors measured in 2012: gender, age, education, marital status, labor force status, household income, financial literacy score, and cognitive ability score. Table A1 presents average marginal effects from this estimation exercise.
Sample attrition for the NFCS

As can be seen, the probability of answering the second NFCS ALP wave, conditional on having answered the first, is higher among White, middle-aged, and older respondents. It is around 6 percentage points higher among individuals with a bachelor's degree or more compared to those with high school or less, and about 4 percentage points higher among households with income greater than $60,000. In contrast, the likelihood of answering the 2018 NFCS questionnaire does not correlate with gender, marital status, labor force status, financial literacy level, or cognitive ability.
We also perform an analysis of attrition from the ALP between 2012 and 2018. Besides the 1,455 respondents who answered the NFCS questionnaire in 2012 and were still active ALP members in 2018, another 620 dropped out of the ALP by the time we administered the second wave of the NFCS. In Table A2, we estimate a Probit model for the probability of remaining an active ALP member in 2018, conditional on having participated in the NFCS in 2012. This analysis provides insights on which individual characteristics are associated with the likelihood of leaving the ALP over time and, therefore, on how the composition of the panel may have changed during the observation period of our study.
Sample attrition for the ALP

As can be seen, the probability of remaining in the ALP between 2012 and 2018 is higher for women and individuals with at least a bachelor's degree. It is significantly lower among those age 18–32 than among their older counterparts. Unlike the NFCS attrition documented above, ALP attrition is associated with financial literacy. Specifically, one more financial literacy question answered correctly in 2012 increases the chances of remaining in the panel by about 3 percentage points. There is no correlation between the probability of attrition and individuals' cognitive ability.
Appendix B – The Big Five Financial literacy questions in the NFCS
(correct answer indicated in bold)
1. Interest Rate Question
Suppose you had $100 in a savings account and the interest rate was 2% per year. After 5 years, how much do you think you would have in the account if you left the money to grow?
-
More than $102
-
Exactly $102
-
Less than $102
-
Do not know
-
Prefer not to say
2. Inflation Question
Imagine that the interest rate on your savings account was 1% per year and inflation was 2% per year. After 1 year, how much would you be able to buy with the money in this account?
-
More than today
-
Exactly the same
-
Less than today
-
Do not know
-
Prefer not to say
3. Bond Price Question
If interest rates rise, what will typically happen to bond prices?
-
They will rise
-
They will fall
-
They will stay the same
-
There is no relationship between bond prices and the interest rate
-
Do not know
-
Prefer not to say
4. Mortgage Question
A 15-year mortgage typically requires higher monthly payments than a 30-year mortgage, but the total interest paid over the life of the loan will be less.
-
True
-
False
-
Do not know
-
Prefer not to say
5. Risk Diversification Question
Please tell me whether this statement is true or false. ‘Buying a single company's stock usually provides a safer return than a stock mutual fund.’
-
True
-
False
-
Do not know
-
Prefer not to say
Appendix C – Additional Regression Results
Full set of estimated coefficients (I)

Full set of estimated coefficients (II)

Estimated coefficients of the big five financial literacy questions


 Open access