Introduction
Understanding the genetic variation within and among populations of an endangered species is important for the success of conservation programmes, as it may help to identify specific management units (Haig Reference Haig1998). In addition, it allows conservationists to design management strategies that aim to maintain genetic diversity (Haig Reference Haig1998, Hedrick Reference Hedrick2001, Haig et al. Reference Haig, Bronaugh, Crowhurst, D’elia, Eagles-Smith, Epps, Knaus, Miller, Moses, Oyler-McCance and Robinson2011), as high genetic variability is widely considered an important factor for the long-term persistence of a species (Reed and Frankham Reference Reed and Frankham2003, Frankham Reference Frankham2005a).
In this study we assessed population genetic structure in the Grey Falcon Falco hypoleucos, a very rare raptor restricted to a large portion of Australia’s arid/semi-arid zone, an area of about 5.2 million km2 (Schoenjahn et al. Reference Schoenjahn, Pavey and Walter2019). Its current population is estimated at fewer than 1,000 individuals (Garnett et al. Reference Garnett, Szabo and Dutson2011, Schoenjahn Reference Schoenjahn2011, Birdlife International 2016), making it one of the rarest species of Falco in the world (Schoenjahn et al. Reference Schoenjahn, Pavey and Walter2019). The Grey Falcon’s national conservation status is listed as ‘Vulnerable’ (Garnett et al. Reference Garnett, Szabo and Dutson2011, Birdlife International 2016), but the species is not declared threatened under Australian national legislation. The species may, however, be considered for inclusion on the Australian EPBC Act threatened species list if the population size estimate of < 1,000 individuals could be further substantiated (Schoenjahn et al. Reference Schoenjahn, Pavey and Walter2019). Accurately estimating population size of the Grey Falcon is, however, challenging. This is due to the remoteness of the breeding habitat of these birds, the species’ scarcity throughout its distribution, and the difficulty in identifying the species accurately in the field (Olsen and Olsen Reference Olsen and Olsen1986, Schoenjahn Reference Schoenjahn2010).
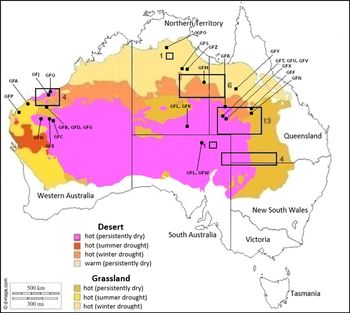
The Grey Falcon’s breeding strongholds lie within areas of the hottest climate classes (Schoenjahn Reference Schoenjahn2013; Figure 1). Intruding between the western and eastern breeding areas are the central deserts of Western Australia (Figure 1). There are few confirmed records of Grey Falcons in these deserts, but also of a lack of sampling (Blakers et al. 1984, Barrett et al. Reference Barrett, Silcocks, Barry, Cunningham and Poulter2003, J. S. pers. obs.).
Recorded nesting distribution of the Grey Falcon between 2003 and 2013. The areas within the rectangular boxes indicate breeding areas, with the number of active nests indicated for each (Schoenjahn Reference Schoenjahn2013). Areas of the continent classified by the Bureau of Meteorology as hot are plotted (http://www.bom.gov.au/climate/how/newproducts/images/zones.shtml). Source map from https://d-maps.com/carte.php?num_car=3293%26lang=en. The labels are feather codes (listed in Table S1) which match the geographical locations from which Grey Falcon feather samples were obtained.

Little is known about the extent to which Grey Falcons move within and among breeding regions, though Grey Falcons appear to be highly mobile (Schoenjahn et al. Reference Schoenjahn, Pavey and Walter2019). This is in line with most of the species’ congeners, with at least 24 of the 38 recognized Falco species considered to be migratory, dispersive, irruptive or nomadic to some extent (del Hoyo and Collar Reference del Hoyo and Collar2014, Schoenjahn et al. Reference Schoenjahn, Pavey and Walter2019). Movement among the eastern and western parts of the species’ breeding distribution may, however, be hampered by the harsh environments in the central deserts (Ford Reference Ford1987, Olsen Reference Olsen1995). Furthermore, natal philopatry or site fidelity may disrupt gene flow among populations, which could lead to strong local genetic structuring (Walsh et al. Reference Walsh, Kovach, Babbitt and Brien2012, Ponnikas et al. Reference Ponnikas, Kvist and Ollila2013). If there are several genetically distinct populations of the Grey Falcon they may best be treated as distinct units for conservation purposes (Haig Reference Haig1998, Hedrick Reference Hedrick2001, Haig et al. Reference Haig, Bronaugh, Crowhurst, D’elia, Eagles-Smith, Epps, Knaus, Miller, Moses, Oyler-McCance and Robinson2011).
In this study we amplified a region of mitochondrial DNA (cytochrome b) from the feathers of 26 Grey Falcon individuals captured from the wild from across the species’ known breeding distribution. We estimate the genetic diversity, genetic structuring, and effective population size of the species, and discuss implications of our results for the management of this extremely rare and threatened raptor.
Methods
A single feather from 26 Grey Falcons was collected from across Australia from 1 April 2008 to 1 March 2017 (Figure 2; Table S1 in the online supplementary material). This included 21 individuals captured from the wild, three birds held in raptor rehabilitation facilities, and two carcasses of Grey Falcons found dead in the wild.
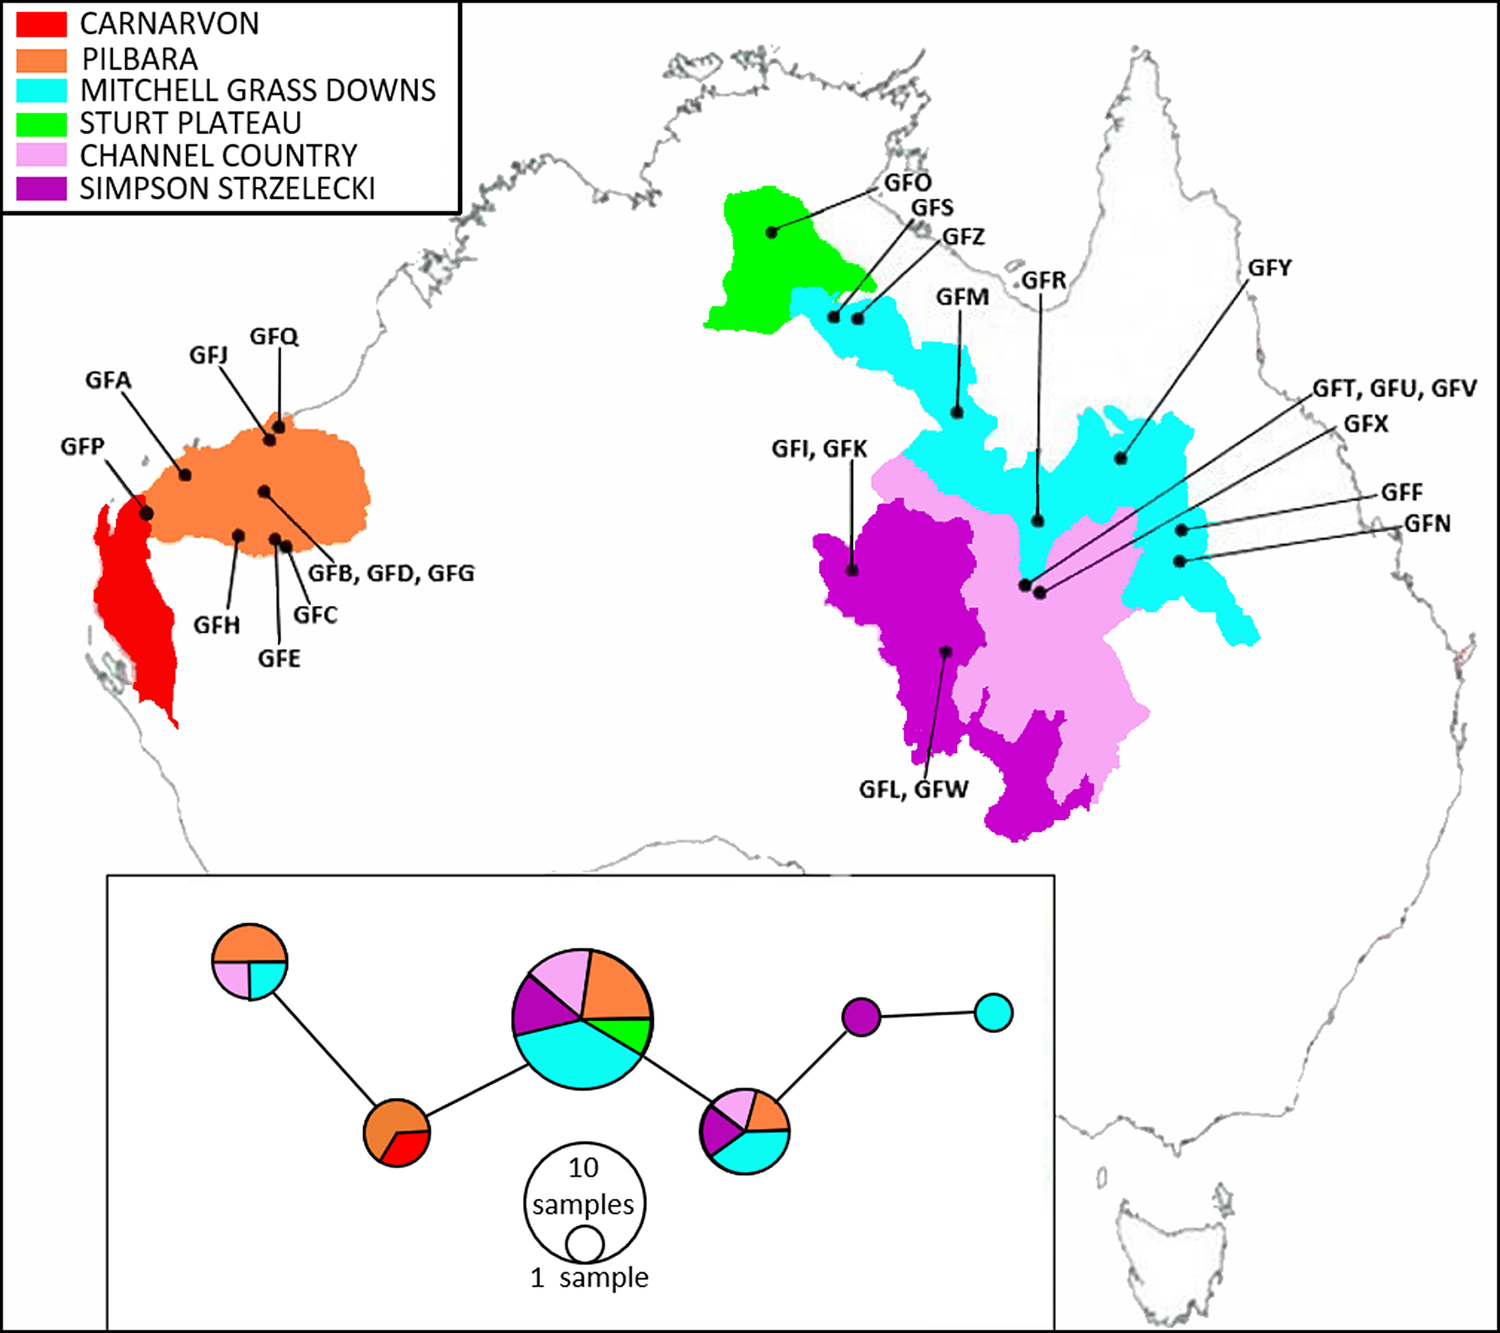
Map of the Australian bioregions (modified from IBRA v.7, under a creative commons licence [ERIN, 2016]) to show the geographical localities from which Grey Falcon feather samples were obtained (plotted as labelled black dots). The labels are the feather codes listed in Table S1. Inset: a TCS haplotype network of Grey Falcon cytochrome b sequences, with colours corresponding to the bioregions labelled on the map.
DNA was extracted from the keratinous base of the feather. The first centimetre of the calamus was removed and washed in ethanol to remove contaminants, with DNA extracted following the DIY spin column protocol of Ridley et al. (Reference Ridley, Hereward, Daglish, Raghu, McCulloch and Walter2016). A 799-bp region of the cytochrome b (Cyt b) portion of mitochondrial DNA was amplified in two sections using the primer pairs L15132/H15516 and L15489/H15915 (Helm-Bychowski and Cracraft Reference Helm-Bychowski and Cracraft1993). PCRs (12μl) contained 7.6μL of distilled water, 2μL of 10x reaction buffer, 0.24μL of forward primer, 0.24μL of reverse primer, 0.08μL of Taq Polymerase (BioLine), and 2μL of DNA. PCRs involved an initial denaturation step of 94ºC for 3mins, followed by 30 cycles of 94ºC for 30 s, 46ºC for 30 s and 72ºC for 30 s, with a final extension at 72ºC for 10 min. Samples were cleaned with one unit each of Exonucelase I and Antarctic Phosphatase (New England Biolabs, Ipswich, MA, USA), with sequencing conducted in both directions by Macrogen (Korea).
Sequences were aligned in Geneious 11.1.5 (Kearse et al. Reference Kearse, Moir, Wilson, Stones-Havas, Cheung, Sturrock, Buxton, Cooper, Markowitz, Duran, Thierer, Ashton, Meintjes and Drummond2012) using the ClustalW plugin (Larkin et al. Reference Larkin, Blackshields, Brown, Chenna, McGettigan, McWilliam, Valentin, Wallace, Wilm, Lopez, Thompson, Gibson and Higgins2007). Haplotype diversity, nucleotide diversity, and the average number of pairwise nucleotide differences were assessed using DnaSP v5.10.1 (Librado and Rozas Reference Librado and Rozas2009). Pairwise distances between samples were calculated in MEGA v.7 (Kumar et al. Reference Kumar, Stecher and Tamura2015) using the Tamura and Nei model (Tamura and Nei Reference Tamura and Nei1993). Population subdivision was assessed using analysis of molecular variance (AMOVA) implemented in Arlequin v.3.5 (Excoffier and Lischer Reference Excoffier and Lischer2010). Samples were grouped according to their sampling locality, as identified in the Interim Biogeographical Regionalisation for Australia (IBRA), version 7 (available at http://www.environment.gov.au/fed/, verified 21 August 2019). For rehabilitated birds this was the original site in the field from which they were derived (and with these details not known for one bird). The relationships between closely related haplotypes were examined using a TCS network constructed in PopART v1.7 (Leigh and Bryant Reference Leigh and Bryant2015). Genetic signatures of recent population size changes were assessed using Fu’s Fs and Tajima’s D tests, calculated in DnaSP v5.10.1 (Librado and Rozas Reference Librado and Rozas2009).
We used BEAST 2.5.0 (Bouckaert et al. Reference Bouckaert, Vaughan, Barido-Sottani, Duchene, Fourment, Gavryushkina, Heled, Jones, Kuhnert, De Maio and Matschiner2019) to assess the effective female population size of the Grey Falcon using Bayesian Skyline Plot (BSP) reconstruction. A relaxed log normal molecular clock was used, with the HKY substitution model. We used a mutation rate of 2.1% divergence / site / million years, as this is the mean Cyt b substitution rate for birds (Weir and Schulter 2008). We used two different estimates of generation time for Grey Falcons: 6.2 yr (BirdLife International 2016) and 4.4 yr (BirdLife International in prep. Generation lengths of the birds of the world. Unpublished data set. Available from science@birdlife.org). We ran the MCMC chain for 10 million steps, with samples taken every 10,000th step. The first 10% of samples were discarded as “burn-in”. We ran additional analyses using the Coalescent Constant Population size model (rather than the Bayesian Skyline model), and with a different molecular clock model (strict molecular clock), to assess whether changing these parameters significantly impacted our effective population size estimates.
Results
A 799 bp region of Cyt b was successfully amplified from the feathers of all 26 Grey Falcons (GenBank accession numbers MH645073–MH645098). Six discrete haplotypes were identified (Figure 2), with five variable sites, of which four were parsimony informative. Sequence divergence across individual pairs of sequences was low (0.0–0.7%). Haplotype diversity (0.724 ± 0.005) was similar to that found in other raptor species, but nucleotide diversity was lower (0.0017) than in other species (Table 1). The mean number of nucleotide differences across individuals (k) was also low (1.276 ± 1.113).
Summary of genetic statistics available for raptors listed as ‘Vulnerable’ (estimated population size of less than 10,000 individuals). The Grey Falcon entry is highlighted. Estimated population sizes taken from Birdlife International (2016). Hd = haplotype diversity, π = nucleotide diversity.
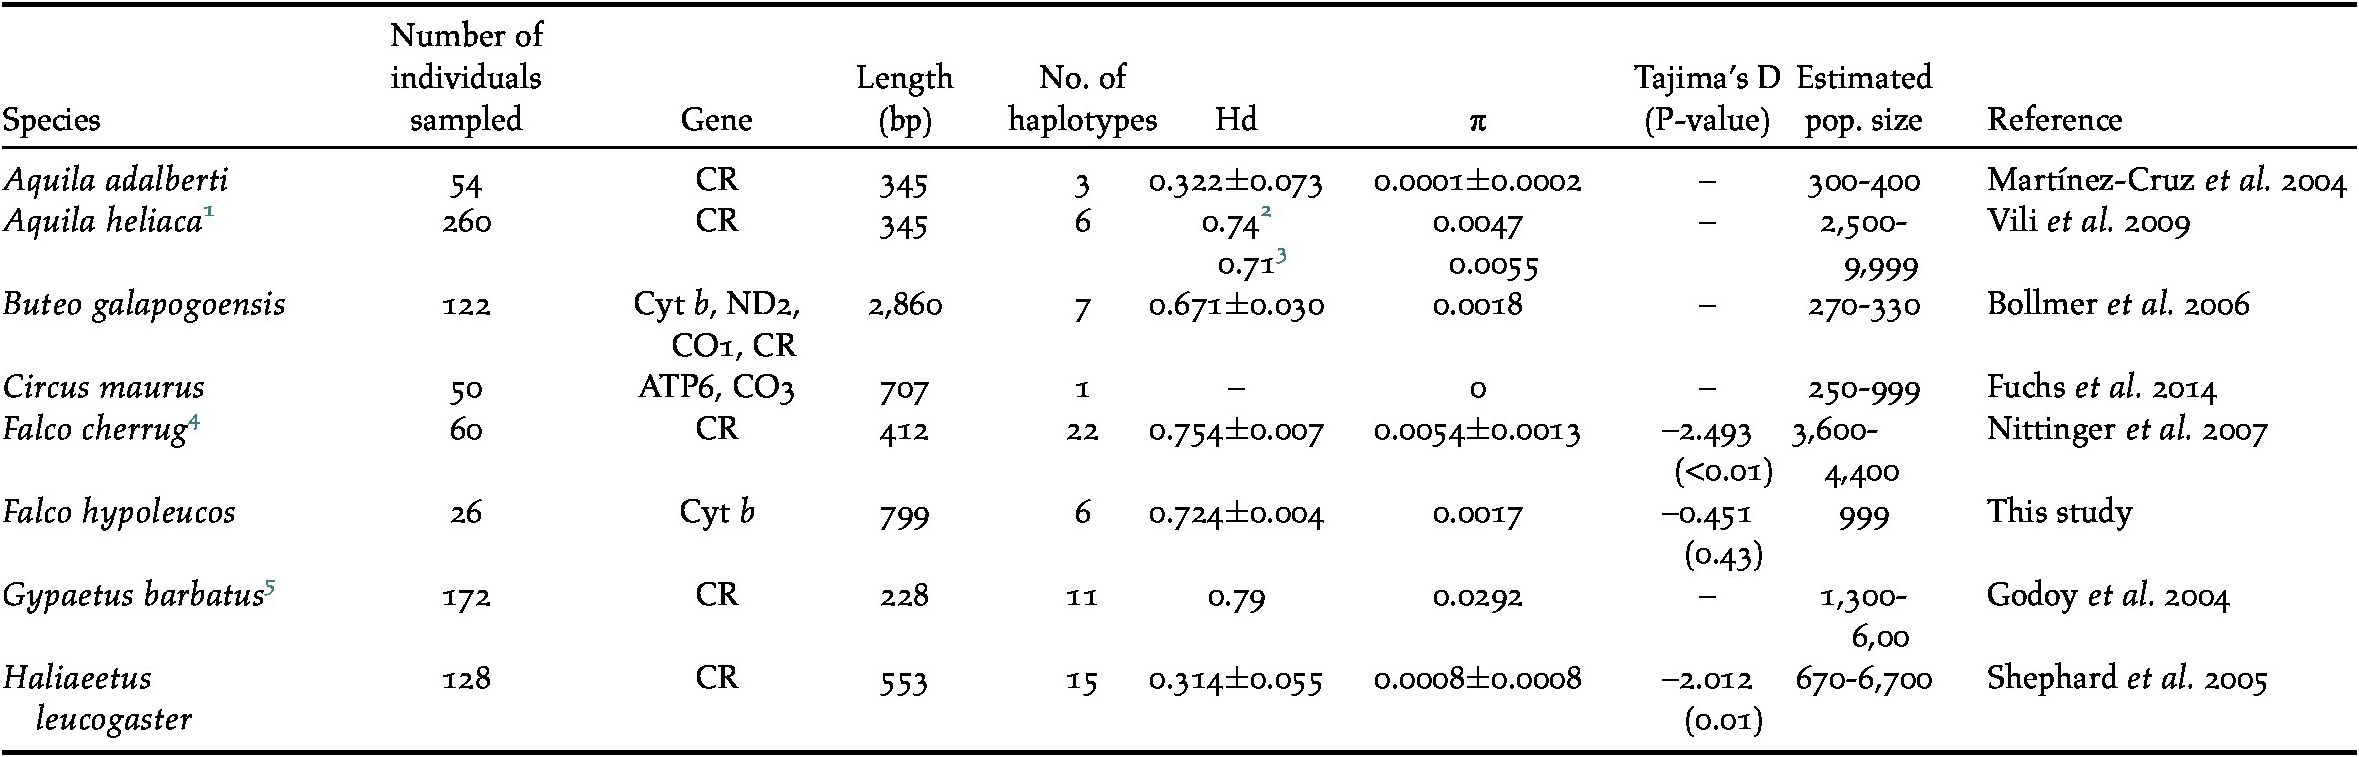
1 Slovak population;
2 Eastern Slovakian birds;
3 Western Slovakian birds;
4 Central European population;
5 European Alps population.
An AMOVA showed that most variation (98.5%) was shared within a bioregion, with only a small proportion (1.5%) attributed to among bioregion differences. The distribution of haplotypes within the TCS network likewise revealed no evidence of population structuring across the IBRA bioregions in which the samples were collected (Figure 2). Fu’s Fs (Fs = -1.072) and Tajima’s D (D = -0.451) were both negative, but neither was large enough (or statistically significant; P = 0.261 and 0.429 respectively) to reject neutrality. The median effective female population size, based on a generation length of 6.2 years, was estimated at 1,415 birds, although the 95% credibility interval for this estimate was very large (95% HPD = 200–3,912 females). Similar effective population size values (with similarly wide credibility intervals) were obtained using the constant population size model (1,218 females; 95% HPD = 239–4,113) and using a strict molecular clock (1,893 females; 95% HPD = 338–4,611). A slightly larger median effective female population size was estimated when a generation length of 4.4 years was used (2,034 birds; 95% HPD 341–5,161).
Discussion
No genetic structuring was observed across the distribution of Grey Falcons (Figure 2), with most haplotype diversity shared across bioregions, stretching over 2,000 km east to west, rather than subsets of these haplotypes being associated with local bioregions. The relatively uniform haplotype diversity across the broad area sampled implies that the birds move enough across their breeding distribution to render the entirety of the species relatively homogeneous genetically.
The presence of the same haplotypes on either side of the continent may indicate that gene flow across the species’ entire population is, in principle, unrestricted. However, some rare haplotypes were restricted to either the western or eastern breeding regions (Figure 2), suggesting there may be some weak population substructure at this broad geographic scale. Screening additional molecular markers may allow researchers to assess population genetic structure in more detail. Screening nuclear markers would be particularly valuable because nuclear and mitochondrial markers can show contrasting patterns in cases where there is sex-biased dispersal, as mitochondrial markers are inherited maternally (see Caparroz et al. 2009). We suggest future studies should employ next generation sequencing approaches (such as genotyping-by-sequencing). These approaches can produce a significantly larger suite of (nuclear) genetic markers, which may provide finer-scale information on the extent these birds move within and among breeding sites (see Oyler-McCance et al. 2016).
The mitochondrial diversity of the Grey Falcon was low, but similar to that found in other raptor species with populations of fewer than 10,000 individuals (a prerequisite for IUCN listing as ‘Vulnerable’; Table 1). This relatively low level of genetic diversity is unlikely to be detrimental to the Grey Falcon at the moment. However, if forced into refugia by changing environmental conditions the low genetic diversity of the relatively small Grey Falcon population could produce detrimental genetic effects, such as inbreeding depression (Evans and Sheldon Reference Evans and Sheldon2008). Maintaining the current genetic variation within this species may be an important conservation outcome, particularly as high genetic diversity may allow a species to respond to changing environmental conditions more effectively (Market et al. 2010, Frankham Reference Frankham2005b).
The effective female population size estimate of 1,415 individuals is slightly higher than previous estimates (based on observational data) of about 1,000 individual Grey Falcons of both sexes (Schoenjahn Reference Schoenjahn2011). Effective population size estimates are, however, often lower than census population size estimates, partly due to assumptions made when calculating the former, such as the population being randomly mating and at drift-mutation equilibrium (Wang Reference Wang2005, Palstra and Fraser Reference Palstra and Fraser2012). This suggests that the actual number of females may, therefore, be greater than 1,415. However, given the broad credibility intervals in our effective population size estimate (partly due to our relatively small sample size), we caution against using this estimate as a basis for determining the conservation status of the bird.
The lack of significant Tajima’s D and Fu’s Fs values indicate that there have been no recent significant population expansions or bottlenecks, suggesting that the number of Grey Falcon individuals has been relatively constant for some time, including the time since European influence on the continent (Schoenjahn Reference Schoenjahn2011). In other words, the Grey Falcon has not yet been noticeably impacted by anthropogenic environmental modification.
Our analysis substantiates the widely accepted view that the species Grey Falcon consists of a single, freely interbreeding population. Given the extensive distribution of the Grey Falcon, and the ability of these birds to adjust to adverse conditions by moving, the best placement of protected zones for this species may be in areas known to be current breeding strongholds (Figure 1; Schoenjahn Reference Schoenjahn2013). Our results suggest there is genetic connectivity across the species’ distribution, so any conservation efforts in its breeding strongholds should positively impact the species as a whole. Further studies, particularly into the species’ ecology, are required to identify additional conservation measures for this extremely rare and threatened raptor.
Supplementary Materials
To view supplementary material for this article, please visit http://dx.doi.org/10.1017/S0959270920000106.
Acknowledgements
We thank Eagles Heritage Raptor Wildlife Centre, Margaret River, Western Australia, and Rose Best from Pilbara Wildlife Carers Association for providing Grey Falcon feathers. We also thank Western Australia’s Parks and Wildlife Services and the Queensland Department of Environment Heritage and Protection for issuing movement permits necessary to send feathers interstate. Fieldwork was conducted by J. S. under the licences, permits and animal ethics approvals required for the States and Territory involved (see Appendix S1 for details). J. S. was supported by an Australian Government Research Training Program Scholarship, and by grants from Western Australia’s Department of Parks and Wildlife (toward satellite tracking of Grey Falcon in WA), DBP (Dampier to Bunbury Natural Gas Pipeline) (toward Grey Falcon research), and The Peregrine Fund, Boise ID, USA.