


Introduction
Glacier surges are characterized by a periodic increase in ice velocity, and most physical models of glacier surges focus on determining how basal sliding can be drastically increased. As a result, most accepted models of surges (e.g. the linked-cavity model (Reference KambKamb, 1987; Reference RaymondRaymond, 1987; Reference PatersonPaterson, 1994; Reference Bennett, Huddart and WallerBennett and others, 2000)), are focused on changes in basal sliding. They explain the process of maintaining a high sliding velocity during the surge but do not explain how the event affects the entire glacier body, or how the internal behaviour of the ice is affected during rapid advances.
Important information leading to the understanding of surges may be contained in the way glaciers deform during surge events. While some observations suggest that most of a surging glacier slides like a plug (e.g. Reference PostPost, 1960; Reference StanleyStanley, 1969; Reference Dolgoushin and OsipovaDolgoushin and Osipova, 1973; Reference KambKamb and others, 1985), glacial surface deformation and topographic lowering (e.g. Reference Dolgoushin and OsipovaDolgoushin and Osipova, 1975; Reference KambKamb and others, 1985; Reference RaymondRaymond, 1987; Reference SharpSharp, 1988; Reference LawsonLawson, 1996) suggest that internal deformation also takes place during the surge event. This deformation may be purely ductile and associated with extensional flow regimes, but this does not fit with observations of as much as 95% of basal sliding against only 5% of flow due to plastic deformation during a surge (Reference RaymondRaymond and others, 1987). In this paper, it is suggested that some glacier surges are related to brittle deformation within the glacier, occurring as sliding on discrete shear planes, thus affecting the entire glacier thickness and causing effective extension. To examine this hypothesis, conceptual and semi-quantitative geological deformation models have been utilized. This is not new, and glaciers have often served as natural laboratories for the study of certain geological deformation modes. Here I attempt to explain extensional phenomena that occurred during a specific surge – the 1985 Glaciar Horcones Inferior surge – by applying large-scale geological models of deformation related to basal detachments. The Glaciar Horcones Inferior surge was accompanied by compression deformation in the terminal sector, but the internal characteristics of this deformation could not be observed, due to high debris concentration near the glacier terminus. Various geological models have been applied to explain compressive deformation in surging glaciers (Lawson and others, 1994; Reference Bennett, Huddart and WallerBennett and others, 2000). Here, the main focus is to better understand the surge deformation of the glacier in segments characterized by extensional flow. This deformation mode is perhaps the most important for explaining glacier advance.
Most of the existing geological models of extensional systems associated with a detachment are two–dimensional (Reference Wernicke and BurchfieldWernicke and Burchfield, 1982; Reference Darros de MatosDarros de Matos, 1993; Reference Withjak and IslamWithjak and others, 1995), but they can reasonably be applied to this surging glacier due to the existence of important lateral shear zones observed in this specific case. The effective shear along these marginal shear zones is documented by the fact that velocity vectors do not change significantly along a transverse line in a surging glacier (Reference RaymondRaymond and others, 1987). The deformation model gives a simple explanation for the start of a surge and the way it evolves, including the generation of a kinematic wave, but this paper does not tackle the issue of enhanced basal sliding. As the deformation process discussed here favours destruction of the existing subglacial drainage system, the deformation model is highly compatible with existing models for fast flow, such as the linked-cavity model (Reference KambKamb, 1987; Reference RaymondRaymond, 1987; Reference SharpSharp, 1988; Reference PatersonPaterson, 1994).
The 1985 Glaciar Horcones Inferior Surge
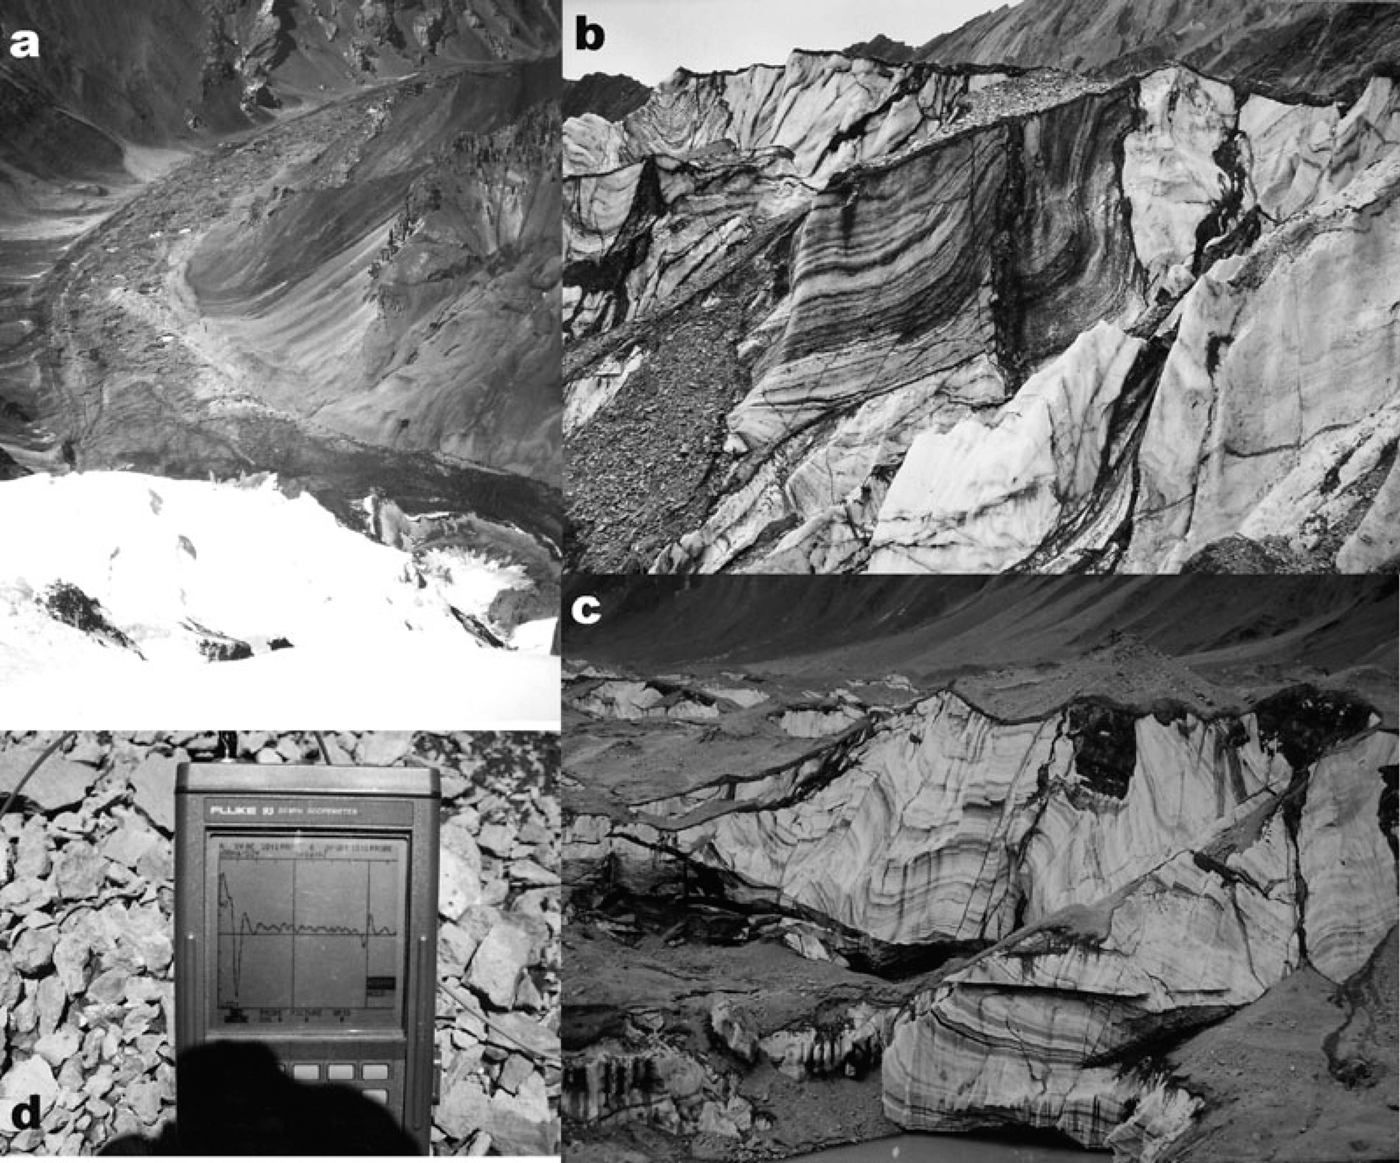
Glaciar Horcones Inferior is located in Aconcagua Park, Mendoza Province, Argentina, at approximately 32°42′ S, 69°58′ W (Fig. 1). It extends from an altitude of 4300 to 3650 m. It is one of the longest glaciers in the area, mostly because it receives all the precipitation captured by the south face of Aconcagua. Due to the steep slope of this face and the almost 3000m vertical relief, snow and ice are permanently supplied to the glacier by several avalanches per day. Avalanches also carry debris in different concentrations, and flat avalanche cones are formed at the foot of the face, where it is possible to identify different events according to the dirtiness of the snow (Fig. 2a). This process of accumulation incorporates a high concentration of debris into the ice in the accumulation area of the glacier, producing very well-defined stratification in the glacial ice (Fig. 2b and c). As soon as the glacier passes into the ablation area, melting helps to concentrate debris on the glacier surface and it soon develops an almost continuous cover.
Location map of Glaciar Horcones Inferior, showing access and the location of Glaciar Horcones Superior, where radio-echo sounding surveys were conducted.

(a) Avalanche cones fed by the south face of Aconcagua feed the top of the upper part of Glaciar Horcones Inferior. Photograph taken from Aconcaguaµs summit. (b) Vertical shear zone running parallel and coincident with the glacier lateral scarp, suggesting it acted as part of the lateral detachment. Note different ice types separated by the vertical faults. (c) Stratified glacial ice showing folding subsequently cut by extensional faults, imaging a complex deformational story of this surging glacier. Visible exposed ice faces are the ablated fault scarps (looking in the upstream direction). (d) View of the debris cover and the oscilloscope used for depth determination during the survey by Reference BrizuelaBrizuela (1999), who recovered ice depth at ∼90 points.
Observations of the effect of the debris cover suggest that it acts as a protective layer after it reaches a thickness greater than ∼10 cm. Conversely, debris layers thinner than 10 cm seem to aid ablation, since such surfaces are usually slightly lower than clean ice surfaces. In addition to the debris carried by dirty avalanches descending from the south face, mixed flows (debris, snow, water) contribute mass to the glacier from bordering colluvial and alluvial fans.
For Glaciar Horcones Inferior, the transition from an uncovered to a debris-covered glacier occurs over a short distance because the top of the glacier is subject to high ablation rates as it lies at very low altitude (4300–3900 m). In fact, the nearby Glaciar Horcones Superior has its terminus at 4300 m, and its ablation area extends up to 4900 m. Thus, the low altitude of the accumulation area of Glaciar Horcones Inferior is explained by accumulation produced from avalanches at the foot of the south face of Aconcagua, and the ice enters the ablation area as soon as it advances beyond the influence of Aconcagua’s south face. Debris-covered glaciers are very common in this area (Reference CorteCorte, 1976; Reference Corte and EspizúaCorte and Espizúa, 1981; Reference Milana and MaturanoMilana and Maturano, 1999) and it is sometimes difficult to see the ice below the debris, as it ranges up to a few metres in thickness. Sometimes the high concentration of debris falling into crevasses and mixing with the glacial ice body causes it to evolve downstream into a rock glacier, which is locally recognized as the last stage of local glaciolithic systems (e.g. Reference Corte and EspizúaCorte and Espizúa, 1981) and the lowest-altitude type of ice-bearing body.
Glaciar Horcones Inferior probably slides over debris as there are no rock exposures at the sides or at the base in areas previously occupied by the glacier. Subglacial tunnels have been identified in this glacier. These are a common feature in debris-based glaciers of the area. Most tunnels observed are Röthlisberger-type (R-type) and are usually partially filled with stream sediments. Tunnel size is usually not large and the maximum diameter observed in glaciers of the area is 1.8 m.
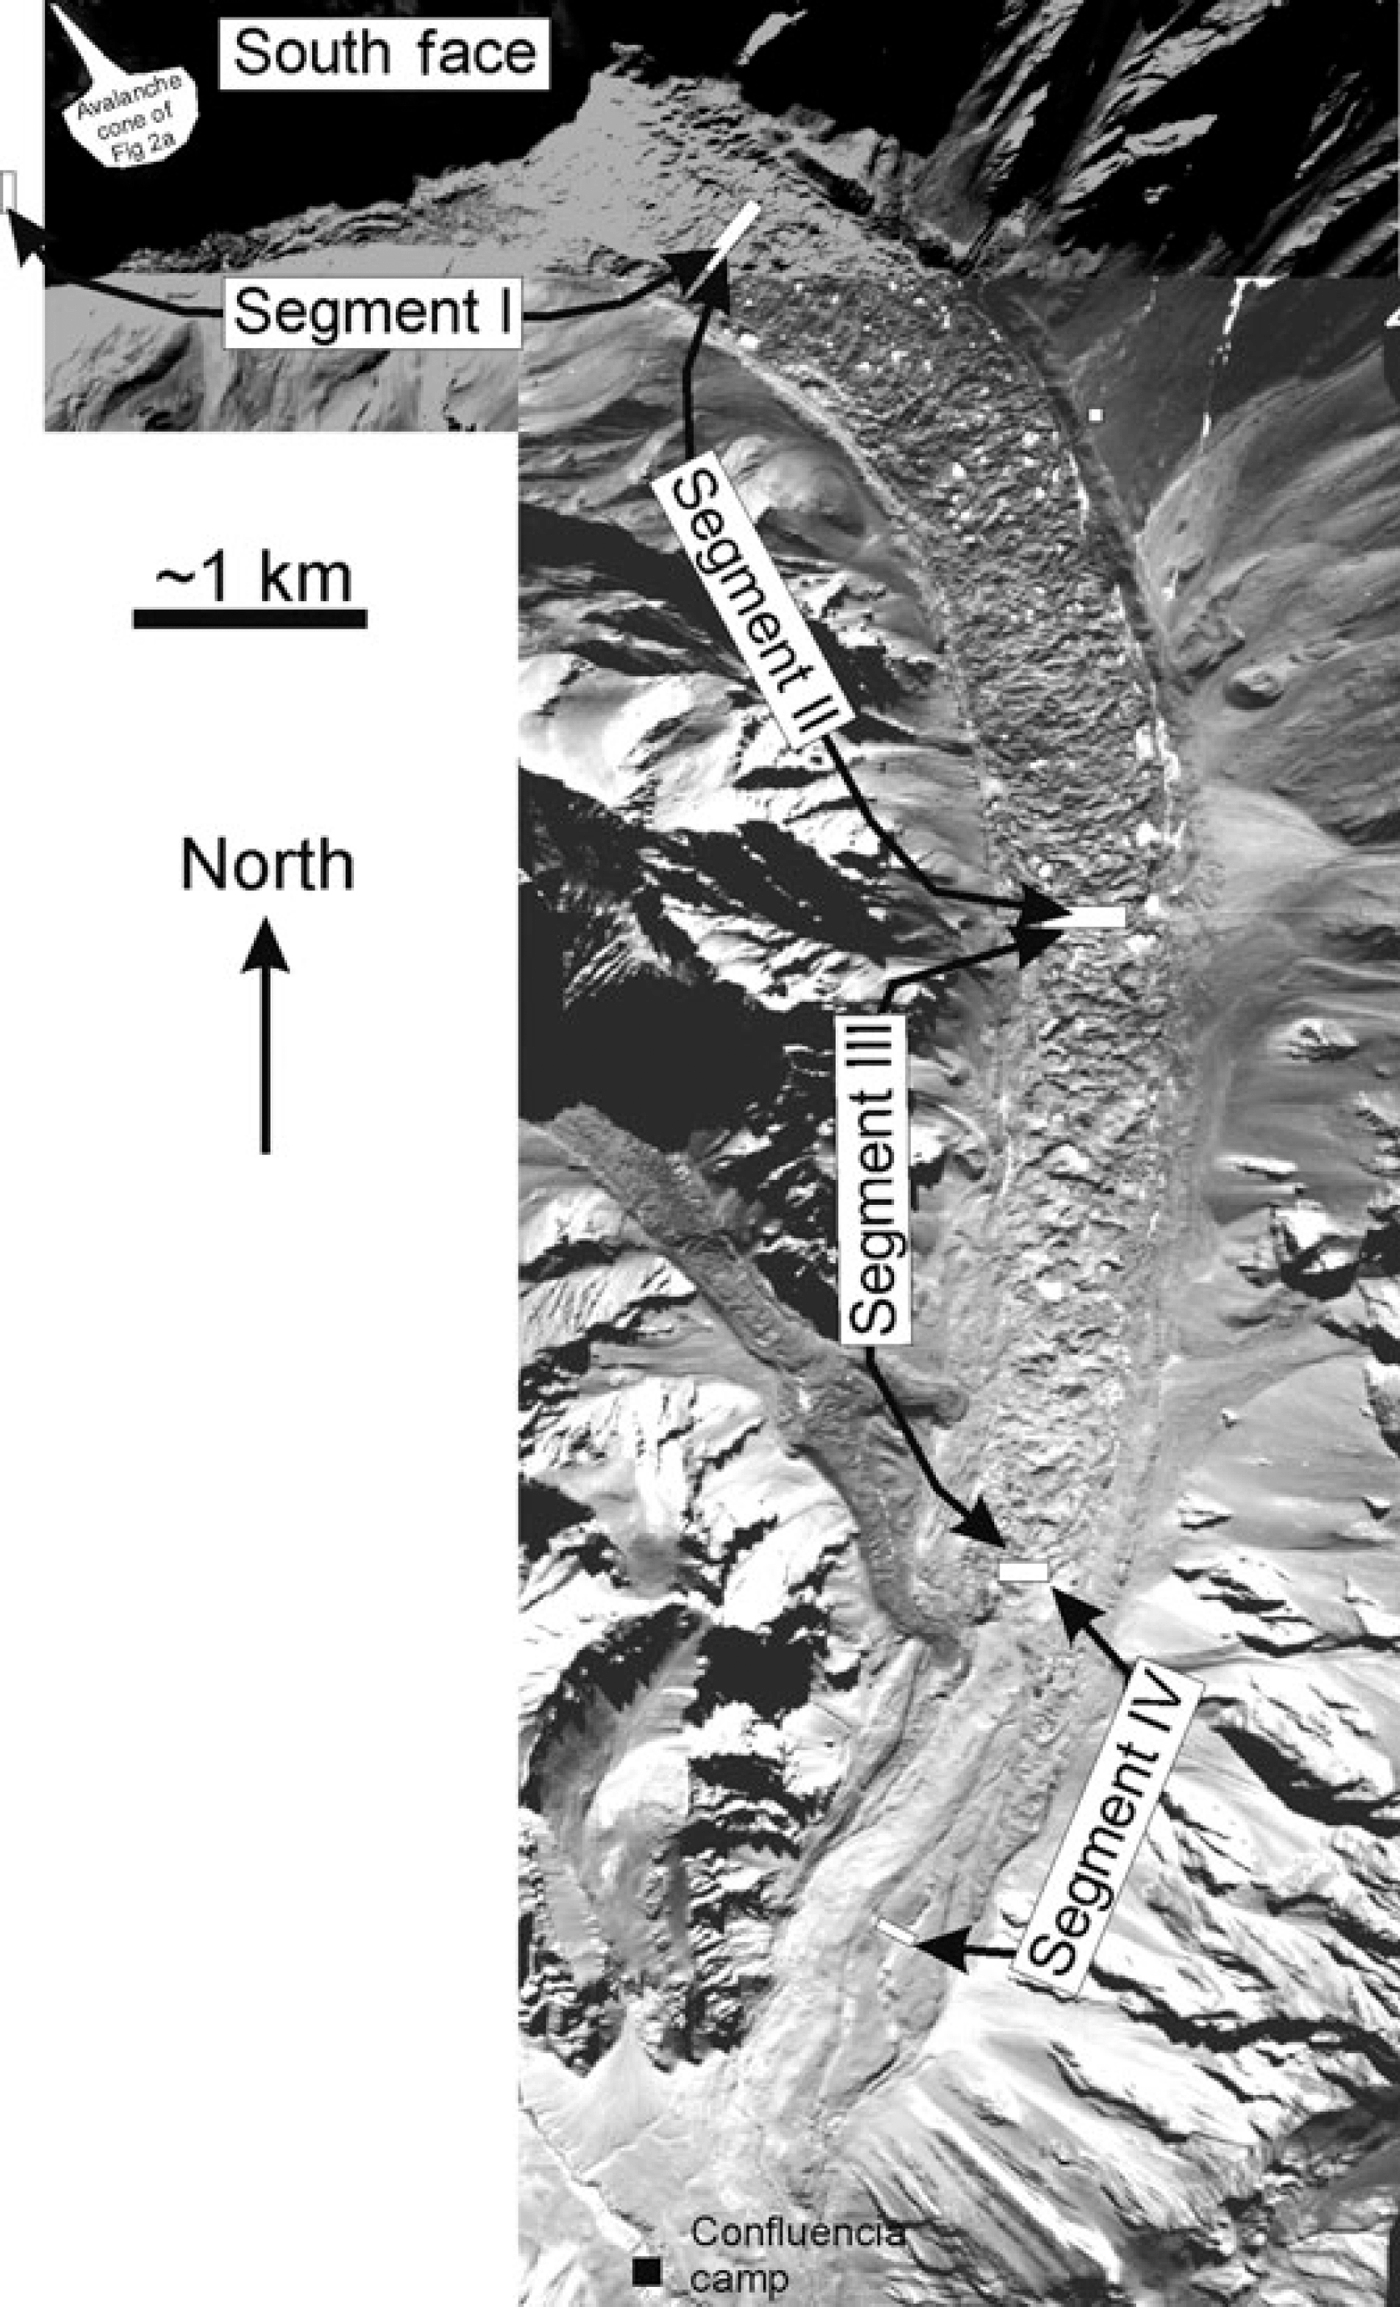
Prior to the 1985 surge, most of Glaciar Horcones Inferior was debris-covered, except for the reduced accumulation area (Fig. 3). Ice was only visible in a few scarps and around water-filled thermokarst depressions or ablation hollows (e.g. Reference CorteCorte, 1976; Reference Corte and EspizúaCorte and Espizúa, 1981). The relatively smooth debris cover passed laterally into the colluvial debris of the valley sides, but became highly dislocated during the surge. Pre-surge length of the glacier was 9.45 km. After the surge it was 11 km, indicating an advance of the terminus of 1.55 km. The surge produced a general lowering of the glacier surface, with respect to alluvial and colluvial sedimentary surfaces that were previously within its margins. The former, relatively smooth boundary changed into a sharp topographic step of ∼30m relief. Recent erosion of the step has exposed a shear zone composed of a few vertical fractures running parallel to the glacier margin with debris along the planes (Fig. 2b). There is ice present on both sides of the fractures but of different origins, suggesting this shear zone acted as a lateral detachment plane between the glacial and the non-glacial ice (permafrost) of this valley. This kind of lateral shear zone has been described in other surging glaciers (Reference StanleyStanley, 1969; Reference Dolgoushin and OsipovaDolgoushin and Osipova, 1975; Reference KambKamb and others, 1985; Reference RaymondRaymond and others, 1987). The existence of a lateral step contrasts with most debris-covered glaciers of the region, which usually do not show a clear lateral limit of glacier and flanking colluvial debris.
Two aerial photographs of Glaciar Horcones Inferior showing approximate boundaries of the segments described in the text. Note hollows with water on top of the glacier, interpreted as thermokarst features.
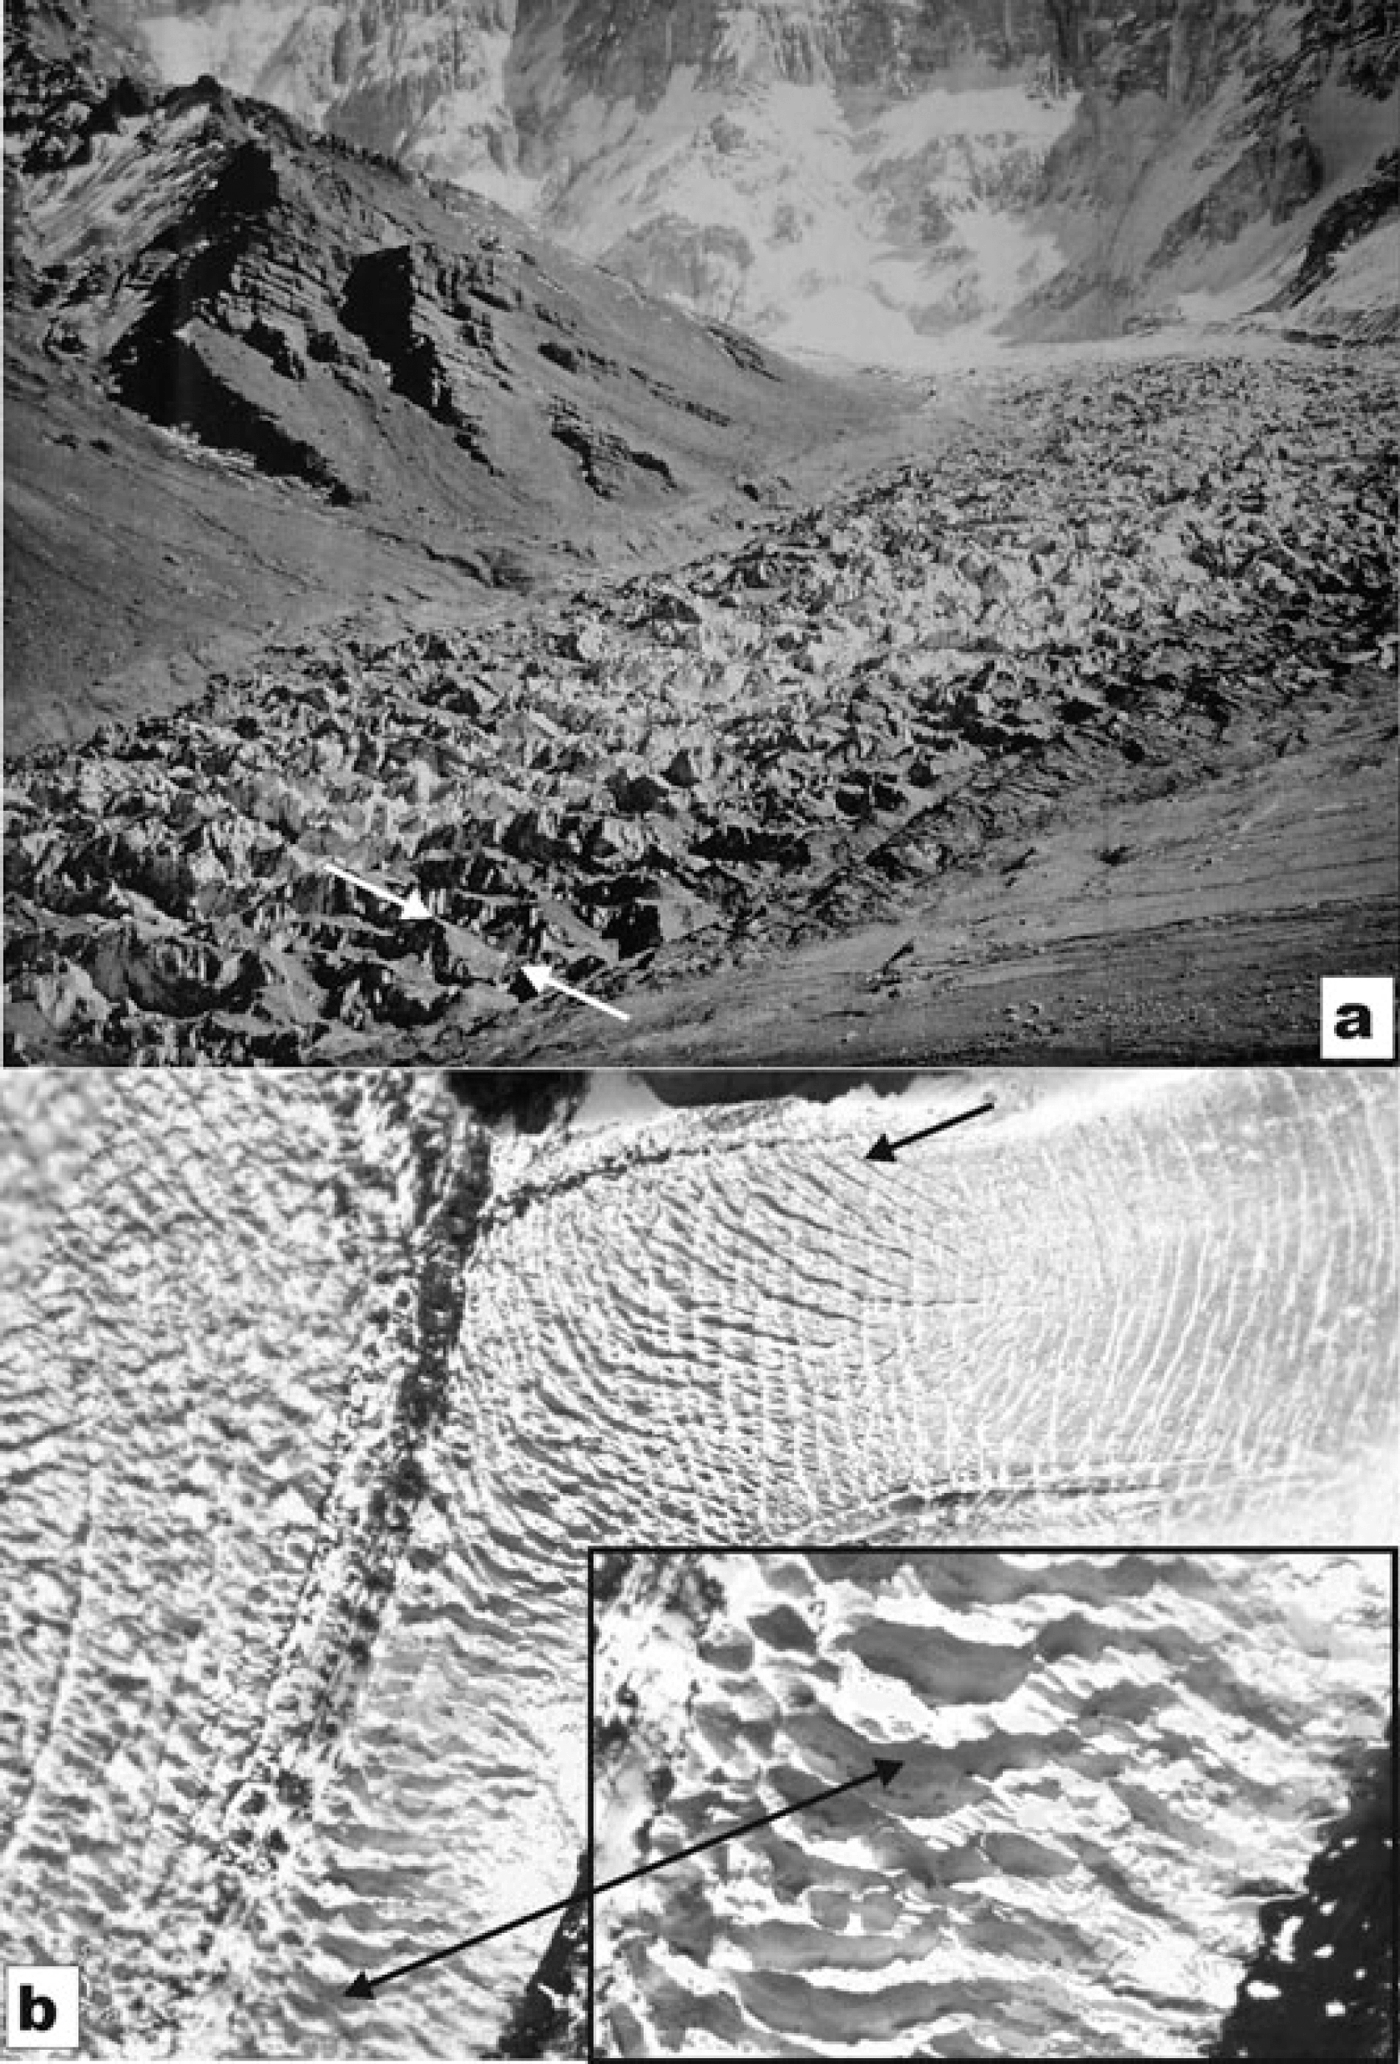
The most striking feature developed during the surge was the deformation of the glacier surface. The continuous debris sheet covering the glacial ice was dislocated during initial stages of the surge, indicating the formation of evenly spaced tilted blocks that remained several years later (Fig. 4a). Observations of pre-surge conditions are based on aerial photographs, surface photographs and personal qualitative observations. Glacial conditions were not measured during the beginning of the surge event as the process remained unrecognized until its advanced stages, but photographs were taken while deformation was still in progress. Post-surge conditions were evaluated based on photographs taken soon after it ended, and direct measurements were made of the remaining deformation and surface conditions in January 1998. Topographic and geophysical measurements were also taken in 1998.
To study the extensional deformation, the glacier was divided into four longitudinal segments (Fig. 3). The first segment (segment I) ends 3.1 km from the glacier upper end, and comprises the accumulation area. Segment I exhibits almost no deformation related to the surge, and hence practically no surface lowering. Segment II extends from 3.1 to 6.5 km and shows an average of 30 m surface lowering. It contains a system of rotated ice blocks (Fig. 4a). Blocks are bounded by faults spaced ∼40 m apart, with an average dip of 61.9° (n = 15, standard deviation (SD) = 4.2). The average debris-cover inclination over the rotated blocks is 27.8° (n = 15, SD = 4.4). This is in the opposite direction to the slope of the glacier, suggesting a true tilting of 30°, based on the average slope of the glacier in this area. Fault traces are perpendicular to the glacier margin but discontinuous across it. Instead, transfer zones accommodate slip between trains of equally spaced, but displaced, fault systems. Segment III extends from 6.5 to 9.3 ± 0.3 km and exhibits a pattern of surface deformation similar to that of segment II. Fault spacing in segment III ranges up to 70 m, and blocks are more continuous laterally. Surface lowering is about the same as in segment II (30 m) but is more difficult to assess, as the relief is highly variable and tends to be smaller at the downstream end of the segment. Average fault dip is 60.3° (n = 3), and debris cover dip of the blocks is 31° (n = 3, SD = 3.5), indicating a rotation of 33° as recorded by the debris cover. Segment IV (9.3–11 km) is represented mainly by parts of the glacier that advanced, and shows no evidence of the pattern of extensional deformation observed in segments II and III; no detailed observations have been made in this area. The absence of rotated blocks combined with the fact that it is the terminal area suggests this segment was subject to compression as normally described for the terminal parts of surging glaciers (Reference RaymondRaymond and others, 1987; Reference Lawson, Sharp and HambreyLawson and others, 1994; Reference Murray, Dowdeswell and DrewryMurray and others, 1998; Reference Bennett, Huddart and WallerBennett and others, 2000).
(a) The upper part of segment II of Glaciar Horcones Inferior, showing the system of faulted and rotated ice blocks produced by the surge. In the background is Aconcagua’s south face. (Photograph courtesy of Instituto Argentino de Nivología, Glaciología y Ciencias Ambientales.) Arrows show dislocated and rotated debris cover dipping upstream. (b) Another high-altitude glacier (East Rongbuk Glacier, Nepal, draining the north slope of Qomolongma) showing domino-style rotated blocks. Note that the rotational faults cross-cut pre-existing tensile crevasses that fade downstream, at very large angles. Double arrow shows similar rotated blocks, magnified. Single arrow shows how the rotational fractures initiate cutting at 90°.
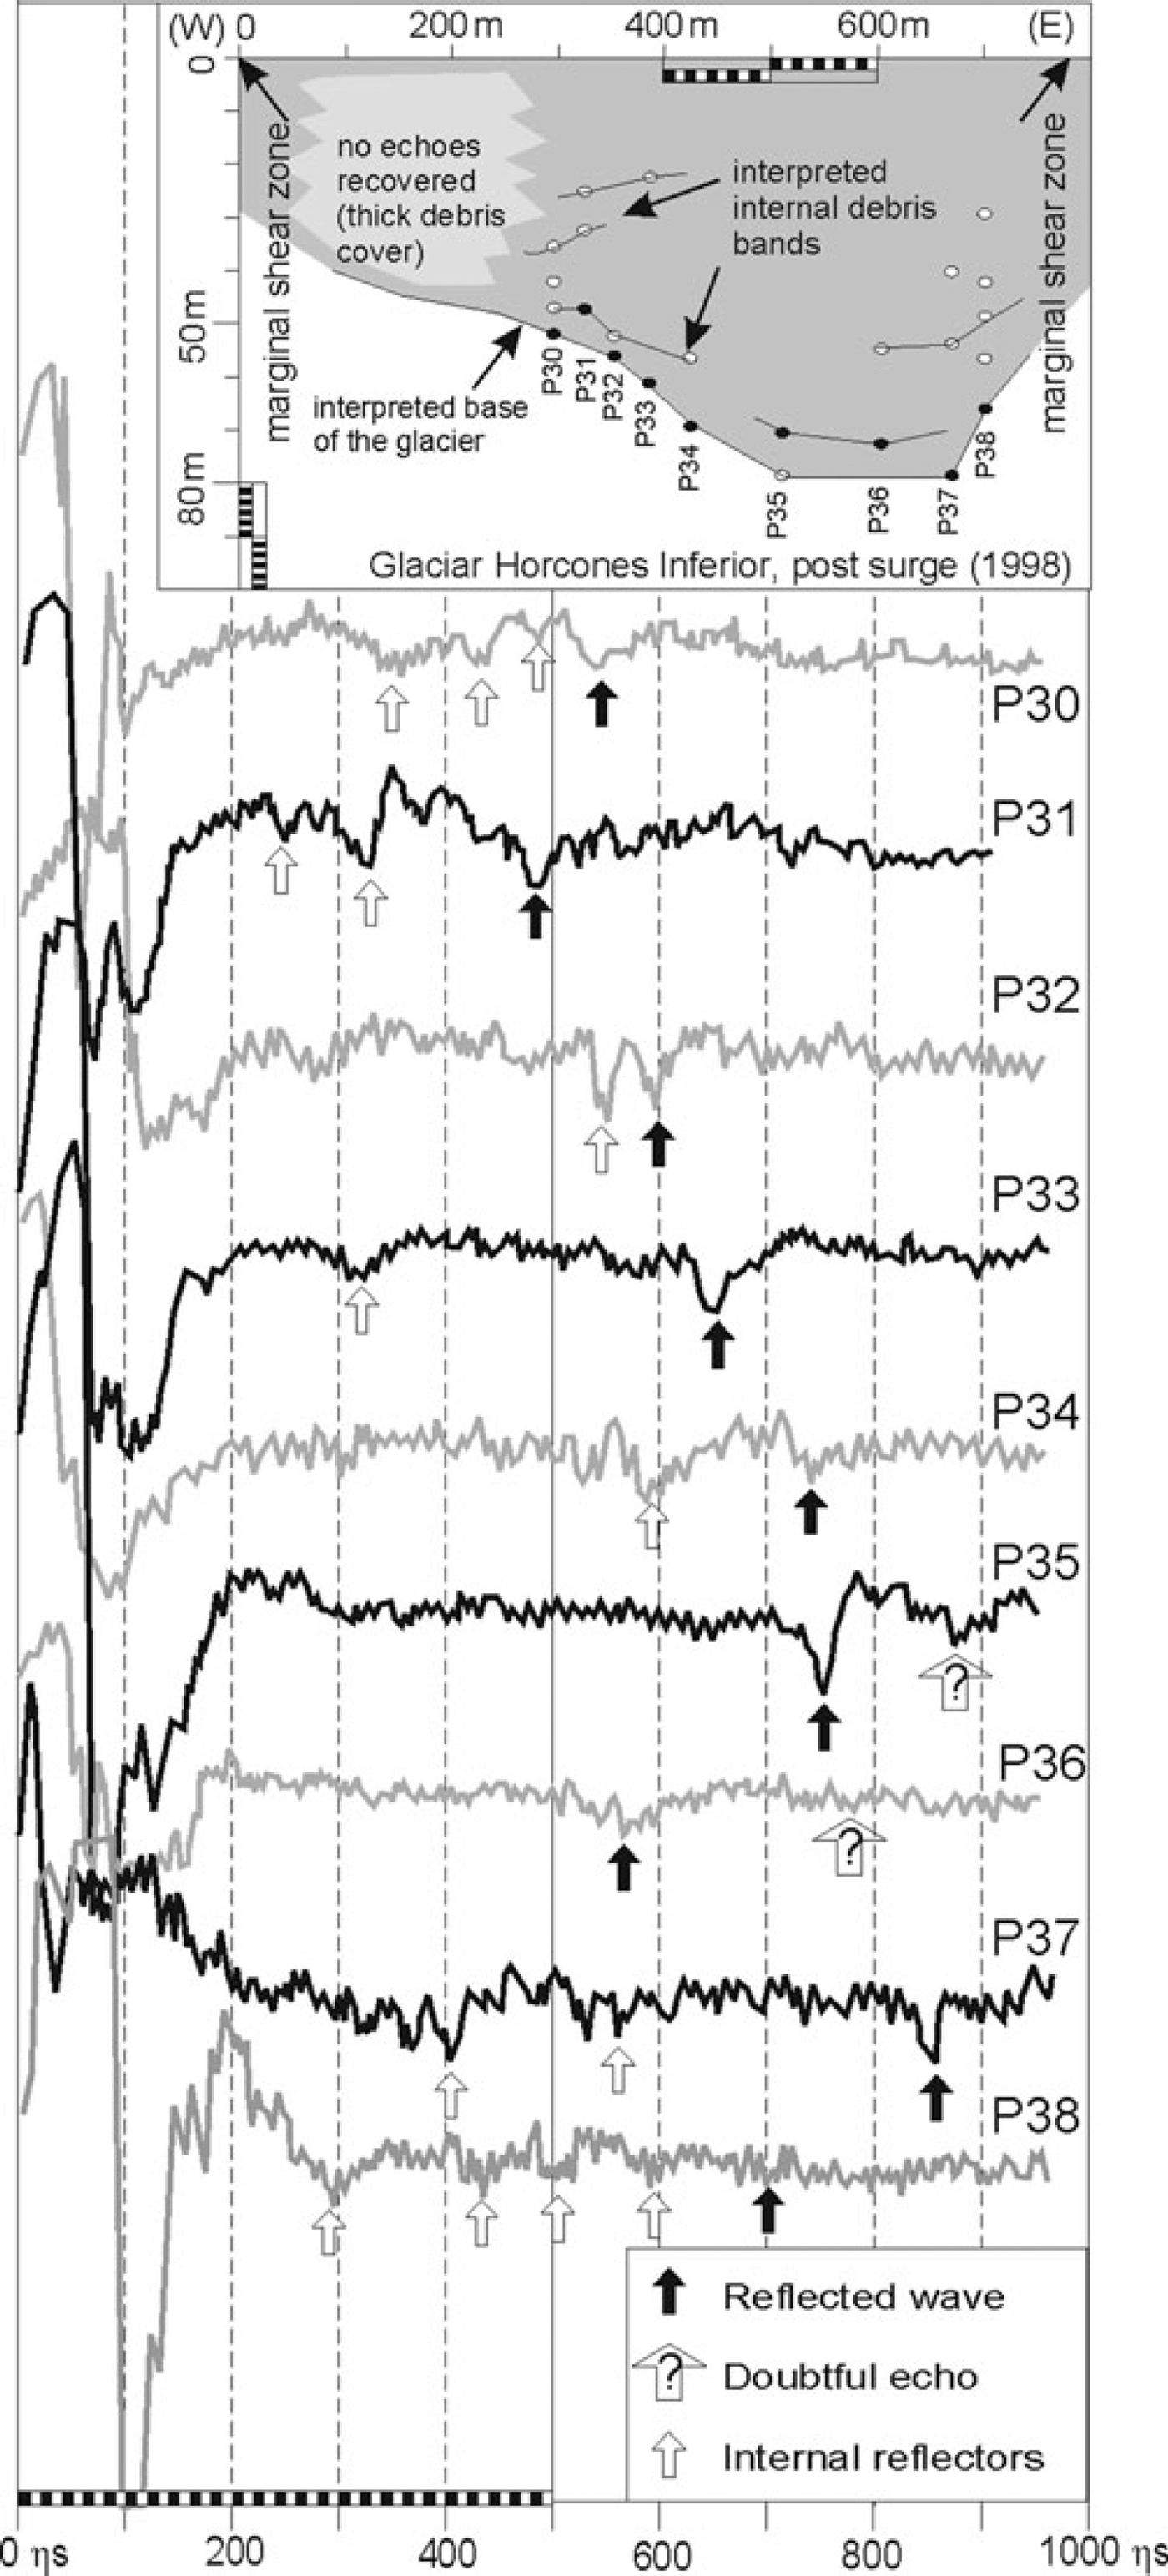
To determine ice-thickness changes, a survey was carried out using the portable radio-echo sounding (RES) system described by Reference Milana and MaturanoMilana and Maturano (1999). The scopemeter lacked a PC interface, so each trace was photographed and later digitalized (Fig. 2d). It also lacked a built-in stacking function causing very noisy recordings. Echoes were identified in the field as stable, with good waveforms, a fact that is not always reflected in the recorded trace (Fig. 5). Where the debris cover exceeded ∼1 m, it restricted recovery of basal echoes, but the basal echoes that were recovered suggested that ice depths range from 70 to 95 m at the glacier centre, and decrease to ∼50 m near the margin. Several minor internal reflectors were detected but they did not correlate between data-collection locations. Several RES data points and sections were measured by Reference BrizuelaBrizuela (1999) but this work lacked proper geodetic support. The surveys indicate that average glacier thickness along segment II is ∼70 m. RES data shown in Figure 5 were obtained from a short survey done after the field surveys to show the present-day crosssection of this glacier.
Traces digitized from the RES survey and reconstruction of glacier cross-section, measured near the limit between segments II and III (see Fig. 3). Several points (P numbers) with no recognizable echoes (mostly associated with thicker debris cover) were not digitized.
Interpretation of the Extensional Deformation
The characteristics shown by the glacial surface deformation (Fig. 4a) suggest that extension was produced by a domino or bookshelf system. The domino-style deformation, or linked planar rotational extensional faults (Fig. 6a), is one of the first extensional systems numerically modelled in geology (Reference Wernicke and BurchfieldWernicke and Burchfield, 1982). Given the fault dip (σ) and block rotation (ϕ) it is possible to calculate the relation between length before (l 0) and after (l) extension with the expression: l/l 0 = sin(σ + ϕ)/sin σ (Reference ThompsonThompson, 1960). The amount of extension is independent of block width (or fault spacing), but dependent on block rotation (as in a set of thick or thin books on a shelf). This model requires that the basal detachment (in this case, the sliding glacier base) be roughly planar, and that fault spacing be regular. The geological model has the problem of balancing the creation of many empty spaces above the basal detachment. This problem is easily solved in the case of a glacier, because voids below each rotated block can fill with water.
Basic models of extensional fault systems related to a detachment. (a) Domino or linked planar rotational extension faults, with indication of surface lowering, Δh, original length, l 0, and final length, l. (b) Linked listric extensional faults.

Another problem with the domino model is that the extension is usually small. Calculations using the model based on the surface deformation in Glaciar Horcones Inferior suggest extension of 12% and 13% for the second and third segments, respectively, yielding a total extension for the domino model of 864 m. This amount is low compared to the observed 1.55 km net advance of the glacier terminus. Additionally, the total extension of segments II and III needs to be greater than 1.55 km in order to account for the usually observed compression at the terminal part of the surge (Reference Lawson, Sharp and HambreyLawson and others, 1994; Reference Hambrey, Dowdeswell and MurrayHambrey and others, 1996; Reference LawsonLawson, 1996; Reference Murray, Dowdeswell and DrewryMurray and others, 1998; Reference Bennett, Huddart and WallerBennett and others, 2000). The extension calculated with the domino model also does not fit the mass loss indicated by glacial thinning. Glacier surface lowering (30 m) coupled with average ice thickness (70 m) suggests 30% thinning. In a two-dimensional model, average thinning should be balanced by extension, and thus the 12–13% extension calculated using the domino model does not seem to be correct. Additionally, the 30° rotation of blocks along planar faults causes only 13 m of surface lowering in a 100m thick glacier; less than half the surface lowering observed in the glacier. Therefore the domino model does not fit the observations.
A second possible model consists of a system of linked curved (listric) faults. The problem with this model is that linked listric faults usually cannot explain equally rotated and evenly spaced extensional faulted blocks. This is because linked listric extensional faults (Fig. 6b) are expected to show progressively higher values of rotation due to rollover on the curved fault surface. Therefore, rotation increases as more faults are added, except when fault displacement equals block length (Reference Wernicke and BurchfieldWernicke and Burchfield, 1982).
However, Reference Darros de MatosDarros de Matos (1993) demonstrated that linked listric extensional faults can show similar surface expression to domino systems. The extension calculated for high-angle listric fault systems usually exceeds, by three to four times, those calculated for domino systems with similar surface characteristics (Reference Darros de MatosDarros de Matos, 1993). To make this geological model possible, a certain amount of slip must be accommodated by hanging-wall block internal shear, thus implying the block does not behave as rigidly as in domino systems or in the linked listric model proposed by Reference Wernicke and BurchfieldWernicke and Burchfield (1982). The application of this model to a glacier implies some ductile deformation of the ice blocks, consistent with plastic behaviour of ice under stress (Reference Russell-Head and BuddRussell-Head and Budd, 1979; Reference WeertmanWeertman, 1983; Reference Budd and JackaBudd and Jacka, 1989; Reference AlleyAlley, 1992; Reference PatersonPaterson, 1994). This listric fault model solves the problem of explaining unrealistically similar rotated blocks and high extension values.
If the linked curved fault system of Reference Darros de MatosDarros de Matos (1993) is used, boundary conditions must be carefully selected. The two most critical boundary conditions are (i) the angle of internal shear and (ii) the fault shape. The angle of internal shear determines the direction of movement of the particles in the collapsing hanging wall (Reference White and JacksonWhite and others, 1986). Very different block-top tilting and curvature occurs if different angles are selected. To select the model that best fits the data, a graphical comparison was made between several model runs and the observed deformation at Glaciar Horcones Inferior. Subsequently, additional deformation was added incrementally until the model was in agreement with deformation of the glacier. The resulting model is shown in Figure 7. The best geometrical similarity between modelled and measured data is achieved with antithetic internal shear of 15° (from vertical). This angle depends largely on the deformed material and the sliding surface (Reference Withjak and IslamWithjak and others, 1995). The choice of this angle depends on the balance of two factors. The first is a diminishing effect of curvature of the top of the blocks. The block-top surfaces appeared quite flat in the field survey, but some of the loose debris from the top of the blocks might have slipped down to smooth out the curvature. Debris cover was found to be thicker at lower parts of the block when surveyed in 1998. The second factor is the angle of block-top tilting, which is high.
(a) Geometric array of listric faults used to model the deformation observed in Glaciar Horcones Inferior. Model data: a, internal-shear angle: 15°; inclination cover (average): 30°; inclination fault (at lowest visible point): 62°; i and j are fault shape variables (see text): 12.5 and 0.3, respectively; apparent horizontal extension: 30% (apparent horizontal extension of a domino system is 13%); initial ice thickness: 100 m; final ice thickness: 74 m; block width: 60 m. (b) Effect of internal-shear angle, a, on block-top shape (modified after Reference Darros de MatosDarros de Matos, 1993) with i and j 11 and 0.2, respectively.
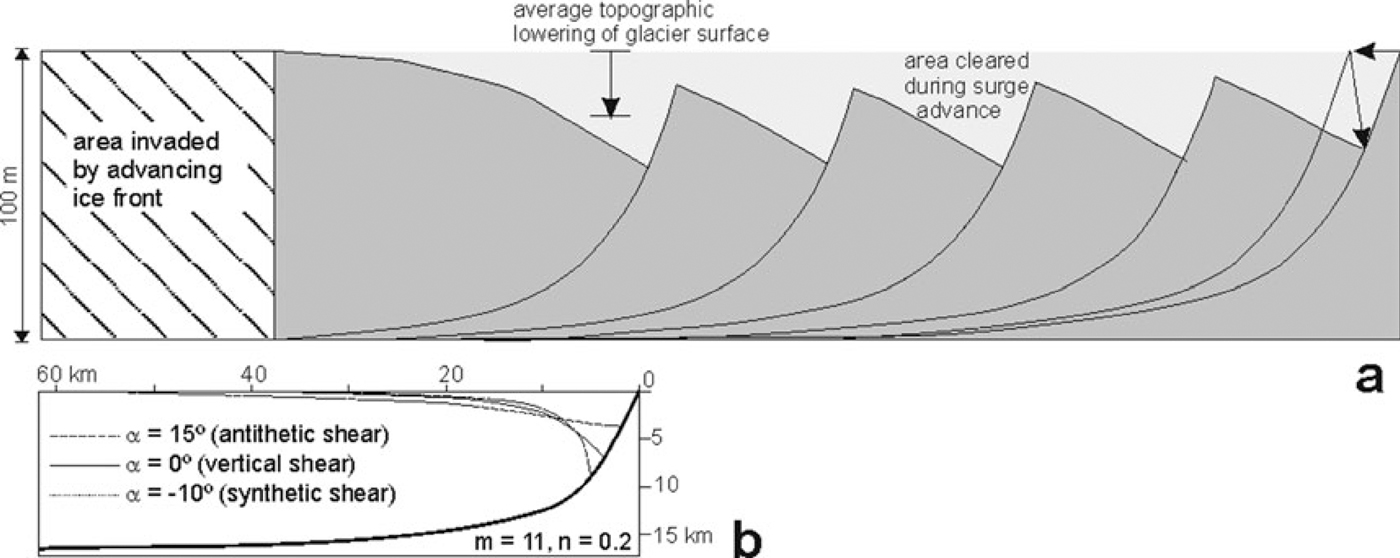
It is interesting to note that the selected antithetic internal-shear angle of 15°, based on geometrical similitude, is also associated with well-lubricated detachments, consistent with the base of a surging glacier. This is shown by experimental deformation along extensional listric faults, as indicated by Reference Withjak and IslamWithjak and others (1995), who found internal-shear angles of 15–20° using a mylar sheet as a detachment plane while the internal-shear angles were 35–40° using an aluminium plate. This indicates that the basal shear may control the block internal deformation to some extent.
The second boundary condition is the fault shape which, when combined with the internal angle of shear, gives the geometry of the surface. Most listric faults can be modelled geometrically by the function y = i arctan(jx) (Reference Darros de MatosDarros de Matos, 1993), where i and j are constants that determine initial inclination and shape (i.e. how tightly the surface curves down to the basal detachment). The best geometrical fit between fault inclination, top tilting and the rate of extension is achieved with faults dipping initially 75° near the top, reaching a dip of ∼62° near their lowest exposed part. Fault constants were i = 12.5 and j = 0.3, and a 30% extension gives the top an average tilt of 30° with minor curvature. As indicated previously, a domino system like this would be related to 13% of apparent horizontal stretching, so this model produces 2.5 times more stretching for a similar surface deformation. The fault spacing in the reconstructed model is 60 m, which is higher than observed, but this factor does not significantly alter the values of extension and surface geometry. Surface lowering for this model is approximately 26 m, and the section presented in Figure 7 is area-balanced, so that the lost area on the top of the glacier matches the area down-glacier newly occupied by ice.
The deformation model selected fits the observed geometry well, and helps to solve the problem of the underestimate of extension using the domino-system model. Analysis of glacial thinning alone, provided by data on the surface lowering and the ice thickness, suggests that the glacial extension should be no less than two times the extension indicated using the domino-system model (13%). Therefore, a 30% extension rate modelled by the listric linked-fault system fits the observed thinning well. Additionally, the block internal-shear angle suggests a well-lubricated detachment, consistent with the assumption of reduced basal shear during surge deformation. Initial tensile faults will actually be initiated as crevasses, which tend to be sub-vertical at the surface, curving to lower angles near the glacier base (Reference HolmlundHolmlund, 1988). Subsequent deformation will change the shape of faults to develop the final listric shape of the model. However, there is no need for an exact match between the model and observed deformation, as fault curvature may also be modified by subsequent plastic flow of the glacier.
Discussion
Surface deformation patterns similar to that described for Glaciar Horcones Inferior have been observed in other glaciers. The public release of high-quality images of many regions of the world on several free-access websites allows easier analogue searching than before. Inspection of glaciers expected to form in similar environmental conditions to Glaciar Horcones Inferior (high ice input rates at the upper reach by avalanches; low snow accumulation over most of the glacier surface due to semi-arid conditions; high slopes; high rates of debris input) showed that this type of deformation may be common under certain circumstances. In particular, many of the glaciers draining the north slope of Qomolongma exhibit domino-like surface deformation at some reaches in their length. Detailed inspection of high-resolution images of East Rongbuk Glacier, Nepal, (28°04′ N, 86°55′30″ E) shows it has developed this type of surface geometry. In this case, fractures along which slip and rotation occurred evolved in a completely separate strain orientation than existing tensile crevasses, crosscutting them (Fig. 4b). The high definition of these images (pixels of ∼1 m) permits even the recognition of the upper snow/ice layers that allow determination of block rotation. The same ‘crenulated’ appearance of glacier surfaces, which is definitively not similar to ogives development, was observed in certain segments of Baltoro Glacier, Karakoram. Pictures of Franklin Glacier (51°16′ N, I25°25′ W) in Canada, published on the Royal Geographical Society website (http://images.rgs.org/; image No. S0014491) also show this type of surface deformation.
The domino model may help in understanding tensile stresses, if any are present. It is important to keep in mind that given any specific set of surface structures, multiple solutions for the underlying structure may exist. What is important in solving the geometry of the buried structures is to use models that correctly balance the section. Only models in which the area in two dimensions (or volume in three dimensions) is the same before and after deformation are valid. The geometry must also fit the expected stress-field conditions. Another solution may consider the existence of a brittle–ductile boundary at a certain depth in the glacier (as occurs in crustal-scale deformation). This solution would imply a combined deformation mode consisting of an upper brittle zone where rotated blocks develop, and a deeper ductile zone where pure shear extension occurs. Independent of the solution selected, the development of a domino-like surface deformation clearly indicates the glacier is extended at a faster rate than that associated with the ductile deformation occurring during non-surge flow stages. In Glaciar Horcones Inferior, ductile deformation is expected to prevail over brittle failure during non-surge flow periods, due to the development of a continuous and almost undeformed debris cover, that becomes fragmented during the surge.
Surge triggering and evolution: glacier deformation and the fast-flow mechanism
Whatever the initial trigger for a surge, it may not be strong enough to fuel the entire surge process, and to keep the glacier deforming at such high rates. Therefore, a mechanism that helps or keeps this process going is needed. Thus, processes promoting fast glacier flow, such as the linked-cavity model of Reference KambKamb (1987), may work together with internal deformation to aid the rapid stretching.
As suggested by Reference LliboutryLliboutry (1958) and Reference RöthlisbergerRöthlisberger (1972), high surge velocities can be explained by a reduction in basal shear stress due to a reorganization of subglacial drainage from a tunnel system to an overpressured system, possibly a linked-cavity system. That explanation, however, does not explain why surges occur at regular intervals, while the deformation model here proposed does. It requires only a glacier that is not efficient at evacuating mass through nonsurge glacier flow. Such a glacier slowly accumulates mass at the upper reaches until an internal threshold is achieved and the glacier simply fails downslope, exhibiting surface extensional deformation. However, the process responsible for surge initiation is still an issue of debate. One possibility is that deformation starts first and causes the destruction or alteration of a subglacial tunnel network, forcing it to evolve to a linked-cavity system. The other is that blockage of the main tunnel raises subglacial pressure and helps initiate deformation. Both these processes seem to help to sustain the surge, but certainly no surge would be precipitated if mass overload did not occur, as mass is needed to fuel the long-lasting advance.
Further research is required to explain the mechanisms of fast flow in Glaciar Horcones Inferior. As indicated previously, this debris-rich glacier seems to slide over debris, and Rothlisberger tunnels (R tunnels) are carved into the basal ice over this debris. Observed tunnels are usually halffull of stream sediments, and Nye channels (N channels) or other broad channels or canals (Reference Walder and FowlerWalder and Fowler, 1994) were not observed. Stream sediment erosion may help in keeping these tunnels open, but the conditions of the debris under this glacier are still unknown.
A strong possibility is that the debris layer below the main sliding surface or basal detachment consists of frozen debris. A RES survey carried out in Glaciar Horcones Superior, located nearby (Fig. 1), indicated there was ice below the reflector interpreted as basal (Reference Milana, Maturano and CroceMilana and others, 1999). This suggests that the ground is frozen below the glacier, so it probably slides over impermeable ground. Phase analyses of the reflected wave at the basal reflector suggest there is water across a significant part of the surveyed section. The presence of a basal glacier layer with water over frozen ground has been reported by Reference Clarke and CollinsClarke and others (1984) for a surging glacier. Glaciar Horcones Inferior may slide over debris-rich frozen ground, a hypothesis that would explain why this glacier is not efficient in evacuating mass, compared with its neighbouring, non-surging, glaciers.
Conclusions
Deformation produced during the 1985 Glaciar Horcones Inferior surge is satisfactorily explained by a system of linked rotational extensional listric faults, which result in 30% extension overall. Although surface deformation suggests a domino system of faults, the 12–13% extension calculated for domino-style deformation does not fit observations of the glacier’s advance (minimum extension of 16%), nor its 30% average thinning. The deformation model is related to an increase in displacement vectors down the glacier to the compressional zone. The deformation system agrees also with most of the characteristics of other observed surges, except that it does not fit with systems where the glacier slides like a raft (displacement vectors roughly similar) and instead suggests that it was strongly deformed internally. This deformation occurred mainly along shear planes bounding rotated blocks, and secondarily by internal shear of individual blocks.
The present model is not a unique solution, and other models may explain the surface deformation observed. Recognition of similar surface deformation styles in other glaciers suggests this behaviour is more common than expected. This mode of glacier deformation is expected to take place when extensional rates are high, and the entire glacier no longer acts as a ductile body, but starts breaking in symmetrical blocks. An alternative hypothesis, not explored in this paper, is that a brittle–ductile boundary may form within the glacier so that blocks and limiting shear planes do not reach the basal detachment.
Although different styles of deformation would fit different glacier surges, the type of deformation observed here suggests that an excess of mass on the upper part of the glacier caused it to break apart. It therefore indicates that a lack of efficiency in mass evacuation was probably the instability required for surge triggering. Having this excess of mass, both the deformation process described here and a hypothetical subglacial crisis, would mutually help to sustain the surge.
Acknowledgements
I thank K. Brizuela and C. Colombi for field assistance, and T. Murray who lent me a transmitter and antennas. The help of the management and park rangers of Aconcagua Park is gratefully acknowledged. M. Dykstra helped greatly with the final text. The manuscript was also greatly improved by anonymous reviewers and the Scientific Editors, J. Glen and T.H. Jacka. Funding from Consejo de Investigaciones Cientifico-Técnicas y de Creación Artistica–Universidad Nacional de San Juan (CICITCA-UNSJ) helped the realization of this work.



