


1. Introduction
In recent years, the rapid development of artificial intelligence (AI) has reached almost all areas of engineering. In design, however, particularly in the field of Computer-Aided Design (CAD), the influence of these technologies has been relatively minor to date. While AI systems are now capable of mastering complex tasks in medicine, autonomous driving, and speech processing, CAD lacks comparable powerful approaches. Despite a large number of scientific papers and industrial prototypes (Adam, 2025; Zoo Corporation, 2021), existing systems are only partially successful in ensuring the precision, robustness, and traceability required for industrial use (Reference Steininger, Camci and FottnerSteininger et al., 2024). At the same time, CAD models themselves have enormous potential that has hardly been exploited to date. They contain not only the geometry of a product, but also valuable procedural knowledge about how the design was created. Each modelling operation, such as sketching, extruding or creating a fillet, has a functional and semantic connection to other elements. This sequential structure of a CAD model thus describes not only what, but also - implicitly and not directly visible - the how and why of the CA-design process (Reference Steininger, Tenzer and FottnerSteininger et al., 2025). However, this implicit knowledge is difficult for data-driven processes to access, as proprietary formats and complex dependencies make direct analysis challenging. Based on this motivation, this work tries to answer the following questions: “How can complex industrial CAD models be effectively transformed into graph representations that preserve modelling operation dependencies?” and “Can a GCN-based model learn modelling operation prediction in an end-to-end manner without strong priors or large-scale annotated datasets?”. As result, this work presents an AI-based CAD assistant that has been trained using real models from the BMW Group. The system leverages existing technical knowledge by converting parametric CAD data into graph-based representations and learns to predict the next design step within a design sequence operationalized as multi-class classification task. Unlike many recent studies which model CAD design sequences using token-based or transformer architectures (Reference Rukhovich, Dupont, Mallis, Cherenkova, Kacem and AouadaRukhovich et al., 2024; Reference Wu, Xiao and ZhengR. Wu et al., 2021), this work focuses on a graph-based learning paradigm.
2. Materials and methods
2.1. Artificial intelligence for computer-aided design
AI in CAD enables the advanced analysis and generation of CAD models. This encompasses discriminative methods for understanding CAD data, as well as generative methods for creating or reconstructing shapes. The following section provides an overview of the current state of the art.
2.1.1. Discriminative: classification, segmentation, representation learning
Discriminative approaches focus on feature learning and segmentation of CAD models. BRepNet encodes topological walks over B-Rep elements (faces, edges, loops, coedges, vertices) with learnable matrices and propagates information through message passing, enabling command-level segmentation even in disconnected multi-loop structures (Reference Lambourne, Willis, Jayaraman, Sanghi, Meltzer and ShayaniLambourne et al., 2021). UV-Net explicitly instantiates the B-Rep graph from coedges, combining CNN-based geometry encoders with message passing to produce reusable features across tasks (Reference Jayaraman, Sanghi, Lambourne, Davies, Shayani and MorrisJayaraman et al., 2020). Reference Jones, Hu, Kodnongbua, Kim and SchulzJones et al. (2023) aggregate variable B-Rep neighborhoods using multi-head attention and decode explicit surfaces guided by implicit Signed Distance Functions (SDF) for stable reconstruction. CADOps-Net enhances BRepNet with joint per-face operation-type and step segmentation using Hungarian matching and relaxed IoU, improving segmentation consistency and enabling sketch recovery (Reference Dupont, Cherenkova, Kacem, Ali, Arzhannikov, Gusev and AouadaDupont et al., 2022). For assembly and material classification, HG-CAD formulates material prediction as node classification on hierarchical graphs pooling body-level geometry to assembly topology, outperforming computer vision and human baselines on the Fusion 360 Gallery Assembly dataset (Reference Bian, Grandi, Liu, Jayaraman, Willis, Sadler, Borijin, Lu, Otis, Ho and LiBian et al., 2024). STEP files parsed into typed graphs allow Graph Neural Network (GNN) classifiers to predict CAD categories directly from parametric topology, demonstrating that STEP-derived structure is highly discriminative (Reference Mandelli and BerrettiMandelli & Berretti, 2022).
2.1.2. Generative: modelling CAD shape and programs
Generative approaches to CAD focus on creating shapes and programs using various models and input modalities. Transformer-based models like DeepCAD (Reference Wu, Xiao and ZhengR. Wu et al., 2021) and MultiCAD (Reference Ma, Xu, Li, Zhou, Frommholz, Hopfgartner, Lee, Oakes, Lalmas, Zhang and SantosMa et al., 2023) generate sketch-extrude sequences with quantized parameters and multimodal learning. Models such as SkexGen (Xiang Reference Xu, Willis, Lambourne, Cheng, Jayaraman and FurukawaXu et al., 2022) and VITRUVION (Reference Seff, Zhou, Richardson and AdamsSeff et al., 2021) decode primitives and constraints for solver-ready graphs, while CADGen (Reference Zhou, Zan, Li and ZhouZhou et al., 2024) combines autoregressive and masked decoding for diverse program generation. Self-supervised SECAD-Net (Reference Li, Guo, Zhang and YanP. Li et al., 2023) reconstructs programs without ground-truth data, and graph-based planners (X. Reference Xu, Peng, Cheng, Willis and RitchieXu et al., 2021) propose CAD operations via zone graphs. Language-conditioned methods like Text2CAD (Reference Khan, Sinha, Sheikh, Stricker, Ali and AfzalKhan, Sinha, et al., 2024) and CAD-MLLM (Reference Xu, Wang, Zhao, Liu, Ma and GaoJ. Xu et al., 2024) translate text and multimodal inputs into parametric CAD sequences, achieving state-of-the-art fidelity and robustness. CadVLM (Reference Wu, Khasahmadi, Katz, Jayaraman, Pu, Willis and LiuS. Wu et al., 2024) adapts vision-language models for sketch autocompletion and conditioning. Point cloud conditioning models such as TransCAD (Reference Dupont, Cherenkova, Mallis, Gusev, Kacem and AouadaDupont et al., 2024) and CAD-SIGNet (Reference Dupont, Cherenkova, Mallis, Gusev, Kacem and AouadaKhan, Dupont, et al., 2024) decode loop and extrusion commands interactively, while Point2CAD (Reference Liu, Obukhov, Wegner and SchindlerLiu et al., 2023) and ComplexGen (Reference Guo, Liu, Pan, Liu, Tong and GuoGuo et al., 2022) reconstruct detailed B-Reps with neural fitting and optimization. Diffusion-based CAD-Diffuser (Reference Ma, Chen, Lou, Li and ZhouMa et al., 2024) improves command accuracy with multimodal diffusion. Image-conditioned methods map image features to CAD latents for program synthesis (Reference Jobczyk, Homann, Köthe and RotherJobczyk & Homann, 2024), with Free2CAD (Reference Li, Pan, Bousseau and MitraC. Li et al., 2022) converting sketches to CAD code and CAD2Sketch (Reference Hähnlein, Li, Mitra and BousseauHähnlein et al., 2022) generating concept sketches. Direct B-Rep synthesis with SolidGen (Reference Jayaraman, Lambourne, Desai, Willis, Sanghi and MorrisJayaraman et al., 2022) and BRepGen (Reference Xu, Wang, Zhao, Liu, Ma and GaoXiang Xu et al., 2024) uses transformers and diffusion for hierarchical modeling. CAD-Recode (Reference Rukhovich, Dupont, Mallis, Cherenkova, Kacem and AouadaRukhovich et al., 2024) fine-tunes LLMs to generate executable CAD code from point clouds. Mesh-based models like PolyGen (Reference Nash, Ganin, Eslami and BattagliaNash et al., 2020) and MeshGPT (Reference Siddiqui, Alliegro, Artemov, Tommasi, Sirigatti, Rosov, Dai and NießnerSiddiqui et al., 2023) produce high-fidelity meshes. Fusion models such as CADParser (Reference Zhou, Tang, Zhou and ElkindZhou et al., 2023) and integrate B-Rep features and sequence embeddings to jointly decode CAD outputs, enhancing generation quality. Also, eCAD-Net leverages fused B-Rep features to infer CAD modeling sequences.
2.2. Processing of CAD models
The following section describes the basics, theories, and processing steps of a CAD model from the design tree to the graph.
2.2.1. Geometric modelling in computer-aided design
The computer-aided description of the shape of geometric objects plays a central role in engineering. There are several different modelling concepts, and the choice of method depends on the specific problem and the objects to be modelled. In classic vehicle design, a feature-based parametric modelling approach is commonly used, where each design operation is treated as a feature that can be manipulated independently. This methodology allows for iterative modifications and refinement of designs through interdependent operations, enhancing workflow efficiency and flexibility. It is displayed in the design tree and shows the sequence and dependencies of all features (see Figure 1, left) (Reference BraßBraß, 2009).
Structural hierarchy (left) and operational hierarchy (right) using example of CATIA V5

By delving deeper into the design tree and its features and dependencies, a structural and operational hierarchy can be identified. The structural hierarchy is visually represented in the left-hand panel of most CAD programs, and an example is shown on the left side of Figure 1. It provides an overview for efficient model navigation and allows the designers to trace, edit, and manage individual design components and features. Also, it gives the freedom to create a personal order of the elements. On the right side of Figure 1, the operational hierarchy is shown. It describes the parametric dependencies between features and parameters, which are automatically created within the parametric modelling paradigm (Dassault Systèmes, 1998). This visual representation provides an intuitive understanding of the model’s feature graph and interrelations. The explicit hierarchical depiction of design operations and their dependencies render the use of Graph Convolutional Networks (GCNs) for analyzing the structural integrity of designs both a natural and conceptually consistent approach.
2.2.2. Modeling operation extraction in CATIA V5
CAD models in CATIA V5 are stored in a proprietary file format maintained by Dassault Systèmes. Due to its undocumented and highly complex nature, direct parsing of this format is infeasible. Instead, structured access to model entities is provided by the CATIA V5 Component Object Model (COM) API. Using this interface, a broad range of design entities - including sketches, pads, fillets, reference geometries, and geometrical sets - can be retrieved, along with their parameters and dependencies. This capability forms the foundation of the python-based data extractor (parser) developed for this project. It transforms the CATIA CAD-Model with its design entities into a JavaScript Object Notation (JSON). The extracted file provides a portable, human-readable, and machine-processable data structure. The schema is intentionally minimal, excluding attributes that could introduce cycles or side effects. Each object inside the file is described by the following fields:
-
• name: Display name visible to the user in CATIA
-
• internal_name: Low-level identifier used by CATIA internally
-
• uuid: Universally Unique Identifier (UUID) assigned by the parser to disambiguate objects
-
• type: COM object class (e.g., sketch, pad, direction)
-
• attributes: All properties retrieved via the CATIA V5 COM-API for this object, serialized verbatim in JSON; retained for completeness and optionally used as predictive features
-
• operational_parents: Direct dependencies, recursively resolved to reconstruct neighborhoods
-
• parameters: Associated numeric or categorical values
-
• selectable: Boolean flag indicating visibility in the specification tree
-
• canonical: Boolean flag identifying a representative element among interdependent objects
2.2.3. Directed acyclic graphs in CAD
A graph G is formally defined by a set of nodes V and a set of edges E connecting these nodes and can be seen below (Equation 1).

When the edges possess a defined direction - from one vertex to another - the graph is referred to as a directed graph or digraph (Reference HamiltonHamilton, 2022). A special subclass of directed graphs is the Directed Acyclic Graph (DAG), which is characterized by the absence of directed cycles. That means that there doesn’t exist a path that starts and ends at the same vertex following the edge directions. In the context of CAD systems, feature dependencies naturally conform to this graph-based representation. Each feature or assembly component can be modelled as a node within the graph, while the directed edges represent dependency relationships between them. Specifically, a directed edge (u,v) denotes that feature u must exist before feature v can be created. This aligns with the typical parent-child hierarchy found in CAD models, where parent features depend on one or more child features. For example, a hole feature depends on the prior existence of a base plate, reflecting a unidirectional dependency that defines the design order.
2.2.4. Graph conversion
In total, the data set comprises 46 parametrically designed CAD models in the field of vehicle door design, which cover approximately a quarter of the whole vehicle. The models were created according to Braß-guidelines (Reference BraßBraß, 2009) and are actively used in day-to-day business. They were created by various CA designers and have been further developed over a decade of use within the company. The extracted data is converted into a graph representation in which nodes correspond to modelling operations and directed edges capture parent-child dependencies. As the developed parser extracts all attributes resolvable via the CATIA V5 API, non-selectable or invalid nodes may be contained. To ensure training consistency, pruning steps informed by DAG properties are applied. Therefore, the prediction targets are restricted to selectable node; the cycles are excluded; and invalid dependencies are removed. Across all extracted data 169 unique node types are identified, which are encoded using a one-hot vector representation. For the design of the prediction mask, we further restrict attention to predictable nodes, defined as nodes that are simultaneously selectable, and its type being contained in a valid prediction list. This additional filtering is necessary because certain operations, while selectable, are not meaningful prediction targets. Finally, 99 modelling operations are predictable.
2.2.5. Sub-graph aampling
Beyond full-model parsing, the parser supports the extraction of localized subgraphs (see Figure 2). By resolving operational parents and dependencies around a chosen feature with the depth n, it is possible to isolate neighbourhoods that preserve relevant design context without processing the entire model. This functionality is particularly important for the extraction of the given context the user selects for the prediction.
Subgraph around the selected operation “Profil_Noppe” with the depth n=2

3. Results
In the following section, the selected model architecture, evaluation and finetuning are presented and discussed.
3.1. Distribution of the modelling operations
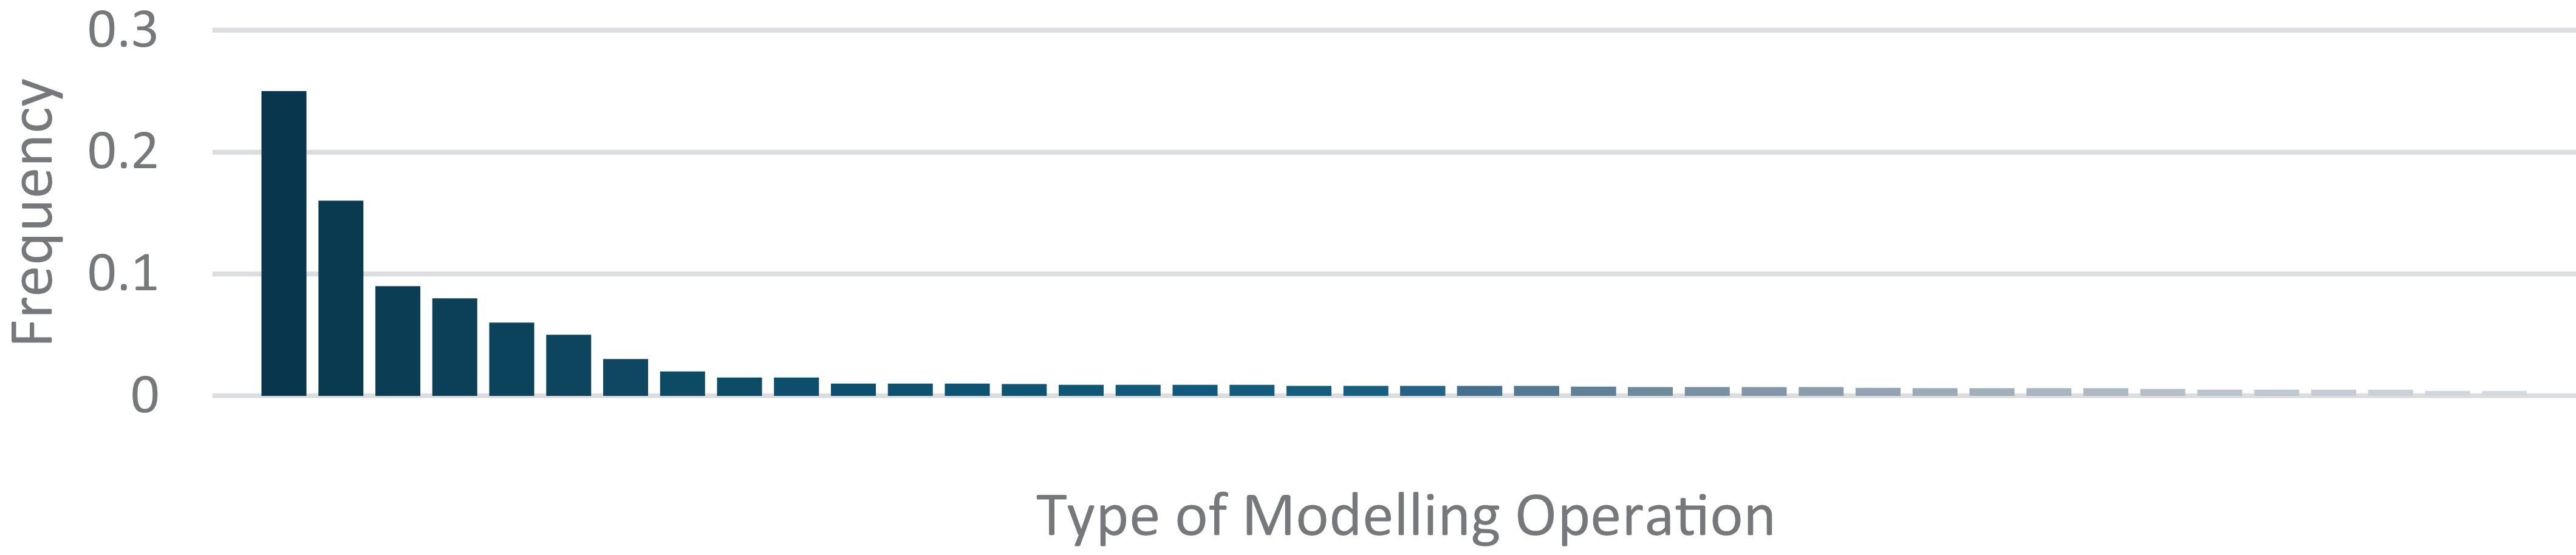
Figure 3 shows the distribution of the modelling operations inside the 46 cad models. It is noticeable that the frequency of operations is unevenly distributed. The first two operations account for about 40% of all modelling operations. This indicates that a significant portion of the workflow is concentrated in just a few frequently used operations. In contrast, around 80% of the remaining operations are used very infrequently, highlighting a long tail of rare or specialized actions within the modelling process.
Distribution of the different modelling operations in the dataset

3.2. Selection of the model architecture
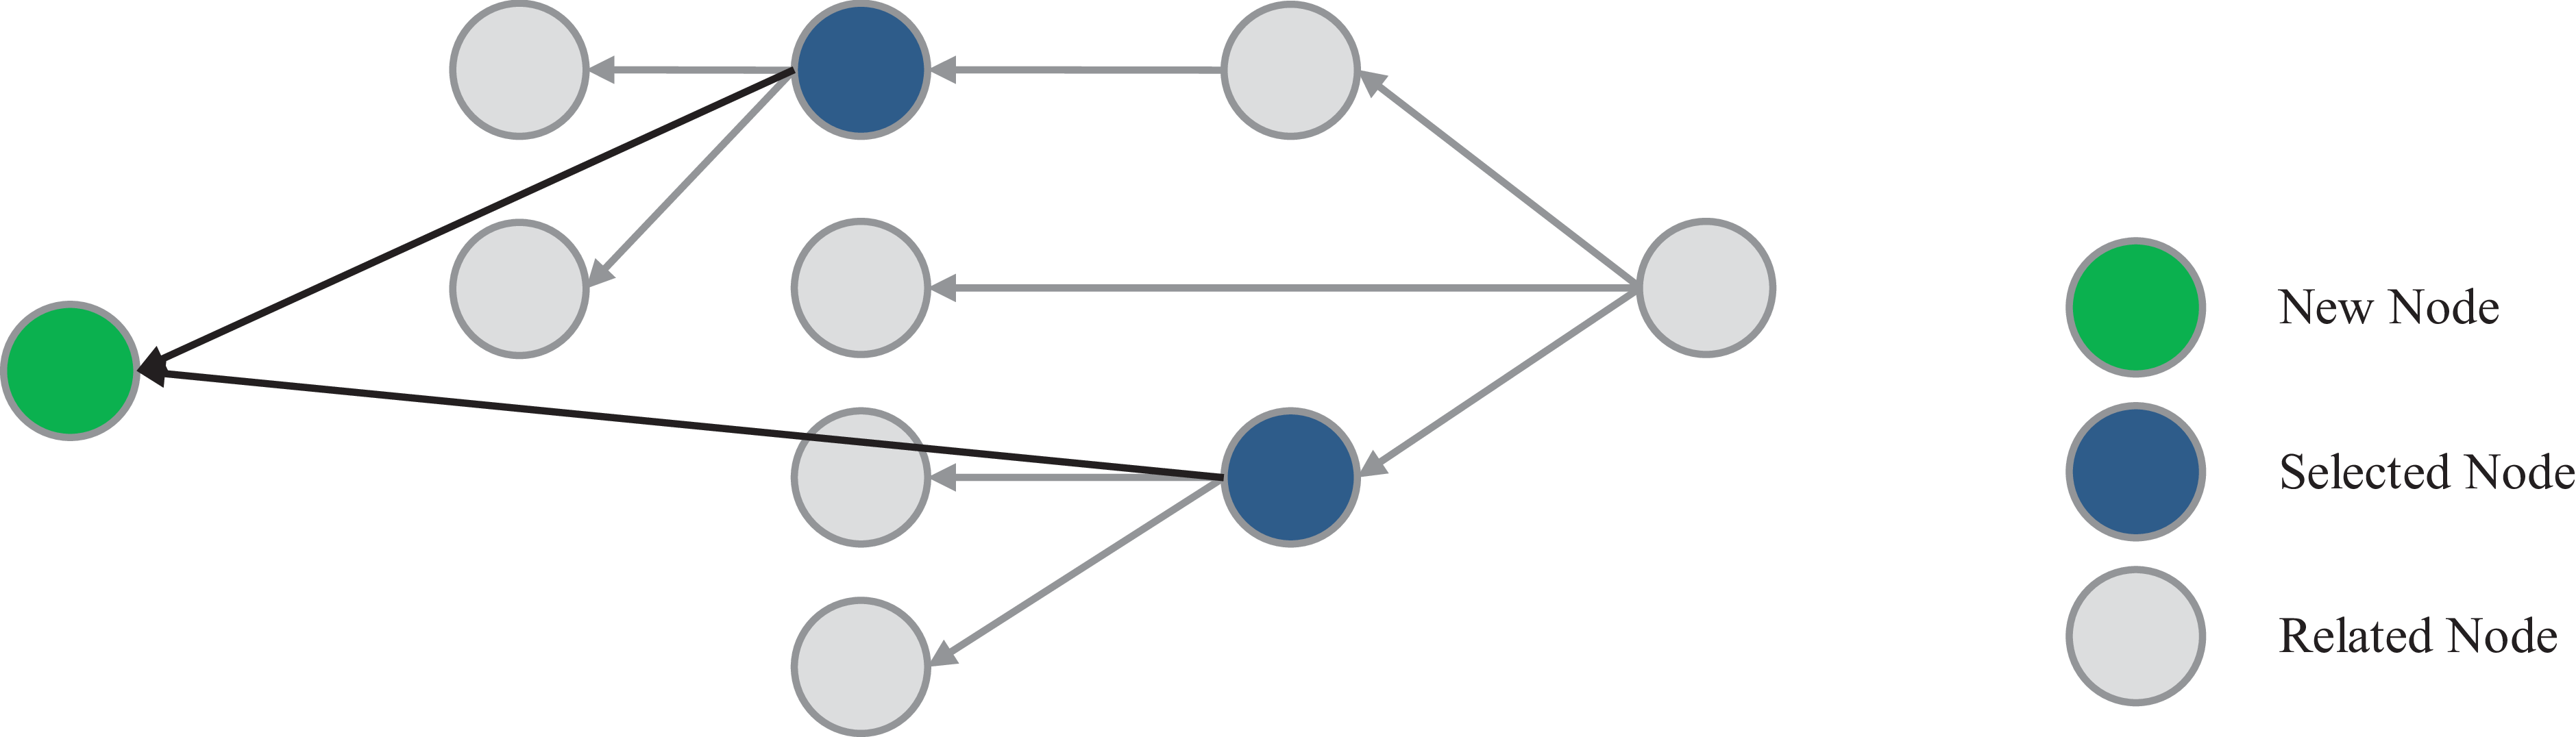
As indicated in Equation 1, there is a directed acyclic graph G = (V, E), where V denotes the set of nodes representing operations and E the directed parent–child dependencies among them. Within this set, let Vs ⊆ V refer to the subset of selectable nodes. Given the graph G together with a context set C ⊆ Vs, consisting of selectable nodes explicitly chosen as conditioning context, the task is to predict the type t(v) of the next yet-uninstantiated node v ∉ V to be added to the graph, conditioned on both the structural configuration of G and the provided context C. Although the original objective can be framed as predicting future modelling operations, this objective does not require explicit generative synthesis of new graph nodes. Instead, the problem can be equivalently formulated as predicting the class of the next operation to be added (see Figure 4).
Selfsupervised generative architectures such as Generative Pretrained Transformer for Graph Neural Networks (GPT-GNN) (Reference Hu, Dong, Wang, Chang and SunHu et al., 2020), Graph Masked Autoencoder (GraphMAE) (Reference Hou, Liu, Cen, Dong, Yang, Wang and TangHou et al., 2022), as well as classical Graph Autoencoder (GAE) and Variational Graph Autoencoder (VGAE) (Reference Kipf and WellingKipf & Welling, 2016b) variants were evaluated. While both GAE and VGAE achieved top-k (k = 5) accuracies of approximately 67%, GraphMAE with Graph Attention Network (GAT) (Reference Veličković, Cucurull, Casanova, Romero, Liò and BengioVeličković et al., 2017) yielded similar results. These scores confirmed learnability but were insufficient for practical deployment. The generative approach revealed two main limitations. First, the scarcity of publicly available CATIA V5 data severely restricted effective self-supervised pretraining, as such models require large corpora. Second, conditioning on previously selected nodes proved difficult, and despite architectural adjustments, reliable conditioning remained challenging, causing performance to plateau below 70%.
Illustration of the inference procedure

Based on the limitations, a classification-based approach was chosen, motivated by three considerations:
-
• Existing generative models rely predominantly on masking strategies that align with classification objectives.
-
• The prediction problem can be reformulated as a next-node type prediction task, making classification a direct and interpretable fit.
-
• Classification models typically entail lower complexity, improved computational efficiency, and better deployability on standard engineering workstations.
The objective thus shifts from synthesizing new nodes to predicting the class of the next node type with high accuracy, conditioned on structural and contextual information in the graph. Finally, a configurable encoder that supports multiple graph convolution variants was implemented, namely GAT (Reference Veličković, Cucurull, Casanova, Romero, Liò and BengioVeličković et al., 2017), Graph Isomorphism Network (GIN) (Reference Xu, Jayaraman, Lambourne, Willis and FurukawaXiang Xu et al., 2023), Graph-SAGE (Reference Hamilton, Ying and LeskovecHamilton et al., 2017), and GCN (Reference Kipf and WellingKipf & Welling, 2016a). A common strategy to learn on large domain graphs is to extract subgraphs, mask the selected nodes, and train on these smaller structures. While this subgraph-based approach is simple and effective, it has the disadvantage that each subgraph is processed in isolation, which leads to redundant computation and prevents the model from fully leveraging global structural information. To avoid this problem, the Duplicate-And-Link-Method is used. Using this method, efficient training by duplicating key nodes and linking them to their relevant structural context is possible. This approach eliminates redundant computation and substantially reduces training overhead, making large-scale graph learning feasible in practice.
3.3. Evaluation and finetuning
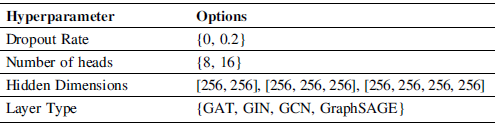
Empirically, GAT and GIN consistently outperformed GraphSAGE and GCN on our dataset, which is structured as a DAG. This finding is consistent with prior research that GIN achieves higher theoretical discriminative power compared to GCN and GraphSAGE, being provably as powerful as the Weisfeiler-Lehman test (Reference Xu, Hu, Leskovec and JegelkaK. Xu et al., 2018). Also, anisotropic message-passing mechanisms such as the attention in GAT often outperform isotropic aggregation, particularly when edge directionality carries semantic importance (Reference Dwivedi, Joshi, Luu, Laurent, Bengio and BressonDwivedi et al., 2022; Reference Veličković, Cucurull, Casanova, Romero, Liò and BengioVeličković et al., 2017). Lastly, explicitly modelling edge directionality has recently been shown to improve learning on directed or heterophilic graphs (Reference Rossi, Charpentier, Di Giovanni, Frasca, Günnemann and BronsteinRossi et al., 2023). Together, these insights explain why GAT and GIN are especially well-suited for our DAG-structured domain. Furthermore, hyperparameter tuning by exploring different configurations of dropout rates, attention heads, hidden dimensions, and GNN layer types (GAT, GIN, GCN, and GraphSAGE) were performed. Each configuration was trained for approximately 20 epochs.
Grid search space for hyperparameter tuning

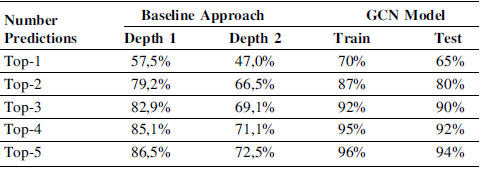
The optimal configuration was found to be a four-layer GAT with hidden dimensions [256, 256, 256, 256], eight attention heads, and a dropout rate of 0.2. To evaluate the chosen architecture, it is compared to a baseline approach. The baseline constitutes a non-parametric reference model designed to provide a lower bound for the expected performance of our GCN-Model. Its central idea is to characterize each node by the structural pattern of its neighborhood up to a predefined depth. Concretely, for every node we collect all dependencies within this depth and record three attributes: the type of dependency, the distance (depth) from the root node, and the number of dependencies that the neighbor itself possesses. These attributes are combined into tuples, which are then sorted and aggregated into a unique key that encodes the local structure of the node. Rather than relying on learned parameters, the baseline employs a purely frequency-based mechanism. During training, the dataset is traversed, and the occurrence frequency of each neighborhood key is recorded in a set of counters. To avoid overfitting to highly specific structural configurations, the representation is further restricted by only considering the first few elements of a key, a parameter named spiciness level. In this way, both coarse and fine-grained structural patterns are captured by storing truncated as well as full neighborhood signatures. At inference time, prediction for a node is performed by looking up its neighborhood key in the counters and retrieving the most frequently observed labels associated with this key in the training data. Restricting the predictions to the top-K most common labels provide a ranked candidate set of possible outcomes. Evaluation then proceeds by checking whether the true label of the test node is contained within this candidate set. If the true label appears among the top k predictions, the prediction is considered correct for Top-k accuracy at that level. This process is repeated across all test nodes, depths, and spiciness levels. From these results, accuracy statistics are computed as follows: for each configuration (d, s, k), where d is the neighborhood depth, s the spiciness level, and k the number of predictions considered, we count two values: (i) the number of correct predictions (i.e., cases where the true label was present within the Top-k predictions), and (ii) the total number of evaluated test nodes. The accuracy for a given configuration is then defined as the ratio of correct to total predictions. To obtain robust metrics, these accuracy values are averaged across all test instances, and in the case of k-fold cross validation, also across all folds. Table 2 shows the accuracy over the considered predictions k of the baseline approach und the GCN-Model.
Top-K accuracy of the baseline approach and the GCN-Model

Regarding the baseline approach, two main trends can be observed. First, increasing spiciness consistently improves the accuracy, since using more features provides the model with richer information. Second, increasing the depth reduces accuracy. The latter effect arises because the baseline is a non-parametric approach, which tends to overfit at greater depths and thus generalizes poorly. The GCN substantially outperforms the baseline across all metrics. Notably, the top-5 test accuracy reaches 94% (vs. 86.5% for the baseline at depth 1). The GCN also shows significantly higher top-1 performance (65% test accuracy), reflecting its ability to generalize better. This demonstrates the effectiveness of incorporating structural graph information into the prediction task.
3.4. Error analysis
Confusion matrices were created for both the baseline and the GCN (see Figure 5). The diagonal entries represent correct predictions, while the off-diagonal elements indicate misclassifications. Colour intensity corresponds to the number of occurrences on a logarithmic scale. The baseline confusion matrix is relatively sparse, dominated by strong diagonal lines. This suggests that the baseline model tends to ‘memorise’ frequent neighbourhood patterns and predict them consistently, resulting in overfitting. By contrast, the GCN confusion matrix is much more distributed. The model spreads its predictions across a broader range of types, demonstrating that it generalises beyond memorised patterns. While this results in a visually ‘noisier’ confusion matrix, it also demonstrates that the GCN explores and leverages more subtle dependencies in the data. Although the baseline may appear cleaner in this example, aggregated results across all test graphs clearly show that the GCN outperforms the baseline by a significant margin.
Comparison of confusion matrices for the baseline (left) and the GCN (right)

4. Conclusion
This paper demonstrated how graph-based AI methods can analyse parameterised CAD models and support designers in their next steps. Transforming real CATIA V5 models into directed, acyclic graph structures make the inherent design knowledge of CAD models explicitly usable. This representation forms the foundation for applying graph learning techniques to CAD, ensuring that structural relationships are preserved while remaining computationally tractable. The prediction problem was formulated as a classification task and solved using a GAT-based graph neural network. This approach achieved significantly higher accuracy in the top-5 comparison than a non-parametric baseline. With respect to the second research question, the results demonstrate that a GCN-based architecture can indeed learn to predict subsequent modelling operations in an end-to-end fashion, without relying on handcrafted rules or extensive annotated datasets. The high Top-k accuracy indicates that the learned representations successfully capture operational dependencies inherent in parametric CAD models. Some restrictions were deliberately imposed or resulted from framework conditions. Regarding the parser, the coverage of workbenches is limited. While specialized workbenches remain unsupported by the COM API, the most widely used ones - Part Design and Generative Shape Design - are fully accessible. In addition, low-level B-Rep entities such as edges, faces, and vertices cannot be accessed directly; they can only be obtained indirectly through the selection mechanism. Towards the recommendation algorithm, the different types of edges (operational, structural, parametric) have not been integrated into the predictive model due to time constraints. Nevertheless, encoding these as additional features could increase the expressive capacity of the model by providing richer relational context. Promising extensions in this direction include Edge-aware Graph Attention Convolution (EGATConv) (Reference Kamiński, Ludwiczak, Jasiński, Bukala, Madaj, Szczepaniak and Dunin-HorkawiczKamiński et al., 2022) and Edge Graph Attention Convolution (EdgeGATConv) (Reference Monninger, Schmidt, Rupprecht, Raba, Jordan, Frank, Staab and DietmayerMonninger et al., 2023), which explicitly incorporate edge attributes into the message-passing process. Furthermore, the quantitative evaluation provides strong evidence for the superiority of the GCN. Anyway, a full qualitative analysis of predictions across different mechanical part categories could be added. Such an analysis would be valuable for assessing model robustness and interpretability in domain-specific applications. Lastly, the CAD-Assistant is designed after the users stakeholder’s analysis’. Nevertheless, the evaluation is still pending and is necessary for a comprehensive evaluation.
5. Outlook
Based on the results achieved, there are several avenues for further development. Currently, only the next operation type is predicted. That could be expanded by additional modelling aspects, like parameter values or reference geometry. This would make the recommended actions more precise and executable directly. Furthermore, it could be expanded by predicting complete building blocks consisting of multiple connected operations (instead of just one operation). This could speed up CA-Design dramatically. Beside that outlook, one next step is to integrate the edge types and relational information. Currently, structural, operational and parametric edges are not considered in the training. Using edge-aware GNNs could improve semantic differentiation of relationships, leading to higher prediction quality. Lastly, a comprehensive study must be conducted to compare existing approaches.
Acknowledgement
I would especially like to thank my supervisor Thomas Raaf at the BMW Group, who always believed in me and supported me throughout my whole research.




 Open access

