

Introduction
Poor nutrition can start even before birth and continue into adolescence and adult life; it may even continue for generations. Nutritional care is important for adolescents as adolescence is a time of dramatic physical growth and development, and changing nutrition due to socio-cultural factors. Adolescence provides a second opportunity to catch up on growth, if environmental conditions and nutrient intake are favourable (Gopalan, Reference Gopalan1989). The nutritional needs and status of adolescents, particularly of adolescent girls, are crucial as girls will be the future mothers and their health will impact future generations. Addressing their needs is an important step in breaking the inter-generational cycle of malnutrition and chronic disease (WHO, 2006). Thinness and stunting are more prevalent among adolescents. Stunting in adolescents is the result of the cumulative effect of poor nutrition, largely during the first two years of life (Shrimpton et al., Reference Shrimpton, Cesar, Mercedes de Onis, Costa Lima, Blössner and Clugston2001).
Undernutrition in adults more truly reflects the nutritional status of a community (Shetty & James, Reference Shetty and James1994). Developing countries with undernourished populations face the risk of low productivity and growth. Furthermore, undernutrition in women leads to poor reproductive health outcomes leading to increased preterm births, infant mortality and maternal mortality. Low body mass index in adults leads to reduced immune function and increased morbidity and mortality.
Body mass index (BMI) is closely related to an individual’s food consumption pattern (Shetty & James, Reference Shetty and James1994), and the World Health Organization suggested that one of the main strategies to improve nutrition is increased dietary diversity at the household level (WHO, 2006). Greater emphasis has been given by the scientific community on a balanced diet, laying down dietary guidelines to ensure adequate nutrient intake by individuals. In developing countries dietary diversity is given greater importance especially to address nutritional deficiencies (WHO/FAO, 1996) and there is widespread recognition that low dietary diversity is associated with chronic nutritional deficiencies (Ruel, Reference Ruel2003). Studies have proved that low dietary diversity has negative consequences for health, immunity, mental health and reproductive and social capacities (Underwood, Reference Underwood1998). Many studies have been conducted to understand the relationship between dietary diversity and nutritional outcome, particularly in preschool children, and micronutrient deficiency in adolescent girls and women with different physiological conditions.
Produce from farming is the primary source of calories and essential nutrients and is a major source of household income for 80% of the world’s poor (IFPRI & ILRI, 2010). About 58% of rural households in India are dependent on agricultural production (NSSO, 2014) and are largely undernourished (IIPS, 2016). Dillion et al. (Reference Dillion, McGee and Oseni2014) demonstrated that a 10% increase in agricultural revenue or crop diversity results in a 1.8% or 2.4% increase in dietary diversity, respectively. Hoddinott (Reference Hoddinott2011) listed six pathways by which levers in agriculture production and markets have positive impacts on human health. Vepa et al. (Reference Vepa, Viswanathan, Parasar and Bhavani2016) reported that a 1% increase in land productivity increases the percentage of well-nourished children below 6 years of age by about 0.08%.
A Farming System for Nutrition (FSN) study under the research programme on Leveraging Agriculture for Nutrition in South Asia (LANSA) in the Wardha district of Maharashtra and Koraput district of Odisha state in India is examining the feasibility of crop and animal husbandry interventions to promote dietary diversity and study its impact on nutritional outcomes (Das et al., Reference Das, Bhavani and Swaminathan2014). A detailed baseline survey was undertaken in 2014 in selected villages in the two districts as part of the FSN study, to understand the demographic, socioeconomic and nutritional status and consumption pattern of the population. The objective of the present paper was to assess the food consumption pattern, nutritional status and dietary diversity of adolescents and adults in a rural region of India, validate three measures of dietary diversity against nutrient adequacy, and understand the relationship between dietary diversity and the nutritional status in the region.
Methods
Study area
Eight villages in Wardha district in Maharashtra and eleven villages in Koraput district in Odisha, India, were purposively selected in 2014 due to their characteristic contrast with regard to agro-climatic and socioeconomic conditions, and land-holding status, agricultural practices and food consumption pattern of the population. Both sites are rain-fed farming areas, but Koraput is characterized by subsistence farming and Wardha is dominated by commercial crop cultivation. Both sites are also characterized by high levels of undernutrition (Das et al., Reference Das, Bhavani and Swaminathan2014). About 300 households were purposefully selected from each location. The main criterion for sub-sampling was households with children in the age group 1–5 years. This was to ensure there was sufficient information on food intake and biochemical analysis for the same set of households. Where households did not have children in this category, those with an adolescent girl in the age group 12–17 years whose blood haemoglobin levels had been analysed were included to obtain a total sample of 300 households. The final sample in the present study included: 183 adolescent boys and girls aged 13–17 years (109 in Wardha; 74 in Koraput) and 1462 adult men and women over the age of 18 years (784 in Wardha and 678 in Koraput).
Measurement of nutritional status
The heights and weights of individuals were measured using standard equipment (Seco weight balance and stadiometer) by investigators trained in the methodology by a retired scientist from the National Institute of Nutrition (NIN), Hyderabad. The Z-scores were calculated using WHO Anthroplus (2007) software. The prevalence of undernutrition for adolescents was determined by calculating height-for-age (HAZ) and age/sex-specific BMI as recommended by WHO using standard deviation classification. For adults, Chronic Energy Deficiency (CED) was calculated and classified using BMI cut-off levels suggested by the WHO for Asians.
Food intake pattern
Food intake pattern was assessed using a one-time, 24-hour diet recall method. Data were collected continuously over a period of time to capture food intake pattern on all days of the week including Sundays, given the general habit of consuming animal-sourced food on holidays. The calculated data were compared with Recommended Dietary Intakes (RDIs) as given by the Indian Council for Medical Research (ICMR, 2012).
Dietary diversity
Food frequency data were used to calculate dietary diversity at the household level and the 24-hour diet recall data were used to calculate individual dietary diversity. The frequency of consumption of different foods based on monthly recall was collected using a semi-quantitative questionnaire. Data were collected at three points of time in a year to capture seasonal variations in food consumption; the average of the three rounds of food consumption frequency data was used to calculate household dietary diversity.
To calculate individual dietary diversity, food scores were measured using the 24-hour diet recall method (FS24hr). Foods were categorized into thirteen groups as recommended by the ICMR (2012). Simple counting of food groups was done to arrive at individual food scores, which ranged from 1 to 13 (with 1 being the lowest score), as recommended by the FAO (2013).
To calculate household dietary diversity, Berry’s Index (Dietary Diversity Index, DDI) was used. The amount of monthly consumption was calculated for each of the three rounds using the frequency and quantity of food consumed by the household. A uniform modal price (most frequently occurring price for a food item across households) was used to calculate the value of each food item consumed by each household. The average of the three rounds and the share of each food item in the total value of food consumed were derived. The DDI was calculated using the formula:
 $${\rm DDI}\, {\equals}\, {1 \over {\sum ^{n}_{i} \left( {s_{i}^{2} } \right)}}{\times}{\rm }100$$
where DDI is the dietary diversity index for a household, s i is the share of the value of the i th foodstuff out of total value of food consumed calculated using the formula:
 $$s_{i} \, {\equals}\, {{VF_{i} } \over {\sum^n_1 VF_{i} }}$$
where VF i is the value of the i th foodstuff.
Food scores were calculated using food frequency (FSFFQ) measurements, i.e. the frequency of consumption (daily, twice or three times a week, once a week, fortnightly and occasionally) by a household for the different food groups for a reference period of the preceding one month. The following consumption scores were given: daily: 7; twice or three times a week: 3; once a week: 1; fortnightly: 0.5; monthly: 0.25; and occasionally: 0 (following Hooshmand & Udipi, Reference Hooshmand and Udipi2013). The scores were added to obtain the food diversity score for the household. Food diversity scores ranged from 1 to 91, i.e. if all thirteen food groups were consumed daily, the maximum score would be 91.
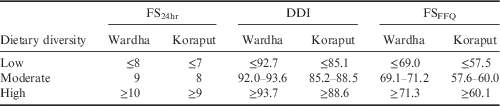
The association between dietary diversity and health and growth outcomes are best understood by selecting cut-off points based on the internal distribution of the diversity indicator within the samples, usually by creating quintiles or tertiles (Ruel, Reference Ruel2003). In the analysis, DDI and food score tertiles were calculated as low, moderate and high diversity (Table 1) and used to study the association with anthropometric parameters.
Distribution of dietary diversity scores by tertiles in Wardha and Koraput, India
The Nutrient Adequacy Ratio (NAR) was calculated for eleven nutrients, including energy, using individual 24-hour diet recall data. The NAR for a given nutrient is the ratio of an individual’s intake to the Recommended Dietary Allowance (ICMR, 2012). The Mean Adequacy Ratio (MAR) was calculated as an overall measure of nutrient adequacy. The NAR was truncated at 1 so that a nutrient with a high NAR could not compensate for a nutrient with a low NAR (Madden et al., Reference Madden, Goodman and Guthrie1976).
 $${\rm MAR}\, {\equals}\, {{\mathop{\sum}{{\rm NAR}\,\left( {{\rm each }\,{\rm truncated}\,{\rm at}\,1} \right)} } \over {{\rm Number}\,{\rm of }\,{\rm nutrients}}}$$
Statistical analysis
Analysis was done using SPSS (IBM Version 20) and Stata (12.1) statistical packages. The sensitivity and specificity of dietary diversity were calculated keeping 70% MAR as the cut-off point. The sensitivity of dietary diversity was calculated as the ratio of true positives to true positives plus false negatives; the specificity was calculated as the ratio of true negatives to true negatives plus false positives. The Receiver Operating Characteristic (ROC) curve is a useful way to interpret sensitivity and specificity levels and to determine related cut scores. It was plotted using SPSS to analyse the discriminative power or correct subject classification capacity of dietary diversity measures. An overall indication of the diagnostic accuracy of a ROC curve is the Area Under the Curve (AUC). An AUC value closer to 1 indicates the screening measure reliably and a rule of thumb of AUC >0.70 was chosen to identify good prediction (Becquey et al., Reference Becquey, Martin-Prevel, Traissac, Dembélé, Bambara and Delpeuch2010). A bivariant Pearson’s correlation was applied to understand the relationship between NAR, MAR and dietary diversity; and multiple regression was done to understand the relationship between dietary diversity tertiles and nutritional status. Significance was fixed at p<0.05. The relationships of individuals having low and moderate dietary diversity with nutritional outcomes were studied keeping individuals having high dietary diversity as the reference group.
Results
Nutritional status
The mean BMI Z-scores of adolescent boys were below the cut-off level (<−2 SD) indicating that the majority (51%) were undernourished in both locations (Table 2). The BMI Z-scores of adolescent girls were also on the border of the cut-off limits, indicating that there was a higher risk of becoming undernourished, with 27% of girls being undernourished. The mean height-for-age Z-scores were within the cut-off limits for both boys and girls in both locations. Overall it was observed that adolescent boys (50.7%) were more stunted than girls (27.3%).
Nutritional status (mean±SD) of adolescents and adults by region and gender
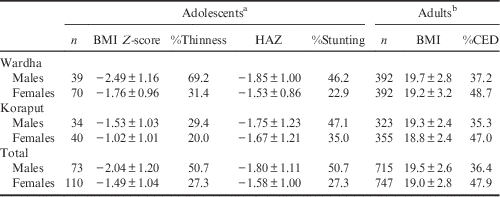
a 13–17 years;
b >18 years.
Among adults, a higher percentage of CED was found among women (47.9%) than in men (36.4%) in both locations. However, mean BMI was found to be higher than the cut-off limits (BMI=18.5) in both locations. The prevalence of undernutrition among adolescents and adults was found to be higher in Wardha compared with Koraput.
Food consumption patterns
Both locations had cereal-based diets – below the recommended level in Wardha and above the recommended level in Koraput. The average consumption of cereals and millets by adolescents in Wardha was 311 g/day, which provided 1066 kcal and 64% of total energy intake; 12% of total energy was obtained from pulses, 11% from fats and 7% from sugars. Only 1% of energy was obtained from other food groups like vegetables, fruits and animal foods. The average consumption of cereals and millets by adults was 370 g/day, which provided 1265 kcal and 66% of total energy intake; 12% of energy was obtained from pulses and fats, 8% from sugars and jaggery and 2% from vegetables, fruits and animal foods. In Koraput, cereals and millets were consumed in higher quantities – almost double the recommended quantities irrespective of age. The average consumption of cereals and millets by adolescents in Koraput was 589 g/day, which provided 1925 kcal and 76% of total energy intake; adults consumed 612.5 g/day, which provided 2101 kcal and 82% of total energy intake.
In comparison, vegetables were consumed in higher quantities by adolescents in Koraput than in Wardha. Fruits and milk and milk products were consumed in negligible amounts in both locations. Meat, poultry and sea food were consumed occasionally in small quantities.
Dietary diversity
The mean dietary diversity (FS24hr) score calculated using 24-hour diet recall was 8 irrespective of age and location. Table 3 shows the dietary characteristics of adolescents and adults in Koraput and Wardha. Adolescent boys and adults in Koraput had a mean FS24hr score of 7. The mean dietary diversity calculated using Berry’s index (DDI) was 90 in both the locations among adults, while it was 89 and 90 among adolescent boys and girls respectively. The DDI was higher in Wardha when compared with Koraput irrespective of age group. Dietary diversity using food frequency (FSFFQ) was better in Wardha than Koraput. The FSFFQ was observed to be similar in Wardha in both males and females, but in Koraput the dietary diversity of adolescent boys was less than that of adolescent girls. Although the mean scores were better (FS24hr: 7–8 out of 13; DDI: 89–90 out of 100; FSFFQ: 64–66), the spices and condiments and nuts and oilseed groups (which are added to the diet in very small quantity) cannot be considered.
Dietary diversity scores (mean±SD) of adolescents and adults by region and gender
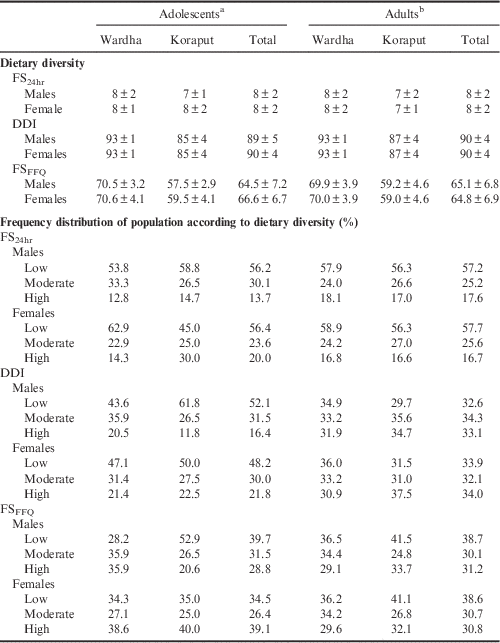
a 13–17 years;
b >18 years.
All three measures of dietary diversity showed that the majority of the adolescent boys and girls in both locations had low dietary diversity. Only the FSFFQ showed that the majority of adolescent girls had high dietary diversity. In adults, FS24hr and FSFFQ showed that the majority of adults in both locations had low dietary diversity while DDI showed that the majority of males had moderate dietary diversity and that females had low and high dietary diversity. The distribution of the population according to dietary diversity tertiles is given in Table 3.
Nutrient adequacy
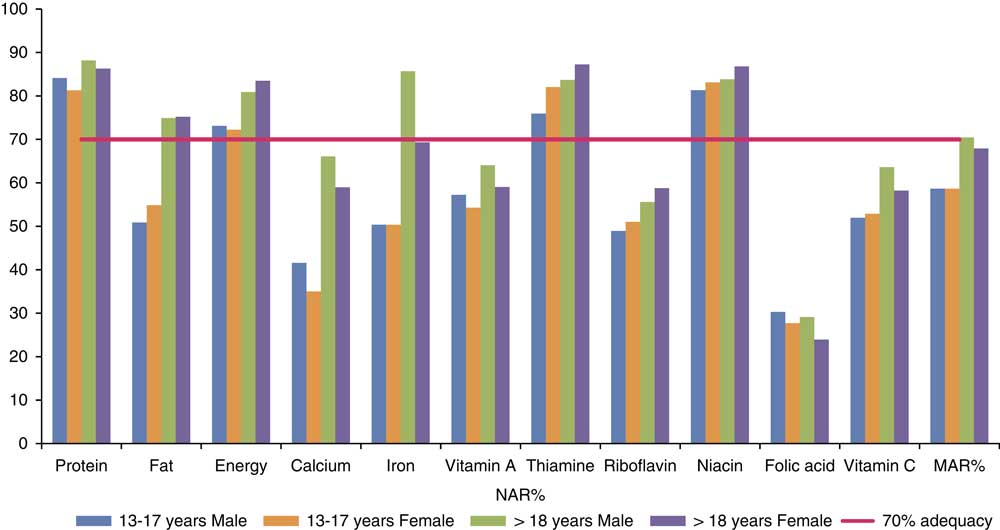
Figure 1 shows the NAR and MAR values of different nutrients in adolescents and adults of the two locations taken together. Among adolescents, of the eleven nutrients, the NAR of protein, energy, thiamine and niacin, and in adults the NAR of protein, fat, energy, iron, thiamine, niacin were more than 70% of recommended levels. Adult males had an MAR slightly more than 70% of recommended levels, while this was slightly lower in the case of adult females. The level was much lower in the case of the adolescent group.
Nutrient Adequacy Ratio (NAR%) and Mean Adequacy Ratio (MAR%) of nutrients in adolescents and adults.
Relationship between NAR, MAR and dietary diversity indices
Table 4 shows the correlation between NARs and MARs and the dietary diversity indices. It can be seen that dietary diversity calculated with 24-hour diet recall (FS24hr) showed a significant positive association with NAR for all eleven nutrients, and with MAR, in both locations. Dietary diversity as calculated using Berry’s index (DDI) showed a significant association only with the NAR of vitamin A and vitamin C in Wardha and with fat and vitamin C in Koraput. However, DDI showed a correlation with most of the nutrients when the two locations were combined together, with the exception of protein, energy, calcium and vitamin C; in the case of these four nutrients, the data showed a negative association, which is not expected with dietary diversity. Dietary diversity calculated using food frequency (FSFFQ) showed a positive correlation only with vitamin C in Wardha. In Koraput, FSFFQ showed a positive association with fat, folic acid and vitamin C. When the two locations were combined together, FSFFQ ensures adequacy of fat, iron, vitamin A, thiamine, riboflavin and folic acid.
Correlation between NAR%, MAR% and diet diversity indices
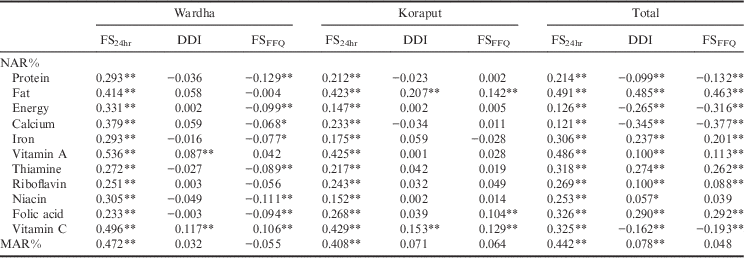
**p<0.01; *p<0.05.
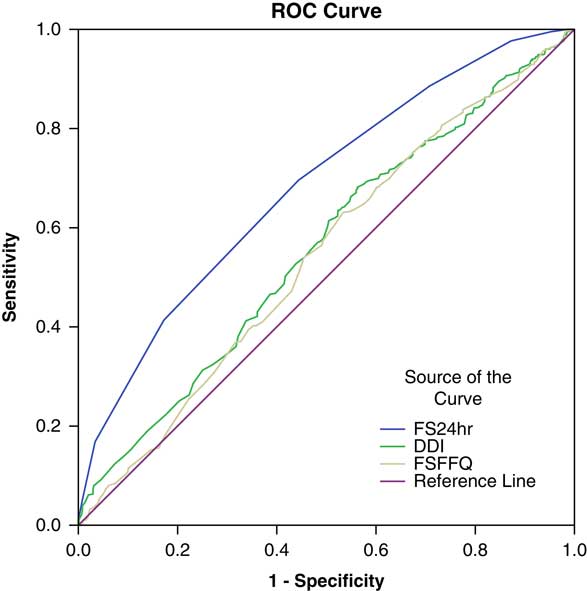
Only FS24hr showed an association with MAR in Wardha and Koraput, but when the two locations were combined together, DDI also showed a relationship with MAR, along with FS24hr. Rose et al. (Reference Rose, Luckett and Mundorf Rathert2013) stated that an indicator with an area under the ROC curve greater than 0.70 can be considered to predict well the sensitivity and specificity of the measure. The ROC curve in the present study (Fig. 2) showed that the area under curve (AUC) was less than 0.70, which shows that all three measures of dietary diversity do not predict well. However, the AUC for dietary diversity calculated using 24-hour diet recall (FS24hr) was 0.68, which is on the borderline, and this measure can still be used to study the NAR of adolescents and adults. It was also observed that the true positives were greater than the false positives, which implies that this measure truly differentiates individuals having a low dietary diversity with low MAR from those with low dietary diversity and high MAR. The sensitivity and specificity analysis with dietary diversity tertiles showed that a FS24hr of more than 7 will ensure the adequacy of nutrients.
Receiver Operating Characteristic (ROC) curves for three measures of dietary diversity: AUC, FS24hr: 0.682 (p<0.01); DDI, 0.558 (p<0.01); FSFFQ, 0.542 (p<0.01). 1-Specificity: false positive rates; Sensitivity: true positive rates.
Relationship between dietary diversity and nutritional status
The association between the three dietary diversity indices and the BMI of adolescents is given in Table 5. In Wardha, for adolescents only DDI showed a negative relationship with BMI Z-scores, indicating that the BMI Z-scores of the adolescent group with a low dietary diversity was less than that of the adolescent group with high dietary diversity. Gender was found to have a positive association with BMI Z-scores in both locations taken separately and together. The other two indices did not show any association with BMI Z-scores of adolescents.
Regression between dietary diversity tertiles with BMI Z-scores and HAZ of adolescents (high diversity as reference)
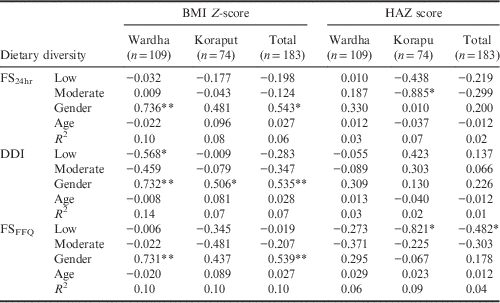
**p<0.01; *p<0.05.
Dietary diversity calculated using FS24hr showed a negative association with height-for-age Z-scores showing that the HAZ score was higher in adolescents with high dietary diversity than in adolescents with moderate dietary diversity. Similarly, an association was found between HAZ and low dietary diversity in Koraput, and when the two locations were studied together.
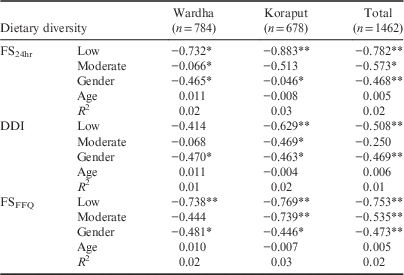
Gender showed a positive association with BMI Z-scores in Wardha and both locations combined, but not in Koraput separately. Neither age nor gender had any association with HAZ. Among adults, the FS24hr showed a negative association with BMI in both locations, indicating that the BMI of adults with a low dietary diversity was less than that of the adult group with a high dietary diversity. The DDI showed a negative relationship with the BMI of adults in Koraput and the two locations combined. Moderate dietary diversity calculated using DDI also showed a significant negative association with BMI in Koraput. Low dietary diversity calculated using FSFFQ showed a significant negative association with BMI in both locations taken separately and together; moderate dietary diversity showed a similar relationship in Koraput and both locations combined. The association between all three dietary diversity indices and the BMI of adults was found to be linear (see Table 6 for details). Gender showed a significant negative association with adult BMI in both locations irrespective of method of calculating dietary diversity.
Regression between dietary diversity tertiles with BMI of adults (high diversity as base)
Discussion
The study found that the prevalence of thinness and stunting was higher among adolescent boys than girls in this rural Indian population. Similar results have been reported by Venkaiah et al. (Reference Venkaiah, Damayanti, Nayak and Vijayaraghavan2002), Deshmukh et al. (Reference Deshmukh, Gupta, Bharambe, Dongre, Maliye, Kaur and Garg2006), Dey et al. (Reference Dey, Biswas, Ray, Bhattacherjee, Chakraborty and Pal2011), Medhi et al. (Reference Medhi, Hazarika and Mahanta2007) and Banerjee et al. (Reference Banerjee, Dias, Shinkre and Patel2011). A high prevalence of undernutrition was observed among adults in both study locations, the proportion being higher among women than men. Women are generally more vulnerable, particularly in tribal areas of the country, mainly due to socio-cultural practices (ACC/SCN, 1990). The observed food intake did not reflect the nutritional status of the respondent adolescents and adults as there was a high consumption of energy through a high intake of cereals, and there was a high prevalence of undernutrition. Thus intake of energy was not equal to the energy spent on daily activities in the study respondents. It was also observed that tobacco chewing was a common practice among adolescent boys and adult men.
Lack of food diversity is an important issue, particularly in developing countries where diets consist mainly of starchy staples, with less access to nutrient-rich food (World Bank, 2007). Both locations in this study in India had cereal-based diets. The basis for emphasizing dietary diversity in developing countries is mainly due to nutrition deficiency and the importance of increasing food and food group variety to ensure nutrient adequacy (Ruel, Reference Ruel2002).
Researchers have used various methods to measure individual and household dietary diversity. Simple counting of food varieties or food groups using the diet recall method is used extensively, with a reference period ranging from 1 to 7 days. Much research has been done on the methods used to measure diet quality, resulting in the development of several indices (Savy et al., Reference Savy, Martin-Prevel, Sawadogo, Kameli and Delpeuch2005). A 24-hour diet recall method was recommended by the FAO (FAO, 2013), while Hooshmand and Udipi (Reference Hooshmand and Udipi2013) used food frequency to measure dietary diversity. Food frequency helps to assess the habitual dietary pattern, which is useful to understand the relationship between diet and chronic diseases (FAO, 2004). However, this is a retrospective method relying on the respondent’s memory and is less sensitive to measures of absolute intake of specific nutrients. Thiele and Weiss (Reference Thiele and Weiss2003), Drescher et al. (Reference Drescher, Thiele and Mensink2007) and Akerele and Odeniyi (Reference Akerele and Odeniyi2015) used Berry’s index or Simpson’s index, where distribution, quantity and cost of different food items consumed are taken into account. In the present study, three measures – food score, Berry’s index and food frequency scores – were used to study dietary diversity.
Most previous studies have validated dietary diversity scores to ensure nutrient adequacy with the help of the Nutrient Adequacy Ratio (NAR) and Mean Adequacy Ratio (MAR), as described by Madden and Yoder (Reference Madden and Yoder1972). In the present study, validation showed that DDI and FS24hr ensured adequacy of most nutrients (NAR) and MAR when the two locations were combined together. However, only FS24hr showed an association with MAR when the locations were studied individually. Savy et al. (Reference Savy, Martin-Prevel, Sawadogo, Kameli and Delpeuch2005) demonstrated that dietary scores were good proxies for overall diet quality in women. In the present paper, the sensitivity and specificity analysis showed that true positives (individuals with low dietary diversity and lower MAR) were greater than false positives (individuals with low dietary diversity and higher MAR); and further, the ROC curve showed that the FS24hr had more AUC, implying that FS24hr can differentiate between individuals having 70% mean nutrient adequacy. Although DDI and FSFFQ showed an association with the nutrient adequacy and the nutritional status of adults, the ROC curve showed less AUC. Becquey et al. (Reference Becquey, Martin-Prevel, Traissac, Dembélé, Bambara and Delpeuch2010) demonstrated that the area under the ROC curves ranged from 0.53 to 0.63 for the dietary diversity score calculated using 24-hour recall. Furthermore, DDI and FSFFQ calculated using food frequency data depicts household dietary diversity and does not necessarily translate into individual dietary diversity.
The DDI showed an association with BMI Z-scores in adolescents while the other two measures failed to show any association with the nutritional status of adolescents. The FS24hr and FSFFQ showed weak association with HAZ in Koraput, and when the two locations were studied together. Chen (Reference Chen2012) found that dietary diversity did not have an association with stunting in adolescent girls in the Kilosa district of Tanzania. Similarly, lack of association between food insecurity and height was reported in the age group 9–18 years in Canada (Mark et al., Reference Mark, Lambert, O’Loughlin and Gray-Donald2012) and 12–18 years in Brazil (Lopes et al., Reference Lopes, Sichieri, Salles-Costa, Veiga and Pereira2013). The FS24hr showed an association with the nutritional status of adults when the two locations were studied separately or combined. Hatloy et al. (Reference Hatloy, Torheim and Oshaug1998), Ogle et al. (Reference Ogle, Hung and Tuyet2001) and Savy et al. (Reference Savy, Martin-Prevel, Sawadogo, Kameli and Delpeuch2005) stated that food scores built from food groups prove to have stronger relationships with health outcomes.
Gender was found to play a crucial role in nutritional status. In the study, gender showed a positive correlation of dietary diversity indices with the BMI of adolescents and a negative correlation with the BMI of adults; this reinforces the view of many researchers that gender issues should be addressed in nutritional programmes (Beckerleg, Reference Beckerleg1995).
Overall, it may be concluded that dietary diversity plays a crucial role in determining the nutritional outcomes of adolescents and adults. Subasinghe et al. (Reference Subasinghe, Walker, Evans, Srikanth, Arabshahi and Kartik2014) found that subsistence farming was strongly associated with CED in south Indian men and women. Arlappa et al. (Reference Arlappa, Venkaiah, Rao, Reddy, Kumar and Ravindranath2009) provided evidence for a higher prevalence of CED in individuals at socioeconomic disadvantage and in small and marginal farmer households, while Gulati et al. (Reference Gulati, Ganesh-Kumar, Shreedhar and Nandakumar2012), using data from the National Family Health Survey 2005–06 (NFHS-3) and national accounts, reported that improved agricultural performance markedly reduced the risk of CED in adults and can have a positive impact on nutritional outcomes.
Pro-nutrition interventions in agriculture and the introduction of backyard production of garden fruits and vegetables could help promote household dietary diversity (Chakravarty, Reference Chakravarty2000; Ruel, Reference Ruel2001; Nagarajan et al., Reference Nagarajan, Bhavani and Swaminathan2014). However, improvements in agriculture alone cannot combat malnutrition, and interventions to improve education, health, sanitation and household infrastructure, and care and feeding practices of adolescent girls and women of reproductive age are crucial. Innovative strategies that integrate agriculture and nutrition programmes stand a better chance of combating malnutrition. This has to be complemented by nutrition education for food availability at the farm level, to be translated into better nutrition for the entire household. Nutrition-sensitive agriculture that focuses on increasing local food diversity in conjunction with population-wide nutrition education that emphasizes the need for diversified diets, is more likely to achieve results (Bukania et al., Reference Bukania, Mwangi, Karanjia, Mutisya, Kombe, Kaduka and Johns2014). These intervention strategies are sustainable solutions for food security (Shetty, Reference Shetty2009). Nutrition interventions delivered through the agricultural sector can further strengthen the linkages between increasing agricultural production and improving nutrition outcomes.
Acknowledgments
The authors are grateful to Dr Prakash Shetty, CEO, LANSA, for his contribution and guidance in preparing this paper. Data collection and entry was co-ordinated by Mr Akshaya Kumar Panda and Ms Jasaswani Padhi in Koraput and by Mr Mahesh Maske and Ms Rupal Wagh in Wardha. Mr S. Raju at Chennai designed the data entry templates and collated the raw data from the two sites for analysis; Mr Rohit Parasar gave insightful comments and suggestions. The authors gratefully acknowledge their contributions. This research is part of the data generated by the Leveraging Agriculture for Nutrition in South Asia Research (LANSA) research consortium, and is funded by UK Aid from the UK government. The views expressed do not necessarily reflect the UK Government’s official policies.


 Open access