INTRODUCTION
Campylobacteriosis is the commonest cause of bacterial enteritis in England with almost 63 000 laboratory-confirmed cases in 2010 [1]. Globally, campylobacteriosis is a seasonal infection [Reference Nylen2] and in England there is a major annual peak in June/July [Reference Kovats3]. Most cases are assumed to be sporadic infections which lack epidemiological linkage [Reference Nylen2]. In England, international travel and consumption of chicken in restaurants are strongly linked to sporadic infections [Reference Rodrigues4] which is similar to the situation reported elsewhere [Reference Domingues5]. Worldwide, the consumption of chicken may account for 40–70% of human infections [Reference Domingues5] while for cases reported in England, 17% are associated with foreign travel [Reference Zenner and Gillespie6].
The majority of analytical studies of human Campylobacter infection have focused on food/drink consumption and contact with companion animals and livestock [Reference Domingues5]. Avian species are thought to be the true natural hosts of Campylobacter spp. but there is considerable evidence for infection of cattle and sheep and genetic evidence of transmission to humans [Reference Stanley and Jones7]. Studies have demonstrated a number of environmental risks for campylobacteriosis such as environmental contamination from Campylobacter-infected broiler farms [Reference Jonsson8], high ruminant density [Reference Nygard9] and frequent contact with chickens [Reference Potter, Kaneene and Hall10]. Campylobacter can survive in faeces and the environment [Reference Sinton11, Reference Cook and Bolster12] and rainfall has been associated with contamination of surrounding areas [Reference Hansson13] where Campylobacter survival can occur for long periods of time [Reference Thomas, Hill and Mabey14]. In England there is conflicting evidence as to whether the number of infections in poultry farms shows substantial fluctuation [Reference Wallace15] but it seems unlikely that the seasonality in the number of human campylobacteriosis cases is a direct consequence of a coincident trend in the number of infections of birds on poultry farms [Reference Kovats3].
A relatively small number of campylobacteriosis outbreaks are reported each year in England [Reference Little16]. Those identified tend to be foodborne outbreaks associated with the catering industry (e.g. [Reference Inns17]) where, as with other detected foodborne outbreaks, information provided by the general public is foremost for recognition [Reference Rooney18]. Given the high number of laboratory-confirmed cases, it is possible that community outbreaks occur which are not detected [Reference Gillespie19]. Any such outbreaks would represent missed opportunities for improving understanding of the epidemiology of Campylobacter infection and for identification of measures to protect public health. Means to identify possible outbreaks which allow for targeted investigation will therefore be a valuable addition to existing surveillance strategies.
Space-time cluster detection provides a means by which clusters of cases (based on a location such as place of residence) can be detected early and in some situations detected where they would not have been detected by purely spatial or temporal methods. SaTScan [Reference Kulldorff20] is an easy to use software program which meets the requirements for space-time disease surveillance without the additional need for substantial technical expertise [Reference Robertson and Nelson21] and can be readily applied to infectious disease surveillance. The spatial scan statistic used by SaTScan assesses whether the number of cases within a space-time cylinder (where the base of the cylinder is a circle or ellipse covering an area of the study region) are greater than expected given the number of cases which occur within the rest of the study region over the same time period [Reference Kulldorff22, Reference Kulldorff23]. As such, these algorithms do not require adjustment for seasonal trends, inclusion of historical baseline data or prior definition of strictly bounded areas where clusters are to be detected. Clusters up to a maximum specified size can be detected anywhere within the study region in a single operation.
For each SaTScan run, the maximum-likelihood cluster is detected and the significance of this cluster compared to the rest of the study region using randomization testing. Secondary clusters with reduced likelihood are also reported with a corresponding significance determined in the same manner as for the most likely cluster [Reference Kulldorff22]. Prospective space-time cluster detection models can be applied within SaTScan which will scan for clusters which are ‘alive’ during the most recent time period [Reference Kulldorff24] and can be used by public health departments and epidemiology units as part of routine surveillance (e.g. [Reference Jones25]).
This study was undertaken to assess the value of such an approach for the detection of space-time clusters of campylobacteriosis for investigation in the North East of England. This is dependent first on whether the approach can detect clusters which it is feasible to investigate and second whether on investigation those clusters are found to be associated with common links or risk factors which shed light on transmission routes and/or provide opportunities for the protection of public health. To this end, the purpose of the current study was to simulate prospective space-time cluster detection for laboratory-confirmed cases of campylobacteriosis in the North East of England (a population of ∼2·5 million people) as if it had been used weekly over a 4-year period (2008–2011) in order to determine whether clusters would be found and to assess the feasibility of performing epidemiological and microbiological investigation of clustered cases.
METHODS
Surveillance data
Data for laboratory-confirmed cases of Campylobacter spp. infection resident in the North East of England were obtained from the Health Protection Agency North East regional surveillance system which collects data on selected laboratory and clinician-notified cases of infectious disease of public health interest. The best available onset date (herein, referred to simply as onset date) for each case is determined from a hierarchy of reported onset date, specimen date, result date and referral date. Given the need for correct and complete geographical placement of cases, all residential postcodes for cases were checked for validity prior to analysis. UK postcodes correspond to a single address, a street or part of a street and have associated geographical coordinates. Age and sex were also obtained for each case. Exposure data for potential risk factors is not routinely collected for cases of Campylobacter.
Space-time cluster detection
Cluster detection was performed using SaTScan v. 9.1.1 [Reference Kulldorff20] with a discrete space-time Poisson model [Reference Kulldorff22] for prospective cluster detection (where clusters must contain cases occurring within the most recent included time window). Under the null hypothesis of the Poisson model the number of expected cases is proportional to the specified population size, therefore accounting for variation in population density. Cluster detection used UK lower super output area (LSOA) of residence as the geographical unit; LSOAs are small statistical boundary areas of ∼1500 people. Office for National Statistics (ONS) all ages population estimates for the previous year (to simulate the real-time situation) were used as population sizes for the Poisson model and the easting and northing of the ONS LSOA population centroid from April 2005 (the most recently available) as Cartesian coordinates. The residential address for cases was linked to LSOA using the ONS Postcode Directory, 2011 Edition. All ONS data used is freely available (www.ons.gov.uk).
We simulated weekly space-time cluster detection runs for 209 separate weeks corresponding to each Monday from 1 January 2008 to 2 January 2012. For each run, data was censored to include only laboratory-confirmed cases which had been reported to the surveillance system before or during the previous calendar week. Onset date was used as a proxy for exposure date. Detection was performed using SaTScan models with either a 1-day or 7-day temporal window (separate analyses), a maximum population size of 50% of the region, a maximum cluster duration of 28 days, a circular or elliptical window (separate analyses) and a restriction of secondary clusters to those with a different centre to the most likely cluster.
Potential epidemiological clusters
The geographical area covered by cluster windows can overlap with other cluster windows both from the same week and from subsequent weekly runs. Hence the total number of significant clusters detected may be greater than the number of epidemiological clusters that would require investigation. In order to determine this number, clusters for analysis were restricted to either (1) a single geographical window with no geographically overlapping windows in the same and contiguous weeks, or (2) a set of closely overlapping geographical windows from one or more weeks. Multiple clusters detected in the same week but with multiple foci, and which were not all included in a single larger window, were treated as multiple epidemiological clusters. In considering whether or not significant clusters represented those of distinct epidemiological interest, we did not consider the duration of each cluster (i.e. the start date of the cluster was not taken into account). For each unique cluster defined in this way we recorded (1) the geographically largest initial window (i.e. detected on the first week of the cluster set), (2) the geographically largest window (detected on any week the cluster was detected) and (3) the highest probability window (i.e. that with the lowest associated P value).
In order to remove any potential bias in cluster detection due to the presence of multiple cases within a single household, SaTScan runs which detected a significant cluster were repeated after removal of excess household cases both from within the cluster and from the rest of the region for the time period during which a cluster was detected. Multiple household cases may represent instances of person-to-person transmission and could wrongly inflate the relevant surveillance signal for cases which are a result of a putative primary exposure. Household cases were defined as cases with the same postcode and house/flat number with a date of onset within the duration of a suggested cluster. When removing excess household cases the case with the earliest date of onset was retained; where onset dates were identical one or more cases were removed at random.
Comparison of clustered and non-clustered cases
A comparison between cases within clusters and cases reported elsewhere in the region during the same time period was performed using the highest probability window as the basis for each cluster. We compared age, sex and the deprivation scores of LSOAs.
Age distribution bootstrapping
In order to determine whether or not the age distribution of clustered cases was different to the age distribution of cases in the rest of the entire study region during the same time period, we simulated 10 000 age distributions of equal size for each cluster by randomly drawing from all cases within the region during the time period of the cluster. This approach allowed an assessment of differences in the observed number of cases from expected numbers for defined age groups. Age distributions were analysed according to epidemiologically meaningful age groups derived from the incidence rate of cases by age for the time period of the study using the median mid-year population size from those years where data was available (2008–2010). For each cluster a significant departure from expectation for any age group was defined as an observed count in any age group being less than or greater than the interval covering 95% of the simulated counts.
Indices of multiple deprivation and rural/urban classification
Indices of multiple deprivation (IMD) 2010 scores [26] for all LSOAs whose centroid was contained within each cluster circle (irrespective of whether or not cases were reported from that LSOA) were compared to all other LSOAs within the region using an exact permutation test. Rural and urban area classification (RUAC) [27] for each cluster was compared to that of the entire North East region.
Statistical analysis
All data manipulation and statistical analysis was performed using R v. 2.10.1 [28].
RESULTS
Surveillance data
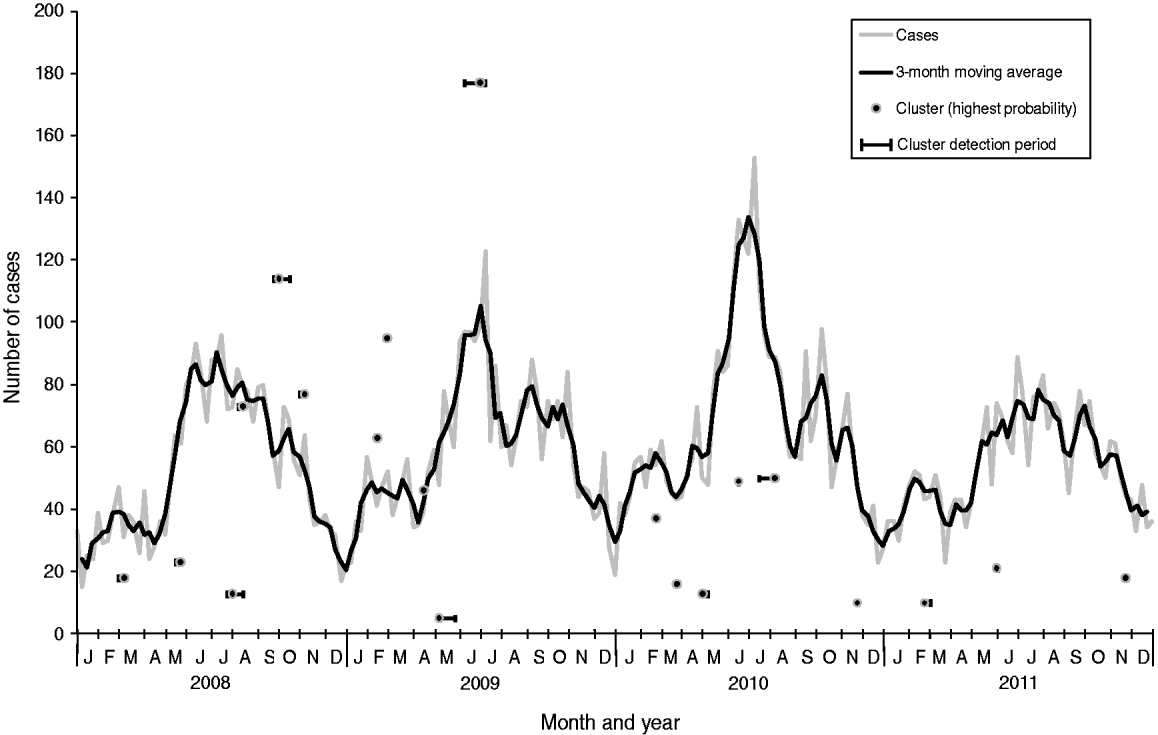
Of the 12 364 cases of campylobacteriosis that were reported to HPA North East during the study period (2008–2011), eight (0·06%) had missing home postcodes and were excluded from the analysis. Onset date was based on reported onset date for 24% of cases (n = 2987), specimen date for 73% (n = 9035), result date for 1% (n = 147) and referral date for 2% (n = 195). Cases showed a clear seasonal pattern with a minor peak in spring (February–March) and a major peak in summer (June–July) peaks (Fig. 1).

Fig. 1. Laboratory-confirmed Campylobacter spp. cases and space-time clusters detected through simulation of weekly prospective detection in the North East of England, 2008–2011. Clusters are positioned horizontally at the week where the cluster was detected with the highest probability and positioned vertically according to the number of cases within the cluster at that time. Horizontal bars indicate the time period where clusters were detected as significant (P < 0·05).
Incidence rates and age groups
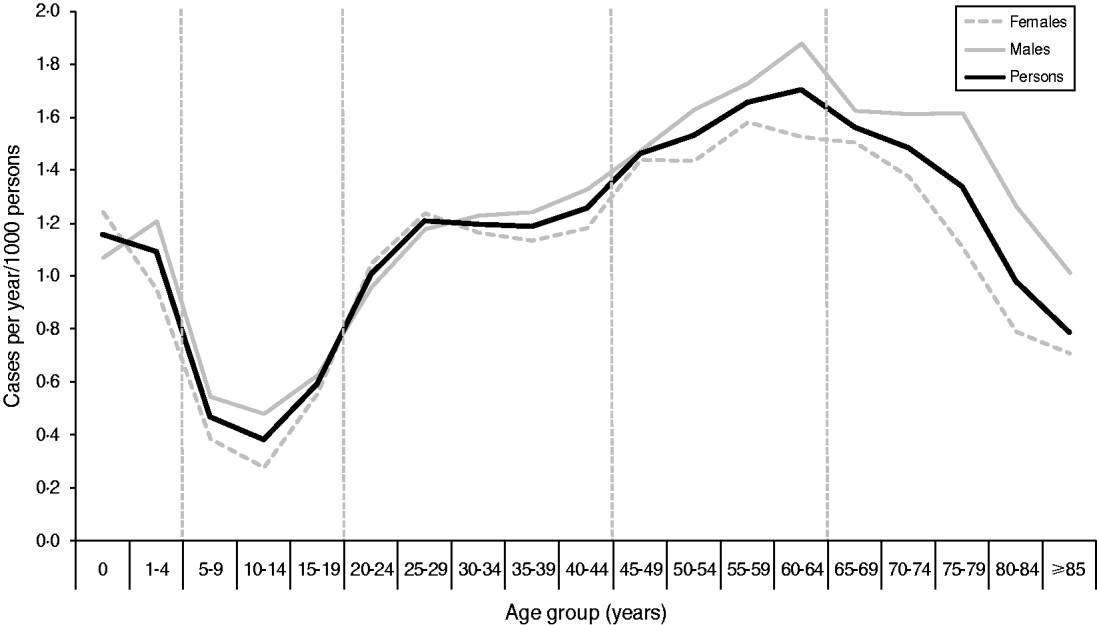
Cases were divided into age groups (0–4, 5–19, 20–44, 45–64, ⩾65 years) based on the incidence rate (Fig. 2). A total of 25 cases were excluded from the analysis as they had either unknown sex (n = 2) or unknown age (n = 23). No significant differences were found between the age distribution of cases for males and females using quinary age groups or the age groups used in this study (results not shown).

Fig. 2. Incidence rate of laboratory-confirmed Campylobacter spp. cases by quinary age groups and sex in the North East of England, 2008–2011. Vertical broken lines represent divisions between age groups used for this study. The figure contains an additional 107 cases from 2007 which were included in the study dataset for simulated runs for January 2008.
Space-time cluster detection
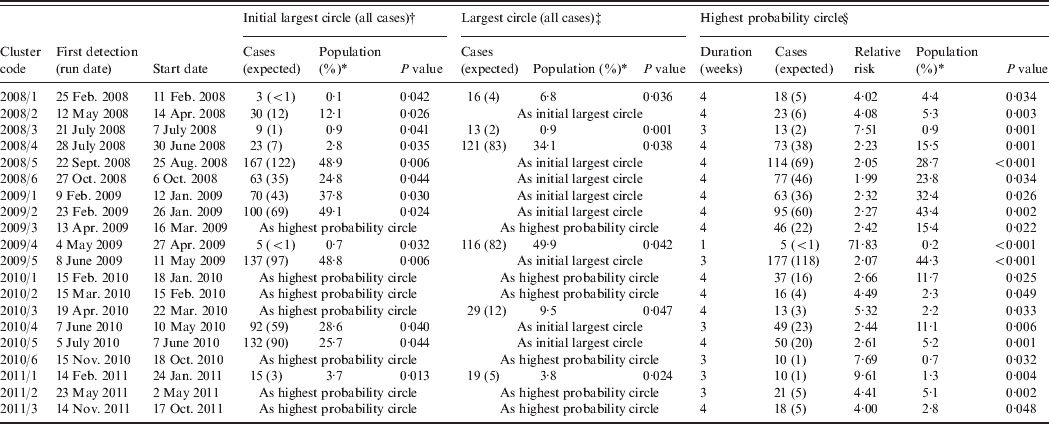
From the 209 model runs using a circular window, 45 (22%) detected at least one significant (P < 0·05) cluster. An increased sensitivity was found using cases aggregated into 7-day periods: a total of 101 significant clusters were found compared to 70 using a 1-day period. Only two specific clusters were detected by 1-day aggregation models that were not also found using a 7-day aggregation model for the same run date. However, both of these clusters were also contained within larger clusters which were detected as being significant in the 7-day aggregation model. In order to determine the number of clusters likely to have required epidemiological investigation, further analysis was restricted to results from the 7-day aggregation for clusters with at least one circle with a P value <0·05 which remained significant at this level following the removal of household cases. This resulted in 20 clusters for analysis and corresponds to an average of one cluster for epidemiological investigation every 10 weeks (Table 1). The detection of clusters does not appear to be associated with seasonal peaks in incidence (Fig. 1).
Table 1. Campylobacteriosis clusters detected through simulation of prospective detection in the North East of England, 2008–2011

* Percentage of the total population of the study region.
† If different from the highest probability circle.
‡ If different from the initial largest circle and the highest probability circle.
§ After removal of household cases.
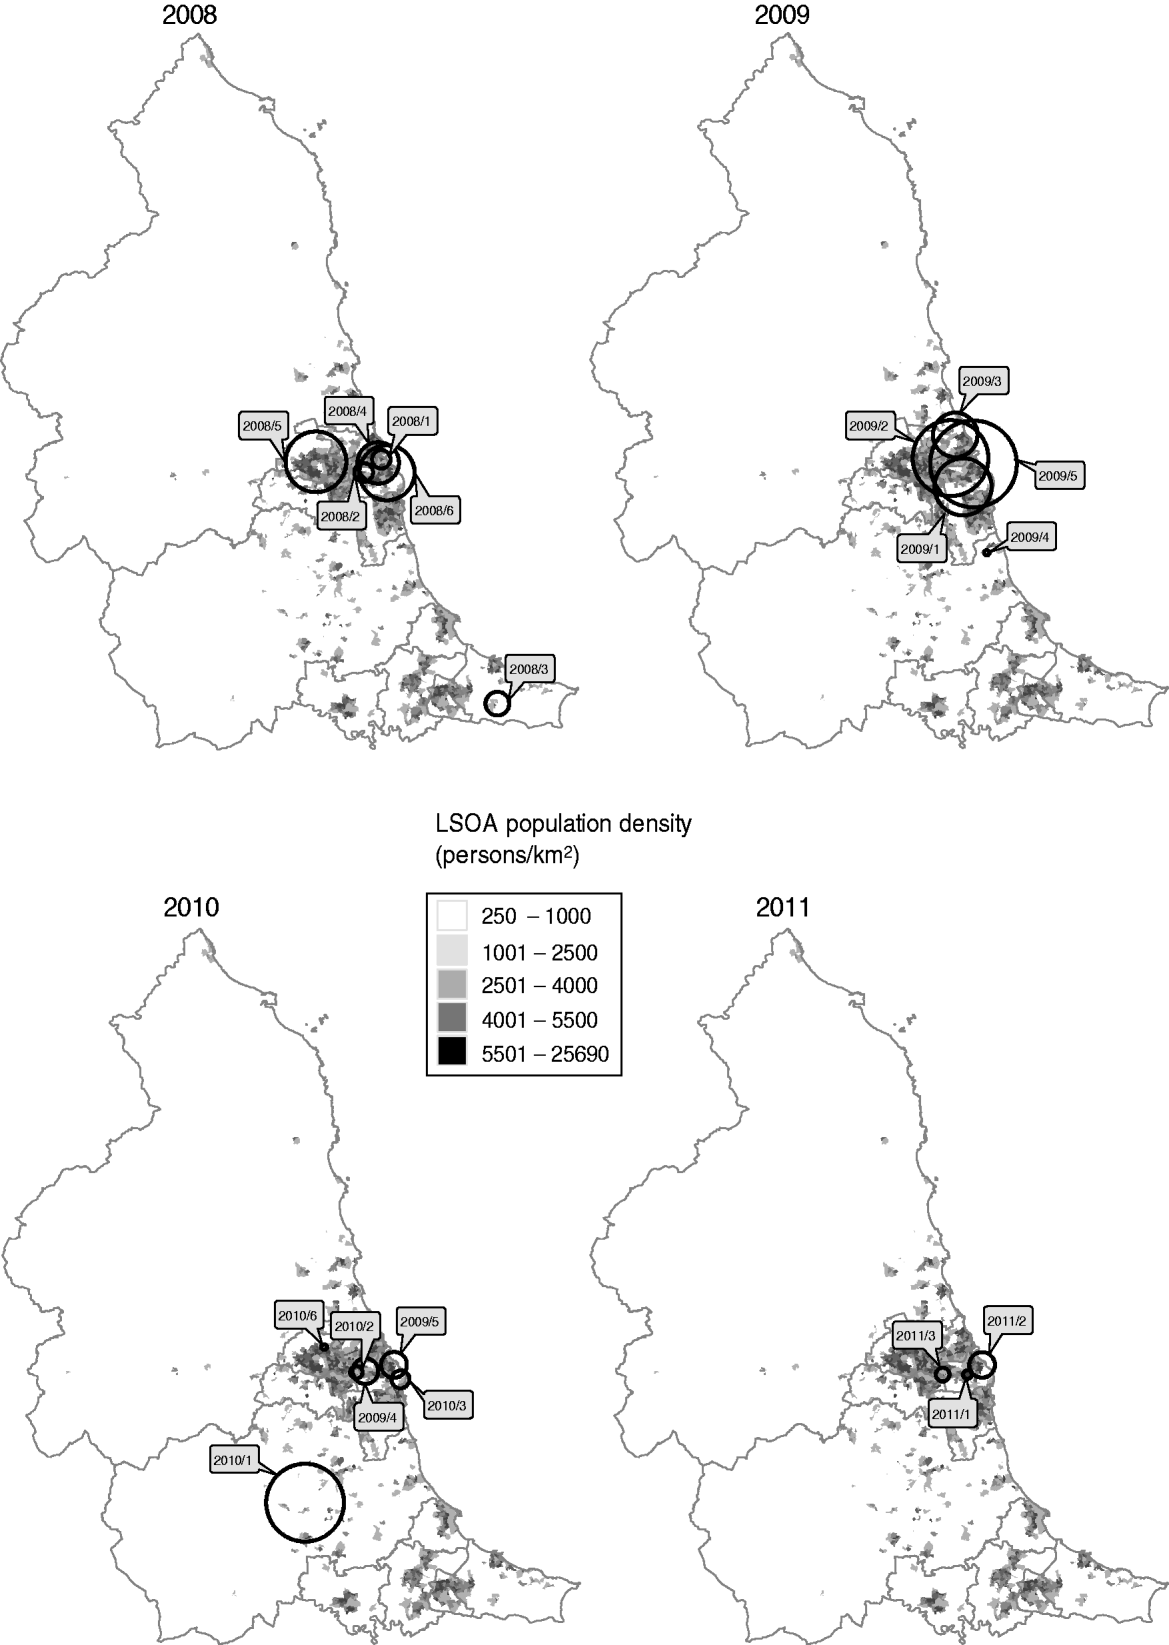
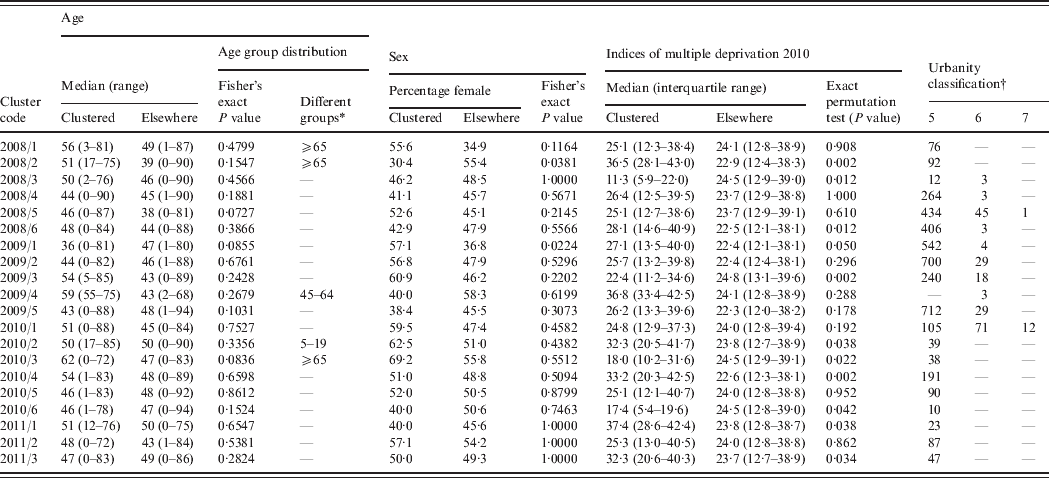
All but two of the clusters occurred within the centre-east area of the North East region of England which corresponds with the highest population density (Fig. 3). The highest probability circle (HPC) for each of these clusters was used for comparison of cases (Table 2). The median number of cases within the HPC for each cluster was 30 [interquartile range (IQR) 15–66] with a median population coverage of 5·3% (IQR 2·3–17·6) or a population of 134 442 (IQR 58 250–449997). In total, 928 cases were found within the 20 clusters, representing 7·5% of the total cases reported for 2008–2011.

Fig. 3. Location of highest probability circles for space-time clusters of laboratory-confirmed Campylobacter spp. cases in the North East of England detected through simulated prospective analysis, 2008–2011. Labels indicate the cluster code assigned in this study. Boundaries indicate current primary-care organizations. LSOA, Lower super output area.
Table 2. Epidemiological details of the highest probability circle for clusters of campylobacteriosis detected through simulated prospective detection in the North East of England, 2008–2011

* Age groups with significantly different numbers of observed cases compared to simulated age distributions.
† Number of lower super output areas within the highest probability circle; zero values have been omitted for ease of presentation. 5, Urban settlement with >10 000 population; 6, small towns and fringe areas that are located within the rural domain; 7, villages that are located within the rural domain.
Similar results were obtained using an elliptical cluster detection window. There was agreement (in terms of the significant detection of the same cluster by the circular and elliptical window models) for 196/209 (93·8%) weeks with discordance due to a lack of statistical significance (0·054<P < 0·342) for either the circular window model (eight runs) or the elliptical window model (five runs) (results not shown). This was not associated with a significantly increased sensitivity for the elliptical window model (48/209 weeks compared to 45/209 weeks for the circular window model; binomial probability test, P = 0·738).
Comparison of clustered and non-clustered cases
Although no age distribution (by age group) for clustered cases compared to the non-clustered cases differed significantly according to the Fisher's exact test, simulated age group distributions suggested significant differences for five of the 20 clusters (Table 2). Two clusters had significantly different expected numbers of cases by sex; one of which was associated with a higher number of males and one of which was associated with a higher number of females (Table 2). The IMD for those LSOAs within clusters significantly differed from the distribution of indices for other LSOAs in the region for 10 of the 20 clusters (Table 2). Six of these differences were associated with a median lower deprivation index (less deprived) within the cluster window and four with a median higher deprivation index (more deprived) within the cluster window. The urbanity classification for cluster LSOAs tended to fit to the general pattern for the North East region as a whole (81% RUAC of 5, 13% RUAC of 6).
DISCUSSION
The epidemiology of endemic and relatively prevalent pathogens is such that the detection of periods of increased incidence using time-series analysis requires both a rigid, pre-defined geographical unit (usually a testing laboratory or residential area) and historical baseline incidence data in order to place current epidemiological data in a reliable computational context amid possible seasonal variation and/or periodicity [Reference Farrington29]. A review of software for space-time cluster detection discussed alternative methods and recommended SaTScan for use with surveillance systems, particularly where automation may be a long-term goal [Reference Robertson and Nelson21]. The great advantage of space-time cluster detection methods such as SaTScan is the lack of reliance upon strictly bounded areas (within which exceedances are monitored) and the removal of the need to adjust for seasonality [Reference Kulldorff24, Reference Duke30], although if using the Poisson model there still remains the need to define geographical units (with population data) within the study region.
The integration of SaTScan into existing surveillance systems is certainly possible and is potentially automatable. The surveillance data itself requires little modification prior to running models. All of the geographical and population data used here are freely available. Outside of our setting, appropriate population data is often available and centroids can be readily calculated for geographical areas if they are not already available. Although we primarily report cluster detection using a circular window, use of a more flexible but computationally more expensive elliptical window is possible [Reference Kulldorff23]. However, we found very similar results for both window shapes which is not unsurprising given the relatively high level of geographical aggregation of our analysis (e.g. LSOA compared to postcode of residence) and the lack of evidence or intuition to suggest that Campylobacter cases associated with a common exposure would be necessarily distributed in a markedly un-circular manner. Moreover, the propensity for elliptical window models to detect more eccentrically shaped [Reference Kulldorff23] and potentially spurious clusters could be unhelpful to public health resources. Whichever model is used it is important to reiterate that the results of cluster detection serve solely as an indication of a situation requiring investigation [Reference Kulldorff24] and not as a means to define epidemiologically linked cases.
Certainly, a degree of caution should be observed when applying these models and interpreting their output. The methodology underlying the models is complex [Reference Kulldorff22] and the probability assigned to a cluster should not be inferred as a measure of the likelihood of epidemiological linkage prior to an assessment of the cases themselves [Reference Kulldorff24]. Potential local heterogeneity of confounding factors such as the incidence of travel-associated infection and the proportion of symptomatic patients who have a specimen taken for laboratory testing, may also create a source of error which must be considered prior to undertaking any public health action. Potential bias may also occur when population data lags behind population change, as could occur when substantial new housing is created within a geographical unit. A further consideration is that this method would not detect a rise in incidence affecting an entire study region evenly; under these circumstances time-series analysis based on historical data is better suited [Reference Farrington29]. Within the context of this study we also used home postcode as a proxy for the location of exposure, which will lead to a reduced sensitivity for detecting outbreaks where the likelihood of exposure is not proportional to the proximity of residential address to the infection source. It is also feasible that some systematic (but yet unknown) bias in the interval between the effective exposure to Campylobacter and our proxy measure of this event could lead to the inconsistent placement of cases into temporal windows. However, formal consideration of this bias would be complex and we feel it unlikely to have resulted in a high type I error rate for this study.
Fundamentally, for the current study we asked whether or not space-time cluster detection could provide a platform upon which suggested clusters of campylobacteriosis could be investigated for the presence of epidemiologically linked cases. Ideally, our results would have been validated against a list of known outbreaks. However, as mentioned earlier, recognized outbreaks of Campylobacter tend only to be associated with the catering industry [Reference Little16]. Under those circumstances, laboratory confirmation may be limited to the first few cases and as such the signal for outbreaks of this kind within routine laboratory surveillance data can be dampened. Nonetheless, despite the lack of historical outbreak data to validate the clusters detected here we did find limited evidence from age distributions and characteristics of cluster areas to suggest that clustered cases are not simply representative of background cases. It remains unclear whether or not the clusters detected here represent outbreaks or whether they are in fact artefacts of cluster detection created through a combination of the complex factors mentioned above. However, should the degree of historical clustering found here be applicable to the contemporary epidemiology of campylobacteriosis in the North East of England then neither the number, size, or geographical spread are restrictive to the application of further epidemiological and microbiological investigation. Without such an approach it will always be impossible to disentangle the complex possibilities of travel-associated exposures [Reference Zenner and Gillespie6] environmental exposures [Reference Jonsson8–Reference Potter, Kaneene and Hall10, Reference Duke30] and food-associated point-source outbreaks [Reference Rodrigues4, Reference Little16].
The scale and approach of any further investigation of space-time clusters will partially depend on the number of clustered cases. This is predicted here to vary from less than five to greater than 150, although the expected median of 30 cases every 10 weeks should be manageable by a regional epidemiology unit in England. Following the decision to investigate a cluster of Campylobacter cases there are a number of possible approaches that could be taken to perform the actual investigation and a number of means by which data could be obtained, many of which would depend on the local working environment. A descriptive study of those clustered cases would perhaps be the most straightforward approach although a case-case (vs. un-clustered cases) or case-control study would probably be more informative and allow direct hypothesis testing. Whatever approach is taken, the findings of this study support the feasibility of a prospective trial of campylobacteriosis cluster detection with further investigation of detected clusters for common links or risk factors.
ACKNOWLEDGEMENTS
We thank Sam Bracebridge for commenting on an earlier version of this article.
DECLARATION OF INTEREST
None.

