

Introduction
In Belgium, research on a potential host rock formation for the safe long-term disposal of high- and medium-level long-lived radioactive waste has so far been focused on the Oligocene Boom Clay. The reference location for research on the Boom Clay is the Mol-Dessel nuclear zone in the province of Antwerp (Belgium), involving the high activity disposal experimental site underground research facility (HADES-URF; Huysmans & Dassargues, Reference Huysmans and Dassargues2006; ONDRAF/NIRAS, 2001). Since the late 1990s, the Ypresian clays – part of the Eocene Ieper Group, Kortemark Member and Kortrijk Formation – have been considered and investigated as another potential host rock material for the deep geological disposal of radioactive waste. A research site, located in Doel, close to Antwerp (Belgium), is the reference site for methodological studies on the Ypresian clays (ONDRAF/NIRAS, 2001, 2013a). So far, mainly mineralogical and geochemical aspects of the material have been investigated, and little is known about the microstructure and mineral fabrics, in contrast to the well-documented Boom Clay (Desbois et al., Reference Desbois, Urai and Kukla2009, Reference Desbois, Urai, Hemes, Brassinnes, De Craen and Sillen2014; Hemes et al., Reference Hemes, Desbois, Urai, De Craen, Honty, Craen and Craen2013, Reference Hemes, Desbois, Urai, Schröppel and Schwarz2015). Information on pore-size distributions, pore-space morphologies and pore-space connectivity are of special interest with respect to the migration of radionuclides (Aertsens et al., Reference Aertsens, Maes, Moors and Lemmens2008a–Reference Aertsens, Van Gompel, De Cannière, Maes and Dierckxc; Ortiz et al., Reference Ortiz, Volckaert and Mallants2002). The modelling of material physical properties, such as permeability and diffusivity, as well as single and multi-phase fluid flow or radionuclide transport via diffusion and migration requires these data as input (Blunt et al., Reference Blunt, Bijeljic, Dong, Gharbi, Iglauer, Mostaghimi, Paluszny and Pentland2013; Dvorkin et al., Reference Dvorkin, Derzhi, Diaz and Fang2011; Hemes et al., Reference Hemes, Desbois, Urai, Schröppel and Schwarz2015).
The main objective of this study was to provide the first direct detailed characterisation (qualitative and quantitative) of the 2D pore space in the Ypresian clays. This paper delivers statistical analyses of the pore-space morphologies, including size, shape and orientation of the pores, down to hundreds of nanometers in pore-size diameter.
In the present study, six samples from the ON-Kallo-1 drilling (2008) were analysed, with respect to their mineral fabrics and porosity, using a combination of broad-ion-beam (BIB) milling and high resolution scanning electron microscopy (SEM), down to nanometre-scale resolution, within representative samples and areas.
Moreover, a high-pressure Wood's metal injection (WMI) experiment, followed by (cooled BIB)-SEM, was carried out to gain information on the connectivity of the pore space in 2D images (Klaver et al., Reference Klaver, Hemes, Houben, Desbois, Radi and Urai2015a).
Results were evaluated and compared to results of previous BIB-SEM studies on the Boom Clay (Hemes et al., Reference Hemes, Desbois, Urai, De Craen, Honty, Craen and Craen2013, Reference Hemes, Desbois, Urai, Schröppel and Schwarz2015).
Methods and materials
Methodology
Mineralogical analysis
For mineralogical characterisation, full quantitative analyses of bulk mineralogy and <2 µm clay fractions were done using ~20 g per sample for X-ray diffraction (XRD) analysis (Qmineral Analysis and Consulting, 2014; Heverlee, Belgium; Tables 1 and 2). The preparation of specimens for XRD analysis is described below.
XRD bulk mineralogical analysis results (Qmineral Analysis and Consulting, 2014). Rietveld refinement was used for the quantification of different mineral phases and the results are given in dry wt%.

Bold figures are sums of the entries above.
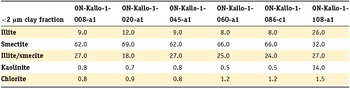
Mineralogical compositions of the <2 µm clay fractions from XRD (Qmineral Analysis and Consulting, 2014), calculated using the PONKCS-method. Contributions are given in dry wt%.
Samples were first dried at 60°C for at least 24 hours. After drying, the samples were ground in an agate/porcelain mortar and part of the homogenised sample (~2.7 g) was mixed and milled together with an internal standard (Zincite; ZnO) in ethanol, in a micronising mill. Afterwards, the samples were loaded into a sample holder for XRD, using CuKα radiation. The quantification of the NCMs was performed using the Rietveld method, whereas the quantification of the clay minerals was performed using the PONCKS method (Scarlett & Madsen, Reference Scarlett and Madsen2006). During Rietveld refinement, an XRD pattern is calculated based on the structural models of the minerals present. The calculated pattern is then fitted to the measured pattern by refining the structural parameters. Quantitative phase contents can be derived from the so-called scale factors, which are refined during the procedure (Table 1). In a second analysis, the fraction <2 μm, enriched in clay minerals, was separated from each of the samples, starting with a modified Jackson treatment (Jackson, Reference Jackson1985), in order to liberate the clay particles. Successively, carbonates, organic matter and Fe oxides/hydroxides were removed from the samples. Afterwards, the fraction <2 μm was separated by centrifugation and the interlayer cations of the separated clay minerals were exchanged to their Ca form. Oriented clay specimens were prepared from the clay-enriched <2 μm fractions and measured by XRD in an air-dry, ethylene glycol solvated state.
The obtained diffraction patterns were modeled with the Newmod 2-software (Reynolds & Reynolds, Reference Reynolds and Reynolds2012; Table 2).
Sample drying, water content porosimetry and BIB cross-sectioning
To minimise the development of desiccation cracks during high-vacuum BIB milling and SEM imaging, cubic centimetre samples from wet preserved cores (originally of ~20 cm length and 10 cm diameter) were slowly dried prior to the analyses. Samples were cut along their bedding using a razorblade. Sub-samples, suitable for BIB milling, had dimensions of ~1 × 0.5 × 0.4 cm. Drying was performed at room temperature, in closed containers, over a period of 75–178 days at controlled relative humidity, using different saturated salt solutions (Winston & Donald, Reference Winston and Donald1960). Five different salt solutions were prepared, ranging from 85% (potassium chloride, KCl), 76–75.5% (sodium chloride, NaCl), 70–71% (1:1 mixture of NaCl and KCl), 55–53% (magnesium nitrate hexahydrate, Mg(NO3)2·6H2O) to 33–32.5% (magnesium chloride hexahydrate, MgCl2·6H2O).
To calculate water content porosities from weight losses, an average grain density of the Ypresian clays of 2.699 g/cm³ (Van Marcke et al., Reference Van Marcke, Laenen and Wouters2005) and a pore-water density of 1.012 g/cm³, from pore-water compositions measured at ON-Kallo-1 (S. Brassinnes, ONDRAF/NIRAS, personal communication, 2014) were used. The resulting water content porosities were 41%, 41%, 43%, 39%, 35% and 31%, respectively, for the samples 8a, 20a, 45a, 60a, 86c and 108a, analysed.
After drying, samples were pre-polished using carbide grinding papers of grit sizes P500-2400 (ISO/FEPA Grit), followed by BIB milling, using a JeoL SM90001 at 6 kV for 8 hours, with the BIB cross-section oriented perpendicular to the bedding. BIB milling removes about 100 µm of damaged material and produces smooth, damage-free surfaces, suitable for high-resolution SEM image analysis.
Microstructural imaging using SEM (SE2, BSE, EDX)
BIB-polished samples were analysed using a Zeiss SUPRA55 scanning electron microscope, equipped with a back-scattered electron (BSE) detector for qualitative mineralogical analysis and a SE2 detector for the analysis of the sample surface topography (mostly the porosity) at high resolution. Energy dispersive XRD (EDX; Oxford Instruments, SDD Xmax150) was available for semi-quantitative analysis of the composition.
For qualitative mineralogical, microstructural and pore-space analyses, low-resolution (5000–6000x magnification) BSE and SE2 images were used, allowing for the identification of different mineral phases (BSE images) and characteristic pore-space morphologies (SE2 images; Figs 2–7). For quantitative porosity analysis, SE2-image mosaics, taken at high SEM magnifications (15,000–30,000x), were used. Image analysis was carried out on areas where macroscopic desiccation cracks were lacking. At the microscopic scale, if desiccation cracks were identified they were manually deleted from the segmentation data and excluded from further statistical analyses. For more details about the method we refer to Hemes et al. (Reference Hemes, Desbois, Urai, De Craen, Honty, Craen and Craen2013).
Stratigraphy, lithology and depths of origin (m BDT) of the Ypresian clay samples investigated in the present study. Figure modified from Mohammad (Reference Mohammad2009), after Hemes (Reference Hemes2015).

BSE- and SE2-image overviews of the areas used in the present study for detailed mineralogical and microstructural porosity analyses of the Ypresian clay sample 8a.

BSE- and SE2-image overviews of the areas used in the present study for detailed mineralogical and microstructural porosity analyses of the Ypresian clay sample 20a.

BSE- and SE2-image overviews of the areas used in the present study for detailed mineralogical and microstructural porosity analyses of the Ypresian clay sample 45a.

BSE- and SE2-image overviews of the areas used in the present study for detailed mineralogical and microstructural porosity analyses of the Ypresian clay sample 60a.

BSE- and SE2-image overviews of the areas used in the present study for detailed mineralogical and microstructural porosity analyses of the Ypresian clay sample 86c.

BSE- and SE2-image overviews of the areas used in the present study for detailed mineralogical and microstructural porosity analyses of the Ypresian clay sample 108a.

Porosity evaluation (segmentation and analysis)
In SE2 images taken at high magnifications (15,000–30,000x), pores are segmented semi-automatically, using a combination of thresholding and sobel-edge detection algorithms in Matlab (The MathWorks®; after Houben et al., Reference Houben, Desbois and Urai2013, Reference Houben, Desbois and Urai2014a; Klaver et al., Reference Klaver, Desbois, Urai and Littke2012; Hemes et al., Reference Hemes, Desbois, Urai, De Craen, Honty, Craen and Craen2013), followed by manual cleaning. The automatic porosity segmentation procedure recognises ~90% of the resolved pores correctly. Many larger pores contain segmentation artifacts and underestimate the boundary areas of the pores; these data are manually edited in ArcGIS (ESRI Inc., 2011). Prior to further statistical analysis, pores below the practical pore-detection resolution (PPR), as well as drying artifacts, are removed from the data. The PPR defines the minimum amount of pixels per pore that is necessary to confidently recognise the pore. In the present study, the PPR was determined as 15 pixels per pore, resulting in pore areas of 1441 nm² at 30,000x (sample 108a) magnification, 3241 nm² at 20,000x (samples 20a, 45a and 86c), 5704 nm² at 15,000x (sample 8a) and 51,509 nm² at 5000x (sample 60a; Hemes et al., Reference Hemes, Desbois, Urai, De Craen, Honty, Craen and Craen2013; Klaver et al., Reference Klaver, Desbois, Urai and Littke2012).
Pore morphologies are quantified using the Matlab toolbox PolyLX (Lexa, Reference Lexa2010). The most relevant output parameters are the axial ratio (AR), the elongation (E), the roundness (R), the circularity (C), the compactness (Cp), the grain-shape factor (GSF) and the orientation angle of the longest pore axis. For pore-morphological analysis we discriminated between intra-clay matrix porosity and inter-aggregate pores.
For the analysis of pore-area size distributions, a non-linear binning, as described by Hemes et al. (Reference Hemes, Desbois, Urai, De Craen, Honty, Craen and Craen2013, Reference Hemes, Desbois, Urai, Schröppel and Schwarz2015), Houben et al. (Reference Houben, Desbois and Urai2013, Reference Houben, Desbois and Urai2014a) and Klaver et al. (Reference Klaver, Desbois, Urai and Littke2012), of always doubling the subsequent bin size and starting with a bin size of 1 nm², was used. The resulting pore-area size distributions and contributions of pore-area sizes to total segmented porosities were plotted against the bin centres (bi ). Following the findings of Houben et al. (Reference Houben, Desbois and Urai2013), Klaver et al. (Reference Klaver, Desbois, Urai and Littke2012) and Hemes et al. (Reference Hemes, Desbois, Urai, De Craen, Honty, Craen and Craen2013, Reference Hemes, Desbois, Urai, Schröppel and Schwarz2015), pore-area size distributions in clayey materials can be described by a power law, therefore the frequencies of the pore areas (Ni ), that is, the number of pores falling within each bin, were normalised by the respective bin size (Si ) and, for the comparison of pore-area size distributions measured in different samples, the size of the total mosaic area analysed (Smosaic ). The resulting normalised numbers of pores per bin (Ni /SiSmosaic ) were plotted against the bin centers (bi ) on a double logarithmic scale (Equations 1 and 2).
 $$\begin{equation}
\left[ {{N_i}/\left( {{S_i}{S_{mosaic}}} \right)} \right] = C\left( {{b_i}^{-D}} \right)
\end{equation}$$\\
$$\begin{equation}
\left[ {{N_i}/\left( {{S_i}{S_{mosaic}}} \right)} \right] = C\left( {{b_i}^{-D}} \right)
\end{equation}$$\\
 $$\begin{equation}
\log\left[ {{N_i}/\left( {{S_i}{S_{mosaic}}} \right)} \right] = - D\log{b_i} + {\rm{ }}\log{C}
\end{equation}$$
$$\begin{equation}
\log\left[ {{N_i}/\left( {{S_i}{S_{mosaic}}} \right)} \right] = - D\log{b_i} + {\rm{ }}\log{C}
\end{equation}$$
To calculate the power-law exponents (D) and log (C) of the distributions, least-square linear regression analyses (including 95% confidence bounds) were applied to the linear parts of the pore-area size distributions on a double logarithmic scale and above the PPRs.
Evaluation of the investigated areas’ representativeness
Relative errors – with respect to an infinite volume (= 100% mathematically representative) – of 2D apparent porosities were calculated after Hemes et al. (Reference Hemes, Desbois, Urai, Schröppel and Schwarz2015), Keller (Reference Keller2015), Keller et al. (Reference Keller, Holzer, Schuetz and Gasser2013) and Kanit et al. (Reference Kanit, Forest, Galliet, Mounoury, Jeulin, Kang, Watabe and Tsuchida2003) based on the size of the analysed sample areas and the number of realisations (N) of those area elements (see the references above for details). By increasing the number of realisations (N), the area of investigation is virtually increased, thereby decreasing the relative error.
Wood's metal injection experiment
To analyse and directly visualise the connectivity of the pore space, Wood's metal (WM) injection, as an alternative to mercury intrusion porosimetry (MIP), was used. The advantage of WM over mercury is that it is solid at ambient conditions, but melts above ~70°C, therefore by heating the whole injection set-up, including the samples, the metal can be injected into the sample's pore space in its liquid state. By cooling down the whole set-up to room temperature afterwards, the injected metal solidifies within the pore space and can be visualised using (cooled BIB)-SEM. The chemical composition of the WM alloy is ~50% Bi, 25% Pb, 12.5% Sn and 12.5% Cd.
The WMI apparatus used in the present study (after Klaver et al., Reference Klaver, Hemes, Houben, Desbois, Radi and Urai2015a) was developed in-house at RWTH Aachen University (Hildenbrand, Reference Hildenbrand2003; Hildebrand & Urai, Reference Hildebrand and Urai2003). It consists of a pressure cell and two pistons, with external heating and a thermocouple for temperature control during the experiment. A nut and the lower steel piston, with a thread, are used to release the WM cylinder with the injected samples after cooling at the end of the experiment. For WMI, a solid WM piece is inserted into the pressure cell with the lower piston in place. To melt the WM, the cell is heated to ~75°C, which is checked using a thermocouple and by visual inspection. Afterwards, the oven-dried samples, with dimensions of ~0.5 × 0.5 × 0.5 cm, are inserted into the cylinder and immersed into the molten alloy. The upper piston is put in place and the pressure cell is loaded using a manually-controlled hydraulic press equipped with a pressure gauge. The pressure in the molten WM is increased to a maximum of ~156 MPa, so the smallest accessed pore throats should be about ~10 nm in diameter. This is calculated using Laplace's equation (Washburn, Reference Washburn1921; Equation 3). After the maximum pressure has been reached, the heating is turned off and the system is cooled down to room temperature overnight and at high pressure. The solidified WM cylinder containing the samples is then gently pushed out of the stainless steel cylinder (Klaver et al., Reference Klaver, Hemes, Houben, Desbois, Radi and Urai2015a).
 $$\begin{equation}
P = -4\gamma \cos\theta /d
\end{equation}$$
$$\begin{equation}
P = -4\gamma \cos\theta /d
\end{equation}$$
For the pore-throat diameter calculation, an interfacial tension (γ) of WM of 0.420 N/m and a wetting angle (θ) of 140° (after Abell et al., Reference Abell, Willis and Lange1999; Darot & Reuschlé, Reference Darot and Reuschlé1999; Hildebrand & Urai, Reference Hildebrand and Urai2003; Klaver et al., Reference Klaver, Hemes, Houben, Desbois, Radi and Urai2015a) were used.
Samples are cut from the WM cylinder at room temperature, followed by pre-polishing, using silicon carbide papers down to grit-size P2400 (ISO/FEPA Grit), to optimise the subsequent BIB-polishing.
To avoid re-melting the WM inside the samples, a Technoorg Linda Co. Ltd. SC-1000 argon-ion beam polisher, equipped with a Peltier module – to keep the temperature below the melting point of WM during the ion-beam milling, that is, the sample stage was maintained at ~40°C during the whole experiment – was used to produce large, planar cross-sections with low surface roughness. The samples were polished in two subsequent steps and rotated during the ion-milling, as described in Klaver et al. (Reference Klaver, Hemes, Houben, Desbois, Radi and Urai2015a).
Samples
The Ypresian clays
The Ypresian clays – part of the Eocene Ieper Group – were deposited predominantly in a marine environment during the oldest age of the Eocene (i.e. the Ypresian Age) ~55–49 Ma ago (ONDRAF/NIRAS, 2001; Steurbaut, Reference Steurbaut1998). They comprise the clayey deposits of the Kortrijk Formation and the clay-rich silts of the lower part of the Tielt Formation, referred to as the Kortemark Member, which were both deposited during the early to middle Ypresian (Van Marcke et al., Reference Van Marcke, Laenen and Wouters2005). The deposits are present underneath nearly the whole of Belgium, parts of France and small areas of the Netherlands at depths ranging from the surface to ~650 m below tweede algemeene waterpassing (TAW), that is, the second general levelling in Belgium (Jones, Reference Jones1949; Labat, Reference Labat2011). They dip gently to the north–northeast (Van Marcke et al., Reference Van Marcke, Laenen and Wouters2005). The thickness of the deposits varies between ~50 m in the south and ~150 m in the north. Similar to the Boom Clay Formation, the Ypresian clays consist of an alternation of clay- and silt-rich layers, with the corresponding variation in grain size distribution (Van Marcke et al., Reference Van Marcke, Laenen and Wouters2005). First results of quantitative mineralogical analyses on the Ypresian clays, from the Doel-1 well (1998), are summarised in Van Marcke et al. (Reference Van Marcke, Laenen and Wouters2005).
Samples analysed in the present study
All samples analysed in the present contribution originate from the ON-Kallo-1 (2008) well at depths between –288 and –387 m TAW, within the Kortemark Member and Kortrijk Formation (Fig. 1). Samples were chosen from the Kortemark Member, Aalbeke Member, Roubaix Member and Orchies/Mont-Héribu Member (Cammaer et al., Reference Cammaer, Cockaerts and Schiltz2009; Mohammad, Reference Mohammad2009; ONDRAF/NIRAS, 2013b), comprising different mineralogical compositions and grain-size distributions, and being representative of more clay-rich, fine-grained vs more NCM and silt-rich, low vs high-porosity material. Six samples were analysed in total. Two samples were very fine grained and show high clay mineral contents (Table 1; samples ON-Kallo-1-108-a1 and ON-Kallo-1-045-a1), originating from depths of ~395 mBDT/–387 mTAW (sample 108a) and 333 mBDT/–325 mTAW (sample 45a), respectively. Sample ON-Kallo-1-020-a1 was of intermediate grain-size and was collected at a depth of ~308 mBDT/–300 mTAW. Three samples were more coarse grained (samples ON-Kallo-1-008-a1, ON-Kallo-1-060-a1 and ON-Kallo-1-086-c1), originating from depths of about 296 mBDT/–288 mTAW (sample 8a), 348 mBDT/–340 mTAW and ~373 mBDT/–365 mTAW (sample 86c), respectively. Fig. 1 shows the depths of origin of the Ypresian clay samples analysed (in mBDT), together with the lithology of the Ypresian clays at ON-Kallo-1 (after Mohammad, Reference Mohammad2009; Hemes, Reference Hemes2015).
Results
Full quantitative analysis of the chemical compositions
Quantitative XRD results indicate comparable overall mineralogical compositions of the samples, but with varying proportions of the different mineral phases (Tables 1 and 2). Clay mineral contents range between 29.6 dry wt% in sample 8a (clay-poor) and ~71 dry wt% in sample 45a (most clay-rich). Sample 20a shows a clay mineral content of ~69 dry wt% and is therefore also considered to be clay-rich, whereas samples 60a, 86c and 108a show intermediate clay mineral contents between 51 and 63 dry wt% (Table 1).
Mineralogical analyses using XRD and subsequent quantification of the NCMs by the Rietveld method as well as quantification of the clay minerals by the PONCKS-method result in three different groups of clay minerals, present in significant amounts. These comprise 2:1 clays or TOT phyllosilicates, which are smectite, illite or illite–smectite mixed layer clays. The second group consists of kaolinites, referred to as TO or 1:1 clays, and the third of chlorites. Kaolinites and chlorites are present in much lower quantities of between 0.1 to 2 dry wt%, compared to the 2:1 clays, accounting for between 28.9 and 69.2 dry wt% (Tables 1 and 2). Only sample 108a shows a higher kaolinite content of ~5.7 dry wt% (bulk sample) and ~14 dry wt% in its <2 μm clay fraction, whereas the other samples investigated contain <1 dry wt% kaolinite in their <2 μm clay fractions (Tables 1 and 2). Chlorite is limited to the <2 μm clay fraction in all samples, with concentrations between 0.8 and 1.5 dry wt% (Tables 1 and 2). The 2:1 clays in the <2 μm fractions consist mainly of smectites (~32–69 dry wt%) and illite–smectite mixed layer clays (between 18 and 27 dry wt%). Illite is also present in the <2 μm clay fraction of the samples, but in much lower quantities of between 8 and 12 dry wt%. Again, sample 108a is the exception, with a much higher illite content of ~26 dry wt% and remarkably less smectite, contributing to only ~32 dry wt% of the <2 μm clay fraction of the sample (Table 2).
Although only the clay minerals were quantified in the oriented clay specimens, reflections of other minerals could also be identified. Among these are zeolites (clinoptilolite or heulandite) in sample 8a, concentrated in its <2 μm clay fraction. Opal was identified in the bulk diffraction patterns of the <2 μm clay fractions of samples 8a, 60a and 86c, with concentrations inversely correlated to the clay mineral contents. In the clay-rich samples 20a, 45a and 108a, no opal was found at all. Quartz was detected in all samples analysed, showing concentrations between 23.5 dry wt% (sample 45a) and 54.6 dry wt% (sample 8a). An inverse correlation between the amount of plagioclase and the samples’ clay mineral contents (Table 1) was observed, showing the highest plagioclase concentrations of 3.9–5.1 dry wt% in the most clay-poor samples (8a, 60a and 86c). Only sample 108a shows a lower plagioclase content than samples 20a and 45a, although its clay mineral content is lower too. Alkali-feldspars were found in rather high concentrations in samples 8a (~4.3 dry wt%), 108a (~2.2 dry wt%) and 20a (~1.8 dry wt%), but in much lower concentrations of only ~0.4–0.7 dry wt% in the remaining samples. The carbonates calcite and ankerite were identified in low concentrations (<2 dry wt%) in samples 8a, 45a, 60a and 86c. Magnesite was found in sample 86c (~0.4 dry wt%), only. Rutile, anatase and pyrite were present in concentrations ≤1 dry wt% in most of the samples analysed (Table 1).
From bulk sample mineralogical compositions and results of XRD analyses of the <2 µm clay fractions, total expanding clay mineral contributions (i.e. smectites + illite–smectite mixed layer clays) were calculated. The expanding clay mineral content of a sample is of importance with respect to the volume change potential of clay minerals during drying/wetting, respectively, and therefore there is the potential for the development of desiccation cracks. Results give bulk expanding clay mineral contents of 26 dry wt% in sample 8a, 60 dry wt% in sample 20a, 63 dry wt% in sample 45a, 47 dry wt% in sample 60a, 51 dry wt% in sample 86c and 37 dry wt% in sample 108a. For the calculation, only the contributions of mica from the 2:1 fractions of the bulk were taken into account (but not to the <2 µm clay fractions). Recent analysis of the swelling properties of the Ypresian clays, performed on the same cores, confirms our results based on XRD measurements.
Qualitative description of the morphology of porosity
Analysis of BSE- and SE2-image mosaics
BSE- and SE2-image mosaics, taken at SEM magnification between 5000 and 30,000x, cover areas between 150 × 250 and 200 × 300 µm² (Figs 2–7). Only the SE2-image area analysed for sample 108a is slightly smaller (~150 × 200 µm²; Fig. 7). The images show the characteristic mineral and pore fabrics of the Ypresian clay samples analysed. The overall microstructures of the samples can be described as consisting of a very fine-grained clay matrix, embedding different relative contributions of larger, silt- to sand-sized particles, corresponding to NCM and mostly quartz grains. From the analysis of 2D BIB-SEM cross-sections, sample 8a displays the most coarse-grained fabric, with apparent grain diameters ranging from clay-sized particles (i.e. <3.9 µm in grain diameter), up to fine sand-sized particles with apparent grain diameters >63 µm (Fig. 2). The remaining coarse-grained samples 60a and 86c show very similar apparent grain-size distributions, with a large amount of silt-sized particles (between 3.9 and 63 µm), but also significant contributions of fine-grained, clayey material (<3.9 µm grain diameter), filling the space in between the larger, NCM grains (Figs 5 and 6). Moreover, the coarse-grained Ypresian clay samples (8a, 60a and 86c) show a very loose packing of the material, which is contra-intuitive to the rather high depths of origin of the samples (Figs 1, 2, 5 and 6). The microstructures of the two most fine-grained Ypresian clay samples (45a and 108a), but in particular of sample 108a, are much more compacted. Sample 108a, moreover, shows a lower total BIB-SEM visible porosity than all other samples investigated (Fig. 7). The microstructures of the more fine-grained Ypresian clay samples (20a, 45a and 108a) show characteristic features similar to the typical microstructures and pore morphologies described for fine-grained, clay-rich Boom Clay by Hemes et al. (Reference Hemes, Desbois, Urai, De Craen, Honty, Craen and Craen2013). These samples’ microstructures are dominated by a very fine-grained clay matrix (<3.9 µm grain diameters), embedding only a few larger, silt-sized particles, whereas the microstructures of the coarse-grained Ypresian clay samples 8a, 60a and 86c are dominated by larger, silt- to sand-sized particles, with a fine-grained clay matrix filling the space in between (Figs 2–7). Two main classes of porosity were identified:
-
(1) Pores within the clay matrix, with typical diameters smaller than 1 µm, showing elongated pore morphologies and high aspect ratios as well as large elongation factors in the fine-grained samples 20a, 45a and 108a (Figs 3, 4, 7 and 8A,B), in contrast to much more circular, roundish pores, with low aspect ratios, higher circularities and higher roundness values, recognised in the clay matrix of the more coarse-grained samples analysed (8a, 60a and 86c; Figs 2, 5, 6 and 8C). All samples display poor preferential orientations of the clay aggregates and therefore also the pores’ longest axes within the clay matrix show no preferred orientation.
-
(2) Larger inter-aggregate pores are found at the interfaces between clay matrix and NCM grains, with typical diameters above 1 up to 10 µm (Figs 2–7 and 9).
A. Typical pore morphologies in fine-grained, clay-rich (>60 dry wt% clay) Ypresian clay samples 108a and 45a, classified according to Desbois et al. (Reference Desbois, Urai and Kukla2009) and Hemes et al. (Reference Hemes, Desbois, Urai, De Craen, Honty, Craen and Craen2013) as ‘type I–III pores’ in clay, which show similar pore morphologies as observed within the clay matrix of the Boom Clay (Hemes et al., Reference Hemes, Desbois, Urai, De Craen, Honty, Craen and Craen2013); B. Typical pore morphologies within the clay matrix of the Ypresian clay sample 20a, showing less elongated, more roundish pore shapes, but still with similarities to pore morphologies observed within the clay matrix of the Boom Clay. C. Characteristically very small (<3 × 10⁴ nm² pore area) circular pores, observed within the clay matrix of the more coarse-grained, NCM-rich (>40 dry wt% NCM) Ypresian clay samples 8a, 60a and 86c.

A more detailed inspection of these inter-aggregate pores shows that they can be further sub-divided into two classes:
-
(i) Symmetric pores, showing rather high aspect ratios and serrated pore boundaries and resembling desiccation cracks, as described by Renard (Reference Renard2012), Houben et al. (Reference Houben, Desbois, Urai, Winter, Drury and Schwarz2014b) and Desbois et al. (Reference Desbois, Urai, Hemes, Brassinnes, De Craen and Sillen2014).
-
(ii) Pores with smooth, rounded pore boundaries, coated by a very low porous, thin (~1–3 µm) clay layer (Fig. 9). Compared to the clay matrix, EDX analysis indicates enrichment in titanium (Ti) and sodium (Na) in these coatings, but a slight depletion in aluminum (Al), potassium (K) and iron (Fe) (Fig. 9).
Results of EDX analyses (line-scan (counts per second)) on thin, low porous clay coatings (dashed red line), observed on large, smooth inter-aggregate pores at the boundaries between the clay matrix (dashed blue line) and NCMs (mostly quartz, Qz) grains, showing a depletion in aluminum (Al), potassium (K) and iron (Fe), and an enrichment in titanium (Ti) and sodium (Na) compared to the clay matrix.

The loose packing of the coarse-grained samples (8a, 60a and 86c), their high clay matrix internal porosities, together with the smooth, rounded pore morphologies were described and characterised as a ‘flower like microstructure’ (Hemes, Reference Hemes2015; Figs 2, 5 and 6).
Wood's metal injection
WMI was carried out on one Ypresian clay sample (ON-Kallo-1-020a). Because of the high density of the WM, it appears bright in BSE images (Fig. 10) and the results show that nearly the entire resolved pore space was filled by the WM alloy, with only a few cracks remaining unfilled (Fig. 10, white arrow). The inset in Fig. 10 shows high-resolution examples of the smallest visible filled pores. WMI reveals that all pores – including pores within the clay matrix as well as inter-aggregates pores – are mutually connected at a maximum WM entry pressure of 156 MPa, corresponding to accessible pore-throat diameters of 10 nm.
A. Nearly entirely WM-filled pore space in sample ON-Kallo-1-020a, resolved at BSE-image magnification of 20,000x; B. The white arrow indicates rare cracks, which remained unfilled during the injection procedure and probably developed due to pressure release during unloading of the WM-injected sample (Hemes, Reference Hemes2015); C. Detail of B. WM is indicated by the bright phase in the SEM micrograph.

Quantitative description of porosity
Visible porosity in BIB-SEM images
Total BIB-SEM observed porosities, resulting from automatic porosity segmentations on SE2-image mosaics at resolutions between 51,509 nm² at 5000x magnification and 1441 nm² at 30,000x magnification, are between 6.3% of the analysed area for sample 108a (30,000x) and 17.8% for sample 60a (20,000x). At 5000x magnification sample 60a shows a total porosity of 14.8% and sample 8a of 13.9%. At 15,000x SEM magnification sample 8a shows a total segmented porosity of 15.2% and at 20,000x magnification sample 20a shows a total porosity of 9.9%, sample 45a of 9.2% and sample 86c of 14.5%. Due to timely restrictions, manual cleaning of the segmentation data was only carried out on the high-resolution data of samples 8a and 86c, and resulted in total BIB-SEM observed porosities of 17.3% for sample 8a (15,000x magnification) and 16% for sample 86c (20,000x magnification). Manually cleaned segmentation data are considered to provide a more realistic visible porosity at the scale of observations. On average, the visible porosities, inferred from manually cleaned data, may increase up to 15% with respect to the non-cleaned data. However, an increase in BIB-SEM visible porosity with the sample grain size and NCM content, can be inferred both, from the manually cleaned as well as from the non-manually cleaned data.
Relative errors of porosity measurements
For areas analysed in the present contribution and one realisation (N = 1), calculated relative errors are between 8 and 23% (Table 3). By increasing the number of realisations to 10, relative errors would be reduced to between 2.5 and 7.5%, and with a total number of 100 realisations, the relative errors of porosity estimations would be ≤2.5% for all samples analysed (Table 3).
Summary of results of REA calculations.

Pore-shape analysis
For pore-shape analysis, pores within the clay matrix, which are smaller than 1 × 10⁷ nm² pore area, were analysed separately from the larger inter-aggregate pores. The results of the quantitative pore-shape analysis are summarised in the following.
In the most fine-grained, clay-rich samples (20a, 45a and 108a), pores within the clay matrix are elongated, with high aspect ratios between 1.8 and 2.7, whereas in the more coarse-grained, NCM-rich samples (8a, 60a and 86c), typical pore morphologies within the clay matrix are roundish, with lower aspect ratios between 1.64 and 1.72. The grain- or pore-shape factor (GSF), which describes the irregularity and complexity of a pore boundary, is significantly higher for the segmented inter-aggregate pores, with values between 5.74 and 10.71, compared to values of ~3–5 for pores within the clay matrix.
Pore-size distribution analyses
For all samples analysed, the frequency distributions of pore areas show mono-modal distributions (Figs 11 and 12) in the pore-area size range bound by the PPR and the largest pore detected in the image. However, within the same pore-area size range, the contributions of pore sizes (areas) to the total segmented porosities are either mono- or bi-modally distributed. The primary peaks in bi-modal porosity contribution distributions (Cttp), observed for samples 8a, 60a, 86c and 108a, as well as the peaks in mono-modal porosity contribution distributions, observed for samples 20a and 45a, are attributed to pores within the clay matrix of these samples (i.e. <1 × 10⁷ nm² pore area). In more detail, those peaks are located at ~1 × 10⁶ nm² pore area in samples 8a, 20a and 86c (Figs 11 and 12), ~5 × 10⁵ nm² pore area in sample 45a (Fig. 11) and ~2 × 10⁵ nm² pore area in sample 108a (Fig. 12). Sample 60a does not show a clear peak in its porosity contribution distribution, but rather a wide range of pore sizes, contributing significantly to the total segmented porosity (Fig. 12). For samples 8a, 60a and 108a, a secondary peak is displayed in their porosity Cttp, contributing to a significant fraction of the total resolved porosity (Figs 11 and 12). This peak is attributed to larger, inter-aggregate pores, preferentially located at the boundaries between the clay matrix and NCM grains, and showing characteristic sizes above 1 × 10⁷ nm² pore area.
Pore-area size distribution analyses on the Ypresian clay samples 8a, 20a and 45a. Left: Normalised pore-size frequencies and contributions to total segmented porosities (Cttp (%)). Right: Power-law distributions of pore-area sizes, within the clay matrix.

Pore-area size distribution analyses on the Ypresian clay samples 60a, 86c and 108a. Left: Normalised pore-size frequencies and contributions to total segmented porosities (Cttp (%)). Right: Power-law distributions of pore-area sizes, within the clay matrix.

On the right side of Figs 11 and 12, pore-area size distributions, measured within the clay matrix of the samples, are plotted on a double logarithmic scale. Least-square linear regression analysis on the linear parts of these plots (i.e. pores within the clay matrix and above the PPRs of 15 pixels per pore), results in power-law exponents of pore-area size distributions between 1.46 and 1.78 (sample 8a 1.66, sample 20a 1.62, sample 45a 1.63, sample 60a 1.71, sample 86c 1.46, sample 108a 1.78) and logC values between –4.76 and –3.36 (sample 8a –3.70, sample 20a –3.97, sample 45a –3.88, sample 60a –3.37, sample 86c –4.76, sample 108a –3.36). Values of power-law exponents and logC are all comparable within the 95% confidence range for all samples analysed (Fig. 13).
Comparison of power-law scaling parameters (D) from least-square linear regression analysis on pore-area size distributions within the clay matrix, as well as –logC values for the Ypresian clays (present study), compared to the Boom Clay (data reworked from Hemes et al., Reference Hemes, Desbois, Urai, De Craen, Honty, Craen and Craen2013).

Discussion
Representativeness of the analyses
Relative errors of porosity estimations are ~10% for N = 1 for most of the samples analysed (i.e. sample 8a at low resolution, 5000x magnification data, and samples 20a, 45a, 60a and 86c at 20,000x magnification; Table 3). For samples 60a and 86c at low magnification (5000x), sample 8a at high resolution (15,000x magnification) and sample 108a (30,000x magnification), the relative errors of porosity estimations are slightly higher (17–23%).
For sample 108a, the relative error is higher than for the other fine-grained samples (45a and 20a) due to the area analysed being about an order of magnitude smaller (Fig. 7). A second reason is that the area analysed of sample 108a has a more heterogeneous fabric due to the presence of a cluster of large, silt-sized NCM grains (Fig. 7).
In general, the more coarse-grained samples show higher relative errors of porosity estimations than the fine-grained samples for comparable sizes of analysed areas. This can be explained by the more significant contribution of large, low to non-porous NCM grains to the microstructure of these samples.
We have shown that it is possible to decrease the relative error of porosity estimations by increasing the number of realisations of the analysed area (N) (Table 3).
Another aspect to consider when discussing the representativeness of the results is the impact of microscopic drying artifacts (i.e. desiccation cracks) on the porosity estimations from BIB-SEM image analyses (Desbois et al., Reference Desbois, Urai, Hemes, Brassinnes, De Craen and Sillen2014). However, Desbois et al. (Reference Desbois, Urai, Hemes, Brassinnes, De Craen and Sillen2014) have shown that microscopic drying artifacts, which occur at the scale of individual pores, cannot be easily removed from the segmentation data and also do not have a large impact on the overall porosity statistics within the standard deviations.
Pore-size distributions and pore morphologies within the clay matrix of Ypresian clays and comparison to the Boom Clay
If all pores within the clay matrix of the Ypresian clays, as well as larger inter-aggregate pores, are taken into account, they show similar frequency distributions with small pores dominating the frequency distributions (Figs 11 and 12). On the other hand, large inter-aggregates pores contribute significantly to the porosity volume (Figs 11 and 12). This behavior is comparable to what has been observed for the Boom Clay, analysed by Hemes et al. (Reference Hemes, Desbois, Urai, De Craen, Honty, Craen and Craen2013) (Fig. 14). Fig. 14 resumes the findings by Hemes et al. (Reference Hemes, Desbois, Urai, De Craen, Honty, Craen and Craen2013), re-plotted to be directly comparable to the present study. For all samples analysed (BC and YPRC; Figs 11, 12 and 14), a PPR of 15 pixels and the largest pore-area sizes within the clay matrix of ~ 1 × 10⁷ nm² were considered.
Pore-area size distribution analyses on the Boom Clay samples from the Mol-1 borehole; data reworked from Hemes et al. (Reference Hemes, Desbois, Urai, De Craen, Honty, Craen and Craen2013). Left: Normalised pore-size frequencies and contributions to total segmented porosities (Cttp (%)). Right: Power-law distributions of pore-area sizes, within the clay matrix only.

Existing studies on pore-size distributions of the Ypresian clays include SEM-image analyses as well as MIP (Nguyen et al., Reference Nguyen, Cui, Tang, Li and Wouters2014). They report either mono- or bi-modal pore-size distributions. Mono-modal pore-size frequency distributions show a peak at ~800 nm pore diameter, corresponding to a minimum equivalent pore area of ~5 × 10⁵ nm2, within the meso-pore regime. These frequency distributions are characteristic of fabrics dominated by silty grains, referred to as aggregate-type microstructures (Nguyen et al., Reference Nguyen, Cui, Tang, Li and Wouters2014). Bi-modal pore-size frequency distributions were reported for clay-matrix dominated microstructures, with a first peak occurring at ~60 nm pore diameter (micro-pore family), corresponding to a minimum equivalent pore area of ~2.8 × 10³ nm2, and a secondary peak observed at ~250 nm pore diameter (meso-pore family), corresponding to a minimum equivalent pore area of ~1 × 10⁵ nm2. However, primary peaks in bi-modal porosity distributions, for example as measured by Nguyen et al. (Reference Nguyen, Cui, Tang, Li and Wouters2014), are below the PPRs and therefore not fully accessible in the present study.
Pores within the clay matrix follow power-law pore-area distributions over a range between the PPR and the largest pores observed within the clay matrix (~1 × 10⁷ nm2 pore area; Figs 11 and 12). This suggests a self-similar behaviour of porosity within the clay matrix of the Ypresian clays. Power-law pore-size distributions and self-similarity of observed microstructures hint towards the possibility of up-scaling of the results to larger scale (micro-) structural features of the Ypresian clays. Power-law distributions of pore-area sizes have also been reported for the Boom Clay (Hemes et al., Reference Hemes, Desbois, Urai, De Craen, Honty, Craen and Craen2013; Fig. 14) and the Opalinus Clay (Houben et al., Reference Houben, Desbois and Urai2013, Reference Houben, Desbois and Urai2014a), as well as for several fine-grained oil and gas shale samples (Klaver et al., Reference Klaver, Desbois, Urai and Littke2012, Reference Klaver, Desbois, Littke and Urai2015b).
Power-law exponents found for the Boom Clay and Ypresian clays are comparable within the 95% confidence bounds (Fig. 13), suggesting similar microstructures and physical properties. Morphologically, pore types found within the clay matrix of the Ypresian clays are similar to those found in the Boom Clay, for example by Desbois et al. (Reference Desbois, Urai and Kukla2009) and Hemes et al. (Reference Hemes, Desbois, Urai, De Craen, Honty, Craen and Craen2013), where pore types are controlled by the impingement of adjacent clay aggregates: ‘elongated “type I pores” are found in between similarly oriented sheets of clay’ (Desbois et al., Reference Desbois, Urai and Kukla2009) and ‘crescent-shaped “type II pores” in saddle-reefs of folded clay sheet’ (Desbois et al., Reference Desbois, Urai and Kukla2009). These pores show typical sizes (areas) below 1 × 10⁶ to 1 × 10⁷ nm² in the Ypresian clays. Moreover, ‘type III pores’ in clay, after Desbois et al. (Reference Desbois, Urai and Kukla2009) and Hemes et al. (Reference Hemes, Desbois, Urai, De Craen, Honty, Craen and Craen2013), were observed and identified, which can be described as ‘large jagged pores in the strain shadows of clasts’ (Desbois et al., Reference Desbois, Urai and Kukla2009), with axial ratios usually >2.
Larger ‘type III pores’ in clay occur preferentially at the boundaries between clay-matrix and NCM – mostly quartz – grains and are therefore classified as inter-aggregate pores, with typical sizes above 1 × 10⁶ to 1 × 10⁷ nm² pore area.
For the coarse-grained Ypresian clay samples (8a, 60a and 86c), we found a significant difference in pore shapes within the clay matrix, that is, pores of ‘type I’ and ‘type II’ show very low axial ratios (<2), circular pore shapes and sizes usually <3 × 10⁴ nm² pore area (Fig. 8C). ‘Type III’ (inter-aggregate) pores in clay show very smooth, rounded pore boundaries (Figs 2, 5, 6 and 9) and can be very large, up to ~5 × 10⁹ nm² pore area.
Based on these results, we infer that a higher content of NCMs causes a switch from a clay-matrix supported to a NCM grain-supported fabric. This leads to less compaction of the clay matrix and is also in agreement with the bedding parallel preferred orientation of the pores’ longest axes in fine-grained, clay-rich Boom Clay (Hemes et al., Reference Hemes, Desbois, Urai, De Craen, Honty, Craen and Craen2013), which is absent in the Ypresian clay samples. The effect of NCMs controlling the pore space within and the microstructures of the clay matrix has also been reported in recent studies by Bobko and Ulm (Reference Bobko and Ulm2008), Hemes et al. (Reference Hemes, Desbois, Urai, De Craen, Honty, Craen and Craen2013), Houben et al. (Reference Houben, Desbois and Urai2014a), Keller et al. (Reference Keller2015) and Philipp et al. (submitted).
Pore-space connectivity and relevance of the inter-aggregate pores in the Ypresian clays
Although WMI reveals that all pores, including the pores within the clay matrix as well as larger inter-aggregates pores, are mutually connected at a maximum WM entry pressure of 156 MPa, corresponding to accessible pore-throat diameters of ~10 nm, X-ray µ-CT and focused ion beam milling (FIB)-SEM tomography are suggested to solve the question of whether large inter-aggregate pores are directly connected to each other or via much smaller pore throats within the clay matrix, as has been reported for a fine-grained, clay-rich Boom Clay sample, analysed by Hemes et al. (Reference Hemes, Desbois, Urai, Schröppel and Schwarz2015).
The origin of the large inter-aggregate pores still remains unclear, although they contribute significantly to the total observed porosity and may provide preferential pathways for fluid flow. We therefore suggest that the frequent occurrence of larger NCM grains within a sample's fabric favors an increase in permeability. We recommend checking this hypothesis by measuring permeability together with the grain-size distribution and mineralogy of a sample. The large inter-aggregate pores are systematically located at the interfaces between NCM grains and the clay matrix. Moreover, the size and occurrence of the large inter-aggregate pores correlates with the size and occurrence of the NCM grains within the same sample. We observed a correlation between the contribution of large inter-aggregate pores to the total BIB-SEM observed porosity (Cttp) and the NCM content of a sample, as measured by XRD (Table 1 and Fig. 15). Such a correlation has already been described and hypothesised for the Boom Clay (Hemes et al., Reference Hemes, Desbois, Urai, De Craen, Honty, Craen and Craen2013) and for the Opalinus Clay (Keller, Reference Keller2015; Philipp et al., submitted). Another characteristic of the large inter-aggregate pores is their coating by a very low porous, thin clay layer (Fig. 9). The presence of these clay coatings at larger inter-aggregates pores suggests that they are not originating from drying or de-compaction damages, but are part of the preserved natural clay fabric. The origin of the clay coatings remains unknown to date. The clay coatings may correspond to secondary clay minerals, precipitated from the interaction of original clay minerals, quartz and/or feldspar grains with non-equilibrated pore waters. Since clay coatings are not observed within the clay matrix, we suggest that large inter-aggregate pores are directly connected to each other, possibly forming the main pathway for fluid flow and transport within a sample.
Contribution of largest inter-aggregate pores (>1 × 10⁷ nm²) to the total BIB-SEM observed porosity (%), as a function of NCM content (dry wt%) for Ypresian clay samples from this contribution, as well as the Boom Clay samples, analysed by Hemes et al. (Reference Hemes, Desbois, Urai, De Craen, Honty, Craen and Craen2013).

Conclusions
BIB-SEM microstructural and in particular porosity analyses on six Ypresian clay samples from the ON-Kallo-1 borehole, within representative elementary areas (REAs) of BIB cross-sections, show microstructures and pore-space morphologies comparable to the Boom Clay (Hemes et al., Reference Hemes, Desbois, Urai, De Craen, Honty, Craen and Craen2013) for the fine-grained Ypresian clay samples analysed. However, different microstructural arrangements were observed for the more coarse-grained YPRC samples: (1) grain- and pore-area sizes as well as porosity distributions of the coarse-grained, NCM-rich samples are shifted towards larger values and (2) no bedding parallel alignment of the clay minerals was observed, possibly prevented by the higher NCM contents and larger grain sizes. Large inter-aggregate pores contribute significantly to the total BIB-SEM observed porosities, with their contributions to the total resolved porosity increasing linearly with increasing sample grain size and NCM content. Moreover, the preferred occurrence of the largest inter-aggregate pores at NCM–clay matrix interfaces is thought to play a significant role once these large pores are directly connected to each other, controlling the overall pore-space connectivity and affecting the permeability of the material.
Pore-area size distributions within the clay matrix of the Ypresian clays follow power laws, with comparable power-law exponents D and logC values to the Boom Clay (Hemes et al., Reference Hemes, Desbois, Urai, De Craen, Honty, Craen and Craen2013), suggesting similar microstructures and pore-space morphologies within the clay matrix of these samples.
WMI on an Ypresian clay sample shows a very high overall connectivity of the pore space, down to 10 nm pore-throat diameter, comparable to results found for the Boom Clay (Hemes et al., Reference Hemes, Desbois, Urai, Schröppel and Schwarz2015).
Acknowledgements
We would like to thank ONDRAF/NIRAS for providing the samples, financial support and XRD data (Qmineral Analysis and Consulting, Heverlee, Belgium).
Supplementary material
To view supplementary material for this article, please visit http://dx.doi.org/10.1017/njg.2016.16


 Open access