


In 2014, at the age of 88, Representative John D. Dingell, Jr. (D-MI) announced his retirement, having served for thirty terms to become the longest-serving member of the U.S. Congress in history. Although Dingell's case is extreme, many members of the U.S. Congress enjoy long legislative careers, as do many members of the British House of Commons. On the other hand, under similar electoral rules, incumbents in India's Lok Sabha have routinely been defeated in droves.
Incumbency can be a powerful factor in legislative politics but its impact is far from universal. What accounts for this large variation in re-election rates? Studies of US congressional politics have ascribed the high success rate of incumbents to strong re-election efforts, coupled with favourable legislative resources (for example, Mayhew Reference Mayhew1974). The re-election motive is likely prominent elsewhere as well. However if this motive provided a full explanation, we should observe high incumbent re-election rates (or put simply: ‘incumbency rates’) across democratically elected assemblies. And yet significant exceptions, such as India, pose a puzzle: if incumbent legislators generally strive to be re-elected, why do they so often fail?
The Mayhewian perspective may focus excessively on the ‘supply side’ of politics, whereas we believe the ‘demand side’ of voter preferences also matters. Unless voters trust their legislators to act in ways that will benefit the public and not just themselves, legislative perquisites may not help incumbents. Hence, cross-nationally, we suggest that the impact of legislative resources on incumbency rates may be constrained by trust-reducing conditions such as political corruption.
We test our propositions using OLS and instrumental variable (IV) regression and two sets of original data. The first set captures legislative incumbency rates for elections held in the sixty-eight most populous democracies globally between 2000 and 2018 – adding more than forty countries not included in previous studies of legislative incumbency (Gouglas, Maddens, and Brans Reference Gouglas, Maddens and Brans2017; Matland and Studlar Reference Matland and Studlar2004). Our second original dataset captures legislative resources such as the size of legislative staff, committee system features, and member salaries and allowances for these sixty-eight democracies.
We find that legislative resources can indeed benefit incumbents but only when voters can have reasonable confidence in their representatives, such as under modest levels of political corruption. By contrast, in more corrupt countries our results suggest that such resources can, instead, increase the likelihood that voters will replace their representatives in the next election.
Legislatures and Incumbency
Most research on legislative incumbency has focused on the US, demonstrating not only that US incumbency rates are high but also that important consequences follow. Thus, Fiorina (Reference Fiorina1977, 77) observes that ‘policy change in the Congress results more from the replacement of incumbents than from changes in their behavior.’ Recently political scientists have begun to explore incumbency rates in other countries (for example, Ariga Reference Ariga2015; Fiva and Smith Reference Fiva and Smith2018; Klašnja and Titiunik Reference Klašnja and Titiunik2017; Redmond and Regan Reference Redmond and Regan2015; Uppal Reference Uppal2009; and Moral, Ozen, and Tokdemir Reference Moral, Ozen and Tokdemir2015). Yet, cross-national research still struggles to piece together this new knowledge. Different studies measure the rate of incumbency differently and cannot reliably be aggregated. Moreover, the relative dearth of cross-national research complicates efforts to understand the impact of political institutions, which vary mainly cross-nationally.
There are two notable cross-national exceptions. Matland and Studlar (Reference Matland and Studlar2004) investigated legislative turnover in twenty-five advanced industrial democracies (1979–94), finding that turnover rates are affected by the electoral system, electoral volatility, the time elapsed since the previous election, and the age of democracy. In a study covering 1945–2015, but limited to eight Western European countries, Gouglas, Maddens, and Brans (Reference Gouglas, Maddens and Brans2017) argue that political career opportunities (for example, MPs' salaries and alternative political offices) are the most important determinant of turnover rates, followed by electoral volatility and party characteristics. Yet, both studies focus on OECD countries and neither identifies as possible causal factors internal legislative organization (other than bicameralism) and, specifically, vote-winning legislative perquisites. Nor do they consider how legislative resources may interact with voter preferences.
Comparing Incumbency Rates
We examine the variation in incumbency rates among the world's sixty-eight democracies (defined using Polity scores) with a population over four million. For each country, we generated legislative incumbency re-election data from 2000 or since the country became democratic, whichever is the most recent, through to 2018. We first construct a list of members of the lower or unicameral chamber of parliament (MPs) at the beginning of each ‘new’ parliament (the members taking office immediately following a general election).Footnote 1 We calculate their re-election rate (the incumbency rate) in the next general election as follows:
 $${\rm Incumbency\;Rat}{\rm e}_{it} = \displaystyle{{\mathop \sum \nolimits ( {MPs_t\;{\rm who\;were\;also}\;MPs_{t-1}} ) } \over {\mathop \sum \nolimits MPs_t}} \times 100$$
where i is the chamber in question, time t is the beginning of the parliamentary session following a general election, and time t-1 is the beginning of the parliamentary session following the previous general election.Footnote 2
The challenge of generating legislative membership lists varies dramatically. In some cases we have relied on existing country datasets or cross-national data collections such as the Constituency Level Elections Archive (CLEA).Footnote 3 For many countries, however, membership lists for each legislative term are not accessible in a suitable format and parliamentary websites are often incomplete. Therefore, we used web-scraping techniques to tap a wide variety of electoral sources such as the records of national electoral commissions. We also accessed websites that preserved historical versions of parliamentary websites in digital archives, such as the Internet Archive project.Footnote 4 In still other cases, we started from the records of every member who served in a given parliamentary session and then scraped the web for information on those who entered mid-term (via appointment or by by-election) to derive a membership list as of the beginning of the term.
Our target sample across our sixty-eight democracies consists of 301 elections. Through extensive data collection efforts, we have been able to collect incumbency rates for 288 of these elections (96 per cent). This corresponds to over 95,000 observations (where an observation is a member-term dyad) and more than 55,000 unique legislators. Table A1 provides a full list of the elections in our dataset.
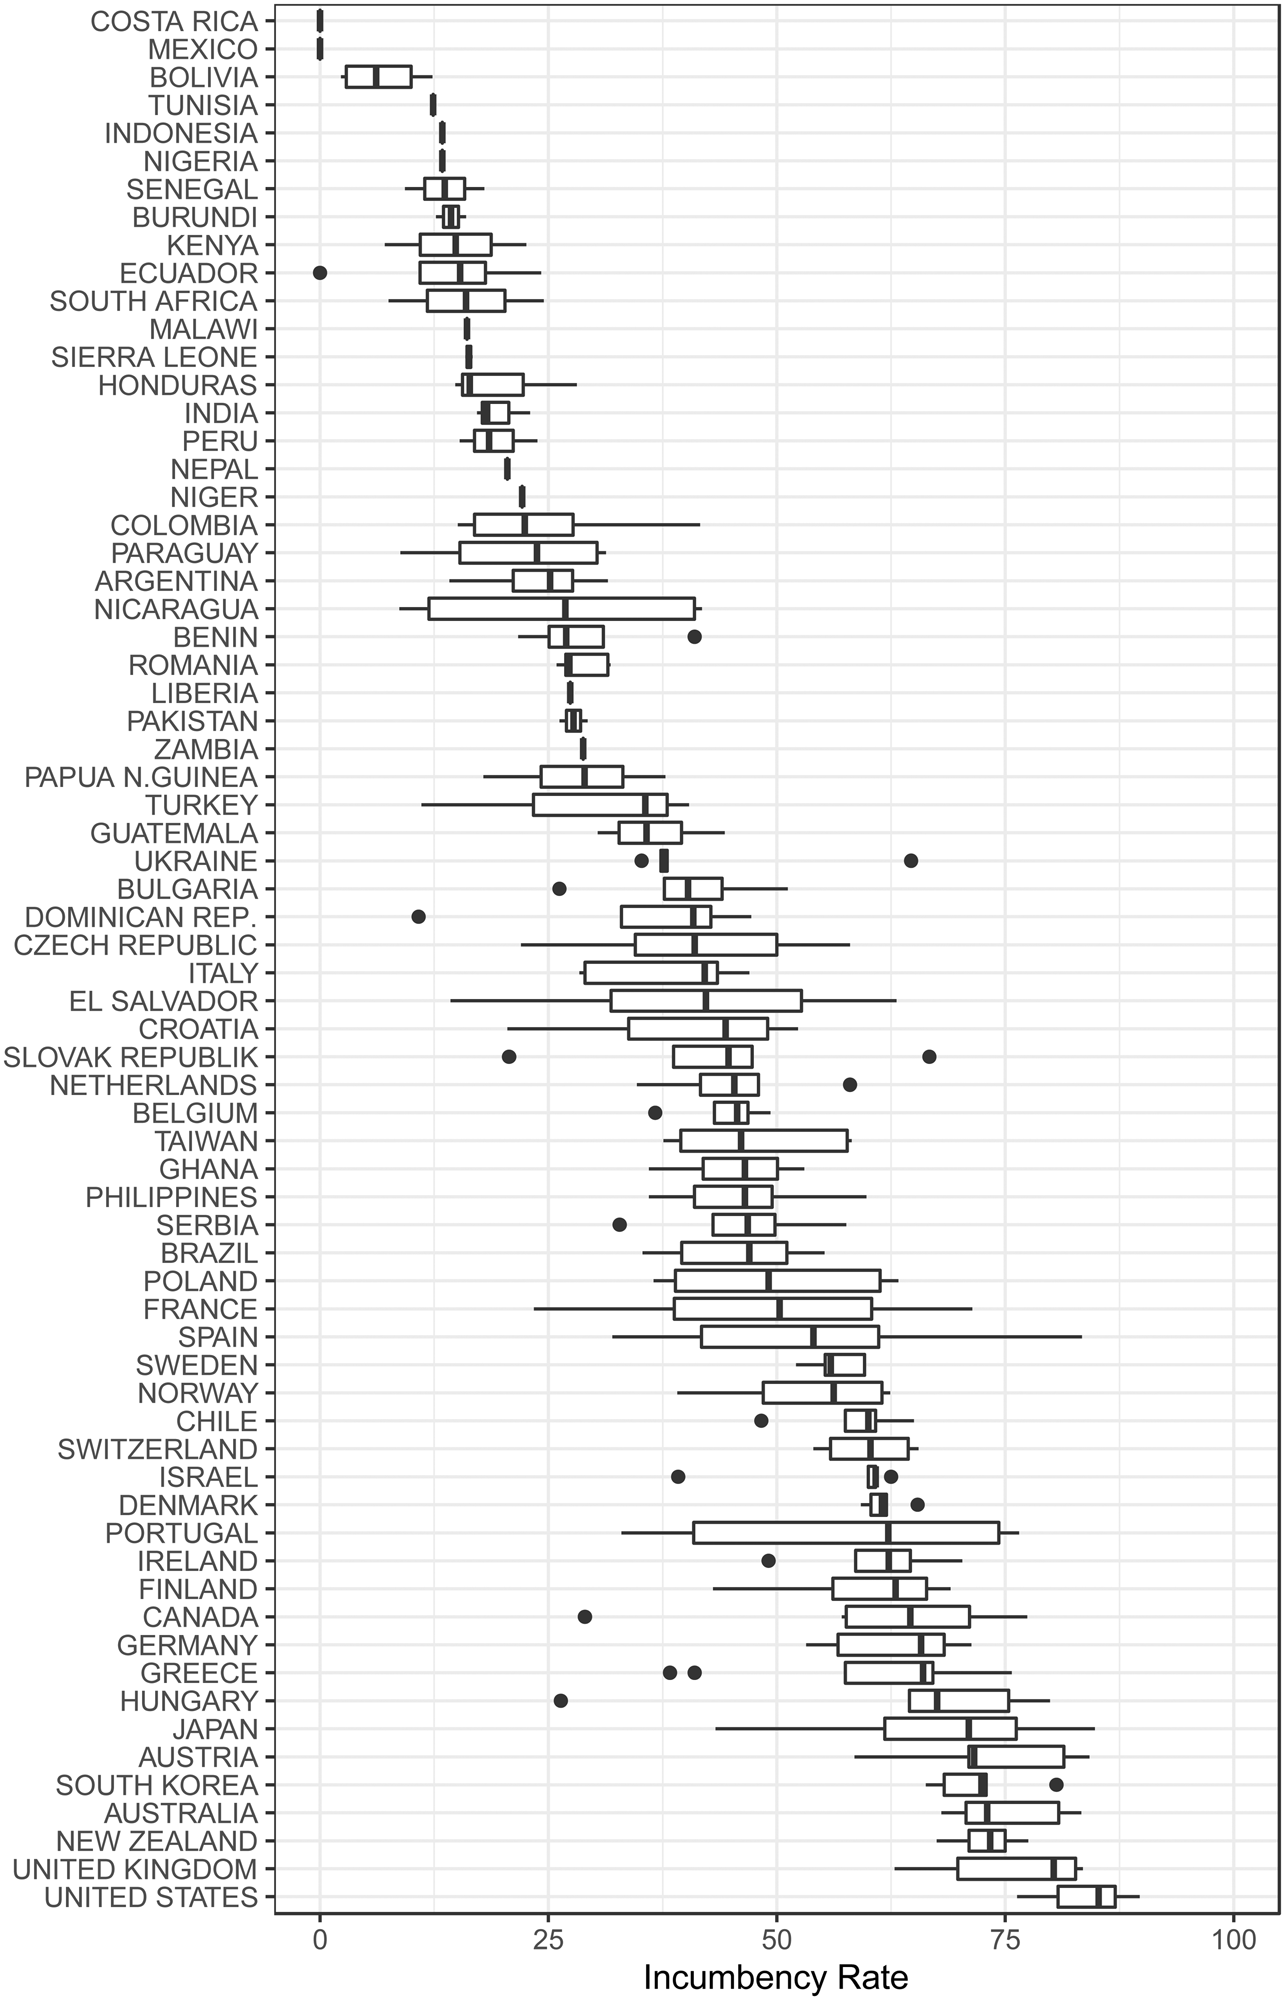
Figure 1 provides a box plot showing the incumbency rates for each of our sixty-eight democracies. Note the large cross-national variation, from a 0 per cent median incumbency rate in Mexico and Costa Rica to more than 80 per cent in the US. Between these extremes, we find a global mean and median incumbency rate of just over 44 per cent. Apart from countries with term limits, our observations are quite evenly distributed between the teens and the low 70s. Only the US and the UK have a median incumbency rate above the latter figure.
Incumbency rates in sixty-eight democracies (2000–2018).
Note: See Table A1 for elections included in our analysis.
Legislative Resources, Corruption, and Incumbency
Some legislatures allow members to use their perquisites of office to maximize electoral success. We believe that a variation in incumbency rates may reflect the set of institutional powers, privileges, and endowments available to incumbents. Such organizational resources may enhance the re-election prospects of legislators, often by helping them meet the cost of running or influencing their constituents.
Mayhew's (Reference Mayhew1974) foundational work contends that many of these favourable conditions are due to the internal organization of the U.S. Congress, in which members are endowed with electorally valuable resources. These properties include powerful committees that facilitate ‘pork-barrel’ politics (Mayhew Reference Mayhew1974, 85–91), opportunities for legislative advertising, position taking, credit claiming (Mayhew Reference Mayhew1974, 49–73), personalized control over campaign finance (Mayhew Reference Mayhew1974, 41), and generous staffing and remuneration schemes (Mayhew Reference Mayhew1974, 84). Mayhew (Reference Mayhew1974, 81–82) suggests that these institutional features enhance incumbency rates and limit turnover. Mayhew's argument also implies that alternative forms of legislative organization – where power and resources are shifted from individual legislators to party leaders – may hamper individual members' re-election pursuits (Mayhew Reference Mayhew1974, 19–24).
More specifically, we expect incumbency rates to correlate positively with the size of the legislative staff (which can be useful in building a personal vote), with members' access to legislative committees (which can generate benefits for constituents and affected interests), and with their legislative remuneration schemes. Such legislative resources help incumbents make themselves known to voters, present their messages, and respond to the voters' concerns. In sum, all else being equal,
H1: Incumbency rates will be positively associated with the legislative resources available to incumbent legislators.
However, we also believe that in their judgements of political incumbents, voters will be guided by their trust in the political system, for which our proxy is the level of perceived political corruption. Incumbents seeking re-election may not be advantaged when voters are sceptical about their public spiritedness. Voters may have ample reason to harbour such doubts in polities plagued by a high level of political corruption.
Existing studies suggest that rampant political corruption disadvantages incumbents (Klašnja Reference Klašnja2015; Klašnja and Titiunik Reference Klašnja and Titiunik2017). For example, when examining the effect of spending audits on mayoral elections in Brazil, Ferraz and Finan (Reference Ferraz and Finan2008, 705) find that ‘voters not only care about corruption, but once empowered with the information, update their prior beliefs and punish corrupt politicians at the polls.’ Survey experimental evidence suggests a strong link between priming participants with information on corruption and reduced candidate support (Agerberg Reference Agerberg2020; Mares and Visconti Reference Mares and Visconti2019; Winters and Weitz-Shapiro Reference Winters and Weitz-Shapiro2013).Footnote 5 Klašnja (Reference Klašnja2015, 928) argues that ‘the returns from corruption increase over the course of an incumbent's tenure … Which forces voters to minimize corruption increase by replacing incumbents frequently.’ Hence,
H2: Incumbency rates will be negatively associated with the severity of political corruption.
Moreover, we expect legislative perquisites such as those identified by Mayhew to benefit incumbents more in countries where political corruption is relatively low. Voters are willing to reap the rewards of having an experienced incumbent (for example, where seniority enhances a legislator's ability to deliver preferred policies or benefits) but only where the resources available to incumbents benefit voters and not just the politician. When corruption is more prevalent, we expect that incumbents will abuse their powers and that voters, anticipating this, will try to deprive them of that opportunity. Thus, the willingness of voters to reward incumbents may be conditional on the level of political corruption. Specifically, therefore, we anticipate that,
H3: The positive association between legislative resources and incumbency rates will be stronger under lower levels of political corruption but weaker (and maybe even negative) under higher levels of corruption.
Method and Data
To test these propositions, we estimate linear regression models where the dependent variable is the incumbency rate for each observed national election. We first present our OLS results and then employ IV regression to address endogeneity concerns and test the robustness of our findings.
Following Mayhew, we created a ‘legislative resources index’ that gave equal weight to four factors: (1) the size of the legislative staff (per member), (2) the number of permanent committees, (3) whether a member commonly serves on more than one such committee, and (4) the guaranteed minimum salary per member (divided by GNI per capita).Footnote 6 Each indicator varies substantially within our sample; for ease of comparison, we rescale each component from 0 to 1, add them together, and multiply the result by 25 to generate a 0–100 scale,Footnote 7 ranging from assemblies with relatively smaller staffs, lower salaries, and fewer committees (such as the Swiss National Council) to those with much larger staffs, higher salaries, and extensive committee systems (such as the U.S. House of Representatives).Footnote 8
For corruption, we rely on the Corruption Perceptions Index (CPI), published by Transparency International (TI), which assigns each country an annual score ranging from 0 (extremely corrupt) to 100 (extremely clean). To make our Corruption Index easier to interpret, we reverse the TI scale such that higher index values indicate more corruption.
To prevent countries with term limits from biasing our analyses, we excluded Mexico, Bolivia, Costa Rica, Ecuador, and the Philippines, which gives us a total of 262 elections in sixty-three democracies. We chose not to include country fixed effects, given that our independent variables do not vary greatly over time within countries, but we find similar results if fixed effects are included where possible (Table A4) or if we take the median values of variables and analyze the data at the country level (Table A5). Our fully specified models also control for whether a country has bicameral, presidential, and federal institutions; the extent to which the electoral system creates an incentive to cultivate a personal vote; GDP per capita; and GDP growth (Table A2).
Results
Table 1 shows the results of our regression analyses. In Models 1 and 2, we first find that our legislative resources index does not reach conventional levels of significance (H1). Thus, there is no clear evidence that resources such as a larger staff, more extensive committee systems, and higher salaries universally facilitate higher incumbency rates. In Table A6, we rerun the analyses for each of the four components of the legislative resources index and find similar null effects for each of them.
Legislative resources, corruption, and incumbency
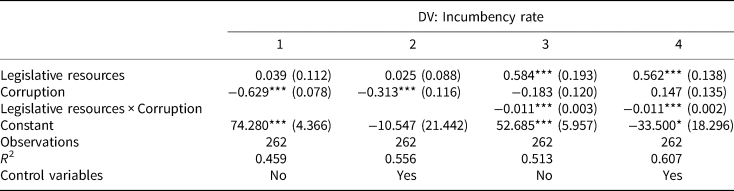
Note: Table 1 presents coefficients using OLS regression with standard errors in parentheses. Control variables include Bicameral, Presidential, Federal, Incentive to Cultivate a Personal Vote, GDP per Capita, and GDP Growth (Table A2). *p < 0.1, **p < 0.05, ***p < 0.01.
By contrast, Models 1 and 2 provide strong indications that voter demand matters. As predicted, incumbents are significantly more likely to hold onto their seats in countries with less corruption (H2).Footnote 9 Moreover, Table A4 shows that the effects of corruption hold, even with the inclusion of the country and year fixed effects. This suggests that incumbency rates are also sensitive to within-country changes over time: when countries reduce corruption, their incumbency rates rise.
Finally, the electoral effect of legislative resources indeed depends on Corruption levels (H3). The Legislative Resources × Corruption interaction term is negative and significant in Models 3 and 4.Footnote 10 Consistent with our hypothesis, legislative resources have a stronger, more positive effect on incumbency re-election rates under relatively low levels of political corruption.
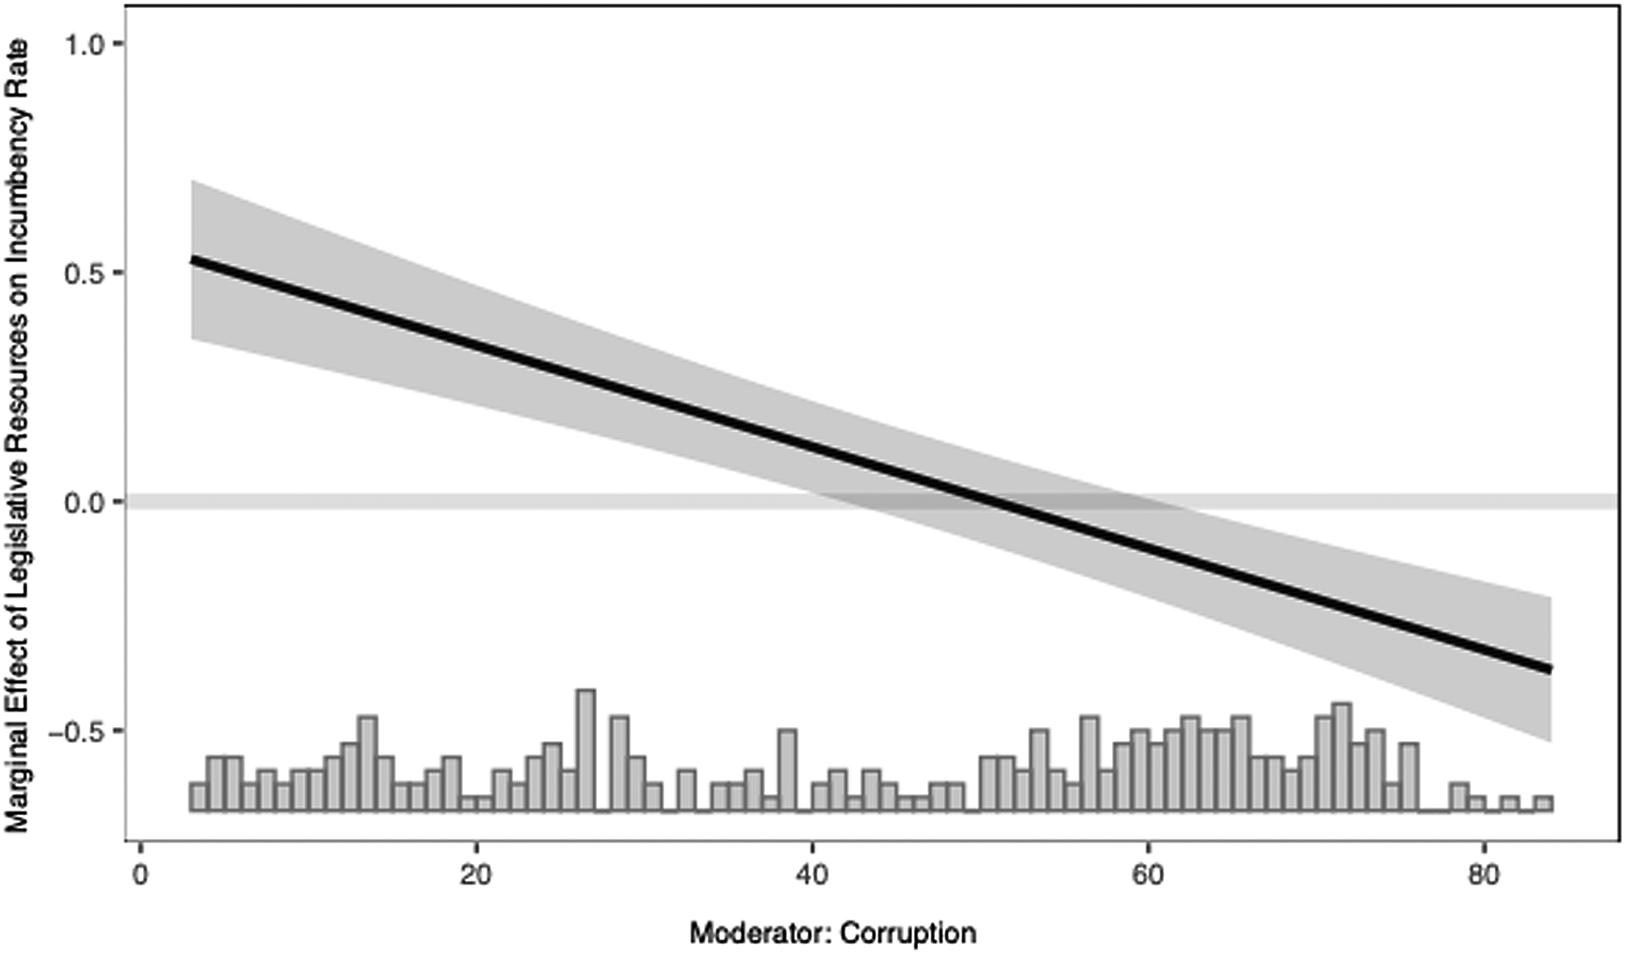
To better capture the relationship between legislative resources and incumbency across different levels of corruption, Fig. 2 provides a marginal effects plot.Footnote 11 For countries with exceptionally clean governments, such as Denmark or New Zealand (median Corruption: 6), we find that a one standard deviation increase in legislative resources (19.2 points on our index scale) would increase the incumbency rate by about 9.5 percentage points. For more corrupt countries, such as Nigeria and Ukraine (median Corruption: 74), the estimated marginal effect is negative and suggests that a similar increase in legislative resources would, instead, decrease the incumbency rate by about 4.9 percentage points.
Marginal effect of legislative resources on incumbency by corruption level.
Note: Figure presents marginal effects plot using OLS regression with controls for Bicameral, Presidential, Federal, Incentive to Cultivate a Personal Vote, GDP per Capita, and GDP Growth (Model 4 in Table 1, see also Table A2). The plot is created using the interflex R package (Hainmueller, Mummolo, and Xu Reference Hainmueller, Mummolo and Xu2019).
Addressing Endogeneity
While these initial results support H2 and H3 (but not H1), testing the direction of causality presents some inferential challenges. It is possible that higher incumbency rates could influence the availability of legislative resources, or some other unobserved factor could drive both legislative resources and incumbency rates. Both reciprocal causation and confounding thus pose analytical challenges.
To address these endogeneity concerns, we instrument for legislative resources using the word counts of sections within national constitutions that describe the lower or unicameral legislative chamber. We expect that longer legislative sections are more likely to contain provisions concerning institutional powers and resources that can benefit incumbent legislators. However, this relationship may not necessarily be linear since, at some point, more verbose constitutions may constrain the discretion of legislators rather than empower them (for example, Huber and Shipan Reference Huber and Shipan2002). We thus follow Rooney (Reference Rooney2019) in modelling the instrument's relationship with the endogenous variable while looking for potential non-linearities.
We construct our instrument by drawing on the English-language constitutions provided by the Comparative Constitutions Project, which covers all sixty-eight countries.Footnote 12 We count the number of words in each country's constitution that discuss the structure or powers of the lower (or unicameral) legislative chamber and take the natural logarithm of this number, given the skew of the word-count data. As an initial validation of this measure, we find that constitutions with longer legislative sections are significantly more likely to elaborate the oversight authority of standing committees and give the legislature, rather than other actors, authority to determine members' compensation. In the Appendix, we further find a significant, linear relationship between this measure and our legislative resources index, with no evidence of non-linearities (Figure A4). In Table 2, we hence use legislative word count as an instrument for Legislative Resources.Footnote 13
Legislative resources, corruption, and incumbency (IV analyses)

Note: Table presents second-stage coefficients using instrumental variable (IV) regression with standard errors in parentheses. Control variables include Bicameral, Presidential, Federal, Incentive to Cultivate a Personal Vote, GDP per Capita, and GDP Growth (Table A2). *p < 0.1, **p < 0.05, ***p < 0.01.
An IV approach can enable causal identification so long as our instrument (Legislative Word Count) is sufficiently correlated with the endogenous variable (Legislative Resources) and only influences the dependent variable (Incumbency Rates) through its effect on that same endogenous variable. Our word-count measure satisfies both criteria. First, the F-statistic (21.4) from the first stage of our two-stage least squares regression exceeds the commonly accepted threshold of 10, suggesting that weak identification is not a problem. Second, there is no obvious alternative pathway through which the number of words describing a country's legislature could affect incumbency rates that do not involve the structure or powers of the legislature. Moreover, most of the constitutions in our sample were written before our period of analysis and few have had their legislative sections revised, making reverse causality unlikely. In sum, our word-count measure is plausibly exogenous, making it a good instrument for Legislative Resources.
Ultimately, our IV analysis (Table 2) generates results similar to our earlier OLS models: the presence of greater legislative resources can boost incumbency rates, but only in countries with lower levels of corruption. This consistent evidence gives us further confidence in our expectations regarding the link between legislative resources, corruption, and incumbency.
Conclusion
In a Schumpeterian view, electoral competition keeps politicians on their toes and responsive to their constituents. Competition limits rent-seeking and abuses of power, and brings about political innovation. In a world of perfect electoral competition we would expect tightly contested elections and frequent alternations in office. Yet, legislators in many countries and, notably, the US, seem to defy electoral competition and build impressive re-election records, and existing scholarship suggests that ample legislative resources can significantly help them do so. Our ambition here has been to examine the electoral rewards from incumbency globally across a broad range of sixty-eight democracies.
The strong interaction between legislative resources and corruption in our analysis suggests that political ‘engineering’ has its limits. Legislative incumbents can indeed be vested with powers and perquisites that contribute to their political longevity, but only as long as most citizens have reason to believe that such resources will be used for the public good rather than in corrupt, ineffective, or self-serving ways. While this lesson may be sobering for political incumbents, it is one for which ordinary citizens have at least a qualified reason to cheer.
Supplementary material
Online appendices are available at https://doi.org/10.1017/S0007123423000108.
Data availability statement
Replication Data for this article can be found in Harvard Dataverse at: https://doi.org/10.7910/DVN/AY7TU6.
Acknowledgements
We would like to thank Agustina Paglayan, Cameron Sells, Daniel M. Smith, and attendees at our panel at the 2018 APSA Annual Meeting for their feedback on earlier drafts. Additionally, we are grateful to Claire Adida, Rudy Andeweg, Audrey André, Kathryn Baragwanath-Vogel, Nathan Batto, Jonathan Boston, Mónica Buitrago, John Carey, Francesco Cavatorta, Gertrude Chebet, Mihail Chiru, Kendra Dupuy, Luis Estrada, Jorge Fernandes, Bonnie Field, Andréa Freitas, Ömer Gençkaya, Reuven Hazan, Alice Kang, Catherina Lena Kelly, Phil Larkin, Don Lee, Fernando Limongi, Lukas Linek, Saeed Ahmad Maitla, Wolfgang C. Müller, Lia Nijzink, Tamaki Ohmura, Anja Osei, Susan Ostermann, Nandini Patel, Duncan Pickard, Juan Munoz-Portillo, Tapio Raunio, Irene Ristic, Olivier Rozenberg, Omar Rubiera, Federico Russo, Marek Rybar, Sebastian Saiegh, Jose Carlos Sanabria, Ulrich Sieberer, Frank Thames, Devesh Tiwari, Sarah Whitmore, Terence Wood, Nikoleta Yordanova, Charlotte Zell, and Radoslaw Zubek for their assistance with our data collection process.
Financial Support
We gratefully acknowledge financial support from the Academic Senate of the University of California, San Diego, and the Department of Government's Research Promotion Fund at the University of Essex.
Conflicts of Interest
None.


 Open access