


In previous chapters, we have shown that hot spots of crime are not just hot spots of crime. These places are also hot spots of concentrated disadvantage, social and physical disorder, and other social problems. In this chapter, we ask whether hot spots of crime are also hot spots of health problems. Are people who live in crime hot spots more likely to be diagnosed with diseases such as asthma, diabetes, high blood pressure, heart disease, lung disease, arthritis, or cancer? Are they more likely to say that their overall health status is poor? Are their daily lives impacted more by health problems? Are they more likely to experience symptoms of mental health problems such as depression and post-traumatic stress disorder (PTSD)? Finally, do they attribute their health problems to living in a crime hot spot?
The health conditions of residents in these crime hot spots constitute another critical dimension in understanding the broader social context of hot spots of crime. Since the early 1990s, there has been a renewed recognition of the significant role that place plays in shaping people’s health (Macintyre et al., Reference Macintyre, Ellaway and Cummins2002). Contextual or neighborhood influences are now acknowledged as crucial determinants in the distribution of health and disease. For instance, the social determinants of health framework indicates that inequalities in social-economic resources and residential segregation by race and ethnicity lead to neighborhood physical and social characteristics that alter individual behavioral (e.g., lack of physical activity or unhealthy eating behavior) and mental processes (e.g., depression or anxiety), which, in turn, affect health outcomes (Braveman et al., Reference Braveman, Egerter and Williams2011; Diez Roux and Mair, Reference Diez Roux and Mair2010; Chen and Miller, Reference Chen and Miller2013).
While the idea that meso- and macro-geographic areas can influence health outcomes is increasingly recognized as an important area of study, we know of little research that has examined the relationship between hot spots of crime and physical and mental health.Footnote 1 That is the focus of this chapter, where we examine how crime on the street relates to individual health outcomes. Beyond describing health outcomes on street segments in our sample, we also try to identify whether observed health problems are potentially the result of living on a hot spot street, as contrasted with health problems that result from the selection of residents to that street. Hot spots of crime are places of significant concentrated disadvantage, as we illustrated in Chapter 2. This means that people who are poor or disadvantaged naturally are selected to live on those streets, often because of economic disadvantage or social exclusion, such as residential segregation in cities (Diez and Mair, Reference Diez Roux and Mair2010). Being able to distinguish between hot spot streets as a cause of health problems, as opposed to a result of selection of specific types of residents to those streets, is extremely important as we seek to consider policies that might reduce health problems associated with crime hot spots.
Below we first provide a detailed overview of health outcomes across the different types of street segments studied. We assess whether residents of crime hot spots have more adverse health issues compared with residents living on street segments with little or no crime. We then examine whether those outcomes may be seen as a consequence of living in a crime hot spot.
7.1 Place and Health Outcomes
Previous studies at broader geographic scales, such as census tracts, have illustrated that urban areas with high concentrations of chronic diseases and elevated morbidity and mortality rates often overlap with areas where residents live with extremely high levels of crime and violence (Sampson, Reference Sampson2003). For instance, cardiovascular diseases, including hypertension and heart disease, are disproportionately prevalent in high-crime neighborhoods (Chaix, Reference Chaix2009). Chronic stress, driven by prolonged exposure to unsafe environments, may trigger sustained activation of the body’s stress response, leading to elevated cortisol levels, systemic inflammation, and other physiological changes that heighten the risk of cardiovascular disease (Browning et al., Reference Browning, Cagney and Iveniuk2012; McEwen, Reference McEwen1998; Theall et al., Reference Theall, Drury and Shirtcliff2012).
Similarly, obesity and diabetes are more common in high crime or disorder neighborhoods due to interconnected factors, including limited access to fresh, nutritious foods and reduced opportunities for physical activity caused by safety concerns in public spaces (Boardman et al., Reference Boardman, Saint Onge, Rogers and Denney2005; Chang et al., Reference Chang, Hillier and Mehta2009; Small et al., Reference Smalls, Gregory, Zoller and Egede2015). Hanigan et al. (Reference Hanigan, Heisler and Choi2020), for instance, suggest that over 60 percent of the relationship between crime and diabetes is mediated by physical inactivity. Limited access to healthcare facilities exacerbates these adverse health patterns. Many healthcare centers in high-crime neighborhoods are under-resourced, located far from residential areas, or viewed as unsafe by residents. These barriers create significant obstacles to preventive care and effective management of chronic diseases (Khazanchi et al., Reference Khazanchi, South, Cabrera, Winkelman and Vasan2024; Mohnen et al., Reference Mohnen, Schneider and Droomers2019; Tung et al., Reference Tung, Boyd, Lindau and Peek2018).
Respiratory illnesses, such as asthma, also demonstrate disproportionate prevalence in neighborhoods characterized by high crime rates (Cagney and Browning, Reference Cagney and Browning2004). For instance, Wright et al. (Reference Wright, Mitchell, Visness, Cohen, Stout, Evans and Gold2004) show that increased exposure to violence was associated with a higher number of symptom days and more nights of disrupted sleep for caretakers, with the effects following a graded pattern. Disadvantaged and marginalized urban neighborhoods with high crime rates often suffer from substandard housing conditions, including poor sanitation, crowding, inadequate ventilation, mold, pest infestations, and exposure to indoor pollutants, all of which are well-documented triggers for asthma attacks (Krieger and Higgins, Reference Krieger and Higgins2002). Chronic stress associated with living in high-crime environments has also been shown to further worsen asthma symptoms by increasing inflammation and compromising the body’s ability to manage chronic respiratory conditions effectively (Wright et al., Reference Wright, Rodriguez and Cohen1998).
Adverse mental health outcomes are another significant consequence of living in high-crime neighborhoods (Curry et al., Reference Curry, Latkin and Davey-Rothwell2008; Kim, Reference Kim2008; Latkin and Curry, Reference Latkin and Curry2003; Mair et al., Reference Mair, Diez Roux and Galea2008; Truong and Ma, Reference Truong and Ma2006; Zhang et al., Reference Zhang, Chen, McCubbin, McCubbin and Foley2011). Residents frequently exposed to crime and violence face heightened risk for PTSD, depression, and anxiety. Persistent fear of crime can result in chronic psychological distress, hypervigilance, and avoidance behaviors, which may manifest as social isolation and withdrawal from community spaces. Many residents restrict outdoor activities, avoid public areas, or delay seeking healthcare if healthcare facilities are perceived as unsafe. These avoidance behaviors, in turn, exacerbate both physical and mental health issues, creating a feedback loop of delayed diagnosis and inadequate treatment.
Substance use disorders represent yet another critical health outcome linked to high-crime urban environments (Stockdale et al., Reference Stockdale, Wells, Tang, Belen, Zhang and Sherbourne2007). For many residents, substance use becomes a coping mechanism for managing the chronic stress, trauma, and emotional toll of living in unsafe neighborhoods and a contributor to ongoing cycles of violence and health decline. Other significant health issues observed in high-crime neighborhoods include low infant birthweight (Ncube et al., Reference Ncube, Enquobahrie, Albert, Herrick and Burke2016) and higher mortality rates (Fang et al., Reference Fang, Madhaven, Bosworth and Alderman1998; Haan et al., Reference Haan, Kaplan and Camacho1987; Jackson et al., Reference Jackson, Anderson, Johnson and Sorlie2000; O’Campo et al., Reference O’Campo, Xue, Wang and Caughy1997). In brief, neighborhood crime levels represent an important risk factor in the development and persistence of numerous health problems (Akers and Lanier, Reference Akers and Lanier2009; Diez Roux and Mair, Reference Diez Roux and Mair2010; Link and Phelan, Reference Link and Phelan1995).
While the spatial overlap between high-crime neighborhoods and adverse health outcomes is well-documented, establishing a clear causal relationship remains a persistent methodological challenge (Ellen et al., Reference Ellen, Mijanovich and Dillman2001; Macintyre et al., Reference Macintyre, Ellaway and Cummins2002). The associations observed between crime, chronic diseases, mental health disorders, and other adverse health outcomes are often shaped by a complex interplay of shared structural determinants, including poverty, residential segregation, and broader socioeconomic inequalities. These factors create environments where both crime and poor health outcomes are more likely to co-occur, making it difficult to isolate the independent effects of crime and violence on health.
Much of the existing evidence comes from observational studies, which are effective at identifying correlations but not designed to establish causal relationships. This limitation is understandable because it is neither ethical nor feasible to randomly assign individuals to live in areas with varying levels of crime and observe the resulting health consequences. However, observational designs cannot fully account for unmeasured confounders or temporal sequencing. Additionally, the possibility of reverse causation cannot be overlooked. Poor health outcomes, whether physical, mental, or both, can limit individuals’ mobility, employment prospects, and housing options, effectively trapping them in high-crime neighborhoods and perpetuating cycles of disadvantage. Addressing these methodological challenges requires quasi-experimental designs or advanced statistical techniques, such as propensity score analysis (see later), to better understand the potential causal relationship linking crime and health outcomes.
To date, research examining the geographic overlap of crime/violence and health risks at the micro geographic level remains limited (Uding et al., Reference Uding, Porter, Dong and Moon2024). The few existing studies suggest that crime and violence influence physical activities, such as recreational use of parks and walkability, and the use of public space at the micro-place level (Deka et al., Reference Deka, Brown and Sinclair2018; Han et al., Reference Han, Cohen, Derose, Li and Williamson2018; Marquet et al., Reference Marquet, Hipp, Alberico, Huang, Fry, Mazak and Floyd2019). In addition, crime occurring near or even within one’s home may exert a more direct effect on health compared to crime occurring in other parts of a neighborhood. For instance, Weisburd et al. (Reference Weisburd2018), drawing from data collected in our study, found that residents living in violent crime hot spots reported significantly higher rates of depression and PTSD compared to those living on streets with lower crime levels. Dong et al. (Reference Dong, Morrison, Branas, Richmond and Wiebe2020), also relying on data from the present study, demonstrated that residents of violent crime hot spots reported lower self-rated general health and higher levels of health limitations and problems. This relationship was mediated by factors such as social cohesion, shared expectations of control, and trust in law enforcement, suggesting that neighborhood social dynamics can mitigate some of the health consequences of living in high crime areas.
Studies have also found that the built environment and different types of housing, such as multifamily homes and public housing, influence the interactions of residences, how people use space, and connectedness, which further relate to violence, how residences cope with violence, and health outcomes (Hagan et al., Reference Hagan, Hall, Mamo, Ramos and Dubbin2020; Wilkinson and Ortega-Alcázar, Reference Wilkinson and Ortega-Alcazar2019; Williams, Reference Williams2005). For example, Wilkinson and Ortega-Alcázar (Reference Wilkinson and Ortega-Alcazar2019) highlighted that shared housing arrangements can exacerbate vulnerability to victimization and contribute to negative mental health outcomes. Lastly, research has examined the role of vacant lots in urban areas and turning these into greenspaces that can reduce crime and violence, as well as improve health (Branas et al., Reference Branas, Cheney, MacDonald, Tam, Jackson and Ten Have2011; Kondo et al., Reference Kondo, Fluehr, McKeon and Branas2018; Kvit et al., Reference Kvit, Corrigan, Locke, Curriero and Mmari2022; South et al., Reference South, Kondo, Cheney and Branas2015; South et al., Reference South, Hohl, Kondo, MacDonald and Branas2018). One limitation of these studies is that while the intervention (i.e., “greening”) is focused at micro geographic places, the outcome measures of violence and health are often at larger macro-level units, so there is a “mismatch between the unit of analysis of the treatment in these cases and the unit of analysis for the studied outcomes” (Uding et al., Reference Uding, Porter, Dong and Moon2024, p. 4).
Significant gaps remain in our understanding of the intersection between crime, violence, and health risks at the micro geographic level. The scarcity of research on the intersection of crime/violence and health risks at the micro geographic level is partially due to the fact that health researchers and criminologists have focused more on neighborhood- or community-level impacts than micro geographic places, and that there has been limited availability of health risk data at a micro geographic level. Issues of confidentiality, especially in areas where specific health problems have very low base rates, present significant challenges in utilizing public health data from these small geographic units (Diez Roux, Reference Diez Roux2001; Uding et al., Reference Uding, Porter, Dong and Moon2024; Uding, Reference Uding and Weisburd2025; Weisburd and White, Reference Weisburd and White2019). Addressing these challenges requires innovative approaches to data collection and analysis – an area where our contribution to the literature lies.
7.2 Geographic Overlap of Crime and Health Risks
Our first research concern is whether there is a relationship between the types of street segments we examine and health risks. Are crime hot spots more likely to evidence physical and mental health problems? Which types of problems seem to be most concentrated in crime hot spots? As we noted at the outset, the fact that hot spots have greater health risks does not mean that the hot spot was a cause of those risks. It may, for example, be that the people selected into crime hot spots have preexisting disadvantages such as poverty or other forms of concentrated disadvantages, which are also correlated with poor health outcomes (see Diez Roux, Reference Roux2004; Diez Roux and Mair, Reference Diez Roux and Mair2010; Wheaton et al., Reference Wheaton, Nisenbaum, Glazier, Dunn and Chambers2015). We address this concern later in the chapter.
7.2.1 Physical Health
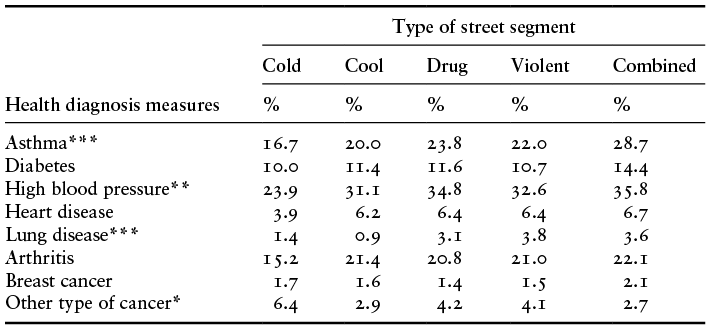
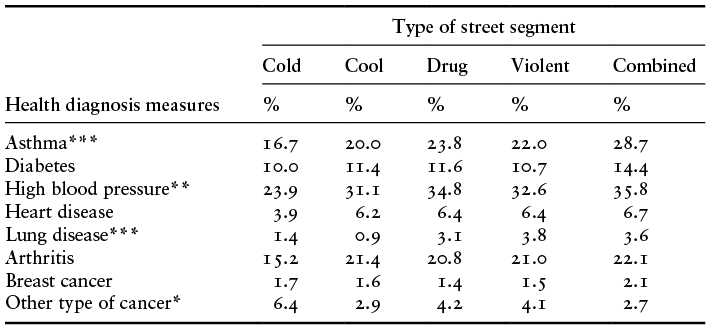
In our residential survey, participants were queried about their history of diagnoses concerning a variety of chronic health conditions. Table 7.1 displays a noticeable trend: residents living in crime hot spots, particularly those in the combined drug and violent crime hot spots, tend to report the highest degree of chronic disease diagnoses across the street types.Footnote 2 Conversely, residents on cold spot streets generally exhibit the lowest degree of such diagnoses.
Note:
* p < 0.05, **p < 0.01, ***p < 0.001; Ns are at the individual level and vary between 3,699 and 3,711 for the individual items.
The disparities in the diagnoses of asthma, lung disease, and high blood pressure are statistically significant. For asthma, residents of the combined hot spots have self-reported asthma rates 70 percent higher than those living on cold spots (p < 0.001). The other hot spots fall in between, with cool spots evidencing slightly lower rates than the hot spots. More generally, the self-reported asthma diagnosis rates for our streets are much higher than official statistics on asthma in the United States. At the launch of our study in 2012, official data indicated an adult lifetime asthma rate of approximately 13% (American Lung Association, 2024), compared to 22–29% of residents in our hot spots.
Chronic lung disease is relatively rare in our sample, but the rates differ significantly across the type of street segments (p < 0.001). Between 3% and 4% of the residents of crime hot spots report having been diagnosed with lung disease. This self-reported rate is lower than the estimated national rate of lung disease, which is about 14%. But consistent with our other findings, self-reported lung disease is much lower in the cold and cool spots. Fewer than 1.4 percent of residents of the cold and cool spots report suffering from lung disease.
The rate of self-reported high blood pressure in our sample is 50 percent higher in combined drug and violent crime hot spots than cold spots, and the overall difference across the groups is statistically significant (p < 0.01). In turn, the rates of other hot spots are close to those of the combined drug and violent crime hot spots. It is noteworthy that residents in the cool spots report a similar rate to those in the violent crime hot spots. In this case, the self-reported high blood pressure diagnosis rate is much lower than the estimated national rate for adults. On our streets, more generally, fewer than 40 percent of residents report high blood pressure, where about half of all American adults are reported to have high blood pressure (CDC, 2024b).
An inverse pattern emerges for cancer diagnoses for other types of cancer excluding breast cancer (p < 0.05). While 6.4% of residents of cold spots report being diagnosed with cancer at some point in their lifetime, this was true for only 2.7% of residents of combined hot spots, and about 4% of the residents in the other types of hot spots. Cool spots here are similar to hot spots. Cancer rates in the United States overall are higher, with 9.7% of adults having ever been diagnosed with cancer (CDC, 2024a). One reason for this seemingly contradictory health outcome for cold spot streets may be a matter of screening and detection, where residents of hot spots may receive lower quality of medical care than those who live on cold spot streets, and prevention is less prioritized. Our findings may be capturing some of these disparities. We found that residents of cold spots were more likely to have health insurance and more likely to report that they felt they have good access to doctors and medical care, though residents across all street types reported very high agreement with these items.Footnote 3
Overall, our data suggest that hot spots of crime are not only hot spots of crime, but also hot spots for the occurrence of a number of chronic diseases. At the same time, the overall rates of self-reported chronic diseases in our sample vary in different ways from national trends. In this regard, it is important to note that we did not randomly sample people in Baltimore, but rather randomly sampled different types of streets, and then randomly sampled individuals on those streets. This approach means that while it is reasonable to generalize differences between the populations of the different types of streets, we are constrained in drawing comparisons to Baltimore or national statistics on health.
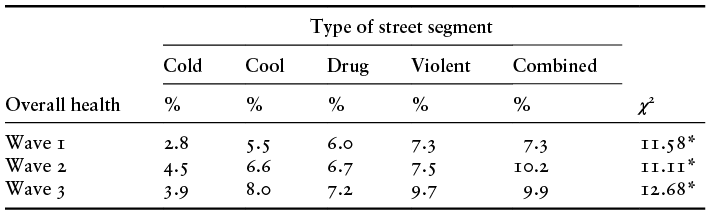
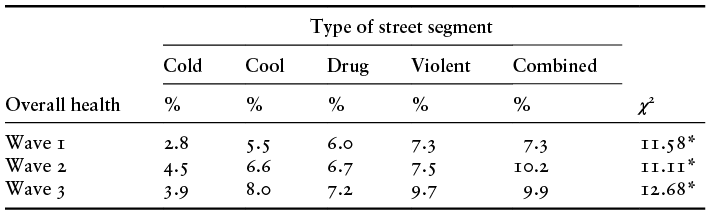
When we asked residents about their overall health, our results reinforce the finding that people who live in hot spots of crime have overall poorer health outcomes. We asked respondents to self-assess their overall health status, choosing from options including “very good,” “good,” “average,” “poor,” or “very poor.” Table 7.2 reports on the percentage of residents that report poor or very poor health status across the three waves of data collection, and shows that there are significant differences in self-reported overall health status across different street types (p < 0.05). A much higher percentage of residents living in crime hot spots indicated their health status as “very poor” or “poor.” This was true for between 6 and 10.2% of residents of crime hot spots. But fewer than 4.5% of residents of cold spots reported “very poor” or “poor” health status across the three waves of the survey. In this case, the cool spots are similar to the hot spots.
Note:
* p < 0.05; degree of freedom = 4; overall% for wave 1 = 6.1, overall% for wave 2 = 7.1, and overall% for wave 3 = 8.1; Ns at the individual level are 3,714 for wave 1, 3,590 for wave 2, and 3,120 for wave 3.
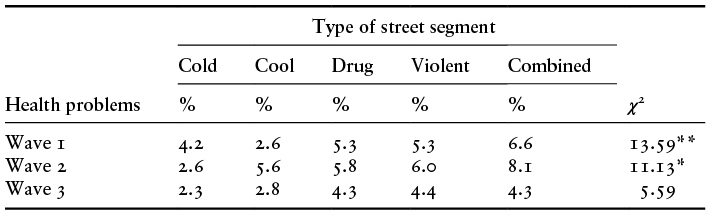
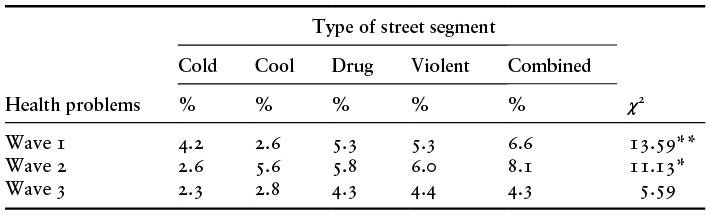
We thought it important also to see if residents made a connection between their health problems and living on their street. We asked them: “Do you think you have any health problems that have resulted from living on your current block?.” Table 7.3 reports that there are significant differences across the street types at wave 1 (p < 0.01) and wave 2 (p < 0.05), and the trends are similar, but not statistically significant in wave 3. While relatively few residents answered yes to this question overall (between 2.3 and 8.1%), the rates in the combined crime hot spots are 50 to more than 200% higher than in the cold spots. And the hot spots overall have much higher rates than the cold spots. The cool spots have inconsistent results relative to cold spots but are generally lower on this measure than the crime hot spots.
Note:
* p < 0.05, **p < 0.01; degree of freedom = 4; overall% for wave 1 = 4.8, overall% for wave 2 = 5.8, and overall% for wave 3 = 3.8; Ns at the individual level are 3,683 for wave 1, 3,568 for wave 2, and 3,098 for wave 3.
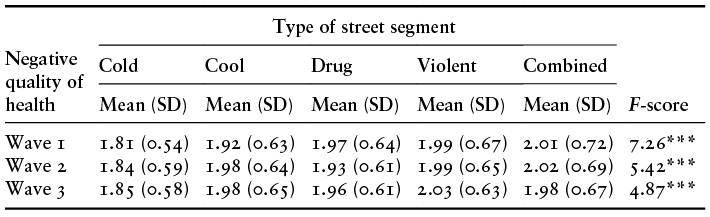
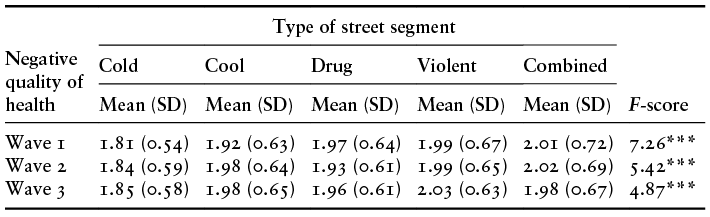
Informed by the RAND 36-Item Health Survey Questionnaire and the HIV Cost and Services Utilization Study Baseline Questionnaire (Berry et al., Reference Berry, Brown, Athey, Keesey, Tebow, Webster and Cotton1998; Hays and Morales, Reference Hays and Morales2001), we employed another two scales (or an average score across multiple items) to assess the respondent’s overall physical health. We asked respondents in our survey whether they are “getting sick more than others”; whether they are “often feeling worn out,” whether they are “expecting their health will get worse”; and whether they think “their health is excellent” (reverse coded).Footnote 4 Again, using this measure, we find significant differences across the types of streets across the three waves (p < 0.001). As with earlier indicators, residents of the hot spot streets report poorer overall health than residents of cold spot streets (see Table 7.4).
Note:
*** p < 0.001; overall mean for wave 1 = 1.95, overall mean for wave 2 = 1.96, and overall mean for wave 3 = 1.97; Ns at the individual level are 3,713 for wave 1, 3,589 for wave 2, and 3,124 for wave 3.
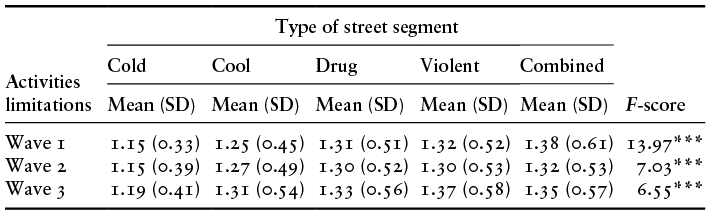
We also looked at limitations in daily life activities due to health problems. The limitations we assessed, including activities such as bathing or dressing, bending down or kneeling, doing housework, carrying groceries, engaging in strenuous activities, climbing stairs, and walking, are commonly examined by public health researchers (Flokstra-de Blok et al., Reference Flokstra‐de Blok, Van Der Velde, Vlieg‐Boerstra, Oude Elberink, DunnGalvin, Hourihane and Dubois2010; Gorial and Jabbar, Reference Gorial and Jabbar2020; Hays and Marales, Reference Hays and Morales2001; Jyvakorpi et al., Reference Jyväkorpi, Urtamo, Kivimäki, Salomaa and Strandberg2020).Footnote 5 The distinctions between the street types are again significant (p < 0.001) and in a similar direction (see Table 7.5). Residents of crime hot spots are more likely to report limitations in life activities than residents of cold spots, and in this case residents of cool spots fall somewhere in between.
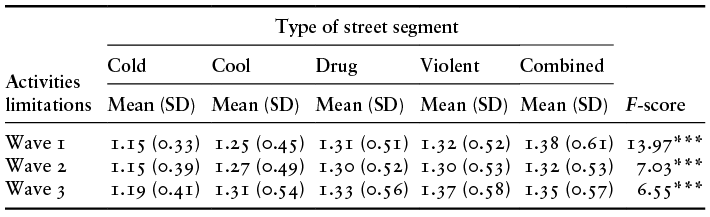
Note:
*** p < 0.001; overall mean for wave 1 = 1.29, overall mean for wave 2 = 1.28, and overall mean for wave 3 = 1.33; Ns at the individual level are 3,701 for wave 1, 3,585 for wave 2, and 3,123 for wave 3.
7.2.2 Mental Health
We might expect that mental health outcomes are particularly impacted by living in crime hot spots, though again it may be that residents with such problems are “selected” into crime hot spots. Studies at the community level report on strong relationships between living in communities of high disadvantage and mental health challenges (Curry et al., Reference Curry, Latkin and Davey-Rothwell2008; Latkin and Curry, Reference Latkin and Curry2003; Mair et al., Reference Mair, Diez Roux and Galea2008; Truong and Ma, Reference Truong and Ma2006; Zhang et al., Reference Zhang, Chen, McCubbin, McCubbin and Foley2011). Similarly, communities with high crime rates have been linked to mental health outcomes such as increased levels of anxiety, depression, PTSD, and psychological distress (Fowler et al., Reference Fowler, Tompsett, Braciszewski, Jacques-Tiura and Baltes2009; Baranyi et al., Reference Baranyi, Di Marco, Russ, Dibben and Pearce2021).
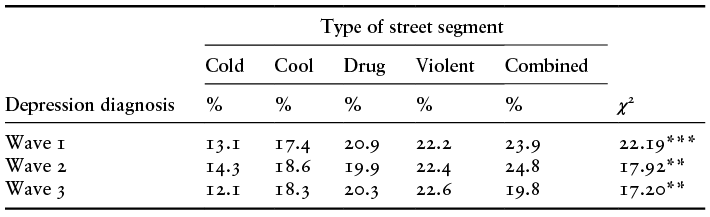
Residents were asked about whether they had ever been diagnosed as suffering from depression. Table 7.6 shows that depression diagnosis significantly differs across the street types (at least p < 0.01). Between 19.8 and 24.8% of residents of crime hot spots report a diagnosis of depression at some point in their life across the three waves. This was true for only 12.1–14.3% of residents of cold spots across the three waves. Those living on streets classified as cool spots display depression rates that fall between those reported in hot spots and cold spots.
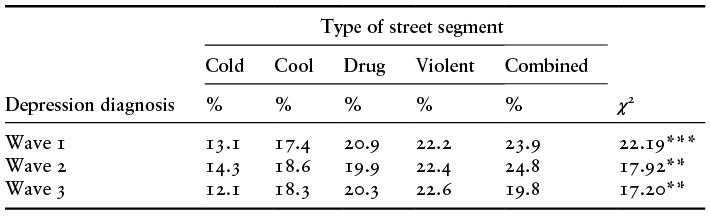
Note:
** p < 0.01, ***p < 0.001; degree of freedom = 4; overall% for wave 1 = 20.1, overall% for wave 2 = 20.4, and overall% for wave 3 = 19.7; Ns at the individual level are 3,703 for wave 1, 3,579 for wave 2, and 3,115 for wave 3.
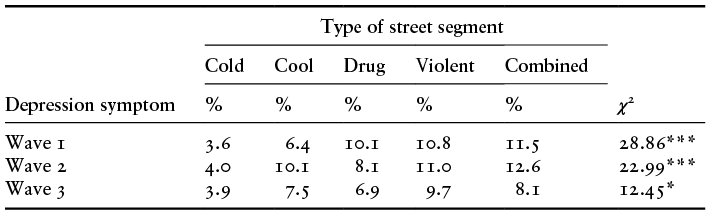
This pattern persists when examining self-reported symptoms of mental health issues experienced within the past thirty days. Depression symptomology was measured by the well-established Patient Health Questionnaire−9, which includes nine items to assess affect or mood, such as feelings of sadness or hopelessness; behavioral indicators, including social withdrawal and trouble concentrating; physical symptoms, such as changes in appetite or sleep patterns (e.g., eating or sleeping too much or too little); and cognitive symptoms, such as difficulty focusing or making decisions (Kroenke et al., Reference Kroenke, Spitzer and Williams2001). Table 7.7 shows that there are significant differences in depression symptoms across the street types (p < 0.001 in waves 1 and 2; p < 0.05 in wave 3). A much higher percentage of residents living in crime hot spots (two to three times greater) reported moderate, moderately severe, or severe depression symptoms compared to those on cold spot streets across all three survey waves. In this case, the cool spot streets have levels of self-reported depression symptoms more similar to those of drug and violent crime streets.
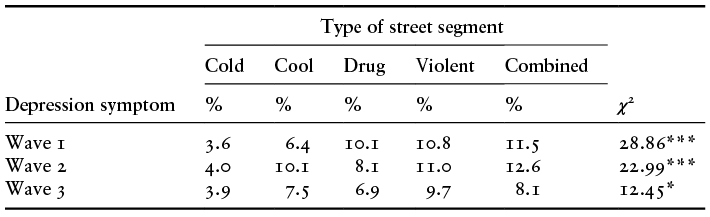
Note:
* p < 0.05, ***p < 0.001; degree of freedom = 4; overall% for wave 1 = 9.1, overall% for wave 2 = 9.5, and overall% for wave 3 = 7.7; Percent with moderate, moderately severe, or severe depression score classification; Ns at the individual level are 3,723 for wave 1, 3,601 for wave 2, and 3,127 for wave 3.
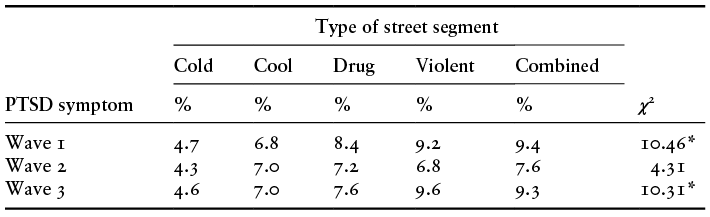
Post-traumatic stress symptomology was assessed using a screening scale based on the Diagnostic and Statistical Manual of Mental Disorders-IV. It begins with a filter question that asks whether the respondents had experienced a traumatic event such as abuse, a serious accident, or an act of violence at some point in her or his life. If a respondent answered positively, seven follow up questions, with “yes” or “no” response options, were asked to measure symptoms of PTSD in the past month, such as avoidance behavior, lack of interest in activities, numbing, and hyperarousal. Table 7.8 shows that in wave 1 and wave 3, there are significant differences across the street types in PTSD symptoms (p < 0.05). The PTSD rates on hot spot streets were approximately twice that of the cold streets. However, in the second wave the relationship was not statistically significant, and the differences across the street types were smaller.
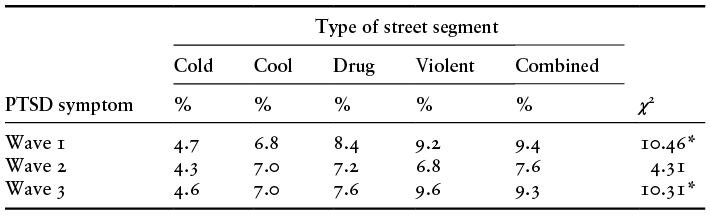
Note:
* p < 0.05; degree of freedom = 4; overall% for wave 1 = 8.0, overall% for wave 2 = 6.8, and overall% for wave 3 = 8.0; Percent with a score of 4 or higher (out of 7) on the PTSD symptom items; Ns at the individual level are 3,723 for wave 1, 3,601 for wave 2, and 3,127 for wave 3.
The qualitative interviews conducted on our streets did not initially focus on participants’ health issues, yet some stories shared by residents shed light on the possible relationship between living in a crime hot spot and mental health challenges. Our field researchers described a story from a male in his thirties who they spoke to on a drug hot spot street. The man did not live on the street segment but worked in the area and ran a rehabilitation center. He described his experiences with violence and the related trauma, saying “the reason why I started my rehab [center] was because I suffered from trauma.” He added “kids see all these killings and murder every day, and then this becomes normal – this should not be normal.” He mentioned that he has been shot nine times throughout his life – again he was only in his thirties.
I was shot once in front of my son who was 4 years old at that time – my son eventually started to ask all those sorts of complicated questions that I had no answers to … children in this area are traumatized and must go to a recovery program – somebody has to take care of them. They are not supposed to hear shootings or be part of the crime scene. He pointed out a couple of premises (off segment) and mentioned that drug activities occur every day in these places.
Another older woman in her seventies also told stories about violence she went through growing up, including seeing her best friend die by suicide when she was eighteen. She went on talking about friends and family getting involved in drugs and crime, but even those who did not get involved can get caught up in violent incidents:
I had a best friend growing up, a young boy who I was very close with. One day we were outside together and someone came up, pulled out a shotgun and shot him. At first, I thought that I was hit and was checking myself for bullets, asking out loud “am I hit?” My friend said, ‘No, but I am,’ and then he fell and died in my arms … he was one of the nicest, good people you could know, and he lost his life just being out on the street.
7.2.3 Substance Use
In addition to physical and mental health issues, substance use behavior such as smoking, drinking, marijuana use, and the consumption of hard drugs also represents significant health risks that may be linked to living on hot spot streets. The relationship between living on crime hot spot streets and substance use, however, presents a more nuanced picture compared to the connections observed with physical and mental health concerns.
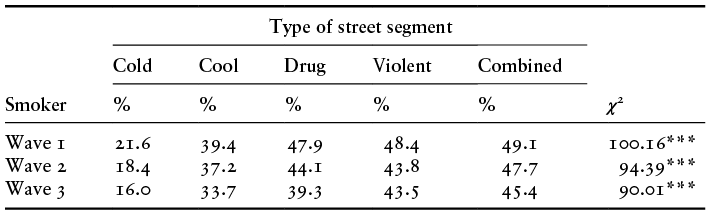
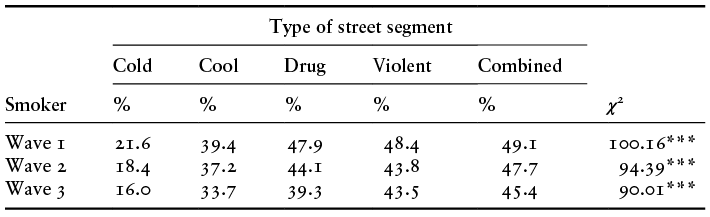
Table 7.9 shows that there are significant differences across the street types in smoking behavior (p < 0.001). Following our earlier findings, a much higher percentage of people on hot spot streets engaged in smoking compared to those on cold spot streets. Close to half of the residents we surveyed on hot spot streets across the three waves report that they were currently smoking. This was true for fewer than 22 percent of the cold spot street residents. Residents on cool spot streets exhibit smoking tendencies that are intermediary, positioned between the rates observed in hot spots and cold spots. More generally, smoking behavior has been linked to concentrated disadvantage, with studies showing that poorer, more disadvantaged populations are more likely to be smokers (Leventhal et al., Reference Leventhal, Bello, Galstyan, Higgins and Barrington-Trimis2019; Garrett et al., Reference Garrett, Martell, Caraballo and King2019).
Note:
*** p < 0.001; degree of freedom = 4; overall% for wave 1 = 43.7, overall% for wave 2 = 40.4, and overall% for wave 3 = 37.7; Ns at the individual level are 3,709 for wave 1, 3,581 for wave 2, and 3,114 for wave 3.
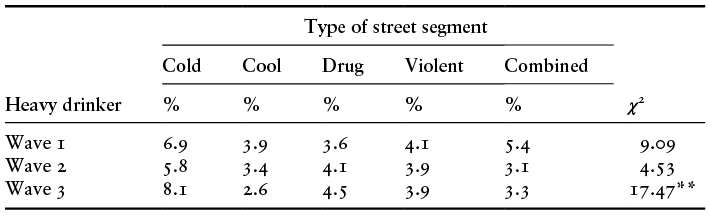
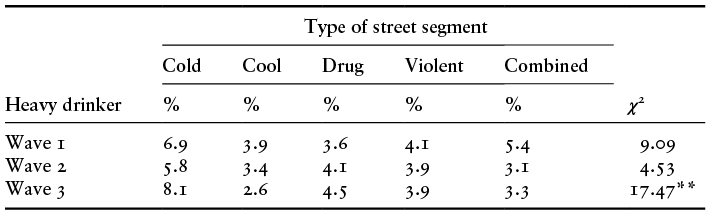
In contrast, Table 7.10 indicates a higher propensity for heavy drinking among residents of cold spot streets, relative to those living on either cool or hot spot streets, though the results are only statistically significant (p < 0.01) in wave 3. Following the National Institute on Alcohol Abuse and Alcoholism, we defined heavy drinking for males as 5 or more drinks for 5 or more days per month, and for females, 4 or more drinks for 5 or more days per month. Rates of heavy drinking using this definition are relatively low, with 8.1% or fewer of cold spot street residents and 5.4% or fewer of hot spot residents across the three waves defined as heavy drinkers. These statistics are consistent with prior research that has found that higher socioeconomic status is associated with greater alcohol use (Collins, Reference Collins2016; Martin, Reference Martin2019; Martin and Pritchard, Reference Martin and Pritchard1991; Patrick et al., Reference Patrick, Wightman, Schoeni and Schulenberg2012; Pollack et al., Reference Pollack, Cubbin, Ahn and Winkleby2005). We suspect that since alcohol consumption is generally legal, socially accepted, and often associated with social events and gatherings, residents on cold spot streets, who experience fewer social and economic disadvantages, might be more likely to opt for alcohol as a means to unwind in response to daily stressors (Collins, Reference Collins2016; Martin, Reference Martin2019; Martin and Pritchard, Reference Martin and Pritchard1991; Patrick et al., Reference Patrick, Wightman, Schoeni and Schulenberg2012).
Note:
** p < 0.01; degree of freedom = 4; overall% for wave 1 = 4.4, overall% for wave 2 = 3.9, and overall% for wave 3 = 4.1; Ns at the individual level are 3,698 for wave 1, 3,557 for wave 2, and 3,094 for wave 3, respectively.
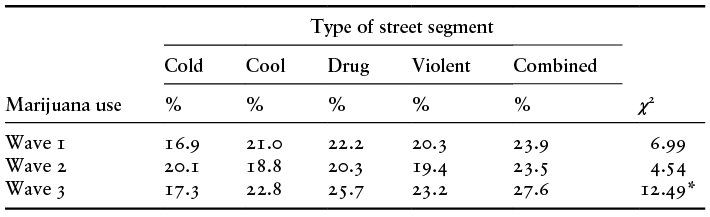
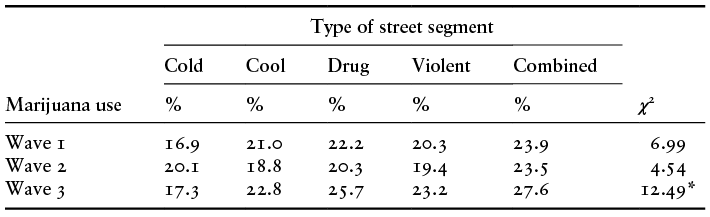
This contrasts with residents on hot spot streets, who, under similar stress, might have less access to alcohol and turn to different substances due to drug markets and availability of drugs in these places. Table 7.11 shows that while residents of crime hot spots tend to report a higher percentage of marijuana use than those on cold or cool spot streets, the differences in marijuana use across the street types are only statistically significant at wave 3. Marijuana use overall in the sample is fairly high, with more than 16% reporting using marijuana over the last month. This is more than double the estimated national average of about 8% in 2015 (CBHSQ, 2016).
Note:
* p < 0.05; degree of freedom = 4; overall% for wave 1 = 21.1, overall% for wave 2 = 20.1, and overall% for wave 3 = 23.8; Ns at the individual level are 3,708 for wave 1, 3,570 for wave 2, and 3,109 for wave 3.
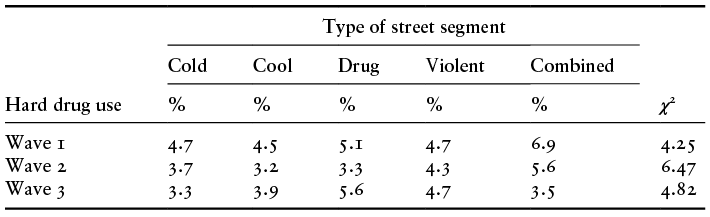
Overall, the use of hard drugs (e.g., cocaine, heroin, methamphetamine, ecstasy, RX drugs) is low among our sample respondents (see Table 7.12). The rate of hard drug use varies between 3.3 and 6.9 percent across waves and types of streets in our sample. It should be kept in mind that our survey is a survey of adults, and the average age of respondents is in their forties, and substance use is much more common for younger populations, with use peaking during one’s early twenties (Chassin et al., Reference Chassin, Hussong, Beltran, Lerner and Steinberg2009; Johnston et al., Reference Johnston, O’Malley, Bachman and Schulenberg2011; Park et al., Reference Park, Mulye, Adams, Brindis and Irwin2006). The residents of our streets who participated in the survey have largely aged out of substance use and are not the people necessarily hanging out on the streets who are involved with the drug markets. We do find that residents of crime hot spots tend to report a slightly higher percentage of hard drug use than those of cold or cool spot streets, but the differences across the street types are not statistically significant across the three survey waves.
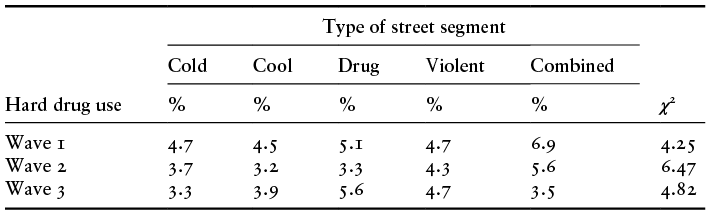
Note: Degree of freedom = 4; overall% for wave 1 = 5.1, overall% for wave 2 = 3.9, and overall% for wave 3 = 4.5; Ns at the individual level are 3,723 for wave 1, 3,601 for wave 2, and 3,127 for wave 3.
7.2.4 Summary of Findings Regarding Health Outcomes
Overall, our survey of residents suggests, as we saw in earlier chapters, that hot spots of crime are also hot spots of other disadvantages. In this case we find that health outcomes are generally worse on hot spot streets than non–hot spots. This is true of physical and mental health problems. People who live in crime hot spots are much more likely to report physical health disadvantages. And we found residents of such streets more likely as well to attribute those problems to living on hot spot streets. The largest differences are generally found between the combined crime hot spots, which have the highest crime rates in our sample, and cold spots which have the lowest rates. Indeed, cold spots appear to be most insulated from a series of physical health disadvantages. Outcomes on cool spots often are found between hot spots and cold spots, though they appear often to be more alike to the crime hot spots. Mental health outcomes closely follow our findings regarding physical health. Simply stated, hot spots of crime are also hot spots for mental health challenges.
The relationship between living in crime hot spots and substance use tells a more complex story. While residents on hot spot streets appear to report a higher prevalence of smoking cigarettes, marijuana use, and hard drug use, the differences across street types are consistently significant only in the case of smoking. Additionally, our analyses indicate that residents on streets with little or no crime show a preference for alcohol over other substances.
While these findings suggest the continuing importance of recognizing the social context of crime hot spots, in this case the higher risk of negative health outcomes, they do not tell us whether living in a crime hot spot can be identified as a cause of these disadvantages. As we noted earlier, it may be that people more prone to such problems select into crime hot spots. In this case the hot spots might not be the cause of the problems we observe but simply reflect that certain populations are more likely to live there.
7.3 The Role of Crime Hot Spots in Shaping Health
We can understand this as a selection versus causation issue. For instance, certain selection factors, such as educational and income levels, or a history of lawbreaking behavior, influence both the type of street an individual resides on and their health conditions. Generally, it is accepted that the best method for identifying causation is to randomly allocate individuals to treatment versus control conditions in an experimental field trial (Boruch, Reference Boruch1997; Weisburd, Reference Weisburd2010). In that case, one can assume that if there are differences observed, they can be attributed directly to a specific cause, for example, living in a crime hot spot. But in our study, as in other health studies that try to identify the impacts of environment on health (e.g., Renalds et al., Reference Renalds, Smith and Hale2010), we cannot randomly assign people to live in crime hot spots versus non–hot spots and then evaluate the differential changes in their health trajectories.
What we can do is to observe the health conditions and other relevant characteristics of people residing on hot spot versus non–hot spot streets, and then try to statistically adjust characteristics so that we can reasonably assume that we are identifying the impacts of living on a type of street, from other possible causes. A commonly used approach for doing this is called Propensity Score Matching (PSM, Rosenbaum, Reference Rosenbaum2002; Weisburd, Wilson, et al., Reference Weisburd, Wilson, Wooditch and Britt2022). It was developed to mimic conditions in a randomized trial by building statistical models that identify the selection process into treatment and comparison conditions. Once the mechanism for selection is identified, PSM compares outcomes for individuals that are similar in their propensity to fall within a specific condition. PSM is generally viewed as one of the most rigorous methods for assessing impacts of different conditions, such as living in a crime hot spot, when the model for selection can be reliably reproduced with strong measures of characteristics of subjects, such as those found in our data.Footnote 6 The propensity score in our study estimates the likelihood that an individual, considering a person’s unique personal attributes and circumstances, would reside on streets classified as crime hot spots or not. By balancing these propensity scores, groups of individuals residing on hot spot streets and those on non–hot spot streets can be reasonably compared.
To ensure that the comparison groups are as equivalent as possible, we incorporated a broad range of personal attributes and circumstances in the calculation of the propensity score. Specifically, we account for an individual’s age, gender, race, marital status, educational attainment, income level, employment status, and reasons for moving to the current street block. We also included housing status (owning or renting), duration of residence on the street block, presence of minors in the household, gun ownership, attitudes toward society, level of self-control, history of substance use, offending behavior, and any contact with the criminal justice system. We believe that these characteristics sufficiently describe the composition of people residing on different types of streets.Footnote 7 As shown in Figures A7.1–A7.3, there are significant differences in these selection factors between hot spot and non–hot spot streets, highlighting the necessity of these adjustments for a balanced comparison. That is, the marked disparities in physical and mental health outcomes across the street types, as observed earlier in the chapter, are at least partially attributable to the selection of individuals onto those specific streets. Following the application of inverse probability of treatment weighting, the differences in those selection factors are significantly minimized.Footnote 8
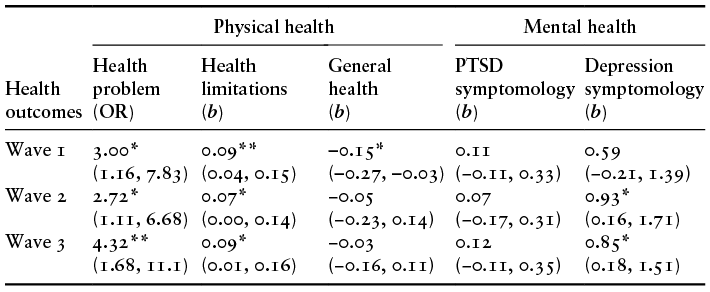
Table 7.13 presents the findings from the propensity score analysis comparing health outcomes between cold streets and crime hot spots after adjusting for self-selection into different street types. Our focus on the cold versus hot spot comparison arises from observations made earlier in the chapter and the book. It appears from our analyses that cold spot streets provide the clearest comparisons to crime hot spot streets. This makes sense because on these streets there is little or no crime, and on the hot spot streets crime levels are very high. As shown earlier, the frequency and impact of health problems among residents of cool spots sometimes align more closely with those in cold spots, while in other instances, they resemble the levels reported in hot spots.
Note:
* p < 0.05, **p < 0.01; b = linear regression coefficient; OR = logistic regression odds ratio; parenthesis = 95% confidence interval; Ns at the individual level are 2,915 forwave 1, 2,824 for wave 2, and 2,456 for wave 3.
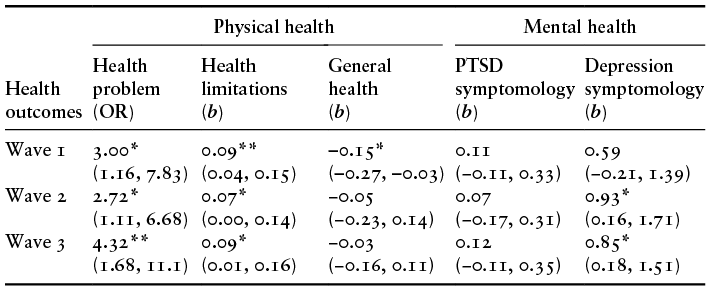
Although the results vary somewhat across the three waves of survey, an overall pattern can be discerned in Table 7.13. After balancing out selection factors, living at crime hot spots indeed leads to worse physical health outcomes. This implies that crime hot spots play a role in shaping the health of those living within them.
Let us consider the most direct question that explores the role of living environment on health, at least in terms of the perceptions of residents (“Health Problem”). Once the self-selection into cold versus crime hot spots is accounted for, individuals surveyed on hot spot streets are found to have a 1.7–3.3 times higher odds of affirmatively responding to the question, “Do you think you have any health problems that have resulted from living on your current block?”, compared to those surveyed on cold streets (at least p < 0.05). The magnitude of these effect sizes, coupled with their consistency across three different survey waves, provides strong evidence supporting the notion that people who live in a crime hot spot believe that living at crime hot spots has a detrimental impact on individual health.
In a similar vein, the results indicate that residing on hot spot streets leads to a higher degree of difficulties in performing daily activities because of health problems (“Health Limitations”). Recall that Table 7.5 provided descriptive data and simple, unadjusted comparisons between different street types regarding limitations in life activities attributable to health issues. Upon adjusting for selection factors, we observe that the disparities between street types become smaller, yet these differences remain statistically significant across all three survey waves (at least p < 0.05). On the other hand, the evidence supporting the influence of living at crime hot spots on an individual’s self-assessment of their overall health status (“General Health”) is less conclusive. Statistically significant differences were observed only in wave 1 (p < 0.05), with the disparities diminishing in wave 2 and wave 3.
Regarding mental health outcomes, we observe that once the self-selection into cold versus crime hot spots is accounted for, living on hot spot streets appears to lead to an increased level of depression symptoms compared to residing on non–hot spot streets. The differences in depression symptom scores are statistically significant in wave 2 (p < 0.05) and wave 3 (p < 0.05). However, in contrast, no statistically significant differences are found in the levels of PTSD symptoms between residents of hot and non–hot spot streets after making similar adjustments for self-selection. This indicates a specific impact of residing on hot spot streets on depression symptoms, while the effect on PTSD symptoms is not observable in our data after accounting for selection.
Residing in environments with high levels of violence and drug use might differentially contribute to deteriorating health conditions, and our analyses, so far, may be masking important differences between different types of hot spots. Besides physical injury and premature death, the perpetual stress and fear linked to a violent milieu often result in chronic stress responses, adversely affecting both mental and physical health. This ongoing stress can lead to a range of issues, including hypertension, heart disease, and mental health disorders such as anxiety and depression (Finegood and Miller, Reference Finegood and Miller2021; Rivara et al., Reference Rivara, Adhia, Lyons, Massey, Mills, Morgan and Rowhani-Rahbar2019; Wright et al., Reference Wright, Austin, Booth and Kliewer2017). On the other hand, the prevalence of drug use in the surrounding area poses direct health risks associated with substance abuse itself, including the potential for addiction, overdose, and a variety of related health complications. Indirectly, it increases the risk of infectious diseases spreading through shared needles or unprotected encounters and escalates the propensity for health concerns (Degenhardt and Hall, Reference Degenhardt and Hall2012; National Institutes on Drug Abuse, 2025). Thus, we extend our analyses to compare the health outcomes of residents living on cold spot streets with those residing on streets identified as violent crime hot spots and drug crime hot spots, respectively.
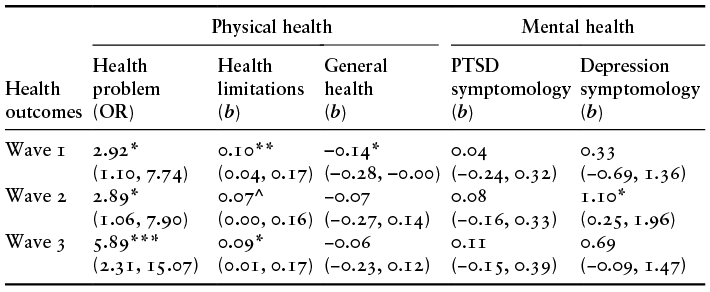
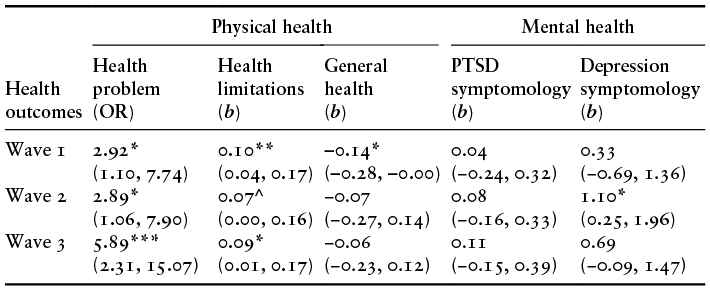
Table 7.14 shows the results from the propensity score analysis comparing health outcomes between cold and violent crime hot spots. The observed patterns are comparable to those seen in Table 7.13. Once the self-selection into street types is accounted for, individuals surveyed on violent hot spot streets are found to have a 1.9–4.9 times higher odds of affirmatively responding to the question, “Do you think you have any health problems that have resulted from living on your current block?” (“Health Problem”), compared to those surveyed on cold streets (at least p < 0.05). The even larger effect sizes (compared to those in Table 7.13) and the consistency observed across three different survey waves suggest that people who live in a violent crime hot spot firmly believe that living in such areas has a detrimental impact on individual health. Additionally, the results confirm that residing on violent hot spot streets leads to greater difficulties in performing daily activities as a result of health problems (“Health Limitations”). In all three waves, the differences in health limitations were statistically significant (at least p < 0.05) or very close to significance (p < 0.10). The impacts on “General Health” are only significant in wave 1, and the differences in depression symptom scores are statistically significant only in wave 2. PTSD is not significant across the three waves once selection factors are taken into account.
Note:
^ p < 0.10, *p < 0.05, **p < 0.01, ***p < 0.001; b = linear regression coefficient; OR = logistic regression odds ratio; parenthesis = 95% confidence interval; Ns at the individual level are 1,901 for wave 1, 1,838 for wave 2, and 1,604 for wave 3.
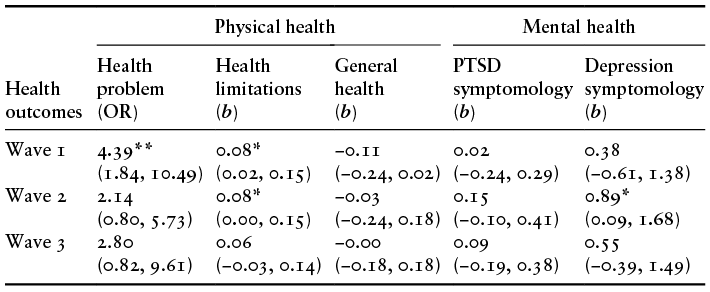
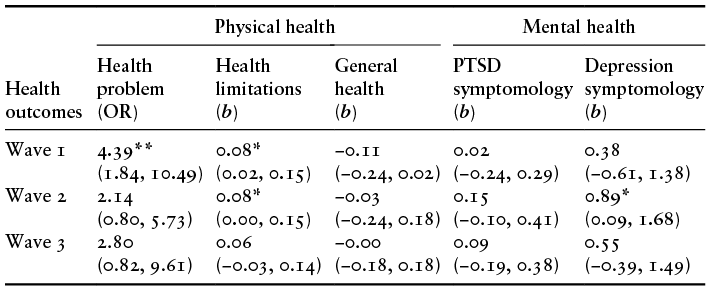
Table 7.15 displays the outcomes of the propensity score analysis that compares health results between cold spots and drug crime hot spots. In this comparison, the differences in limitations in life activities due to health problems are statistically significant in waves 1 and 2 (p < 0.05), but not in wave 3. In addition, the likelihood of respondents affirmatively answering the question, “Do you think you have any health problems that have resulted from living on your current block?” (“Health Problem”) is statistically significant only in wave 1 (p < 0.01). Compared to the results from the comparison between violent crime hot spots and cold spots, the effect sizes are generally smaller. Collectively, these findings suggest that the evidence supporting the negative impact of living in drug crime hot spots on individual health is less definitive than that observed for violent crime hot spots.
Note:
* p < 0.05, **p < 0.01; b = linear regression coefficient; OR = logistic regression odds ratio; parenthesis = 95% confidence interval; Ns at the individual level are 1,861 for wave 1, 1,807 for wave 2, and 1,560 for wave 3.
7.4 Conclusions
Our findings in this chapter reinforce what we have learned in prior chapters. Hot spots of crime are also hot spots for other disadvantages. In this chapter, we have illustrated that crime hot spots are also places with higher rates of physical and mental health problems. We found that certain types of chronic disease, such as asthma or high blood pressure are much more likely to be reported by residents of crime hot spots, and especially combined crime hot spots compared to cold spots. Residents of crime hot spots were much more likely to report poor health or limitations in life activities that were related to health problems. Additionally, they were more likely to report mental health problems including depression and PTSD. What is clear is that crime hot spot residents suffer from greater health disadvantages than residents who live on streets with little crime.
But as we noted earlier in the chapter, there is a difference between correlation and causation. It may be that rates of health problems are higher in crime hot spots because of the people who select, or are constrained by limited options, to live in such places and not because of the impacts of living in a hot spot itself. We used an approach termed Propensity Score Matching, to try to identify whether we could attribute health disadvantages to living in a hot spot street. Overall, those findings support the role of crime hot spots in shaping health. After accounting for selection, physical and mental health problems can be seen as resulting from living in a crime hot spot. An important exception to these general findings is that residing on streets with high levels of violence or drug use does not appear to influence the level of PTSD symptoms.
In Chapter 6, we noted that experiences with violence and related traumas are not necessarily linked to the specific streets that people live on, but may be related more generally to the communities that people live in. We found that roughly 40 percent of violent crime victimization within the last year in our sample did not occur on the street someone lived on. Given the degree of mixing of hot spot and non–hot spot streets within communities (see Chapter 3), it may be that the overall very high rates of violent crime in communities in Baltimore are more impactful on PTSD than the experiences of residents on the specific streets that they live on. Additionally, the manifestation of PTSD symptoms is often related to personal trauma rather than environmental stressors (Ozer et al., Reference Ozer, Best, Lipsey and Weiss2003). Hence, while living in areas with prevalent violence or drug use undoubtedly contributes to a stressful environment, it does not uniformly lead to PTSD, underscoring the complexity of this mental health condition and its triggers.
Our findings have important implications for addressing health problems at crime hot spots. The fact that hot spots have much higher rates of physical and mental health challenges suggests the importance of focusing public health resources on crime hot spots. The fact that many of these problems appear to be caused by living on a crime hot spot street raises the question of whether criminal justice or policing can be integrated with public health and/or social work approaches to address health challenges on these streets. We return to these issues in more detail in Chapter 8 when we focus on policy implications more generally of our study.

 Open access