
Voters in the United States are highly dissatisfied with Congress. In November 2013, Gallup reported that approval had fallen to single digits for the first time since tracking began in 1974. Such low levels of approval, which have become a perennial issue for Congress (Patterson and Magleby Reference Patterson and Magleby1992), have important consequences for both the members of Congress (MCs) and the democratic process.
Can legislators’ responsiveness improve voters’ attitudes toward Congress and the political parties? Legislators have strong incentives to build their own electoral support and extend a great deal of effort toward this goal (Cain, Ferejohn and Fiorina Reference Cain, Ferejohn and Fiorina1987; Grimmer, Messing and Westwood Reference Grimmer, Messing and Westwood2012). Do these efforts increase voter approval not just of the legislator, but also of Congress and the legislator’s party?
Legislators’ responses to the letters they receive has the potential to be a powerful tool for shaping attitudes toward Congress because this is one of the most common interactions that people have with Congress. Legislators receive and respond to an ever-increasing number of communications from constituents (Butler 2014). Legislators put great resources toward their homestyle communications (Harden Reference Harden2013) because these resources are opportunities to directly improve constituent attitudes toward the legislator himself or herself. Positive interactions with a legislator may also be used as a cue to make inferences about Congress and its functioning as a whole, thus affecting attitudes about political institutions more broadly.
However, legislators’ actions might not have an effect on attitudes toward Congress or the political parties. While voters often use cues or other information shortcuts to make decisions (Popkin Reference Popkin1991; Sniderman, Brody and Tetlock Reference Sniderman, Brody and Tetlock1991; Levendusky Reference Levendusky2010), such heuristics are not always used well (Kuklinski and Quirk Reference Kuklinski and Quirk2000; Lau and Redlawsk Reference Lau and Redlawsk2001; Dancey and Sheagley Reference Dancey and Sheagley2013) and often do not change opinions in a straightforward fashion (Adams, Ezrow and Somer-Topcu Reference Adams, Ezrow and Somer-Topcu2011; Arceneaux and Vander Wielen Reference Arceneaux and Vander Wielen2013). It is not clear, therefore, that constituents’ interactions with their own representative will affect attitudes toward the institution of Congress as a whole or attitudes toward the party with whom the legislator is affiliated.
Here we employ two methods for testing the effect of legislators’ communication on voter attitudes. First, we examine the available cross-sectional survey data correlating recall about contact with a MC and evaluations of the legislator and institutions. The results suggest that there is a small, but positive spillover effect, with voters approving of both their legislator and Congress more when they like the responses they have received from their MC. However, because these findings rely on recall, they may be driven by survey response bias.
Second, we employ unique panel survey data that we collected. Our panel design allows us to control for constituents’ prior affect toward their legislator. As part of the study, we recruited over 100 research participants to write letters to their own MCs. These individuals also opened PO boxes and email accounts that forwarded any responses they received from their MCs to us so that we were able to track which MCs responded before delivering the response to the constituent who originally wrote the letter. Because we have data on which constituents received a response, we do not have to rely on the constituent’s recall. Further, we surveyed constituents about their evaluations of their own MC, their MC’s political party, and Congress as a whole before they wrote a letter and then nine months later after they had received a response (or had not received a response),Footnote 1 enabling us to control for constituents’ prior attitudes.
This panel design shows that people who received a response from their own MC evaluate that representative more positively than those who did not receive a response. However, unlike the cross-sectional results, the panel data shows there is no spillover effect onto either the MC’s political party or Congress as a whole. To our knowledge, this is the first time a panel design has been used to examine whether communication from a MC moves attitudes about both individual representatives and political institutions. Our results provide an example of how panel data can mitigate potential biases in survey responses and thus alter substantive conclusions.
Related Reputations for MCs, Their Party, and Congress?
Legislators’ actions may affect evaluations of Congress because legislators’ individual actions are likely the most direct interaction that most citizens have with Congress. When forming evaluations, citizens draw on considerations they readily recall (Zaller Reference Zaller1992; Zaller and Feldman Reference Zaller and Feldman1992). Positive legislator actions—like a returned letter—could thus spillover to how constituents evaluate Congress. Consistent with this possibility, the evaluations of individual MCs and Congress as an institution are related and covary together (Born Reference Born1990; Patterson and Magleby Reference Patterson and Magleby1992; Ripley et al. Reference Ripley, Patterson, Maurer and Quinlan1992; Farnsworth Reference Farnsworth2003; McDermott and Jones 2003).
Yet, identifying the direction of the causal relationship, or if a relationship exists at all, between these two evaluations is difficult (see discussion in Ripley et al. Reference Ripley, Patterson, Maurer and Quinlan1992, 452). Do evaluations of individual members cause opinion of institutions? Or do institutional evaluations drive opinion about individuals (ceteris paribus)? Arguing that individual actions matter for institutional evaluations, Patterson, Ripley and Quinlan (Reference Patterson, Ripley and Quinlan1992, 332) suggest the presence of a spillover effect when they conclude from their study that “good ‘casework’ on the part of individual members of Congress surely helps make them more popular and more electable … [and] also moves public evaluation of the general performance of Congress as an institution in a favorable direction (emphasis added).”
This argument implies that one route to improving attitudes about Congress is to improve attitudes about individual members. Jones and McDermott note that one of the main reasons people dislike Congress is that “it is simply impossible for Congress to simultaneously adopt all ideological stands to please all citizens” (Reference Jones and McDermott2009, 151). By contrast, legislators can be responsive to all of the letters they receive.
Such personal attention can potentially have a positive spillover effect on attitudes toward the parties and Congress as an institution because it provides a cue about Congress and the MC’s party. The use of citizen heuristics is well established in the literature, as is the related idea of using limited information to generalize about politics more broadly (see, e.g., classic works by Popkin Reference Popkin1991; Sniderman, Brody and Tetlock Reference Sniderman, Brody and Tetlock1991, but see Kuklinski and Quirk Reference Kuklinski and Quirk2000; Lau and Redlawsk Reference Lau and Redlawsk2001). On this view, voters may logically conclude that contact with a legislator does provide information about Congress and the legislator’s party.
If the logic of using individual MC actions to generalize about Congress holds, the solution to improving the body’s image may not be macro-level policy reform. Rather than getting members to campaign for the institution (Fenno Reference Fenno1978), they would simply need to get members to abstain from campaigning against the institution. With members no longer taking actions that detract from evaluations of Congress (Hibbing and Theiss-Morse Reference Hibbing and Theiss-Morse1995), the positive spillover effects of the MCs own electorally driven constituency service behavior could elevate the evaluations of the institution.
Such a possibility assumes that members’ positive actions have positive spillover benefits. It is quite possible, however, that citizens will conclude there is little relationship between the individual action of a member and the institution as a whole. Individuals and institutions are distinct attitude objects, a fact that is likely to lead to distinct assessments about those objects (Eagly and Chaiken Reference Eagly and Chaiken1993). Indeed, the heart of Fenno’s famous paradox is that constituents evaluate their individual representative and the institution differently because constituents use “different standards of judgment,” holding MCs to a less exacting standard than they do for the broader institution (Fenno Reference Fenno1975, 278; see also Cook Reference Cook1979; Parker and Davidson Reference Parker and Davidson1979; Ripley et al. Reference Ripley, Patterson, Maurer and Quinlan1992). Previous research on support for Congress traces public attitudes about the institution to forces much larger than individual member actions (Patterson and Caldeira Reference Patterson and Caldeira1990; Hibbing and Theiss-Morse Reference Hibbing and Theiss-Morse1995; Durr, Gilmour and Wolbrecht Reference Durr, Gilmour and Wolbrecht1997; Hibbing and Theiss-Morse Reference Hibbing and Theiss-Morse2002; Ruldolph 2002). If citizens use different criteria for judging Congress as a whole (like economic conditions or foreign affairs or disdain for the messy process of lawmaking) than they do when judging individual members, then individual MC actions will be irrelevant for evaluations of the institutions.
Observational Data on Spillover Effects
Few previous researchers have directly examined whether spillover effects occur. An exception is Patterson, Ripley and Quinlan (Reference Patterson, Ripley and Quinlan1992), who use cross-sectional surveys of Ohio residents to show that merely contacting a representative is negatively correlated with overall approval of Congress. However, the effect works modestly in the opposite direction for those who contacted their representative and were satisfied with the result, suggesting that effective casework could lead to more positive evaluations of the institution.
The 2008 Cooperative Congressional Election Survey (CCES) allows us to look beyond constituents in a single state to a large national sample. The survey asked questions about a citizen’s contact with a MC, and ~35 percent of the sample claimed to have some contact with their representative. Of this group, about 69 percent were at least somewhat satisfied with the contact.
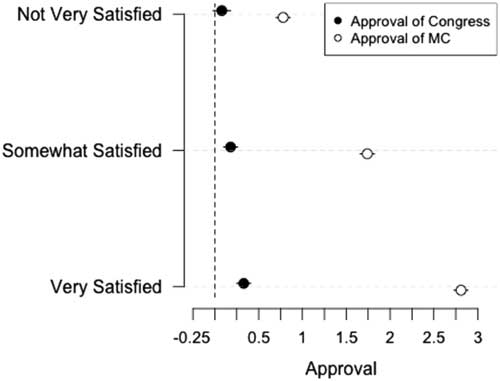
Did the contact make any difference for either evaluations of the member or the institution as a whole? Citizens who were at least somewhat satisfied with the contact did, as we would expect, have a higher level of satisfaction with the particular MC (see Figure 1, full model results are available in Appendix 2). The data also show that those that were at least somewhat satisfied with the contact had a slightly higher approval of the institution as a whole, though this effect is very small—about ten times smaller than the effect on satisfaction with the individual MC.
Effect of contact with a member of Congress (MC) on approval of the MC and approval of the Congress as an institution Note: Dots indicate the ordered probit coefficient relative to the excluded category of “not at all satisfied” for a model of approval (see Appendix 2) that controls for partisanship and citizen demographics. Lines represent a confidence interval on the coefficient.
The size of the effect is not overwhelming and there are other reasons to doubt its validity. It is possible that respondents are overstating their contact with Congress, or that recall bias means constituents who have more favorable attitudes toward their legislators and/or Congress may simply be more likely to remember the positive actions their legislators have taken. Thus, there may be a correlation between recall of legislator’s actions and constituents’ attitudes toward their legislator even when there is no underlying causal relationship. To account for recall bias and deal with some of the unobserved characteristics of the respondents, we turn to panel survey data from a study regarding legislative responsiveness to constituent mail, data that will allow for a cleaner test of whether MCs’ responsiveness has a positive spillover effect on citizens’ evaluation of Congress and the political parties.
Panel Data
The constituents in our study were students recruited during the fall of 2008 from a large private university with a geographically diverse student population. The research design focused on recruiting both Latino and Anglo students who lived in the same zip code, so our sample of constituents is somewhat concentrated in Western and Southwestern states with large Latino populations, though all regions of the country are represented. Student participants were told as part of the recruitment that they would be writing letters for their legislators. When the constituents came in for the scheduled letter writing session, we first asked them to take a pre-survey that included questions about their own political views and their attitudes toward their representatives, the political parties, and Congress. They then wrote letters on the issue of immigration which were sent to their MCs (see Butler, Karpowitz and Pope Reference Butler, Karpowitz and Pope2012).Footnote 2
After writing the letters, the constituents opened up PO boxes in their hometown and had the mail arriving in the box forwarded to us. The letters were then sent during the first two weeks of February 2009—the opening days of the 111th Congress. We limited the total number of letters sent to any US Senator to 12, and the total sent to any US House Member to eight letters. As a result of these limits, some of our student participants sent three letters to MCs, while others only sent one or two. For the analysis, we cluster on the constituents in the study.
We collected legislators’ responses over the next several months. A few months after we had sent the original letters to the legislators, we began forwarding the responses we received to the constituents who had sent the letters and asked them to read and evaluate the response they received. Each constituent received one letter to read and evaluate at a time. After reading the response from the legislator, our research participants were then asked to indicate their attitudes toward their MC, the political parties, and Congress. Once that evaluation had been completed, students who had received multiple letters were sent the next letter received and were encouraged to take the survey again for that letter. This process continued as we received responses. About ten months after the letters were sent, we administered a survey to the research participants who had not received a response from their MC about their attitudes toward their MC, the political parties, and Congress.Footnote 3 We used the same evaluation questions that they had been given before they wrote their own letters. These questions included their thermometer ratings of their own MC, the political parties, and Congress as an institution. They were also asked to give a job approval rating for their MC and to indicate how likely they would be to vote for their MC if an election were held today. Finally, we also asked them about how much of the time they thought MCs could be trusted. The Appendix gives the exact wording of these questions and the empirical coding of the students’ responses.
Our 123 research participants sent a total of 295 letters to their MCs. Because the constituents typically sent more than one letter to MCs (i.e., their House representative and two Senators), most had multiple opportunities to complete post-study evaluations. We asked them to complete a separate evaluation for each MC to whom they had sent a letter, regardless of whether they received a response or not, with the maximum number of surveys any given respondent could take being three.Footnote 4 Of the 123 constituents in our study, over 80 percent responded to at least one of our requests to complete a survey. Approximately 27 percent completed one post-study survey, while 24 percent of participants completed two surveys, and 30 percent completed three surveys. Given that the post-study evaluation sometimes came as much as ten months after students had finished their letters, and they were not paid to complete these final evaluations, our response rate was quite high, with 80 percent of students finishing at least one evaluation.
Because constituents who did not receive a letter responded to our survey toward the end of the study period, while many of those who did receive a letter responded to the survey at an earlier point in time, internal validity is a potential concern. The alternative would have been to ask those who did not receive a letter to respond to the survey earlier, but such a procedure could have introduced other potential problems, given that some communication from Congress arrived very late in the process. Further, nearly one-quarter of the responses to letters received occurred in the same time frame as surveys completed by those who did not receive a letter, so the timing of the two samples overlapped to some extent. The pattern and statistical significance of the results we present below are not changed by the inclusion of controls for the date of survey completion (details available from the authors).
Research Design: Analysis
The main independent variable, received response, is binary and is coded as a 1 for constituents who received a response and 0 for those who did not. When students received a response, we gave them the letter from their MC and then asked them to respond to a short questionnaire. For those students who had not received a response, we informed them that they had not received a response and then asked them to fill out the questionnaire.
In the questionnaire we asked them to evaluate their MC, the political parties, and Congress as an institution. Because the feeling thermometer ratings (for their MC, the MC’s party, and Congress) are continuous variables, we use ordinary least squares regression models for the analysis. For the other three outcomes (MC Job Approval, Vote for MC, and Trust Legislators), which are ordinal variables, we use ordered probit regression models. All of the variables are coded such that increasing values indicate higher favorability toward the person or institution that is being asked about (see the Appendix for exact coding details).
Our panel data allows us to control for the prior value of the dependent variables in our analyses.Footnote 5 In particular, we asked the participants all of the same evaluation questions that we use as dependent variables when they first joined the study and before they had written their letters to their MCs. We also control for the student’s gender, race, whether they identify as an independent, whether their partisanship matches the legislators partisanship,Footnote 6 and whether they sent a service or policy letter.Footnote 7 Excluding these control variables has no effect on the results.
Finally, because some participants sent letters to more than one MC, we cluster on constituent.Footnote 8 This leads to one complication with respect to the spillover analysis below. Respondent attitudes about MCs obviously vary by individual member. However, respondent attitudes about Congress or a political party are about essentially a single institution—rather than multiple members of the institution. Thus, a simple theory of attitudes would suggest that each participant should only have one evaluation of Congress or a political party. Without disputing that fact, we note that in the context of this study those attitudes always come in the context of receiving a specific letter from an individual MC. Moreover, because students took their time responding to the survey, often these evaluations of the institutions occurred a month or more apart. Consequently, we assume that each letter here is a separate treatment applied to each survey respondent.Footnote 9
Results
In the post-survey, we asked citizens about their level of satisfaction with the letters they received. We also asked them three questions that directly tapped the constituents’ attitudes toward their MC—a feeling thermometer, approval of the MC’s job performance, and likelihood of voting for the MC against a high-quality opponent. Table 1 examines whether individuals’ responses to these questions varies with how satisfied they were with their response. For the analysis, we created dummy variables for each level of satisfaction with the letter along with a dummy variable for those who did not indicate their level of satisfaction with the letter.
Effect of Receiving a Response on Evaluations on One’s Own Member of Congress (MC) by Level of Satisfaction with the Response
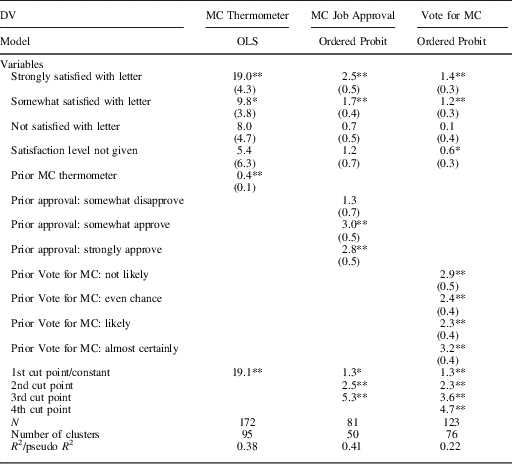
Note: Cluster standard errors given in parentheses. Clusters are for the participant receiving the letter. The following control variables were included in the model but are not shown here: student’s gender, race, whether they identify as an independent, whether their partisanship matches the legislators partisanship, and whether they sent a service or policy letter. Those not receiving responses from their MC are the excluded category.
OLS=ordinary least squares.
*, **Significant at 0.05 and 0.01, respectively.
Table 1 shows that the participant’s satisfaction with the response they received strongly predicts their attitudes toward their legislator. Individuals who were strongly satisfied with their legislator’s response were the ones who held the most positive attitudes toward their MC. Similarly, those who were somewhat satisfied with the response that they received were significantly more likely (both statistically and substantively) to have positive attitudes toward their legislator. In contrast, there are no statistically significant differences between those who were unsatisfied with the response they received and those who did not receive a response.Footnote 10
Consistent with the results from the CCES (Figure 1), the more satisfied constituents are with the response letter, the more satisfied they are with their legislator. Notably, the coefficient for dissatisfaction with the legislator is neither negative nor statistically significant: even those who were unsatisfied with their letter proved no more disappointed in their legislator than those who did not receive a response.
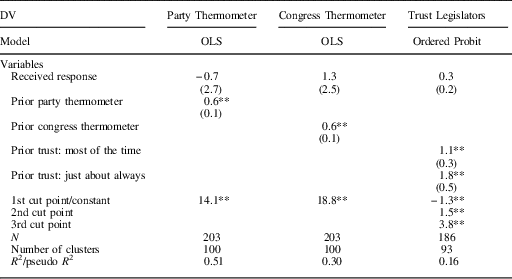
While individuals’ satisfaction with the letter they receive predicts their attitudes toward their own MC, it does not appear to have a spillover effect. As Table 2 shows the difference between those who received a response and those who did is statistically and substantively insignificant for each of the spillover questions we asked. Even the most satisfying response does not affect impressions of the political institutions within which MCs work. Legislators earn credit for what they do, but attitudes toward Congress, the parties, and legislators as a group, do not change.
Effect of Receiving a Response on Evaluations of Other Individuals and Institutions by Level of Satisfaction with the Response
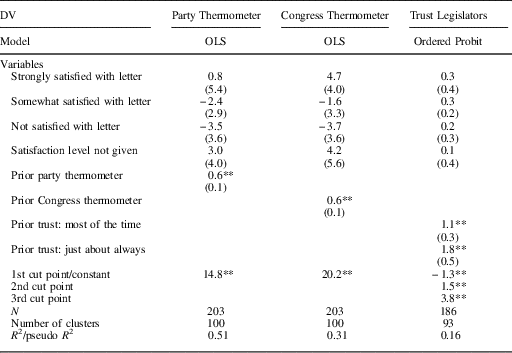
Note: Cluster standard errors given in parentheses. Clusters are for the participant receiving the letter. The following control variables were included in the model but are not shown here: student’s gender, race, whether they identify as an independent, whether their partisanship matches the legislators partisanship, and whether they sent a service or policy letter. Those not receiving responses from their member of Congress are the excluded category.
OLS=ordinary least squares.
*, **Significant at 0.05 and 0.01, respectively.
A potential concern here is that the test will fail to reject the null when there is a true effect (a type II error). In this case, there is some evidence that a type II error is possible in the specification for congressional approval (column 2 of Table 2). The coefficient for those who were most strongly satisfied with the letter is 4.0 and the SE is 4.7. The power of this test is not as strong as we would like. If we assume that there is a true spillover effect of 5 points on the thermometer scale (this is less than half of the direct effect on the rating for a MC), the power of these tests—the probability of correctly rejecting a null hypothesis—is 0.11 for a null hypothesis. Given this result, it is possible that there is a small effect going undetected for those who felt the highest levels of satisfaction with their representative’s response, but the total set of coefficients strongly suggests no broad spillover effect.Footnote 11
In addition, it is important to note that our questions measure respondent attitudes at the moment we would expect the maximum effect: immediately upon receiving and reading the letter. In this sense our data, though administered in the field, mimics a lab experiment. It is possible, even likely, that the positive effects for individual legislators decay over time. But there can be little decay from no effect, meaning that despite the observational results, there is little evidence of a spillover effect for parties and institutions.
One of the motivations for using the panel data is to avoid bias in the form of respondents who liked their legislator and/or Congress being more likely to report being satisfied with their letter. While we have controlled for their prior attitude, a further way to avoid this bias is to simply use receiving a letter as the main independent variable. Because of our design, we know who received the letter, this measure is not subject to any recall bias related to satisfaction with the response.
Table 3 gives the results for how receiving a letter affected constituent attitudes toward their MC. Because the variable received response is binary, the coefficient gives the predicted difference between those who received a response and those who did not. For each of the outcomes, that difference is large, positive, and statistically significant at the 0.01 level.
Effect of Receiving a Response on Evaluations on One’s Own Member of Congress (MC)
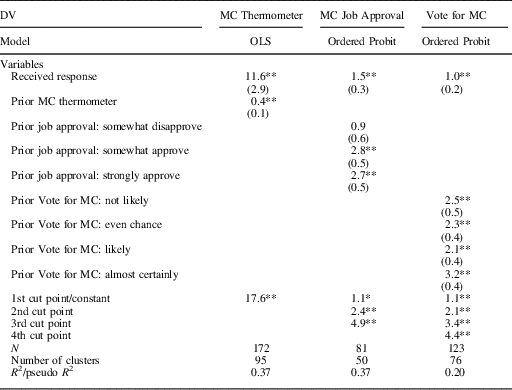
Note: Cluster standard errors given in parentheses. Clusters are for the participant receiving the letter. The following control variables were included in the model but are not shown here: student’s gender, race, whether they identify as an independent, whether their partisanship matches the legislators partisanship, and whether they sent a service or policy letter. Those not receiving responses from their MC are the excluded category.
OLS=ordinary least squares.
*, **Significant at 0.05 and 0.01, respectively.
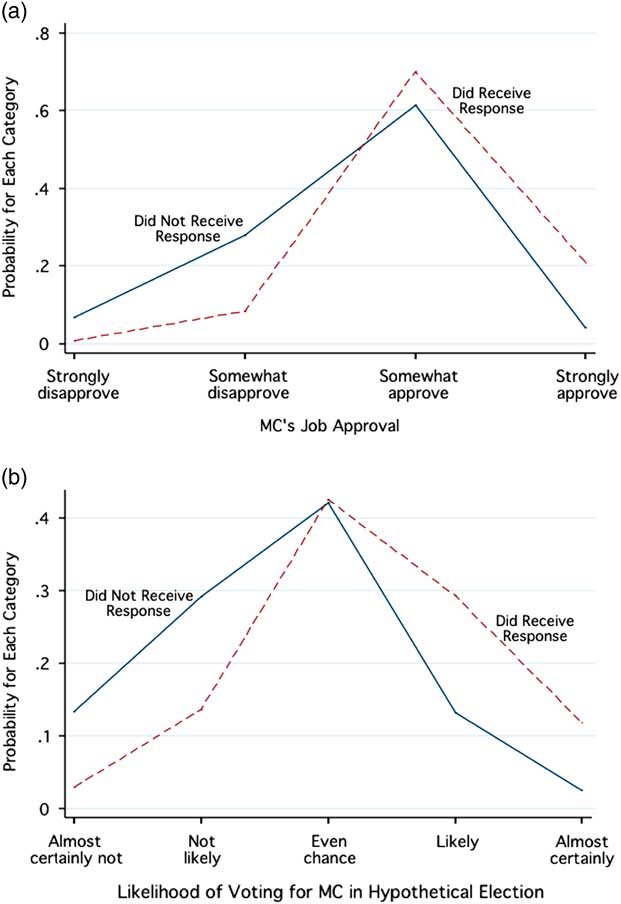
Substantively, those who received a response from their legislator were about 25 percentage points less likely to report that they disapproved (either somewhat or strongly) of how their MC was doing her job and about 25 percentage points more likely to report that they approved (either somewhat or strongly) of how she was doing her job. The differences are even larger when asking about how likely they would be to vote for the MC in a hypothetical election. Individuals who received a response were about 30 percentage points more likely to choose the responses “likely” or “almost certainly” (and 30 percentage points less likely to choose the responses “not likely” or “almost certainly not”) than those who did not receive a response. For both approval and likelihood of voting, Figure 2 shows the differences in the predicted probability of each possible response category between those who received a response (the dashed line) and those who did not (the solid line), holding the prior level of the dependent variable at its modal value.Footnote 12
Effect of receiving a response on attitudes (a) The effect of receiving a response on the predicted likelihood of approving of the job the member of Congress (MC) is doing (b) The effect of receiving a response on the predicted likelihood of voting for the MC in a hypothetical election Note: The dashed (solid) line gives the predicted probability of ending up in each category for those who did (did not) receive a response from the MC. These predicted values are based on the regression in columns 2 and 3 of Table 1 while holding the prior level of Vote for MC constant at it’s modal value (“even chance”).
Researchers have long argued that responsiveness is an important source of the incumbency advantage (e.g., Cain, Ferejohn and Fiorina Reference Cain, Ferejohn and Fiorina1987; King Reference King1991). Our results provide further evidence on this point. Individuals who received a response from the MC were much more likely to hold favorable views of them and much more likely to express a willingness to vote for them.
Table 4 presents the regression results showing further evidence that there is no spillover effect. For each of these outcomes, received response is statistically insignificant and the coefficient has a magnitude near 0. In the case of the party thermometer rating the sign on the coefficient is even in the wrong direction. Again, we tested our confidence in these insignificant results with power analysis. If we again assume that there is a true spillover effect of 5 points on the thermometer scale, the power of these tests is near 1. Assumptions about the true effect might vary the calculation slightly, but the broad pattern suggests that there is little evidence here for any spillover effect.
Effect of Receiving a Response on Evaluations of Other Individuals and Institutions
Note: Cluster standard errors given in parentheses. Clusters are for the participant receiving the letter. The following control variables were included in the model but are not shown here: student’s gender, race, whether they identify as an independent, whether their partisanship matches the legislators partisanship, and whether they sent a service or policy letter. Those not receiving responses from their member of Congress are the excluded category.
OLS=ordinary least squares.
*, **Significant at 0.05 and 0.01, respectively.
While we find evidence of an important difference between evaluations of individual legislators and evaluations of the institution, our analysis has not yet addressed one additional important question: Whose opinions are changing? Are those who received a letter becoming dramatically more enthusiastic about their representatives, or are those who did not receive a response rejecting a previously positive view of their MCs? Or are both trends occurring simultaneously? Table 5 provides initial insights into these questions.
Who Changes Attitudes
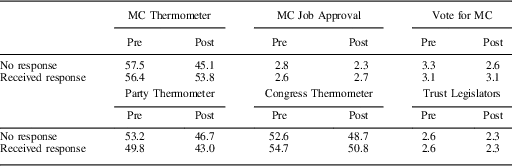
Note: This gives the average value of the six attitudinal questions that we asked participants in the study broken down by period (was the questions asked before sending the letters or afterwards) and whether their member of Congress (MC) had responded. The wording and coding for the six attitudinal questions is given in the Appendix.
These results seem to suggest that responding matters because not doing so leads to more negative evaluations from constituents. At first glance, this implies that responding is not about getting something but rather not losing something. We caution against generalizing that interpretation too broadly, however. As Table 5 shows, there was a slide against incumbents and against Congress as a whole during this period, one that ultimately resulted in the deep levels of dissatisfaction we described in the introduction. At the point of our second survey, the 111th Congress had already passed a controversial stimulus package and was debating—and in some cases already at loggerheads about—some important policy questions, including health care reform and immigration policy. In this increasingly contentious environment, Congress became increasingly unpopular (see also Hibbing and Theiss-Morse Reference Hibbing and Theiss-Morse1995), and some previously safe incumbents became vulnerable. Representatives who responded to their constituents seemed to be, at least to some extent, inoculated against the anti-incumbent tide. Perhaps the response reassured letter recipients that their representatives were above the partisan fray. Perhaps other mechanisms were at work. In any case, our results clearly hold for a period of low and declining evaluations of Congress and its members. Whether the results would hold in another era is worthy of study, though we see no reason to believe it would reverse the broad patterns reported here.
Discussion
Fenno (Reference Fenno1975) famously wrote, “We do, it appears, love our congressmen. On the other hand, it seems equally clear that we do not love our Congress.” This observation has rightly come to be known as Fenno’s paradox because Congress is merely the aggregation of its individual members. Research shows that actions by MCs improve constituents’ opinion of those members (Cover and Brumberg Reference Cover and Brumberg1982). Consequently, it seems possible that there could be some spillover effect on institutional reputations when members take actions that affect how citizens evaluate them as individuals. If citizens use their individual member’s actions as a heuristic to form evaluations of Congress or the party institutions, then we should expect to see member’s positive actions exerting some influence on citizens’ evaluations of those institutions.
An analysis of cross-sectional survey data supports this intuition. Though the effect is not large, the results seem to confirm the plausible story that citizens use contact with Congress as a heuristic to evaluate the party and the institution as a whole. While suggestive, these results are also limited in important respects.
Our panel design provides a more careful analysis of the effect of legislators’ outreach efforts on constituents’ attitudes. In our study, we surveyed participants who sent letters to their MC both before they sent their letter and again sometime in the next year, during which time some of them received a response. This design shows that individuals who received a response to their letter held significantly more positive views of their legislator. Consistent with the past literature on constituency service, they thought their MCs were doing a better job and were much more likely to indicate a likelihood of voting for their MC than those participants who had not received a response to their letter.
But receiving a response from their legislator had no impact on how constituents viewed Congress as an institution, the MC’s party, or MCs in general. There is no spillover effect from member responsiveness. While we cannot conclusively prove that there is no link between individual member activities and evaluations of Congress (perhaps a much stronger form of constituent service would produce an effect), these results should make us doubt that individual MC behavior can have much impact on citizen evaluations of national institutions. Receiving a letter moved constituents’ thermometer ratings by >10 points and yet had no effect on constituents’ attitudes toward Congress or the legislator’s party, suggesting that citizens are not using individual MC responses as a heuristic about the institution.
This project also demonstrates the power of research design to affect conclusions. The existing cross-sectional survey data pointed to the possibility of a spillover effect, albeit small. However, such data is likely to be affected by recall bias and other potential problems. When we use a stronger design that mitigates these biases, we found essentially no evidence of spillover effects to the parties or the Congress.
Still, like every design, our study had its own limitations. Our research focused on one issue area—immigration. Further research could expand to other policy domains and include more varied and substantial forms of constituent service. In addition, expanding the analysis to include non-student constituents who are more firmly settled in their communities could offer a helpful check on the representativeness of our results.
Finally, from an institutional perspective, our results confirm that increasing approval of Congress will not be easy and that any increase will not come from contact with one’s own member. Instead, voters evaluate Congress and the parties on one national track, largely beyond the individual representative’s control, and individual MCs on a related but ultimately separate and probably local track. Even if legislators never ran for Congress by running against the institution, perhaps we would still observe Fenno’s paradox because there is no spillover effect and because members have little incentive to proactively promote Congress as a whole. In turn, this implies that finding better candidates or encouraging incumbents to behave better will not solve any collective reputation issues for Congress or the parties. The primary route to a more respected Congress, we conclude, is for the institution to generate better policies that lead to better outcomes.
Acknowledgement
This study was supported by the Center for the Study of Electons and Democracy at Brigham Young University and a Field Experiment Grant from the Institution for Social and Policy Studies at Yale University. For research assistance, we would like to thank Lisa Argyle, Josephine Borich, Braidy Bundy and especially Jane Ann Fosson who ran the survey.


