

1. INTRODUCTION
Glaciers are among the most obvious indicators of ongoing climate change. Despite differences in local conditions and response times, glaciers globally show a largely homogeneous trend of retreat (WGMS, Reference Zemp2008, Reference Zemp2013; Zemp and others, Reference Zemp2015). Glaciers affect human activities in mountainous regions as well as the regional water cycle since glacier meltwater is an important source for drinking water and irrigation systems (Kaltenborn and others, Reference Kaltenborn, Nellemann and Vistnes2010; Kaser and others, Reference Kaser, Grohauser and Marzeion2010). Glaciers accumulate water as snow and ice during the cold or wet season and release it as meltwater during the dry or warm season when demand for water is largest in the downstream areas (Casassa and others, Reference Casassa, López, Pouyaud and Escobar2009). Glacier retreat and changes in the associated streamflow regime are therefore expected to have great socio-economic effect on populated areas that are dependent on glacier meltwater as water storage (Jones, Reference Jones1999), especially in the Himalayan mountains (Sharma and others, Reference Sharma, Vorosmarty and Moore2000; Bolch and others, Reference Bolch2012; Immerzeel and others, Reference Immerzeel, Pellicciotti and Bierkens2013). The Himalayas and the adjacent Tibetan Plateau are the source of three major river systems in South Asia: Indus, Ganges and Brahmaputra.
Due to limited accessibility and lack of observational data in glacierized regions of the Himalaya (Immerzeel and others, Reference Immerzeel, van Beck and Bierkens2010; Kumar and others, Reference Kumar2015; Shea and others, Reference Shea2015) glacio-hydrological modelling is a challenging task. Many key processes such as orographic precipitation gradients, glacier melt under debris cover and spatial and temporal variations of meteorological variables are poorly understood (Viviroli and others, Reference Viviroli2011; Ragettli and others, Reference Ragettli, Pellicciotti, Bordoy and Immerzeel2013). Mountain glaciers are very sensitive to climatic change (Zhou and others, Reference Zhou, Kang, Gao and Zhang2010; Engelhardt and others, Reference Engelhardt, Schuler and Andreassen2015) and most glaciers around the globe have been shrinking since the end of the Little Ice Age with increasing rates of ice loss since the early 1980s (Bolch and others, Reference Bolch2012; IPCC, Reference Stocker2013). However, large uncertainties are connected to recent glacier volume and mass changes in the Hindu Kush Himalayan region (Bolch and others, Reference Bolch2012; Kääb and others, Reference Kääb, Berthier, Nuth, Gardelle and Arnaud2012; Gardelle and others, Reference Gardelle, Berthier, Arnaud and Kb2013). Whereas glaciers in the Himalayas show a receding trend over the past decades, the so-called Karakoram anomaly shows that glaciers in Karakoram have a balanced mass budget at regional scale (Gardelle and others, Reference Gardelle, Berthier and Arnaud2012; Kääb and others, Reference Kääb, Berthier, Nuth, Gardelle and Arnaud2012) with some glaciers gaining mass (Hewitt, Reference Hewitt2005). Since most of these glaciers are located at high altitudes and difficult to access due to their remoteness and ruggedness, the collection of meteorological data for longer periods and maintaining their quality is challenging. However, the identification of glacier responses to climatic changes over these large and remote areas is needed to quantify glacier contribution to water resources (Immerzeel and others, Reference Immerzeel, Pellicciotti and Bierkens2013).
Extensive glacio-hydrological research has already been carried out in various mountain regions such as the Alps (Oerlemans, Reference Oerlemans2000), Norway (Engelhardt and others, Reference Engelhardt, Schuler and Andreassen2014), the Andes (Favier and others, Reference Favier, Wagnon, Chazarin, Maisincho and Coudrain2004; Gurgiser and others, Reference Gurgiser, Marzeion, Nicholson, Ortner and Kaser2013; Nicholson and others, Reference Nicholson, Prinz, Mölg and Kaser2013), the Tibetan Plateau (Mölg and others, Reference Mölg, Maussion, Yang and Scherer2012) and the Nepalese Himalaya (Kayastha and others, Reference Kayastha, Ohata and Ageta1999). To date, very few studies exist for the Indian part of the Himalayas (Koul and Ganjoo, Reference Koul and Ganjoo2010; Azam and others, Reference Azam2014a). Therefore, there is an urgent demand to increase knowledge about glacier changes in response to climatic changes in the Indian Himalayas (Koldunov and others, Reference Koldunov2016). Long-term glacier mass balance and associated run-off model simulations for high-altitude glacier catchments are necessary to relate the observed glacier changes to recent climatic changes. The goal of this study is combining downscaled climate data from different sources in order to evaluate glacier mass balance and associated runoff in the Indian state of Himachal Pradesh. We focus on Chhota Shigri Glacier and model glacier mass balance, equilibrium line altitude (ELA) and runoff of the catchment containing the glacier for a continuous period over the past 60 years.
2. STUDY AREA
Chhota Shigri (32.28°N, 77.58°E) is a north-facing valley glacier, located on the Pir Panjal Mountain Range in the Indian state of Himachal Pradesh in Western Himalaya (Fig. 1). With a glaciated area of ~16 km2 and a catchment area of ~35 km2 (Wagnon and others, Reference Wagnon2007; Ramanathan, Reference Ramanathan2011), almost 50% of the study area is covered by glaciers. Approximately 9 km in length, Chhota Shigri Glacier covers an elevation range from 4050 to 5830 m a.s.l. The surface slopes range between 10° and 45°, and the glacier snout is situated in a narrow valley. Runoff from the catchment collects in a single proglacial stream contributing to Chandra River, which is one of the tributaries of Chenab River in the Indus river system. Whereas the glacier tongue of Chhota Shigri is mainly oriented toward north, its tributaries in the accumulation area have a variety of orientations. In the accumulation area, the glacier consists of two main flows, of which the larger one is coming from the eastern side of the accumulation area. Debris that ranges from a few millimeters to boulders of several meters cover 3.4% of the glacier surface area (Vincent and others, Reference Vincent2013) and is located in the lower ablation area (<4500 m a.s.l.).
Landsat-8 OLI image from 28 September 2014 showing the catchment of Chhota Shigri Glacier (red contour) based on Wagnon and others (Reference Wagnon2007), the glacier area (green contour), the location of the temperature measurements (AWS-M) and the precipitation and run-off measurements at the Base Camp (L-BC). The inset picture shows the location of the study area (red star) in the Chenab River basin in North India.
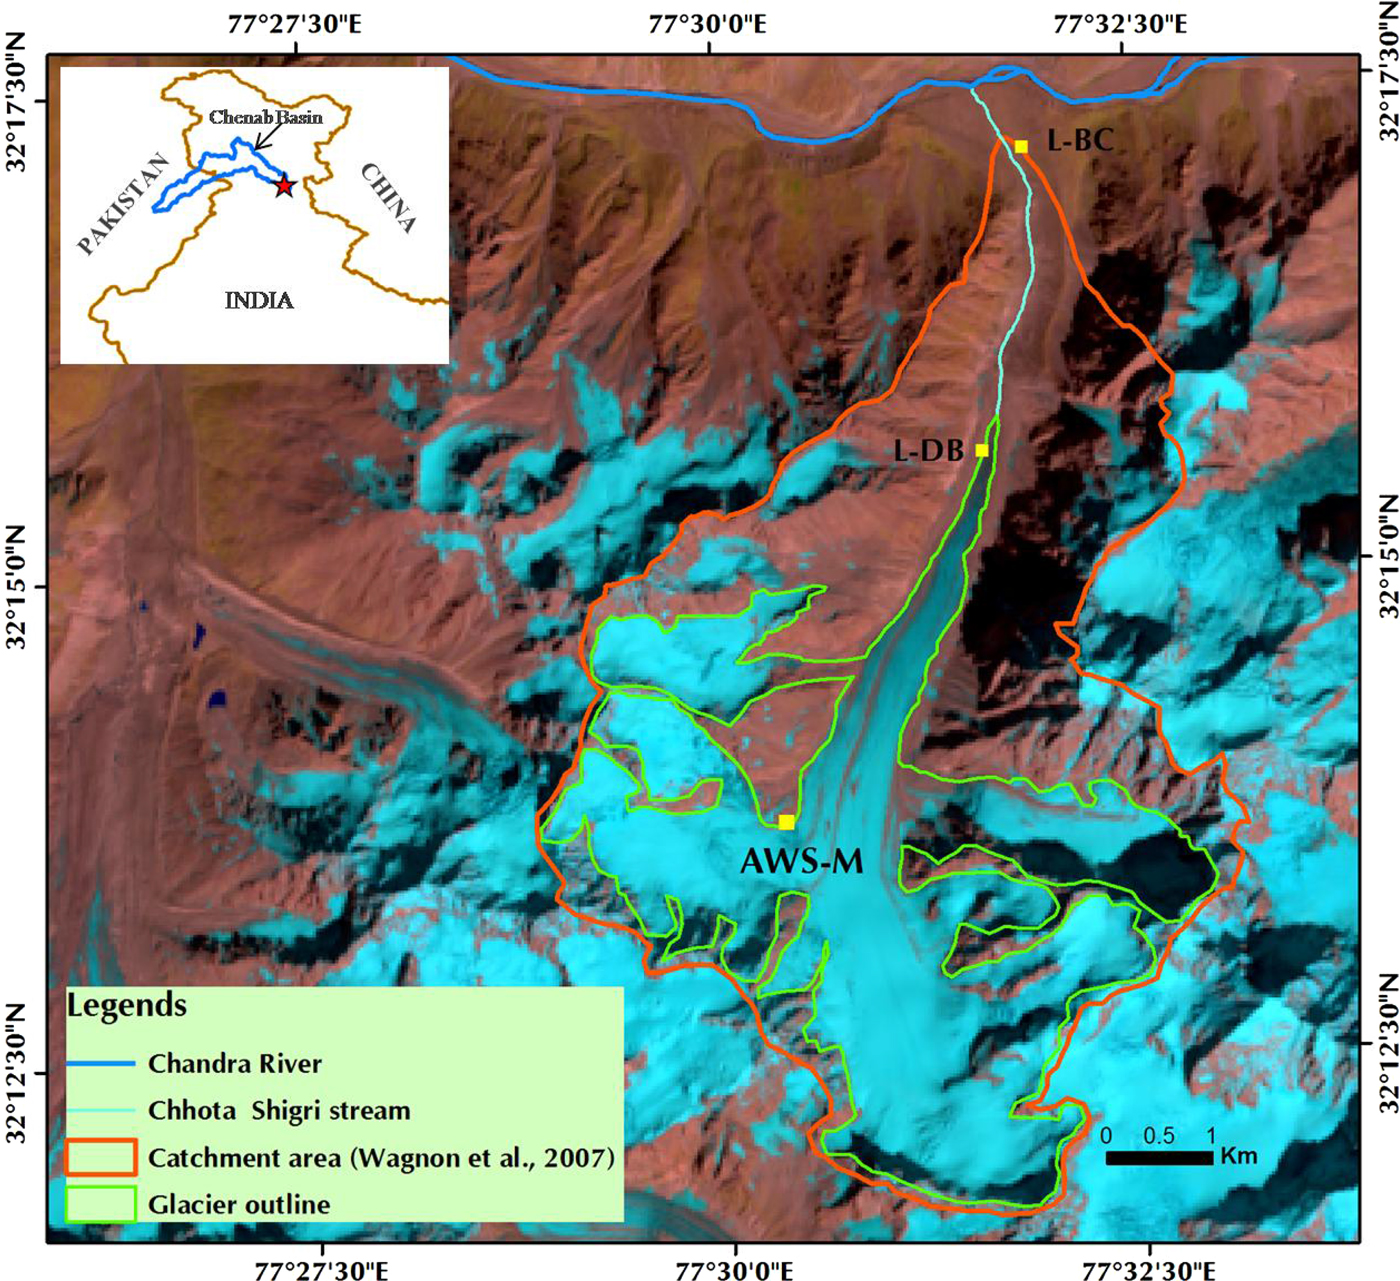
Chhota Shigri is situated in the monsoon-arid transition zone. Two distinct precipitation regimes are prevalent over this glacier basin, the Mid-Latitude Westerlies (MLW) and the Indian Summer Monsoon (ISM) (Bookhagen and Burbank, Reference Bookhagen and Burbank2010; Azam and others, Reference Azam2014a). Most of the precipitation occurs during the winter months (October–May) due to the MLW. For the hydrological year 2012/13, the ISM contributed only ~12% to the annual precipitation, with the majority being supplied by the MLW, as revealed by a precipitation gauge (Geonor T-200B) at Chhota Shigri Base Camp (3880 m a.s.l., L-BC in Fig. 1). For the same period, at a meteorological station at Bhuntar Airport (50 km southwest from Chhota Shigri, at 1092 m a.s.l.), the ISM contributed almost 50% of the annual precipitation (Azam and others, Reference Azam2014b). Therefore, the ISM is much more pronounced in Bhuntar than in the area of Chhota Shigri Glacier.
At Chhota Shigri Glacier, ground-based surface mass-balance measurements have been carried out continuously since 2002 (Ramanathan, Reference Ramanathan2011), which makes it the longest series of continuous mass-balance data available in the entire Himalayan region (Azam and others, Reference Azam2016). According to these data, the mean annual glacier-wide mass balance between 2003 and 2014 is −0.56 (±0.40) m w.e. a−1. In situ geodetic measurements by Vincent and others (Reference Vincent2013) between 1988 and 2010 revealed a moderate mass loss over this period of −3.8 (±2.0) m w.e., corresponding to −0.17 (±0.09) m w.e. a−1. Further, Azam and others (Reference Azam2014b) reconstructed the annual mass balances of Chhota Shigri Glacier to be on average −0.30 (± 0.36) m w.e. a−1 for the period 1969–2012, using the long-term meteorological data record from Bhuntar Airport.
Close to the glacier surface, on a side moraine, an automatic weather station (AWS) was installed in summer 2009 at an elevation of 4863 m a.s.l. (AWS-M in Fig. 1), recording air temperature, relative humidity, wind speed and direction, and radiation components. A discharge station was installed close to the Base Camp at the outlet of the Chhota Shigri catchment (32.2871°N, 77.5293°E, 3852 m a.s.l.) and ~2 km downstream from the glacier snout in 2009 (Ramanathan, Reference Ramanathan2011). The station consists of an automatic level gauge, thus enabling continuous runoff measurements during the ablation season (June to mid-October). Average runoff is ~5 m3 s−1 during this period, and peak runoff is normally in July and exceeds 10 m3 s−1.
3. METHODS
3.1. Data input
To represent the study area in a model, we used the glacier outlines from the Global Land Ice Measurements from Space (GLIMS) glacier database (Raup and others, Reference Raup2007). The modelled glacier area comprises the outline of the main part of Chhota Shigri Glacier (14.7 km2) and adjacent glacierized areas (1.5 km2) contributing to the outflow of the catchment and are hereafter referred to as Chhota Shigri Glacier. This corresponds to Wagnon and others (Reference Wagnon2007), who give 16.3 km2 for the total glacierized area. The modelled catchment areas comprise both the glacierized and non-glacierized areas upstream from the discharge station. The catchment area is 34.8 km2, yielding a relative glacierized area of 46.5%.
The elevation of the model area is taken from a DEM, which is derived from the Shuttle Radar Topography Mission (SRTM) data of the US Geological Survey (USGS) (http://earthexplorer.usgs.gov). The DEM is available at a resolution of 1 arcsec (≈30 m). This high-resolution DEM was also used to calculate potential solar radiation for each gridpoint within the model domain and for each day of the year. The calculation accounted for slope, aspect as well as shading effects from the surrounding topography in and outside the model domain.
Meteorological input for the model are daily 2 m air temperature and precipitation values from simulations with regional climate models (RCMs). In order to cover a very long study period, we used simulations of three different RCMs with increasing resolution but decreasing time coverage (Table 1).
Overview of the used RCM simulation datasets
The RCA4 simulations cover the Coordinated Regional Climate Downscaling Experiment (CORDEX, http://www.cordex.org) South Asia domain. The REgional atmosphere MOdel (REMO) simulations were integrated over the South Asia domain (see Kumar and others, Reference Kumar2015). The performance of REMO in this region was evaluated in several studies (Jacob and others, Reference Jacob2012; Saeed and others, Reference Saeed, Hagemann and Jacob2012; Kumar and others, Reference Kumar2015). The Weather Research and Forecasting (WRF) Model (version 3.7.1) simulations were performed over a domain centered on Chhota Shigri Glacier. Whereas the RCA4 data use global climate model (MPI-M-MPI-ESM-LR historical scenarios) data as forcing, the REMO simulations are forced directly by the ERA-Interim reanalysis data (Dee and others, Reference Dee2011). The WRF simulations are performed with a nested domain at 5 km grid spacing for the inner domain and 25 km grid spacing for the outer domain, which is forced with the ERA-Interim reanalysis data.
The horizontal interpolation of the RCM data to the model domain was achieved by bilinear interpolation of the values from the four closest RCM gridpoints around the model domain to each model gridpoint. The vertical adjustment of the temperature and precipitation data over the model domain is performed by using the average temperature lapse rates and precipitation gradients of the respective RCM simulations.
In order to calibrate the gained temperature and precipitation datasets, we compare the horizontally interpolated and vertically adjusted temperature and precipitation values from the WRF simulations with the measurements from the AWS and the precipitation gauge, respectively. For temperature, a bias correction is performed using the bias between the monthly mean temperatures from the RCM data and the observed monthly mean temperatures of the period of available measurements (2010–13). After the calibration of the high-resolution WRF data, the homogenization of the other two RCM simulations is carried out by a bias correction to fit the monthly mean temperatures in the overlapping periods (i.e. 2010–13 between the REMO and WRF simulations and 1989–2005 between the RCA4 and REMO simulations).
For precipitation, a similar approach was performed, starting with the measured total annual precipitation of the hydrological year 2012/13. Since only 1 year of precipitation data was available for this study, the total annual precipitation was used for calibration instead of total monthly precipitation.
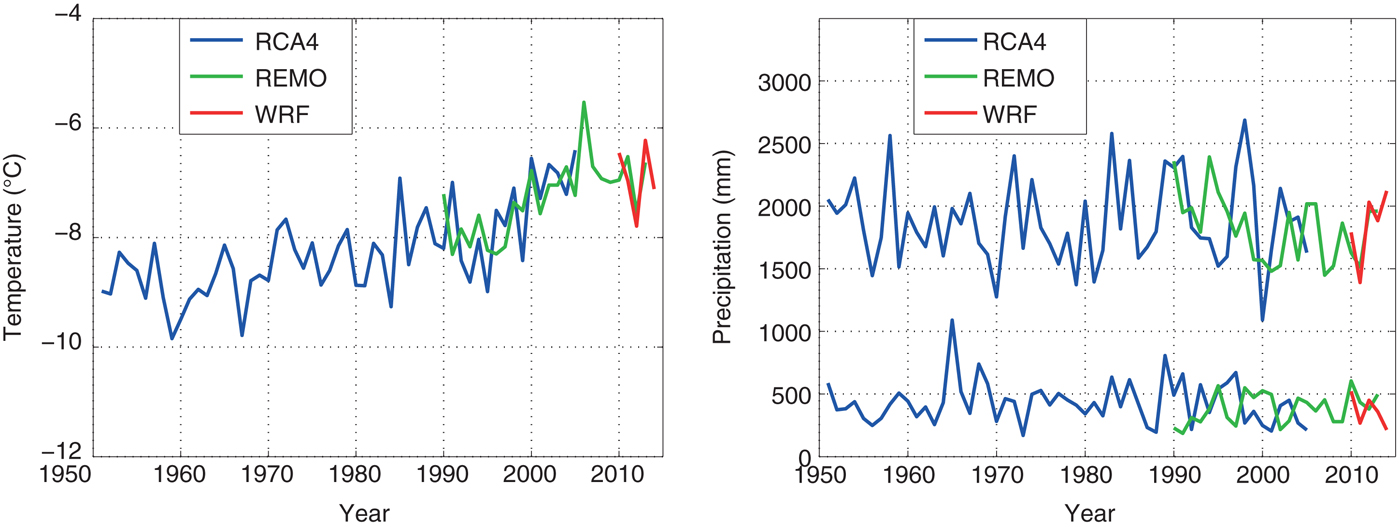
Applying these methods, we obtain daily temperature and precipitation values for a 64-year long simulation period (1951–2014), using the RCA4 dataset for 1951–1988, the REMO dataset for 1989–2009 and the WRF dataset for 2010–14. The average temperature and precipitation values for the model domain range from −9.8 to − 5.5°C for annual air temperature and from 1278 to 2605 mm for total annual precipitation (Fig. 2). Approximately 20% of the total annual precipitation occurs in the months June–September and can be attributed to the ISM, whereas the remaining 80% during October–May can be attributed to the MLW.
Mean annual air temperature (left) and total annual precipitation (right) as well as summer precipitation (June–September, lower lines), calculated from the daily values of the three available RCM datasets. The shown data are an average over the model domain.
The temperature and precipitation values of the respective other RCM dataset in the overlapping periods (1989–2005 and 2010–13) were used to quantify the uncertainty of the model results to the RCM data input.
3.2. Mass-balance model
A grid-based mass-balance model was setup with a horizontal grid resolution of 10 arcsec (≈300 m). The model uses daily temperature and precipitation values for each model gridpoint as input. The model simulation was performed with a daily time step for the period of available input data (1951–2014), individually for all gridpoints representing an area that is at least partly inside the model domain (catchment). Changes of the glacier areas during the model period are small compared with the 300 m horizontal grid resolution and were not accounted for. Precipitation was accumulated as snow when the air temperature was lower than the threshold temperature for snowfall (T s) with a transition interval of 2 K where the precipitation gradually shifts from snow to rain. Daily melt of snow and ice M snow/ice was calculated when the air temperature was above the threshold temperature for melt (T m) using a distributed temperature-index approach including potential direct solar radiation (see Pellicciotti and others, Reference Pellicciotti2005):
 $${M}_{\rm snow/ice} = \max [C \cdot (T - T_{\rm m}) + R_{{\rm snow}/{\rm ice}} \cdot I,0],$$
with the melt factor C, the radiation coefficients R for snow and ice, the potential direct solar radiation I and the air temperature input T. The use of potential solar radiation is a way to account for melt events due to high solar radiation intensity at relatively low temperatures. The model parameters were optimized to achieve best agreement between simulated and observed annual mass balances available for the simulation period. To retrieve the seasonal mass balances from the diurnal mass-balance series, we defined start and end of each season as the day when the glacier-wide mass balance was at its annual maximum (end of the winter season) or at its minimum (end of the summer season). To build up reasonable snow cover on the glacier surface, we use the period 1951–54 as a model spin-up.
3.3. Calibration of model parameters and validation of model performance
For the calibration scheme, we applied the Monte Carlo method using 10 000 parameter sets consisting of five parameters, which are varying independently from each other within a plausible range (Table 2). The model was calibrated with the available measured annual glacier mass balances, which are available for the period 2003–14 (Azam and others, Reference Azam2016). The mean annual mass balance of the measurements is −0.56 m w.e. a−1. The uncertainty of these measurements is given by ±0.4 m w.e. a−1 (Azam and others, Reference Azam2012).
Average and uncertainty of the five model parameters
From the 10 000 parameter sets, we selected the best 100 model runs yielding the lowest RMSE values between the measured and modelled mass balances. The uncertainty of each of the model parameters is given by its range within the 100 best parameter sets (Fig. 3).
Uncertainty of the model parameters for threshold temperatures (left), radiation factors (middle) and degree day factor (right).
Using each of the best 100 parameter sets as an individual model setup provides the range of the glacier mass balances due to the model parameter uncertainty. The mean modelled annual mass balance for the calibration period is −0.50 m w.e. a−1, surrounded by a range due to model parameter uncertainty from −0.43 to −0.56 m w.e. a−1. Given the uncertainty of the measurements of 0.4 m w.e. a−1, the model reproduces the annual mass balance well for 7 out of the 12 years of the calibration period. However, the annual mass balances for 2003, 2004 and 2006 are simulated too high, and for the years 2010 and 2011 they are too low (Fig. 4), yielding a RMSE between measured and modelled mass balances of 0.46 m w.e. a−1.
Measured (Azam and others, Reference Azam2016) and modelled annual mass balance for the calibration period (2003–14). The range of the curves reflects the model parameter uncertainty.

For validation of the model performance, we compare the simulated mass balances for Chhota Shigri Glacier to measurements from three studies that used different methods and time periods. Geodetic measurements calculating the differences between SRTM data from 2000 and a DEM from 2004 are provided in Berthier and others (Reference Berthier2007), and differences between two DEM for three periods are provided in Vincent and others (Reference Vincent2013). Whereas we obtain less negative values for the period 1999–2004, we get more negative annual mass balances for 1988–2010 (Table 3). For the period 1999–2011, we obtain mass-balance values, which are in the range of the geodetic measurements.
Validation of model results with geodetic measurements
All values are given in m w.e. a−1.
* Using different density assumptions.
† Using different methods.
The uncertainty estimates of the model results (U mod) are the geometric mean of the model parameter uncertainty (U mp) and the uncertainty due to different RCM data input (U RCM):
 $$U_{{\rm mod}} = \sqrt {U_{{\rm mp}}^2 + U_{{\rm RCM}}^2}. $$
A second validation dataset constitutes the model approach by Azam and others (Reference Azam2014b), where meteorological measurements for Bhuntar Airport (50 km southwest of Chhota Shigri) have been used to calculate glacier mass balances for 1969–2012. Here, we obtain similar values for the periods 1969–1985 and 2001–12, and the lower mass-balance values for the period 1986–2000 are still within the range of the uncertainties (Table 4).
Validation of model results with a model approach using meteorological measurements (from Bhuntar Airport) as input
All values are given in m w.e. a−1.
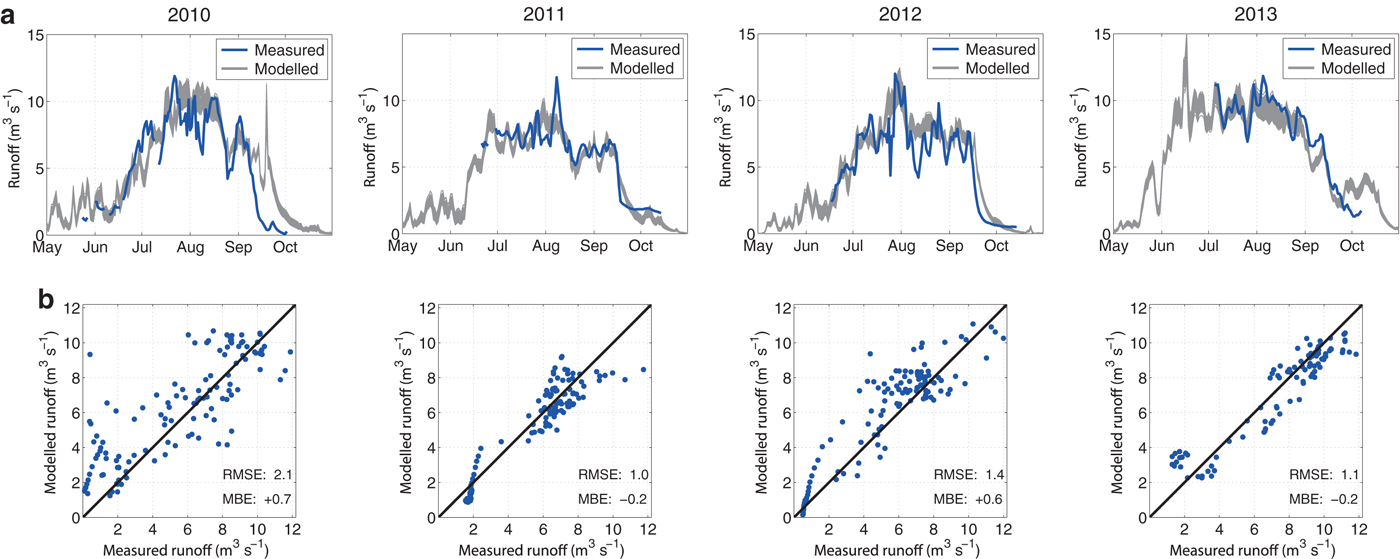
The run-off measurements taken downstream of the glacier in the years 2010–13 are also a source for validating the model. The mean daily run-off measurements are compared with the corresponding modelled results from the catchment of Chhota Shigri Glacier. The modelled results agree well with the measurements (Fig. 5a). For the daily values of the whole period, the RMSE is 1.5 m3 s−1 and the mean bias error (MBE) +0.2 m3 s−1 (Fig. 5b). The model performance suggests that the simulations are suitable to reproduce both glacier mass balances and runoff for the study area.
(a) Mean daily runoff during the years of available run-off measurements (2010–13). The range of the curves reflects the model parameter uncertainty. (b) Modelled versus measured runoff for each day of available measurements. For each season the root mean square error (RMSE) and mean bias error (MBE) (in m3 s−1) are indicated.
4. RESULTS
4.1. Glacier mass balance
The period 1951–54 was used as model spin-up and precedes the evaluation period (1955–2014). The simulated mass balances for the catchment of Chhota Shigri Glacier (16.2 km2) show a large year-to-year variability with values between +0.6 and +1.9 m w.e. a−1 for the winter mass balances and between −0.8 and −2.3 m w.e. a−1 for the summer mass balances (Fig. 6). For the winter balances, no obvious trend during the evaluation period can be detected with only ~0.2 m w.e. a−1 higher values in the period 1985–1999. The summer balances however decrease by ~0.5 m w.e. a−1 gradually during the model period from −1.24 (±0.33) m w.e. for the period 1955–69 to −1.75 (±0.33) m w.e. for the period 2000–14 (Table 5). Especially during the period 2000–14, the decrease of the summer mass balances becomes more noticeable compared with the previous periods. During the whole period of 1955–2014, the annual mass balances vary between −1.2 and +0.5 m w.e. a−1 with no obvious trend until the end of the 1990s, followed by a decline to −0.57 (±0.33) m w.e. for the period 2000–14 due to both decreasing winter and decreasing summer mass balances. The cumulative mass balance for the whole evaluation period 1955–2014 is −21 (±4) m w.e. The uncertainty of the model parameter is calculated to be 0.08 m w.e. a−1 (indicated by the spread of the lines in Fig. 6), whereas the uncertainty to the RCM data input is calculated to 0.32 m w.e. a−1 between the RCA4 and REMO datasets, and 0.11 m w.e. a−1 between the REMO and WRF datasets (indicated by grey lines in Fig. 6).
Simulated annual glacier mass balances of Chhota Shigri (middle black curve) and winter and summer mass balances (upper and lower black curves, respectively) from 1955 to 2014. The grey lines are the calculated mass balances of the other available RCM input data in the overlapping periods, representing the uncertainty due to RCM input. The range of the curves reflects the model parameter uncertainty.
Simulated mean seasonal and annual mass balances and mean ELA for Chhota Shigri Glacier
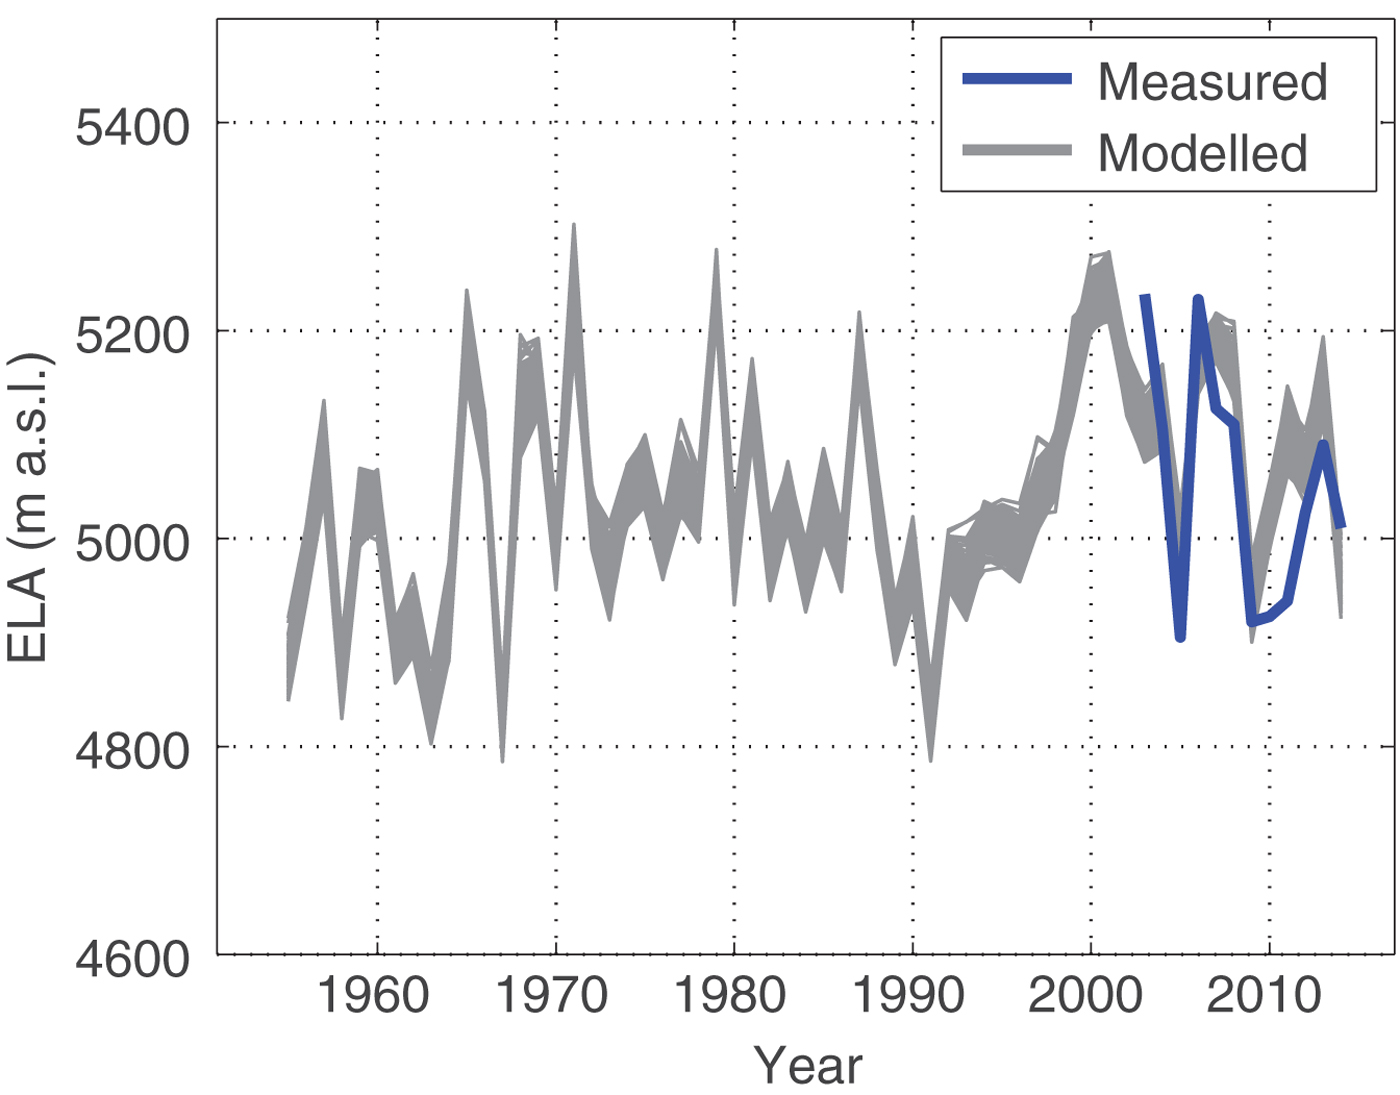
Closely related to the annual mass balances is the ELA. We calculate the ELA for each year of the model period by applying a linear regression using all annual mass balances of the model gridpoints between −1 and +1 m w.e. The combined uncertainty of the ELA due to both the parameter uncertainly (~38 m) and the uncertainty to the RCM data input (~71 m) is ~80 m. The simulated ELA at Chhota Shigri is on average 5032 (±80) m a.s.l. and varies for the evaluation period between 4813 (±79) and 5246 (±78) m a.s.l. (Fig. 7). The rise of the ELA between the periods 1955–69 and 2000–14 is more than 100 m (Table 5) representing ~15% of the glacier surface area.
Simulated annual ELA of Chhota Shigri from 1955 to 2014. The range of the curves reflects the model parameter uncertainty, which is on average 38 m. Measurements (from Azam and others (Reference Azam2016)) are indicated in blue.
4.2. Runoff
Average annual modelled runoff during the period 1955–2014 is 2.2 m3 s−1 and average modelled runoff for July and August is 7.0 m3 s−1. Snowmelt (combined from within and outside the glacier areas) accounts for ~50% of the annual runoff, and glacier melt (i.e. ice and firn melt) accounts for about one-third and the rain for the remaining part (Table 6). The uncertainties of the run-off values due to the model parameters are ~±0.1 m3 s−1 for each of the mean annual run-off values and ~±3% for the contributing sources. Uncertainties related to the use of different RCM datasets are calculated to be additional ±0.1 m3 s−1 for run-off values and ±5% for the contributing sources.
Simulated mean annual runoff and contributing sources for the catchment of Chhota Shigri, and mean temperature and precipitation values (averaged over the catchment area)
From period 1 (1955–69) to period 2 (1970–84), precipitation remained almost constant, but average runoff increased from 1.95 to 2.22 m3 s−1 due to both increased snowmelt and increased glacier melt (Table 6). From period 2 (1970–84) to period 3 (1985–99), the increase in precipitation by 10% led to unchanged mean runoff, due to a decrease in glacier melt. Although the mean total annual precipitation decreased from period 3 (1985–99) to period 4 (2000–14) by 12%, runoff increased between these periods by ~7%, mainly due to increased glacier melt. The relative contribution of glacier melt to annual runoff increased from period 3 to 4 from 29% to 37%. The increase in glacier melt was mainly due to the increase in mean annual air temperature between periods 3 and 4 by 1.0 K, but also due to less precipitation and a resulting earlier snow disappearance and onset of glacier melt.
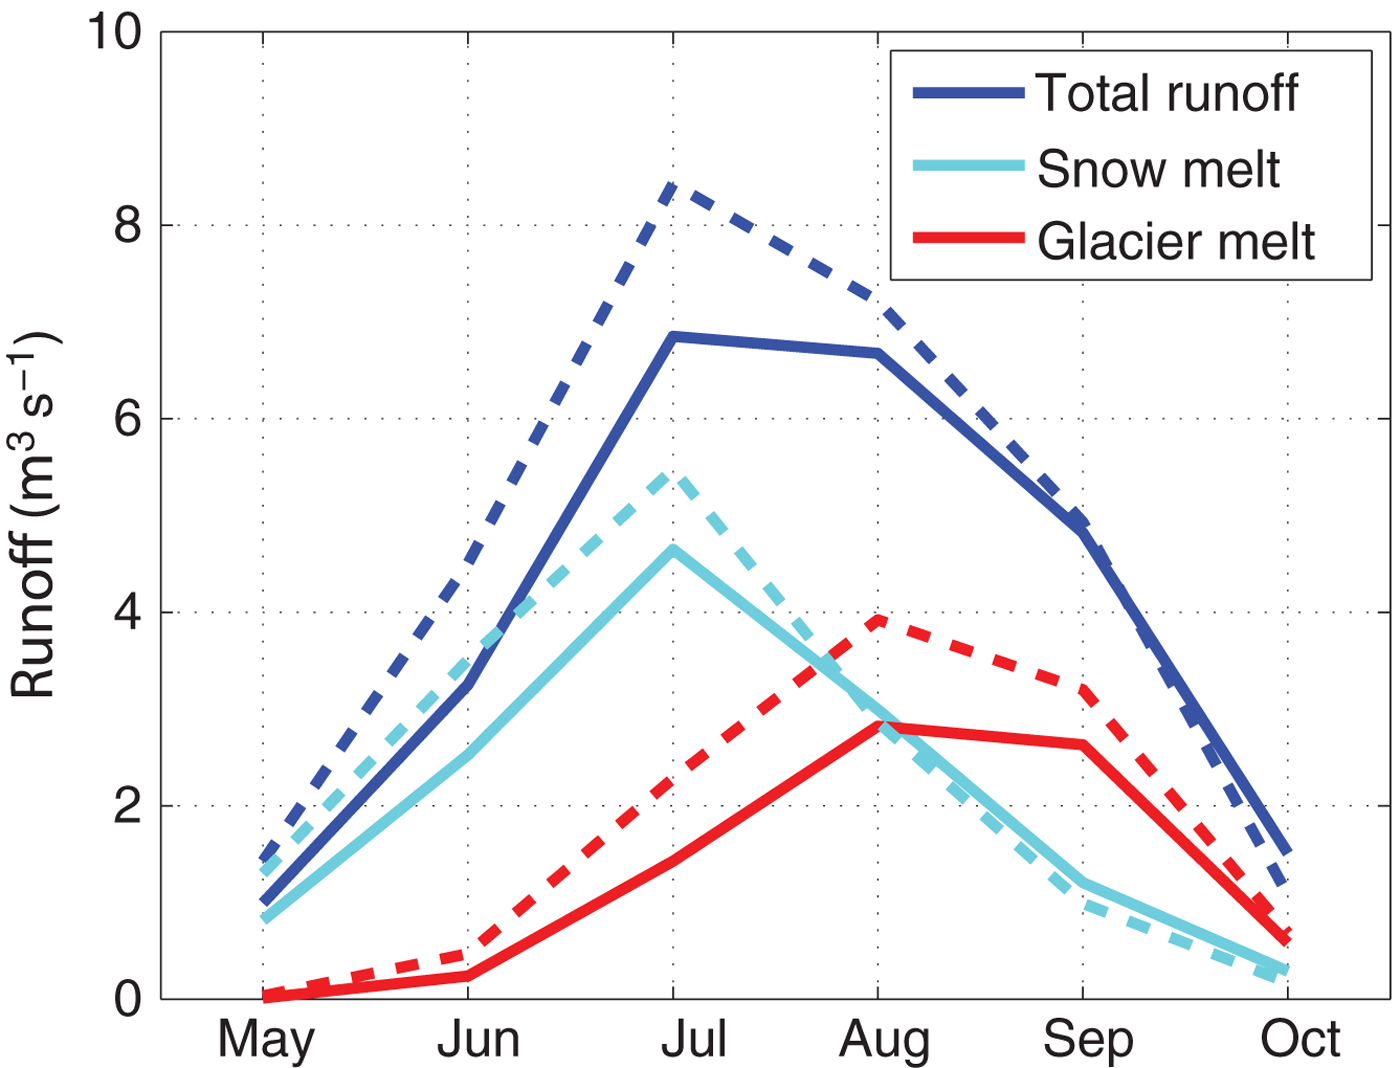
Average runoff for the months from June to September is larger than for the annual average with a peak in July. For the months May–August, the most recent period (2000–14) shows more runoff than in the previous periods, whereas runoff is unchanged in September and decreased in October (Fig. 8). The relative glacier melt contribution to runoff increases during the ablation season from ~10% in June, 25% in July, 50% in August–September when more than 50% of the runoff is originating in glacier melt (Fig. 8), whereas the relative contribution from snowmelt to runoff decreases from ~80% in June to ~20% in September. Increasing snowmelt from May to July and increased glacier melt from July to September were the main reasons for an increase in total runoff between the periods 1955–99 and 2000–14, which is the most pronounced for July (Fig. 8). The beginning of a shift of the runoff regime towards an earlier onset of snowmelt and larger peak in July becomes visible, whereas increased glacier melt compensates for decreased snowmelt in August and September.
Mean monthly runoff and relative run-off contribution from snowmelt (cyan) and glacier melt (red). Values are averages for the periods 1955–99 (bold lines) and 2000–14 (dashed lines).
5. DISCUSSION
Modeling glacier mass balances over a long time period is a challenge due to the importance of local effects on temperature lapse rate or precipitation gradients (A. Mandal, A. Ramanathan, M. Engelhardt and A. Nesje, unpublished data) that are not represented sufficiently in the input data. This could lead to a wrong calculation of local mass-balance gradients. Some uncertainty is related to the temperature and precipitation input datasets for the years 1951–88, which are available at 50 km horizontal resolution, where small precipitation events cannot be resolved appropriately. In addition, these data are based on global climate model data and not on ERA-Interim reanalysis data. However, the large overlapping period of 17 years (1989–2005) allows a suitable bias correction of these data.
Our model results show the mass-balance distribution for a fixed glacier surface over the model period representing a reference surface mass balance (Elsberg and others, Reference Elsberg, Harrison, Echelmeyer and Krimmel2001; Cogley and others, Reference Cogley2011). We choose to use a reference surface since changes in glacier mass balance of a reference surface are more directly linked to climate variations. In addition, the measured surface mass balances, which are used for model calibration are based on a glacier area that has only changed from 15.62 km2 in 2005 to 15.48 km2 in 2014 (Azam and others, Reference Azam2016). Although the debris coverage of Chhota Shigri of 3% is relatively small compared with other Himalayan glaciers, debris is found towards the snout of Chhota Shigri. As a consequence, the snout experienced little recession in recent years and the reduction of the glacier area due to melting is much lower than the negative annual mass balances would suggest and also small compared with the model resolution of 300 m. Moreover, according to a study of Swiss glaciers performed by Huss and others (Reference Huss, Hock, Bauder and Funk2012) about half of the mass-balance offset by using reference instead of conventional surface mass balance is compensated by more negative mass balance due to reduced surface heights.
Uncertainties in the mass-balance measurements give rise to imperfect parameter calibrations. Differences between geodetic and direct methods are found at many glaciers (Krimmel, Reference Krimmel1999; Fischer, Reference Fischer2011). These can be due to either incorrect interpolations of point measurements or measurement uncertainties of each of the methods (Rolstad and others, Reference Rolstad, Haug and Denby2009).
The calibrated empirical parameters do not necessarily represent the glacier melt physics. However, the low melt threshold factor of −1.9 (±0.6)°C reflects the typical situation of many areas in the Himalayan mountains, where melt occurs on sunny days with high insolation and positive temperatures during daytime, when daily average temperatures are yet below freezing point (Pellicciotti and others, Reference Pellicciotti, Buergi, Immerzeel, Konz and Shrestha2012). The need of a lower melt threshold temperature was also outlined in a study by van den Broeke and others (Reference van den Broeke, Bus, Ettema and Smeets2010) conducted for Western Greenland, where it was discussed to use threshold temperatures down to −5°C.
Using the published mass-balance measurements for parameter calibration, the best 100 parameter sets yield an average RMSE value of 0.46 m w.e. a−1 between measured and modelled mass balances. This relatively high value is because mass balances in 3 of the 12 years are simulated too high and in 2 years too low (Fig. 4). Crucial for the mass-balance modelling is the correct representation of precipitation as snow or rain, since snow events during summer drastically reduce melt after such events due to the high albedo of the fresh snow. Azam and others (Reference Azam2014a) concluded that summer snowfall events are among the dominating factors for mass balance on Chhota Shigri, where snow events are possible even during the warmest months. The snow/rain distribution in our model (Fig. 9) is quite similar to the high-altitude precipitation measurements at Kaza (≈50 km east of Chhota Shigri) as revealed by Tawde and others (Reference Tawde, Kulkarni and Bala2016). Kaza is located in the same valley as the outflow of Chhota Shigri (Lahaul Spiti valley) and thus also north of the orographic barrier. It mimics the patterns of precipitation in the RCM datasets for Chhota Shigri. The precipitation pattern at Bhuntar is especially in summer quite different to the precipitation at Chhota Shigri (Fig. 5 in Azam and others, Reference Azam2014a). For the years 2010 and 2011 however, the annual mass balances in our model simulations are too low. This might indicate an inadequate representation of the ISM in the RCM data in these years, or too high air temperatures on some days, since air temperature by controlling the precipitation phase (rain versus snow) indirectly influences glacier mass balance.
Mean monthly precipitation sum from the RCM datasets, provided to the mass-balance model as snow (grey) and rain (black). Values are averages for the period 1951–2014.
Although the annual mass balances decreased by ~0.4 m w.e. a−1 between periods 1 and 4, the long-term changes of the annual glacier mass balances are less pronounced compared with changes in other regions of the world (Engelhardt and others, Reference Engelhardt, Schuler and Andreassen2013; WGMS, Reference Zemp2013).
The increase in precipitation in the period 1985–99 compared with the previous periods resulted in increased winter mass balances and reduced glacier melt during the ablation period. Azam and others (Reference Azam2012) already suggested that Chhota Shigri experienced a period of slightly positive or near-zero mass balance at the end of the 20th century. We found a glacier in balanced condition for the period 1989–96. Combining geodetic measurements between 1988 and 2010 and 1999 and 2011 (and using ground-based measurements in the year 2010/11), Vincent and others (Reference Vincent2013) give a mean annual mass balance for the period 1988 and 1999 of +0.09 (±0.24) m w.e. For this period, our model results yield on average −0.16 m w.e. Given the mentioned uncertainties, we consider our model results in good agreement with these independent studies.
Precipitation during the ISM period (June–September) is ~20% of the annual precipitation sum in the input data and corresponds to the measurements taken at the Base Camp close to the glacier in the hydrological years 2013 (Azam and others, Reference Azam2014b) and in 2015 (A. Mandal, A. Ramanathan, M. Engelhardt and A. Nesje, unpublished data). This is significantly <50% ISM contribution to the precipitation values measured at Bhuntar Airport, which were used in the study by Azam and others (Reference Azam2014b). Higher ISM precipitation values lead to a higher possibility of summer snowfall events that are followed by a period of significantly reduced melt. The difference in precipitation input data of the study by Azam and others (Reference Azam2014b) and the present study might be the main reason for the difference in modelled annual mass balance for the period 1986–2000.
6. CONCLUSION
For the period 1955–2014, glacier mass balances were simulated for Chhota Shigri Glacier (16 km2) and runoff was calculated for the catchment (about twice the size) containing the glacier. The mean annual mass balances of Chhota Shigri are on average slightly negative at −0.34 (±0.33) m w.e. a−1 for the whole evaluation period (1955–2014), and ~−0.6 m w.e. a−1 for the most recent period (2000–14). Mean annual runoff is on average ~2.2 m3 s−1, but increased to ~2.4 m3 s−1 for 2000–14.
Whereas mean annual precipitation did not experience large changes, mean annual air temperature increased by ~2 K during the evaluation period. This leads to an increase in runoff, and especially in late summer to increased glacier melt and a higher relative contribution of glacier melt to the total runoff. Thus, especially in late summer, runoff becomes more vulnerable to variations in summer temperatures and summer snowfalls, which alter the contribution of glacier melt to runoff.
Continuation of the mass-balance measurements is essential since a longer series of uninterrupted mass-balance measurements would strengthen the model calibration. With retreating glaciers, a major change in river runoff can be expected. There is still a need for extending the model approach to other glaciers in the region since the simulation of glacier mass balance and runoff for larger regions is necessary to estimate future developments of glaciers and run-off regime for the coming decades.
ACKNOWLEDGEMENTS
We thank Scientific Editor Joseph Shea and three anonymous reviewers who have significantly improved this paper. The study is part of the GLACINDIA project, funded by the Norwegian Research Council, and the Department of Science, Government of India (Project no. INT/NOR/RCN/P-04/2013). This study was partially supported by the funding from the Federal Ministry of Education and Research, Germany, for the GLACINDIA project (contract 033L164) and REMO simulations were performed at the Climate Computing Center Germany (DKRZ). We thank the Department of Science and Technology, Government of India and the Jawaharlal Nehru University for support and Nikolay Koldunov from the Climate Service Center Germany for valuable input. We acknowledge the World Climate Research Programme's Working Group on Regional Climate, and the Working Group on Coupled Modelling, former coordinating body of CORDEX and responsible panel for CMIP5. We also thank the climate modelling groups (listed in the Methods) for producing and making available their model output. High-performance computing support for the WRF simulations was provided by NCAR's Computational and Information Systems Laboratory, sponsored by the US National Science Foundation (NSF). We also acknowledge the Earth System Grid Federation infrastructure, an international effort led by the US Department of Energy's Program for Climate Model Diagnosis and Intercomparison, the European Network for Earth System Modelling and other partners in the Global Organisation for Earth System Science Portals (GO-ESSP). The Landsat-8 OLI data, courtesy of the US Geological Survey, were downloaded from EarthExplorer. We thank all field assistants and porters of the Chhota Shigri field campaigns and their effort to carry out fieldwork in often harsh conditions of the Himalayan environment.
CONTRIBUTION STATEMENT
M. Engelhardt designed the study, performed all calculations and data analysis, and wrote the paper. AL. Ramanathan and A. Mandal provided the air temperature, precipitation and runoff measurements and Figure 1. T. Eidhammer and R. Rasmussen provided the WRF data; P. Kumar provided the REMO data; and O. Landgren provided the RCA4 data.


 Open access