


Introduction
Five bore holes have been drilled along a flow line on the Barnes Ice Cap (Fig. 1). Temperature and deformation measurements are being made in these holes, and cores were recovered from four of them at depth intervals of 15 to 30 m for fabric studies. Eight additional cores, referred to as surface samples, were obtained from depths of 0.5 to 1.5 m at various locations between the lower three holes.
Map of the south dome of Barnes Ice Cap showing bore-hole locations.

In this paper we discuss in detail only the core data. Some of the temperature and deformation measurements will be cited where relevant, but analysis of these measurements is not yet complete.
Studies over a period of nearly a decade have yielded a substantial body of data on this flow line. Detailed surface-velocity and surface-strain-rate measurements were made from the divide to the margin between 1970 and 1971 (Reference HoldsworthHoldsworth, 1975), and are being repeated along the lower forty per cent of the flow line at present (unpublished data of R. L. Hooke). Ice thickness was determined by radio depth-sounding in 1970 (Reference JonesJones, 1972). Mass-balance measurements were started in 1970 (Reference HoldsworthHoldsworth, 1975) and have been continued up to the present (unpublished data of R. L. Hooke).
The mass-balance data and preliminary analysis of temperature profiles suggest that the equilibrium line is between holes T061 and T081 (Fig. 1) (Reference Hudleston and HookeHudleston and Hooke, in press).
Terminology
Following Reference Gow and WilliamsonGow and Williamson (1976) we use fabric to refer to the pattern of orientation of c-axes, and texture to refer to the size and shape of ice crystals seen in thin section. Actually fabric is not entirely independent of texture as certain textures are always found with the same fabrics. The term cell is used for the two-dimensional figure formed by the intersection of the plane of the thin section with the three-dimensional crystal. In coarse-grained ice two or more cells may be from the same crystal. A particle of ice follows a particle path through time. A flow line or flow plane is a roughly vertical surface, commonly approximately planar, containing one or more particle paths. In an ideal two-dimensional glacier, flow planes would be strictly planar, but in Nature they will invariably deviate somewhat from this ideal.
Bore-hole and surface-sample numbers give the approximate distance of the hole or sample from the divide and the prefix “T” designates a bore hole. Thus T061 is a bore hole approximately 6.1 km from the divide and 0855 is a surface sample approximately 8.55 km from the divide.
Procedure
Drilling and coring
The holes were drilled with an electrical hot point (Reference Hooke and SplettstoesserHooke, [c1976]); a core barrel which was interchangeable with the hot point was used for sampling. The decision to use this procedure rather than continuous coring was dictated by the economics of drill design and of core handling and storage. The hot point makes a 9 cm hole and the core barrel takes a 6 cm core with a maximum length of about 0.9 m. Cores are commonly broken into two or three segments upon arrival at the surface, but fracture patterns and bubble elongation usually permit unequivocal realignment of the segments.
Fabric diagrams
Cores are stored in an ice tunnel excavated in the glacier margin and are studied in a cold laboratory at the end of the tunnel. Temperatures in the tunnel are about − 10°C early in the season, but rise to about −6°C by the end of July. Most cores are studied during the season in which they are collected; repeated studies of some of these same cores in subsequent seasons, using both the original and new thin sections, have given no evidence for recrystallization.
Each core is first described, noting bubble concentration and elongation, dirt bands, and foliation. A reference line is then scribed along the core and oriented with respect to the direction of bubble elongation, if any. Finally, thin sections are prepared. Initially most sections were cut perpendicular to the core axis, but in deeper cores which have quite large crystals, sections were also cut either parallel to or at 45° to the axis. The spacing between thin sections was much greater than the mean cell size in the sections, but in some cases was only slightly greater than the maximum cell size.
Orientations of c-axes were measured on a Rigsby universal stage using standard techniques (Reference LangwayLangway, 1958; Reference KambKamb, 1962), and the data were plotted in equal-area stereographic projection. All measurements were rotated to horizontal so that a crystal with a vertical c-axis in the glacier plots in the center of the net. Diagrams from all sections from a given core were then combined into a single fabric diagram for that core. When thus superimposed, fabric diagrams from successive thin sections in a core with a preferred c-axis orientation usually reinforced one another, regardless of the orientation of the thin sections. Thus systematic errors resulting from thin-section orientation, if any, do not appear to be appreciable.
A selection of fabric diagrams is presented in Figures 2, 3, and 4. Diagrams in Figures 2 and 3 are arranged so that all diagrams from a single bore hole are in the same column, with depth increasing down the column and with the direction of flow being from left to right. Not all of the diagrams prepared are reproduced herein, but those not included had patterns which were transitional between those above and below in the bore hole. In Figure 4, the same arrangement is used in the first two columns, but the third column has diagrams from surface sites only. Diagrams in the same row in this figure are from approximately the same particle path.
Fabric diagrams and line drawings of crystal boundaries from cores from holes T061, T081, and T0975, and structural cross-section showing hole and core locations.

Fabric diagrams and line drawings of crystal boundaries from cores from holes T061, T081, and T0975, and structural cross-section showing hole and core locations.

Fabric diagrams and line drawings of crystal boundaries from cores from hole T020. For explanation see Figure 2b.

Fabric diagrams and line drawings of crystal boundaries showing changes with distance along particle paths. For explanation see Figure 2b.

In some of the deeper cores the shapes of cells in thin sections are very irregular (Fig. 5) and it is inevitable that some crystals will be represented by two or more cells in a single thin section. By the same token, in ice with a strong preferred orientation of c-axes it is quite likely that nearby cells with very similar c-axis orientations will, in fact, be from different crystals; for example, cells with a distinct common boundary may have c-axis orientations that are nearly identical. Because it is impossible to distinguish between these two possibilities objectively, we have adopted the policy of treating each cell measured as a separate data point, statistically representative of the orientation of the c-axis in some volume of ice (Reference HookeHooke. 1969), and points on the fabric diagrams should be interpreted accordingly.
Photograph of thin section from T081, 144m. Crossed nicols. Grid spacing is 10 mm. Black cells may all be one crystal.

The percentage of c-axes falling in one per cent of the area of an equal-area net is commonly used as a measure of the strength of a fabric. This is not a statistically significant parameter, however (Reference KambKamb, 1959). Herein we use a method described by Reference KambKamb (1959, p. 1908–09) in which the number of points in a given sub-area of a fabric diagram is represented by m + nσ where m and σ are the mean and standard deviation of the number that would be expected in that sub-area if the distribution were random. The value of n for any given sub-area of a diagram is thus a measure of the strength of the fabric. In Figures 2–4 the maximum values of n for each diagram are shown below and to the right of the diagram. Fabrics with n > 3 are unlikely to represent samples drawn from a random population. By this criterion, none of the fabrics shown is statistically random, but some clearly have stronger preferred orientations than others. It should be noted that the probability of drawing a sample with two or more maxima of roughly equal strength symmetrically disposed about the center of the net is much less than the probability of drawing a sample with a single maximum of similar strength located at random in the net. Kamb’s technique evaluates only the latter probability.
Cores taken from the bore holes could not be oriented with respect to the direction of flow. Surface cores could be oriented, however, by taking care not to twist the core barrel when retrieving it from the hole. Bubbles in these cores were elongate in a direction approximately parallel to the flow plane and dipped up-glacier. Bubbles observed in tunnels and in vertical shafts which we have dug have also had this orientation (Reference HookeHooke, 1973; Reference Hudleston, Saxcna and BhattacharjiHudleston, 1977). It is reasonable to assume that the direction of bubble elongation in the deeper cores is likewise parallel to the flow plane, and that where bubbles have a distinct dip, it is in the up-glacier direction. Fabric diagrams in Figures 2–4 are oriented in accord with these assumptions; the direction of bubble elongation is left to right, with the up-dip direction to the left.
In many cores elongate bubbles did not have a distinct dip, so there were two possible orientations. The fabric from 0955 (Fig. 4), an oriented surface core, suggests that where there is a third maximum present it is on the down-glacier side of the diagram. Thus similar three-maximum diagrams from deeper cores have been oriented accordingly.
Crystal size and shape
Measurements on thin sections may be used to estimate the mean and standard deviation of grain sizes when the texture is isotropic, as is often the case in sedimentary rocks with approximately spherical grains (Reference KrumbeinKrumbein, 1935; Reference Smith and GuttmanSmith and Guttman, 1953; Reference Kellerhals, Kellerhals, Shaw and AroraKellerhals and others, 1975). However, the theoretical considerations used for these cases do not apply even approximately to the very irregular interlocking crystals with which we are dealing. Thus we have resorted to three alternative approaches to describe the sizes and shapes of crystals.
First, black and white photographs were taken of all thin sections (Fig. 5) and line drawings were prepared showing crystal boundaries in representative 4 cm × 4 cm squares in one or more thin sections from each core. These diagrams are reproduced in Figures 2–4. Where cell size varied markedly among thin sections from the same core, 2 cm × 4 cm drawings from two thin sections are shown (e.g. Fig. 2a, T061:0 m). In black and white photographs, crystal boundaries may be missed when adjacent cells go to extinction at nearly the same orientation; this is responsible for some of the larger cells in diagrams from the fine ice near the bottoms of the holes (e.g. Fig. 2b, hole T081 : 156 m).
Secondly, from studying the two-dimensional sections we developed a sketch of a typical three-dimensional crystal (Fig. 6).
Sketch of a typical crystal in ice with a multiple-maximum fabric. Based on thin sections. Drawn by R. Venkatakrishnan.

Finally, following Reference Gow and WilliamsonGow and Williamson (1976), we counted the number of cells in each thin section (or in a representative area of a thin section in fine-grained ice) and divided by the area of the thin section, Ai , to obtain a mean cell area, ci . To then characterize the core the weighted mean cell area c , was determined, thus

where n is the number of thin sections from the core. Variations of c with depth are plotted in Figure 7. Although we call c a weighted mean cell area, its interpretation is not at all clear. It is not a mean cell area, particularly in cores with bimodal cell-size distribution as in T061: 0 m (Fig. 2a) ; due to the large number of small cells in such cores the mean cell area would be much smaller. Rather it is an estimate (not rigorous) of the cell area which one would be most likely to find in a new thin section taken at random from the core. Nor are differences in c between cores quantitatively accurate. Some of the measurements were made on photographs and thus probably underestimate the number of cells present, particularly in fine-grained ice; conversely cells on the boundaries of a thin section were generally incomplete, thus leading to an underestimate of the areas of these cells, particularly in coarse-grained ice. The results of these biases is to overestimate c in fine ice and underestimate c in coarse ice. A final problem was the extreme variability in cell size, evident on the line drawings in Figures 2–4 and in the standard deviation of c plotted in Figure 7, suggesting large variations in crystal volumes.
Weighted mean cell area in bore holes and surface samples.

Results
The systematic change in fabric with depth is the most obvious variation observed. In hole T061 (Fig. 2), for example, a weakly-oriented fabric near the surface gives way gradually to a broad single-maximum fabric at a depth of about 75 m. At about 140 m this single maximum becomes elongate transverse to the flow direction, and by 160 m it has split into a distinct two-maximum pattern. A third maximum appears at 180 m and a fourth, yielding the infamous diamond pattern, is present at 215 m. Similar fabrics with comparable relative strengths of the maxima and with the same relation to the shear direction, have been observed frequently (Reference KambKamb, 1959; Reference RigsbyRigsby, 1960; Reference BuddBudd, 1972; Reference HookeHooke, 1973; among others). At the base of the glacier a strong single-maximum fabric reappears in a band of white ice. This ice owes its color to a high concentration of air bubbles, making it easily distinguished from the overlying blue ice. Oxygen-isotope studies have suggested that the white ice is of Pleistocene age (Reference HookeHooke, 1976).
This same pattern of variation in fabric with depth is repeated in the other bore holes and in the surface samples, with minor variations. In T020, for example, the broad single-maximum fabric was not found, but a small-circle fabric appears at a depth of 150 m between the weakly-oriented fabrics above and the elongate single-maximum fabrics below. In T081 the transition to a broad single-maximum fabric occurs at a depth of about 40 m, and in T0975 both the weakly-oriented and single-maximum fabrics are missing. Near the bottom of T081 (128 m) a peculiar horseshoe pattern is present in ice just above the white ice; normally (T061, T0975, and Reference HookeHooke, 1973) this ice has the four-maximum fabric.
As noted earlier, the weakly-oriented fabric near the surface is not statistically random; the fabric “strengths” of 8σ to 13σ shown (Figs 2–4) are much higher than we could logically expect if the samples were drawn from a population of c-axes with truly random orientation, such as might be expected near the surface in the accumulation area. We infer instead that these crystals have grown with a preferred orientation, possibly inherited from flat snow flakes around which the crystals nucleated, or possibly resulting from growth under a temperature gradient. The single-maximum fabrics have “strengths” of 15σ to 25σ however, representing a significant increase over those above.
As has been observed previously (Reference RigsbyRigsby, 1958; Reference KambKamb, 1959; Reference HookeHooke, 1973; Reference Matsuda, Matsuda, Wakahama and BuddMatsuda and others, 1976; Reference Gow and WilliamsonGow and Williamson, 1976; and others) marked changes in texture accompany the changes in fabric. Ice with weakly-oriented fabrics is generally fine grained ( c < 0.5 cm2 , Fig. 7). The change to the broad single-maximum fabric is accompanied by an increase in c to 1–2 cm2, and crystals become intimately interlocked. In ice with two or three-maximum fabrics c does not show an appreciable further increase, but there is a possibly significant increase in the minimum size and decrease in the maximum, resulting in a more uniform texture. In ice with four-maximum fabrics c increases again, however, to 2–3 cm2. Then in the white ice it decreases to < 0.2 cm2, cells become nearly equant, and the texture is no longer interlocking.
Changes in texture and fabric in the longitudinal direction are much less apparent. Possibly the most significant change is from a small-circle fabric at a depth of 150 m in T020 (Fig. 3) to a single-maximum fabric at depths of 80 m in T061 and 50 m in T081, and then back to a small-circle fabric at 0875 (Fig. 4).
Strain modeling
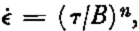
There is increasing evidence that fabric in ice and other rock-forming minerals is strongly dependent upon cumulative deformation and upon the path by which this deformation is achieved (Reference Kamb, Heard, Heard, Borg, Carter and RaleighKamb, 1972; Reference Hudleston, Saxcna and BhattacharjiHudleston, 1977; Reference Hobbs, Hobbs, Means and WilliamsHobbs and others, 1976, p. 118–40). It is, therefore, of considerable interest to examine the deformational history of the ice in which the crystallographic fabrics have developed. We cannot do this directly because we do not know the flow history of the ice cap, and there appear to be no objects within the ice that record the total deformation undergone. Instead, we have derived numerically the cumulative strain field in a flow plane of the ice cap assuming a steady-state velocity field and the present surface configuration. The horizontal velocities measured at the surface by Reference HoldsworthHoldsworth (1975) are used in this calculation. This velocity is assumed to decrease with depth in accord with a power-type flow law,
The magnitudes and orientations of quantities describing cumulative strain and strain-rate are shown in Figure 8c. A convenient measure of strain magnitude is ³ o, the natural octahedral unit shear (Reference NadaiNadai, 1963, p. 73). In plane strain with no volume change this is given by:

where R is the axial ratio of the strain ellipse (Reference Hudleston and HookeHudleston and Hooke, in press).
(a) Cumulative strain parameters in the bore hole T020. (b) Strain-rate parameters in T020. If simple shear alone were acting θS would be given by points on the line θSSS. (c) Parameters used to describe cumulative strain. The reference line is horizontal and the arrow is in the direction of flow. Similar quantities can be defined for strain-rate.

The flow in our numerical model is two-dimensional and is very nearly one of no area change, although this was not a condition imposed on the velocity field used. Thus we use ³ oc as defined in Equation (1) as our measure of cumulative strain magnitude, adding an extra subscript to denote “cumulative“. It should be noted, however, that this is not strictly the ³ o of Reference NadaiNadai (1963) because transverse strains, although small, are not zero. ³ oc is zero at the surface in the accumulation zone (Fig. 8a), non-zero at the surface in the ablation zone (Fig. 9a), and everywhere increases rapidly with depth.
(a) Cumulative strain parameters in bore hole T081. (b) Strain-rate parameters for T081. Symbols same as in Figure 8.

A quantity similar to ³ oc can be derived for strain-rate magnitude, such that

where

The orientation of the greatest principal axis of the cumulative strain ellipse is given by θ c. This angle is everywhere small and does not change much with depth (Figs 8a and 9a). It is greatest near the surface in T081 (Fig. 9a). The corresponding angle for the strain-rate θ S, shows a much greater variation with depth (Figs 8b and 9b). In both T020 and T081 it varies from 0° at the surface to nearly 45° at the bed.
The final quantity used to record cumulative strain is ϕ c, the rotation of the line which becomes the principal axis at any stage of the deformation. With increasing depth ϕ c increases to a maximum and then decreases continuously towards the bed (Figs 8a and 9a).
We can consider deformation in the flow plane in terms of a continuum between pure shear and simple shear (e.g. Reference RamsayRamsay, 1967, p. 56). Where the rotational component of the flow is zero, an instantaneous state of pure shear exists (still assuming no volume change and zero transverse strain-rate). If this condition persists through time for a given particle of material the principal axes of the cumulative strain will coincide with those of the strain rate (θ c = θ s), and the strain will accumulate coaxially. In progressive simple shear, θ s is constant at 45° to the shear plane, and θ c decreases systematically from 45° initially towards 0° as the strain magnitude grows towards infinity. Simultaneously, ϕ c increases from 0° towards 90° (Reference RamsayRamsay, 1967, p. 83–88).
The fact that the strain does not accumulate coaxially in the flow plane of the ice cap is shown both by the discrepancy between θ s and θ c (compare Figs 8a with 8b and 9a with 9b), and by the value of ϕ c. In fact, the principal directions of the strain-rate tensor in the lower 30 m of T020 and lower go m of T081 are within 2° of the orientation (approximately 45°), predicted for simple shear (θ SSS in Figs 8b and 9b). However, the cumulative rotation ϕ c in these lower regions is much less than that expected for a history solely of simple shear. To show this, we can calculate the component of rotation for a simple shear of a given magnitude, say ³ oc = 3.75. To do this we use Equation (1) to find R and then use standard equations (e.g. Reference RamsayRamsay, 1967, ch. 3) to arrive at ϕ c. This rotation is 80°, and increases towards 90° as the strain magnitude increases further. In T020 and T081 the actual rotations at this same strain magnitude are 9° and 57° respectively, and instead of increasing continuously as ³ oc increases, the rotations peak and then decrease towards the base of the glacier where the strain-rate field is closest to one of simple shear (Figs 8a and 9a). This is because all particle paths that intersect these bore holes have an early stage of nearly pure shear (Reference Hooke and HudlestonHooke and Hudleston, 1978, Fig. 3), and the lower the flow line intersecting the bore hole, the longer is this stage. The amounts of pure shear and subsequent simple shear determine the net rotation, and the nature of this two-stage history is such as to cause the peak in the plots of ϕ c with depth.
We can summarize the strain history of ice in the two bore holes as follows. In the upper part of T020 both strain-rate and cumulative strain are close to pure shear (θ S ≈ θ c ≈ 0, and ϕ c is small, Fig. 8a). With increasing depth the strain-rate changes smoothly to approach simple shear at the base (θ s → 47°, Fig. 8b), but the cumulative strain continues to show the effects of a large amount of approximately pure shear (ϕ c ≤ 12°). In T081, the strain-rate field approximates simple shear through much of the ice (θ s > 41° below 75 m depth, Fig. 9b), and the cumulative strain now shows a dominant influence of simple shear (ϕ c > 50° below 70 m, Fig. 9a), following a long history of flow under the influence of simple shear.
The main source of error in the quantities graphed in Figures 8 and 9 and discussed above arises from uncertainty in the reliability of the cumulative strain field due to uncertainty in the present velocity field and its changes through time (Reference Hudleston and HookeHudleston and Hooke, in press). It is very difficult to assess the error involved, but the probable error will increase with depth and with distance along a flow line as older ice is encountered. Thus strain quantities in Figure 8a are more reliable, on the average, than those in Figure 9a. Our strain modeling suggests that by varying the steady-state velocity field within reasonable limits, based upon different ways of utilizing the observed velocity and mass-balance data, and by not allowing for significant advance or retreat of the ice cap in the past 2000 years (Reference Hudleston and HookeHudleston and Hooke, in press), the values of ³ oc will not vary by more than about 20% of those plotted in Figures 8a and 9a. In discussing the fabric patterns and their transitions, we are not greatly concerned with ice older than 2000 years.
Interpretation
We are now in a position to relate observed fabrics to cumulative strain and strain path.
Cumulative strain
The magnitudes of the cumulative strains at which key fabric changes take place are shown in Table I. The change from a weakly-oriented to a small-circle pattern in T020, and from a weakly-oriented to a broad single-maximum pattern in T061 and T081 occur at ³ oc = 1.2, 1.0, and 1.4 respectively. The values of ³ oc corresponding to the changes from elongate single-maximum to multiple-maximum fabrics in T020, T061, and T081 are 2.1, 2.7, and 3.6. Cumulative strains for the upper single-maximum fabrics in the white ice cannot be estimated reliably due to the viscosity contrast between it and the overlying blue ice and due to its much greater age.

For comparison, Reference Hudleston, Saxcna and BhattacharjiHudleston (1977) found single-maximum fabrics developing at ³ oc ≈ 0.8 in small shear zones near the edge of the ice cap. In the centers of these shear zones cumulative strains of c. 3.0 are attained, suggesting that multiple-maximum fabrics might be expected, although they have not been found.
Considering the gradational character of the fabric transitions and the uncertainties in the strain modeling, we feel that this agreement among the values of ³ oc for the transition to single-maximum or small-circle fabrics is satisfactory. However, that for the transition to multiple-maximum fabrics is not, suggesting that other factors may play a role. The differences seem too large to be accounted for by errors in ³ oc, particularly in view of the fact that errors in the velocity field would tend to affect all values of ³ oc in the same direction.
Strain path
The influence of strain path is best illustrated by the differences in fabric pattern encountered below the weakly-oriented fabric zone (Fig. 2). In T020 the pattern is a small circle (Fig. 3) but in T061 and T081 it is a broad single maximum (Fig. 4). Following a particle path from T081 we find that further down-glacier this broad single maximum changes back to a small circle at 0875 (Fig. 4).
Laboratory and field studies have shown that broad single-maximum fabrics develop under simple shear (Reference SteinemannSteinemann, 1958; Reference KambKamb, 1959; Reference Hudleston, Saxcna and BhattacharjiHudleston, 1977), two-pole fabrics with poles between the greatest and least principal strain axes develop in pure shear (Reference Schwarzacher and UntersteinerSchwarzacher and Untersteiner, 1953; Reference UntersteinerUntersteiner, 1954; Reference VallonVallon, 1967), and small-circle fabrics form under uniaxial compression (Reference BuddBudd, 1972; Reference Kamb, Heard, Heard, Borg, Carter and RaleighKamb, 1972). It is inferred in these cases that due to recrystallizalion and/or rotation, the basal planes of ice crystals come to lie preferentially in the direction of maximum shearing stress.
Although the strain modeling suggests that pure shear dominates near the surface of the glacier, it should be recalled that the modeling did not take transverse strains into account. Reference HoldsworthHoldsworth (1975) found that ėxx = 0.0011 a−1 and ėyy = 0.0001 a−1 at the surface near T020 (where x is longitudinal and y transverse). About 0.5 km up-glacier from T020 ėxx is still about 0.001 1 a−1 but ėyy approaches zero. These rates may vary with depth, of course, so we do not know if ėyy is larger along the particle path leading to 150 m in T020; however, we infer from the fabric pattern that the ice there has been subjected to sufficiently large transverse strains to develop what appears to be a small-circle fabric rather than the two-maximum pattern anticipated for pure shear.
In ice with comparable cumulative strains further down-glacier, the pure shear component of the strain decreases and the simple shear component increases (Figs 8 and 9). This is inferred to be responsible for the single-maximum fabrics in T061 and T081. Still further down-glacier, however, as the ice approaches the surface, the pure shear component again increases. At 0875 Reference HoldsworthHoldsworth (1975) shows ėxx = − 0.000 6 and ėyy = −0.000 4, corresponding to a situation of uniaxial extension about a vertical axis. Reference Kamb, Heard, Heard, Borg, Carter and RaleighKamb (1972, Fig. 18) has suggested that this should give rise to another small-circle fabric but at a larger angle to the extension axis. This, in fact, is observed; at 0875 (Fig. 4) the angle is 39°, in comparison with 33° at T020. As the ice of 0875 is on the same particle path as that showing a single-maximum fabric in T081, the uniaxial strain in the most distal part of the particle path apparently has been sufficient to modify the single-maximum pattern developed previously.
Except near the surface, the strain path experienced by ice along most of the flow line is very nearly one of progressive simple shear (Reference Hudleston and HookeHudleston and Hooke, in press). In nearly all the fabric diagrams in Figures 2–4 there are high concentrations of c-axes within 20° of vertical, corresponding to basal planes lying at low angles to the “shear plane”. Thus it seems likely that whatever the reasons for the differences among the fabric patterns, basal glide is an important mechanism affecting the fabric in all cases.
DIscussion
One objective of studies such as this is to be able to predict the distribution of various fabrics and textures in a flow plane on the basis of detailed understanding of the relevant independent variables. The fact that the independent and dependent variables have not yet been clearly identified illustrates the present state of the art.
Reference RigsbyRigsby (1958, Reference Rigsby1960) called attention to the importance of strain-rate, and to the relation between cell size and fabric. Reference KambKamb (1959, Reference Kamb, Heard, Heard, Borg, Carter and Raleigh1972) mentioned the importance of stress and cumulative strain. Reference BuddBudd (1972) added strain path to the list of variables, and also brought up the possibility of mechanical rotation of crystals. Reference HookeHooke’s work (1973) pointed to the significance of high concentrations of air bubbles and Reference Gow and WilliamsonGow and Williamson (1976) suggested that particulate matter, in their case volcanic dust, might play a role. C. F. Raymond (written communication in May 1979) observes that the initial fabric would also be important. As a start we will consider temperature, stress, and cumulative strain, as the most likely independent variables, as the initial fabric is probably weakly oriented in all cases. We further assume that texture and fabric are both dependent on these three variables, although it may well be that fabric is, at least in part, dependent on texture.
We will concentrate primarily on fabric and will discuss, in particular, four fabric types developed in simple shear; weakly oriented, low strain-rate (lower) single maximum, multiple maximum, and high strain-rate (upper) single maximum. Small-circle fabrics are viewed as a variety of lower single-maximum fabric formed under conditions of uniaxial compression, and two-pole fabrics with poles in appropriate positions are a variety formed in pure shear.
The basic known relationships can be summarized as follows:
-
(1) In the Barnes Ice Cap the distribution of the four principal fabrics is shown in Figure 2b. The sharp single maximum in the white ice is the upper single maximum while the broad single maximum higher in the glacier in the lower single maximum.
-
(2) In the Byrd core Reference Gow and WilliamsonGow and Williamson (1976) find a similar progression with depth from a weakly-oriented fabric at the surface to a lower single-maximum fabric (small-circle variety) at a depth of about 400 m, and thence to a double-maximum fabric at 1 000 m. The transition to upper single-maximum fabrics occurs at about 1 200 m. In contrast to the situation in the Barnes Ice Cap, however, there is a transition back to a multiple-maximum fabric in the Byrd core at a depth of about 1 830 m. Reference Matsuda, Matsuda, Wakahama and BuddMatsuda and others (1976) and W. F. Budd (written communication in July 1977) report a similar sequence of changes with depth in the Law Dome, Antarctica.
-
(3) The fabrics observed by Reference KambKamb (1959) in bands of fine ice in the Blue Glacier were probably lower single-maximum fabrics. Kamb thought this ice might have been subjected to high strain-rates for an appreciable length of time, but oxygen-isotope studies (Reference Sharp, Sharp, Epstein and VidziunasSharp and others, 1960) suggest that many of the bands are crevasse fillings formed locally, and thus have low cumulative strains.
-
(4) Reference Kamb, Heard, Heard, Borg, Carter and RaleighKamb (1972) found a double-maximum pattern at cumulative strains between 0.1 and 0.3 in his laboratory experiments. The stronger of the maxima coincides with our broad single-maximum, and the weaker is at c. 120° to this, in the direction of shear. Reference Hudleston, Saxcna and BhattacharjiHudleston (1977) found a similar double-maximum pattern at cumulative strains up to c. 0.8 in small shear zones near the margin of the ice cap. At higher strains the weaker maximum disappears.
-
(5) Multiple-maximum fabrics apparently do not form readily in ice appreciably colder than — 10°C, We do not consider the fabrics with maxima of only 5% of the points in one per cent of the net area found in fine ice near the top of the Byrd core at temperatures of about — 3O°C (Reference Gow and WilliamsonGow and Williamson, 1976) to be equivalent to our multiple-maximum fabrics, which typically have individual maxima in excess to 20% and much larger crystal sizes. Reference Watanabe and ŌuraWatanabe and Ōura (1968) also describe some of these weak multiple-maximum fabrics developed during laboratory tests in uniaxial compression. Our impression is that these maxima are local concentrations of c-axes in small-circle fabrics, and have no statistical significance.
-
(6) Multiple maximum fabrics may be a result of crystallographic twinning (Reference Matsuda, Matsuda, Wakahama and BuddMatsuda and others, 1976). Some materials are known to deform almost exclusively by twinning, but in contrast to ice the twins in such materials are in the form of alternating twin lamellae (Reference VenablesVenables, 1964; Reference Bolling and RichmanBolling and Richman, 1965). Furthermore an increase in temperature seems to inhibit, rather than promote such twinning (Reference Bolling and RichmanBolling and Richman, 1965).
-
(7) There may well be an instability involved in at least some of the transitions from one fabric to another. Reference Hudleston, Saxcna and BhattacharjiHudleston (1977), for example, found shear zones, a few centimeters thick, in the wedge of deformed superimposed ice formed at the margin of the Barnes Ice Cap. Distinct single-maximum fabrics and coarser grain sizes were found inside the shear zones, in contrast to the weakly-oriented fabrics outside. It appears that once a zone of weakness develops, recrystallization and formation of the single-maximum fabric increases the strain-rate and promotes further recrystallization. The shear zone thus expands. A similar instability at the transition from the lower single-maximum to the multiple-maximum fabric may account for the fact that bands of ice with single-maximum fabrics 2 to 5 m thick alternate with similar bands having multiple-maximum fabrics in deformed superimposed ice that has undergone greater cumulative strain (Reference HookeHooke, 1973).
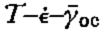
If we are correct in our suggestion that temperature T, stress τ, and cumulative strain ³ oc are the primary independent variables, it should be possible to plot a stability diagram showing which fabrics are stable under conditions of simple shear in T–τ– ³ oc space. The least well-known of these variables is ³ oc, so initially we plot T against τ and record our estimate of ³ oc (Table I) numerically beside the points (Fig. 10). τ is approximated by ρgh sin α where α is the surface slope in the vicinity of the respective bore holes, h is the depth to a given transition between fabric types, and ρ and g have their usual meanings. T is obtained from measurements in the bore holes.
Stability diagram for various fabrics developed in simple shear in T–τ space with ³ oc indicated numerically where known. Points with ³ oc < 1.5 are for transition from weakly-oriented to lower single-maximum fabrics. Points with ³ oc > 2 are for transition from lower single-maximum to multiple-maximum fabrics. Lines are projected onto plane of diagram from third dimension, ³ oc. Thus ³ oc varies along lines.

In addition to the data from the Barnes Ice Cap, we have also plotted fabric transitions in the Byrd bore hole from Reference Gow and WilliamsonGow and Williamson (1976). In calculating τ, the ice surface slope at Byrd Station, 0.001 61, was obtained from Reference RobinRobin ([1970], p. 145), and an ice density of 0.9 Mg/m3 was used, thus ignoring the effect of lower-density firn at the surface. Values of ³ oc are not available for the transitions in the Byrd core, but we presume that they are much larger than those for the transitions in the Barnes Ice Cap.
The double-maximum pattern of Reference Kamb, Heard, Heard, Borg, Carter and RaleighKamb (1972) is distinct from the two-maximum fabrics formed in the multiple-maximum field of Figure 10. In the former a line joining the two maxima is parallel to the direction of shear, whereas in the latter it is perpendicular to the direction of shear. Kamb’s double-maximum pattern occupies a narrow range of ³ oc between the weakly-oriented and lower single-maximum fields of Figure 10 and is not shown.
The relation between ³ oc and τ in Figure 10 is not clear. The multiple-maximum fabrics that occur at very low stresses and temperatures in the Byrd bore hole seem inconsistent with the multiple-maximum field defined by the Barnes Ice Cap data, and it is tempting to attribute this to the much higher cumulative strains inferred for the Byrd Station ice. However, at lower stresses the transitions from lower single-maximum to multiple-maximum fabrics in the Barnes Ice Cap occur at lower cumulative strain (Fig. 10). We thus infer that the higher temperatures at these lower stresses are responsible for reducing the cumulative strain required for the transition.
To depict this more graphically we present in Figure 11 a schematic three-dimensional sketch of T–τ– ³ oc space. The stability fields shown in this figure are consistent with the known relations discussed earlier. In addition, by making the transition between weakly-oriented and lower single-maximum fabrics asymptotic to a low but finite stress at high cumulative strain, we suggest that preferred-orientation fabrics may not develop at stresses that are too low for recovery creep, where deformation is by diffusive processes alone.
Schematic stability diagram for various fabrics developed in simple shear in T–τ– ³ oc space. Scales on axes are approximate. Drawn by R. Venkatakrishnan.

Also plotted in Figure 11 is an inferred path in T–τ– ³ oc space for the Byrd bore hole, showing how the stability field for multiple-maximum fabrics is intersected twice in the bore hole.
Implicit in the construction of Figures 10 and 11 are two assumptions. First, we assume that the deformation is predominantly simple shear so strain path need not be considered in estimating cumulative strain. Secondly, we assume that strain-rate need not be considered separately. Strain-rate is a function of stress, temperature, fabric, ice density, and the concentration of impurities. To consider it as one of our independent variables might be advantageous as it would incorporate many of these other variables into a single parameter. However strain-rates are difficult to estimate accurately due to the uncertainty in the constants which one must use in any constitutive relation between strain-rate and the other parameters listed. Furthermore strain-rate is not independent of temperature and fabric, so there would be redundancy in a
Concluding Statement
We view Figure 11 as a first attempt at synthesizing the large amount of available data on fabrics in glacier ice. Systematic relations are clearly present; a given fabric is apparently stable only under a certain range of conditions. Thus in principle it is possible to specify the stable fabric for any given combination of the independent variables. The problem is one of first identifying the independent variables, and then determining the range of conditions, expressed in terms of these variables, under which any given fabric is stable.
We have suggested that temperature, stress, and cumulative strain are three possible independent variables, and found that the stability fields of the various fabric patterns can be expressed in terms of these variables if other possible ones, such as ice density and impurity content, are constant. More field data and theoretical studies are necessary to determine whether these variables will suffice and to establish the stability fields more accurately.
Acknowledgements
This research was supported financially by the U.S. National Science Foundation (Grants EAR 74–12293, EAR 77–21098, and EAR 77–12990) and logistically by the Glaciology Division, Environment Canada. We thank G. H. Holdsworth for use of facilities at the Glaciology Division Camp on the Barnes lce Cap and for his assistance in obtaining permission for us to do the work. The critical comments of C. F. Raymond significantly improved the paper. B. Koci drilled hole T020, assisted in drilling the other holes, and did some of the fabric analyses from T081.



