
23.1 Time, Rhythm and Register
Reality is a function of the methods used to observe events in space and time. Based on this pragmatic postulate, and concentrating on the temporal dimension, in the present study a novel signal-processing framework is developed in order to analyse the speech rhythm of selected authentic data types, as opposed to the intuited and constructed formal data that are used in the description of ‘linguistic rhythm’ (advisedly thus named by Liberman and Prince, Reference Liberman and Prince1977). In the present context, ‘authentic’ means that the data were not invented for the purpose of scientific study but are, in traditional terms, usage-based data recorded in independently motivated scenarios. The study relies extensively on graph illustrations of acoustic phonetic analyses. Approximately half of the contribution is devoted to theoretical issues, and the other half is concerned with exploratory case studies of rhythm in six different speech registers.
Time is a basic parameter in the analysis of speech utterances, along an extensive timescale. The scale spans the range from phones, with tens of milliseconds, through larger grammatical units of several seconds and discourse linguistic units of several minutes, to much longer time spans: the acquisition of first and second languages, dialect, and register, then across generations to historical language change and language evolution. One of the shorter span regions on the timescale is that of real-time speech rhythms: perceived regular, strong–weak alternations of beats and inter-beat intervals, which appear in the infrasound frequency domain as low-frequency (LF) oscillations between 0.1 Hz and 10 Hz in the long-term spectrum of the speech signal; see also Chapters 10 and 14. These oscillations are treated here within the modulation-theoretic framework of rhythm formant theory (RFT) for speech stylometry, and rhythm formant analysis (RFA), its associated methodology (Gibbon and Li, Reference Gibbon and Li2019; Gibbon, Reference Gibbon2021, Reference Gibbon2022, Reference Gibbon2023).
The study is based on an inhomogeneity assumption: the speech of individuals and communities is not homogeneous, and different registers, styles and genres used by speakers and hearers differ in many properties, including prosody, understood informally as the rhythms and melodies of speech. A null hypothesis would be that all these varieties have the same rhythms. A more realistic set of hypotheses is that speech is more or differently rhythmical in some registers than others, that differences can be detected, and if rhythms are not found in speech data, then maybe the wrong data have been selected. Conversely, if rhythms are detected in one speech register, they may not necessarily be found in all registers. Results of rhythm analyses depend, for example, on whether selected data are from the formal metalinguistic register of traditional linguistic and phonetic analysis, or whether they are foraged from speech ‘in the wild’.
The aim is to investigate whether the interplay of rhythm and function in different kinds of oral narrative can be described and distinguished using the RFT/RFA framework. To this end, the study focuses on small exploratory case studies of a selection of speech registers and starts with a detailed discussion of the theoretical background. The study deals with oral narratives as registers (Section 23.2), rhythms and their functions (Section 23.3), approaches to speech rhythm analysis (Section 23.4), the heuristic use of the annotation-mining method (Section 23.5), the RFT/RFA framework (Section 23.6), RFA analyses of different kinds of oral narrative register (Section 23.7), a comparison of rhythms in different registers by means of unsupervised clustering (Section 23.8), and results and conclusions (Section 23.9).
23.2 Oral Narratives as Registers
Six specific registers are analysed in the present study and represent oral narratives of different kinds: toddler dialogue at an early stage in first-language acquisition, the narrative genre of African village communities, fluency of reading aloud in English as a second language (L2), a comparison between newsreading and poetry reading in English, and a comparison of recitations of different Chinese poetry genres. The prediction is that rhythms in these registers are physically distinguishable and that the differences can be detected with RFT/RFA.
The traditional term ‘register’ and related terms such as ‘genre’, ‘style’ and ‘functional style’ have been used in too many different ways in the literature to be reviewed here (but see Gibbon, Reference Gibbon1981, Reference Gibbon1985). The term is used in the present contribution for family resemblances of text and speech usage in task-oriented contexts such as spontaneous conversation, verbal coordination, storytelling, reading aloud, child and mother speech or the metalinguistic formal register of traditional linguistic data.
The term ‘register’ is closely related to Wittgenstein’s ‘language game’ (Reference Wittgenstein1953:5, §7), referring to language usage in specific contexts, such as bricklayers using language as a work tool or children learning a language, which he calls (without negative associations) ‘primitive languages’: ‘Ich will diese Spiele “Sprachspiele” nennen, und von einer primitiven Sprache manchmal als einem Sprachspiel reden.’ (‘I will call these games ‘language games’ and will sometimes speak of a primitive language as a language game.’) This philosophical perspective implies that the language usage of an individual or community can be seen as an inhomogeneous set of overlapping registers, styles, genres and language games, with virtuoso register-hopping, style-shifting and code-switching between language and speech varieties by community members.
Registers are usually described in terms of specific vocabularies and specific preferences for grammatical and word formation rules (Biber and Conrad, Reference Biber and Conrad2019). In spoken registers, criteria such as clear or fast-speech enunciation, as defined in hyperarticulation and hypoarticulation theory (Lindblom, Reference Lindblom, Hardcastle and Marchal1990), and speech rhythm and melody are equally relevant (Crystal and Davy, Reference Crystal and Davy1969).
A basic functional space for registers can be defined. First, modality ranges from oral–auditory, unidirectional–multidirectional, through face-to-face conversation to teleglossic (communication at a distance), and to subtypes of teleglossia in many kinds of electronic or other medium. Second, topic relates, for example, to domestic or professional, private or public, or task-oriented (teaching, carpentry, sport, conversation …). Third, style covers language features of formal–informal, polite–impolite communication.
The registers discussed here are in the oral–auditory modality, with varying topics, from the impenetrable conversation of toddlers talking with single-syllable vocabulary on the one hand, to broadcast news or conventional poetry on the other. The data are recordings of authentic natural real-time data, partly from public sources.
23.3 Rhythms and Their Metalocutionary Functions
Rhythms and speech registers have been rare companions in phonological and phonetic studies, while in discourse studies there is a history of interactionist discussion of rhythm in different speech varieties (Brazil, Reference Brazil1985; Couper-Kuhlen, Reference Couper-Kuhlen1993; Couper-Kuhlen and Selting, Reference Couper-Kuhlen and Selting2018). From a functional point of view, natural speech rhythms are metalocutions with emotional and rhetorical functions, but also with a metalocutionary indexical cohesive function, such as head-nodding, finger-pointing and beat gestures (McNeill, Reference McNeill1992). Prosodic beats literally point (during utterance time and at utterance place) at constituents of the lexico-syntactic locution that they accompany.
From a functional perspective, an inheritance hierarchy of increasing specificity can be defined for directly observable rhythms: physical rhythms (ocean waves, ripples, branches in the breeze), physiological rhythms (heartbeats, blinking, brain frequencies), behavioural rhythms (walking, chewing), bonding rhythms (dancing, handshaking, intimate interaction), communication rhythms (gesture, writing, speech) and speech rhythms.
Intuitively, rhythms are sequences (sometimes different sequences in parallel, as in music) of regular waves and beats in the speech signal at similar intervals in time, where beats and inter-beat intervals are related to stronger and weaker values of some audible parameter ranging around one second in duration. When are beat sequences rhythms? An individual beat is not a rhythm, nor is a sequence of two beats, but a sequence of at least three beats permits the two inter-beat intervals to be compared in terms of duration equality and thus for a rhythm to be identified (Nakamura and Sagisaka, Reference Nakamura and Sagisaka2011). Syllable rhythms alternate between vocalic beats and consonantal inter-beat intervals. Word-level foot beats alternate between stronger syllables as beats and sequences of weaker syllables as inter-beat intervals. Phrasal-level ‘nuclear accent’ beats in major intonation sequences or ‘paratones’ alternate with minor intonation sequences with less prominent nuclear accents. Even longer duration, slower rhythms occur in read-aloud texts and in rhetorical and poetic discourse.
From a physical point of view, speech rhythms are oscillations of parameter values in the acoustic signal (Barbosa, Reference Barbosa2002), such as the amplitude of speech at a particular frequency, for example 5 Hz for syllables of average duration of 200 ms, or about 1.25 Hz for accented words at intervals of about 800 ms, depending on the speech register (see Sections 23.7 and 23.8). Rhythms may be considerably longer than this, particularly in carefully crafted speeches or in poetry and song (see Chapter 26; Daikoku and Goswami, Reference Daikoku and Goswami2022).
A ‘golden fleece’ that has haunted the search for speech rhythm in phonetics for decades is the ideal timing property of isochrony – equal timing in a succession of similar events. The isochrony property is not found as absolute duration equality, however, but as a scale of duration similarity of different phonetic event types such as mora, syllable and stress group (Dauer, Reference Dauer1983, Reference Dauer1987). Several scales based on descriptive statistics have been proposed as a basis for a rhythm typology of languages (e.g., Grabe and Low, Reference Grabe, Low, Gussenhoven and Warner2002). These approaches have been critically discussed by Gibbon and Fernandes (Reference Gibbon and Fernandes2005), Gibbon (Reference Gibbon, Sudhoff, Lenertova and Meyer2006) and Arvaniti (Reference Arvaniti2009), among others.
Whichever domain is inspected, rhythms are periodic time functions – that is, they have a frequency. A rhythmic beat has a magnitude. Rhythms have a property of resonance, the constancy of frequency, and of bandwidth, the frequency range within which a varying rhythm remains a rhythm, and they have persistence in time: rhythms require at least three component beats and thus at least two inter-beat intervals, as already noted. Speech rhythms may co-occur (Barbosa, Reference Barbosa2002; Asu and Nolan, Reference Asu and Nolan2006; Inden et al., Reference Inden, Zofia, Wagner, Wachsmuth, Miyake, Peebles and Cooper2012) in a hierarchy, as in music (see Section 23.7.2), and may also be shared with other interlocutors when their behaviour is mutually entrained and they adapt to each other (Chapter 29; Cummins and Port, Reference Cummins and Port1998), as in the dialogue case studies in Sections 23.7.1 and 23.7.2.
23.4 Approaches to Speech Rhythm Analysis
The study of speech rhythm dates back to antiquity, and rhythm has traditionally been seen as a poetic or rhetorical device. Since the mid-twentieth century, phonological accounts of rhythms applied a metaphorical concept of structure as rhythm (‘linguistic rhythm’; Liberman and Prince, Reference Liberman and Prince1977) using intuited and constructed data, along with other categories that are labelled with metaphors from poetics (e.g., ‘metrical phonology’, ‘trochaic’, ‘iambic’, ‘foot’). In poetics itself, distinctions are made between metrical frameworks, such as the iambic pentameter, on the one hand, and grammatical stress patterns on the other, and between these structural concepts and performed rhythms in poetry readings; see also rhetorical rhythms in public speeches (Gibbon and Li, Reference Gibbon and Li2019).
The main approaches to speech rhythm in acoustic phonetics are listed here in approximate historical chronological order of appearance, as context for the present approach:
1. Qualitative linguistic and applied linguistic models, typically related to pronunciation teaching, from Sweet (Reference Sweet1908) through Pike (Reference Pike1945), Jassem (Reference Jassem1952) to Abercrombie (Reference Abercrombie1967) and many textbooks; see Gibbon (Reference Gibbon1976) for an overview of these traditional approaches.
2. Qualitative algebraic models in universalist theories, from Chomsky et al. (Reference Chomsky, Halle, Lukoff, Halle, Lunt, McLean and van Schooneveld1956) through metrical theories originating with Liberman and Prince (Reference Liberman and Prince1977) and the prosodic hierarchy of Selkirk (Reference Selkirk1984) to search-theoretic optimality theories originating with Prince and Smolensky (Reference Prince, Smolensky and McCarthy2004).
3. Annotation mining in descriptive phonetics with hybrid qualitative and quantitative signal-symbol mappings based on annotated speech, from Lehiste (Reference Lehiste1970) and Jassem et al. (Reference Jassem, Hill, Witten, Gibbon and Richter1984) to Asu and Nolan (Reference Asu and Nolan2006) and many others; see Section 23.5.
4. Modulation-theoretic analysis in experimental and clinical acoustic phonetics, with concepts derived from radio engineering: demodulation and spectral analysis of meaningful information signals from the acoustic speech signal, from Ohala (Reference Ohala1992), Todd and Brown (Reference Todd and Brown1994), Traunmüller (Reference Traunmüller1994), Greenberg and Kingsbury (Reference Greenberg and Kingsbury1997) to Barbosa (Reference Barbosa2002), Tilsen and Johnson (Reference Tilsen and Johnson2008) and several later studies; see the overviews included in Gibbon (Reference Gibbon2021), Chapters 8 and 10, and Section 23.6.
Annotation mining and RFT/RFA are described in the following two sections, and annotation mining is used in two of the case studies in Sections 23.7 and 23.8 as a heuristic source of predictions for further analysis with RFT/RFA.
23.5 Annotation Mining: Theory and Practice
The earliest and most popular family of methods for measuring rhythms in the physical speech signal is annotation mining, which inspects the duration relations between speech units such as vocalic or consonantal segments, syllables, feet and so on. The assumption that rhythm is solely a function of speech unit durations is an oversimplification, however, since the prominent beats or waves of a rhythm may also involve other parameters such as pitch patterns (Lehiste, Reference Lehiste1970).
Annotation mining has a broader and a narrower sense. In the broader sense, it has six steps. The first step includes recording the speech signal and visualising properties such as the waveform (oscillogram), the fundamental frequency (F0) estimation (‘pitch’ track), the intensity curve and the spectrogram. The next step is labelling (segmentation and classification) of the speech signal by the assignment of categorial linguistic labels to intervals or points in the signal by close listening and by inspection of the display. The annotations are <startpoint, endpoint, label> triples for intervals, or <midpoint, label> pairs for points. In any given annotation sequence (tier), labels denote units of a particular linguistic category: phonetic (e.g., phones, syllables, larger units), structural (e.g., words, phrases) or functional (e.g., focus, question, parenthesis). The parallel annotation tiers implicitly define time-synchronised mappings between tiers.
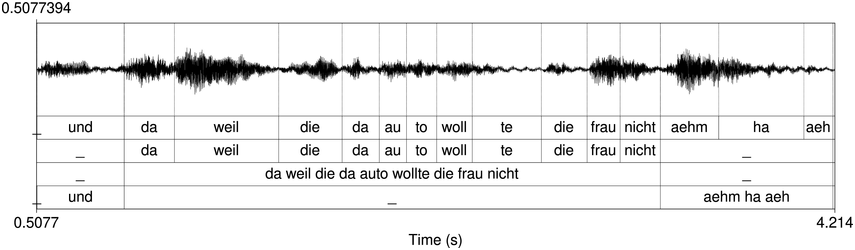
An example of phonetic annotation with parallel tiers using the Praat phonetic workbench software (Boersma, Reference Boersma2001) is shown in Figure 23.1 (see Tracy and Gibbon, Reference Tracy, Gibbon, Beißwenger, Gredel, Lemnitzer and Schneider2023, for data description). The annotations are in parallel horizontal tiers, with annotation segments marked by vertical lines. From top to bottom, the tiers are of syllables, of syllables without hesitation particles, of sentence transcripts and of coordinating conjunctions and hesitation phenomena.
Annotation with the Praat phonetic workbench software (German spontaneous report, illustrating hesitatons).

Figure 23.1 Long description
The annotation below the oscillogram has four tiers: 1. All syllables. 2. All syllables without conjunctions and hesitation particles. 3. Whole utterance without conjunctions and hesitation particles. The text of the annotation is informal spontaneous German: da weil die da auto wollte die frau nicht.
The final step, annotation mining in the narrow sense (Gibbon and Fernandes, Reference Gibbon and Fernandes2005), is statistical analysis of sequences of annotated interval durations and their relations, often in an attempt to discover the isochronicity (degree of isochrony) of the sequence. Visual inspection of similarly spaced labels in Figure 23.1 gives an initial indication of possibly rhythmical sections in the recording.
Annotation mining traditionally involves descriptive statistics such as the mean together with dispersion measures (standard deviation, coefficient of variation), to provide an index of duration regularity (see the overview and comparison in Gibbon and Fernandes, Reference Gibbon and Fernandes2005). These methods are useful, but problematic as rhythm measures for several reasons in addition to concentration on the duration parameter alone: (1) descriptive statistics apply to static populations, not to dynamic time functions such as the speech signal; (2) taking squared or absolute values ignores the key alternation property of rhythms, and thus the same index may refer to alternating or non-alternating sequences; (3) the ‘rhythm metrics’ are not metrics in the mathematical sense: they do not compare vectors of length n in an n-dimensional metric space (the triangle inequality criterion).
The pairwise variability (PVI) metrics are an exception and also overcome the disadvantage of unsuitability for time series. However, they retain the second disadvantage of ignoring alternations by using absolute differences. The PVI metrics also introduce a further assumption of binarity: the subtraction operation implies that rhythms are binary. This may be true on average (Nolan and Jeon, Reference Nolan and Jeon2014), but in reality three or more neighbouring units may be involved, as in the ‘triple time’ of Everly Blenkinsop worried a lot about allergies. The heuristic is saved by the de facto preponderance of binary rhythms.
The PVI metrics apply to sequences of interval durations and have non-normalised (‘raw’) and normalised versions, the rPVI and the nPVI (Grabe and Low, Reference Grabe, Low, Gussenhoven and Warner2002; Asu and Nolan, Reference Asu and Nolan2006):
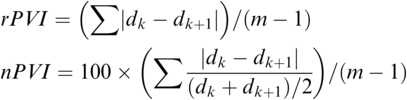
Formally, the PVI measures are metrics: they are derivable directly from Manhattan distance and normalised Manhattan distance (Canberra distance), respectively, which are known metrics. The PVI metrics measure the average ‘next-door-neighbour distance’ between adjacent durations dk, dk+1 of neighbouring intervals in the annotation. A duration sequence d1, …, dm is essentially treated as two overlapping vectors, d1, …, dm-1 and d2, …, dm, and the element-wise absolute difference (distance) between these two vectors is calculated. Manhattan distance, normalised Manhattan distance and similar distance metrics yield comparable results to the PVI metrics.
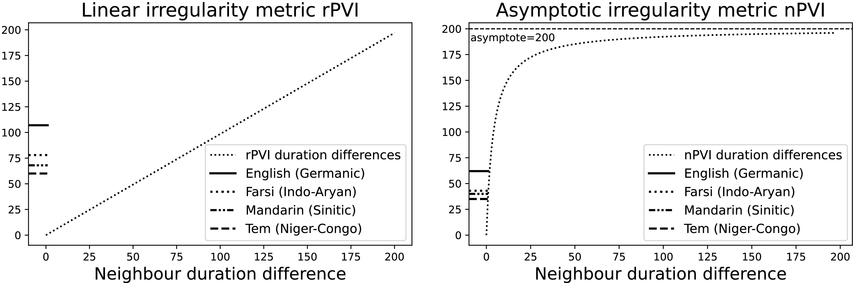
The irregularity measures have been successfully used as heuristics to show systematic regularity differences between formal register data in different languages. The graphs in Figure 23.2 illustrate properties of the two metrics, measured with story readings in different languages. The two metrics yield the same ordering and demonstrate that with both PVI variants, the languages that are considered to tend towards so-called syllable timing, such as Mandarin, Tem (ISO 639-3 kdh) and Farsi, have considerably lower irregularity values than English, with so-called word, foot or stress timing. In Sections 23.7.1 and 23.8.2 the PVI metrics are used as heuristic sources of predictions for RFT/RFA measurements.
The rPVI and nPVI for different languages, showing linear and non-linear properties for the two metrics.

Figure 23.2 Long description
The measures are the raw Pairwise Variability Index (usually used for consonant sequences) and the normalised Pairwise Variability Index (usually used for vocalic sequences).The left-hand graph plots the measured r P V I indices for the four languages along the y axis. The x axis is labelled in steps of 25 from 0 to 200, each step representing a consistent difference level between neighbours in an alternating idealised syllable sequence. The resulting r P V I index is shown on the y axis, and the function is illustrated by a linear diagonal line. Similarly, the right-hand graph for the n P V I has the same structure as the left-hand graph, except that the function shown by the plotted curve is asymptotic, with an asymptote of 200.
23.6 Rhythm Formants: Theory and Practice
23.6.1 Speech Modulation Theory
The approaches that enable analysis of the regularly alternating properties of real-time rhythms in authentic data, such as frequency, magnitude, resonance, bandwidth and persistence, are applications to speech of a signal-processing theory that is as old as radio: speech modulation theory (SMT) (Chapters 8 and 10; Ohala, Reference Ohala1992; Todd and Brown, Reference Todd and Brown1994; Traunmüller, Reference Traunmüller1994; Cummins and Port, Reference Cummins and Port1998; O’Dell and Nieminen, Reference O’Dell and Nieminen1999; Barbosa, Reference Barbosa2002; Galves et al., Reference Galves, Garcia, Duarte and Galves2002; Tilsen and Johnson, Reference Tilsen and Johnson2008; Inden et al., Reference Inden, Zofia, Wagner, Wachsmuth, Miyake, Peebles and Cooper2012; Tilsen and Arvaniti, Reference Tilsen and Arvaniti2013; Gibbon, Reference Gibbon2021, Reference Gibbon2022, Reference Gibbon2023; Frota et al., Reference Frota, Vigário, Cruz, Hohl and Braun2022). Neighbouring disciplines, particularly neurology and neurolinguistics, have applied similar methods (Chapter 5; Meyer, Reference Meyer2018). The RFT/RFA framework is a further development of SMT, introducing the phonetic concept rhythm formant and using the semantic concept of metalocution for the indexical cohesion-marking functions of rhythm.
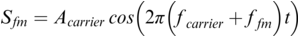
In SMT the speech signal is modelled as a carrier wave that is modulated by information signals: frequency modulation (FM) relating to intonation, pitch accent and tone, and amplitude modulation (AM) relating to the sonority curve shaped by phonotactics, word formation, grammar and patterns of discourse (Ohala, Reference Ohala1992; Galves et al., Reference Galves, Garcia, Duarte and Galves2002). Simplifying the speech production process, the carrier wave is the complex sawtooth-like wave generated in the larynx, with an F0 and a series of harmonics (overtones) as multiples of the F0. The carrier can be imagined as a monotone ‘Ah!’ As in radio frequency technology, the carrier can be represented in stylised form (A: amplitude, f: frequency, t: time; phase is not included):
FM (variable phonation):

AM (variable oral-nasal filter) & FM:
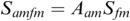
Both the FM and the AM information signals are normalised relative to the frequency and the amplitude of the carrier before modulation. The AM and FM frequencies that are relevant for speech rhythms, between about 10 Hz and 0.1 Hz, are between about 10 and 1,000 times lower than the carrier frequency.
Figure 23.3 shows the three main frequency zones that enter into FM and AM speech signals from a modulation-theoretic perspective. The carrier signal is in the central area of the logarithmic scale between about 70 Hz and 500 Hz (depending on sex, age, conventions and individual factors). The harmonics are amplitude modulated as high-frequency (HF) carriers for phone formants.
Speech modulation frequency scale.
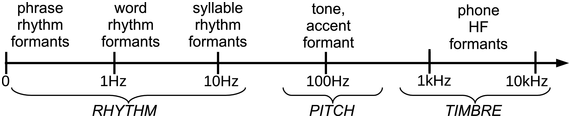
Figure 23.3 Long description
The arrow has regular logarithmically ordered ticks at 0, 1, 10, 100 Hertz and at 1 kiloHertz and 10 kiloHertz. The ticks provide a general orientation for identifying approximate functional frequency ranges in speech: below 15 kHz for speech rhythms, around 100 Hertz and above for fundamental frequency, corresponding to intonation, tone and pitch accents, and three ranges around 500 Hertz for F 1, 1500 Hertz for F 2 and 2500 Hertz for F 3, the three main speech sound formants.
The term rhythm formant is used for LF magnitude peaks in the spectrum, by analogy with HF phone formants, which are also defined acoustically as magnitude peaks in the spectrum. Definitions of LF formants and HF formants differ when based on production and perception rather than transmission of speech.
23.6.2 Demodulation in the RFT/RTA Framework
In speech analysis (and in speech perception), the FM and AM components of the composite carrier wave are demodulated in order to extract the signals representing structural and semantic information. Low-pass-filtered FM demodulation corresponds to F0 estimation (‘pitch’ tracking) in conventional terminology, and the resulting F0 track is interpreted in terms of tones, pitch accents and intonations. Demodulated low-pass-filtered AM approximates to the sonority curve of phonology and provides the acoustic grounding for speech rhythms. In the present study the FM signal is only discussed in passing (Section 23.8.3). RFT adds the following postulate to SMT:
Magnitude peaks in the spectra of the LF FM and AM information signals function as rhythm formants determined by utterance categories from phone and syllable to longer discourse units, and indicate properties of rhythms in the frequency domain: frequency (comparable with speech rate in the time domain), magnitude (how prominent the beats are), resonance (constancy of frequency), bandwidth (the frequency range covered by the rhythm) and persistence (the duration of the rhythmic sequence).
RFA is the methodology associated with RFT. Figure 23.4 illustrates the data flow: inputs and outputs are stored; inputs are demodulated in order to estimate the FM (F0) and AM information signals; fast Fourier transform (FFT) is applied and sets of spectral properties are analysed and compared.
Rhythm formant analysis data flow.
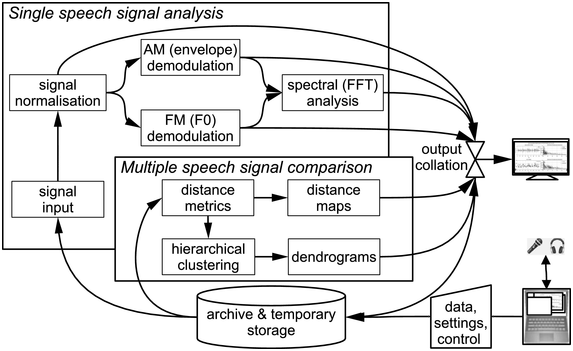
Figure 23.4 Long description
The system begins with an input speech signal. The signal is normalized, which is followed by A M demodulation, F M demodulation, and spectral analysis, from which properties such as spectral variance are derived. Multiple speech signals are compared, based on the spectral properties using metrics such as Euclidean Distance, which are used for the generation of the distance maps. The distances are also used together with linkage criteria in hierarchical clustering. The cluster hierarchies are represented as dendrograms. The results of the output are then collated and the collated results are then displayed on the monitor and stored.
For FM demodulation (see Section 23.8.3), a modified time domain algorithm is used, AMDF (average magnitude difference function) with preprocessing and post-filtering. AM demodulation is performed by obtaining the absolute values of the low-pass-filtered waveforms and smoothing the resulting amplitude envelope (see figures in Sections 23.7 and 23.8). The absolute Hilbert transform (He and Dellwo, Reference He and Dellwo2016) and other techniques are also used for AM demodulation.
In RFA the demodulated FM and AM signals are analysed holistically by applying an FFT to the entire recording, or to a selected long stretch of the recording, with transform windows of several seconds. The LF spectrum shows frequency × magnitude, with no temporal information.
To regain temporal information, an LF spectrogram is calculated with overlapping spectral slices (time × frequency × magnitude). The spectrogram allows detection of rhythm resonance, bandwidth and persistence as well as frequency. Several property vectors and variance values, for example, the ten most prominent well-defined peaks or the entire LF spectrum (Section 23.7), are then compared using unsupervised cluster analysis (Section 23.8).
23.7 Exploratory Case Studies of Spoken Registers
23.7.1 An Interactive Protodialogue Register: Talking Twin Babies
A well-known YouTube meme is ‘Talking Twin Babies’, showing video recordings of the ‘communicative babbling’ of 17-month-old American twins in a kitchen, holding a prosodically very fluent-sounding conversation with each other, using only iterations of the single-syllable ‘da’.Footnote 1 The children are apparently imitating conversations between older children or adults. The overall duration of the selected dialogue is 112.41 seconds. In the present context the dialogue is a minimal interactive speech register, and a true ‘language game’ (see also Daikoku and Goswami, Reference Daikoku and Goswami2022; Chapter 38 on infant speech registers).
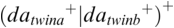
The dialogue grammar is iterative and has two iteration levels: the utterance cycle enclosing the cycle with the syllable ‘da’. Iteration cycles are easily modelled in a finite state machine, which requires only linear processing time and finite working memory, a realistic assumption. This contrasts with recursive grammars, which, an unrealistic assumption, in principle require non-linear processing time and non-finite working memory, though they are often used as a convenience. The finite state grammar also relates easily to rhythms as beat iterations (see Pierrehumbert, Reference Pierrehumbert1980, whose finite state intonation grammar can also be interpreted as a rhythm machine). The grammar is rendered here as a regular expression: a disjunction of at least one utterance by a twin of at least one ‘da’ syllable:
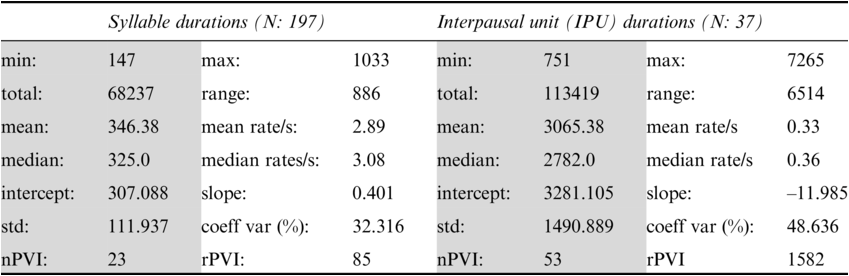
Annotation mining is used to predict values for possible confirmation in the follow-up RFA analysis (see Figure 23.5 (top)). Table 23.1 lists a selection of descriptive statisticsFootnote 2 for syllable and interpausal unit (IPU) annotation. There are 147 syllables with mean syllable durations of 346.38 ms, a relatively slow rate of about 2.89 syll/s. For comparison, syllable rates in adult reading aloud and conversation in the Aix-MARSEC database (Auran et al., Reference Auran, Bouzon and Hirst2004) were measured as reference values, finding tempo variation between about four syll/s for religious readings and poetry readings, and almost six syll/s for radio news. The nPVI metric for syllables yields an average ‘next-door neighbour distance’ of 23, a highly regular pattern, in contrast to values near 40 for Standard Mandarin (often said to have syllable timing) and near 50 for English (often said to have foot, word or stress group timing). The intra-IPU duration slope is 0.401, indicating tempo deceleration.
Dialogue registers: top, 20 s, toddlers (Section 23.7.1); bottom, 18 s, caller–choir exchange (Section 23.7.2).
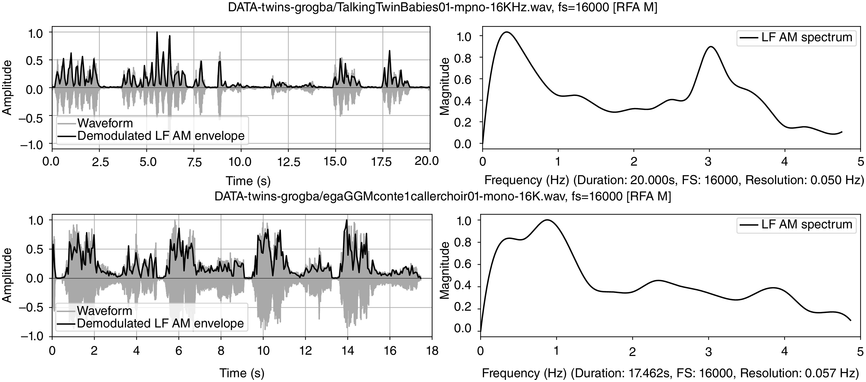
Figure 23.5 Long description
The top two panels show time-domain and frequency domain visualisations of data from a 20 second monosyllabic conversation between two American toddlers. The bottom two panels show time domain and frequency domain visualisations of 20 seconds of data from interactive choral storytelling in the Niger-Congo language Ega. The left-hand top and bottom panels show amplitude of the waveform and superimposed amplitude modulation envelope as a function of time. The right-hand panels represent demodulation of the A M envelope as a low frequency spectrum below 5 Hertz. Peaks in the spectrum show different speech rhythms and are termed rhythm formants. In the toddler spectrum, there are two prominent peaks, one at about 0.3 Hertz representing utterance repetition rate and one at about 3 Hertz representing syllable rate. In the Ega choral narrative data there are four main peaks, at about 0.25 Hertz representing utterance rate, 1 Hertz representing phrase rate, 2.25 Hertz representing word rate and 4 Hertz representing syllable rate. Both the toddler utterances and the choral narrative are syllable-timed, and the latter has a higher degree of rhythmic complexity above the syllable level.

Each IPU is measured with the following pause. The mean IPU duration of 3.065 s and the 0.33 IPU/sec rate, with an nPVI distance of 53, is quite irregular. The slope of ‒11.985 for IPU duration sequences is negative, indicating shorter IPUs as the utterance proceeds. The toddler syllable sequences are synchronised with dance-like arm and leg movements.
The mean syllable rate of 2.89 syll/s suggests that a spectral magnitude peak at around 2.89 Hz will be found as a syllable rhythm formant. Similarly, the IPU rate of 0.33 IPU/sec suggests that a spectral magnitude peak of around 0.33 Hz will be found as an IPU rhythm formant. These values are taken as predictions for the RFA analysis.
Figure 23.5 (top) visualises the RFA measurements of the twin toddler dialogue. The left panel shows the waveform (grey values) and the demodulated amplitude envelope (dark positive values). The right subpanel shows a representation of the LF spectrum, smoothed with a moving median filter and spline interpolation. The spectrum of the toddler dialogue shows two very well-defined peaks, one at 0.3 Hz (IPU rhythm formant) and one at 3 Hz (syllable rhythm formant), as predicted by the annotation mining, showing superposed IPU and syllable rhythms as metalocutionary pointers to the dual patterning of the dialogue grammar. The extreme regularity is generated jointly by both toddlers and can thus be seen as evidence for rhythm entrainment (Chapter 29; Cummins and Port, Reference Cummins and Port1998; Inden et al., Reference Inden, Zofia, Wagner, Wachsmuth, Miyake, Peebles and Cooper2012; Rathcke et al., Reference Rathcke, Lin, Falk and Dalla Bella2021) in natural speech.
23.7.2 A Poetic Interactive Dialogue Register: Ega Orature
23.7.2.1 Structure and Spectrum
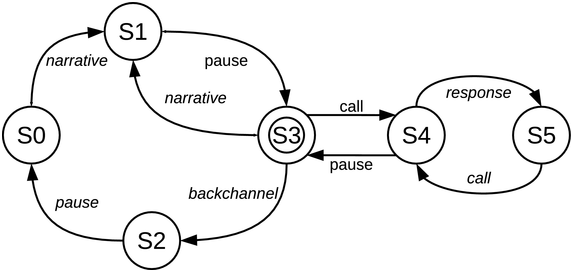
Part of an interactive orature session is analysed: a story in Ega, an endangered Niger–Congo language with agglutinative tonal morphology, spoken in South Central Ivory Coast (ISO 639-3 ega; Gibbon, Reference Gibbon2023). The selected session segment consists of a chanted caller–choir exchange (adjacency pairs) between the narrator and the audience. The dialogue grammar for the orature session as a whole can be modelled as a finite state machine (as already noted, an appropriate formalism for rhythm iteration), here in transition network format (Figure 23.6) with four iterating cycles: narrative-pause; narrative-pause-backchannel-pause; call-response chant; overall narrative-chant.
State machine (finite transition network) representing Ega orature dialogue grammar.

Figure 23.6 Long description
From the start state a narrative transition initiates a narrative-pause cycle, and may branch to a call-response cycle returning to the narrative-pause cycle or to a backchannel cycle leading back to the start state. The figure represents a finite state transition network as a model of dialogue flow in Ega interactive choral narrative. The full definition for each state and transition in the state machine is: Start state: S 0. Terminal state: S 3. States: S 0, S 1, S 2, S 3, S 4, S 5. Vocabulary: narrative, pause, call, response, backchannel. Transitions: S 0 narrative to S 1, S 1 pause to S 3, S 3 narrative to S 1, S 3 call to S 4, S 3 backchannel to S 2, S 2 pause to S 0, S 4 response to S 5, S 4 pause to S 3, S 5 call to S 4.
23.7.2.2 Resonance, Persistence: The LF Spectrogram
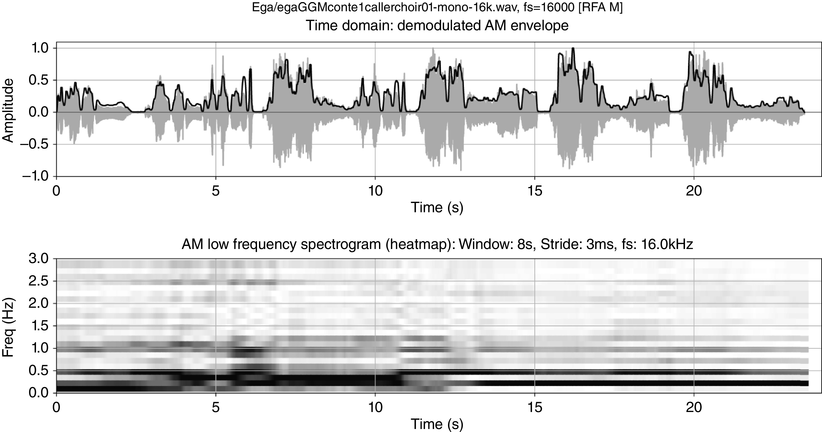
Figure 23.5 (bottom) shows the waveform, amplitude envelope and LF spectrum of one of the chant exchanges. The peaks below 1 Hz, at 0.25 Hz and an octave higher at 0.5 Hz reflect the overall two cycle levels of caller–choir and caller and choir, respectively. The example illustrates metalocutionary cohesive functions of multiple rhythms as markers of locutionary patterns.
The atemporality deficit of the spectrum is remedied by using an LF spectrogram (Figure 23.7) to show the resonance and persistence of rhythms (see Todd and Brown, Reference Todd and Brown1994; Greenberg and Kingsbury, Reference Greenberg and Kingsbury1997). The spectrogram frequency and temporal resolutions are low because of the Küpfmüller time-frequency uncertainty principle  (meaning that time windows and frequency ranges cannot both be arbitrarily reduced), and therefore a long FFT window is needed in order to capture the low frequencies. The low temporal resolution is partly compensated for by overlapping the spectral slices.
Low-frequency spectrogram: first chant section of the orature session.

Figure 23.7 Long description
The top plot shows the time domain waveform with superimposed amplitude modulation envelope. The bottom plot shows the demodulation of the A M envelope as a low frequency spectrogram. Frequencies of speech rhythm formants are clearly visible as rhythm bars in the spectrogram. The plots have representations whose x axes are time-aligned with each other, with time steps from 0 to 20 seconds. The y axis of the top plot shows signal and envelope amplitude as a function of time. The y axis of the bottom plot shows the changing spectrogram frequencies as functions of time. As a third dimension, the magnitudes of frequencies at different points in time are represented by grey shading: the stronger the darker. Formant-like horizontal bars in the spectrogram show time intervals where the same frequency is maintained at high magnitude. These bars are referred to as rhythm bars.
The chant rhythms appear in the spectrogram as rhythm formant bars an octave apart, at 0.25 Hz and 0.5 Hz, as in the spectrum, starting at about 12 s. In addition to frequency, rhythm bars have temporal properties of resonance and persistence and point to dialogue sections, showing the metalocutionary cohesive function of discourse rhythms. Since the rhythm formants are jointly supplied by audience members, together with their shared metalocutionary function, they can be seen as further evidence for natural speech–song entrainment.
23.7.3 A Practical Register: L2-Reading Aloud
The text prompt is the IPA benchmark text, an English translation of Aesop’s fable The North Wind and the Sun, which has been used in previous rhythm studies to compare language varieties (e.g., Tilsen and Arvaniti, Reference Tilsen and Arvaniti2013; Gibbon, Reference Gibbon2021). For present purposes, reading aloud in a second language (L2) is regarded as a different register from reading aloud in the first language (L1).
There have been many descriptions of L2 fluency in the time domain in relation to the rhythms of partially automatised production skills: syllable rate and reduction, mean run (IPU) duration, filled and unfilled pause ratio, and expert ratings (see overviews in Thomson, Reference Thomson, Reed and Levis2015; Trouvain and Braun, Reference Trouvain, Braun, Gussenhoven and Chen2020). The use of frequency domain spectral parameters for L2 fluency assessment was introduced by Gibbon and Lin (Reference Gibbon and Li2019) and Gibbon (Reference Gibbon2023), showing that RFA can be used to distinguish between three speaker types: British native speakers as readers, a fluent Chinese speaker of L2 English and a class of intermediate-level L2 students of English.
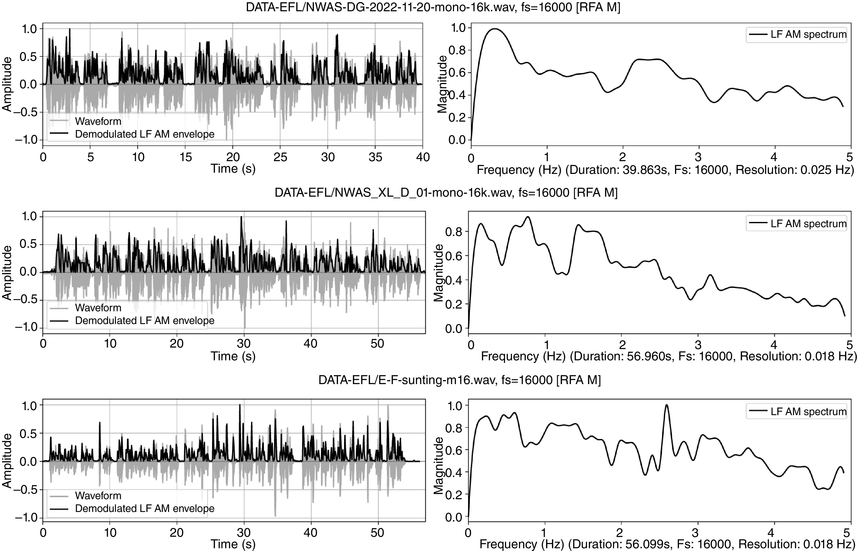
Visual inspection of the LF spectra in Figure 23.8 reveals conspicuous differences between speaker types. The top panel (male British native speaker, reading duration 40 s) shows a clear sentence rate at 0.3 Hz and a foot (pitch accent) rate between 2 and 3 Hz. The middle panel (accented though fluent female Chinese university teacher of L2 English, reading duration 60 s) shows IPU peaks at 0.2 and 0.8 Hz, and foot peaks around 1.5 Hz, indicating less regular IPUs and a slower foot rate than the native speaker. The bottom panel (intermediate-level male Chinese student of English, Tongji corpus, Yu, Reference Yu, Bigi and Hirst2013, reading duration 55 s) shows a very scattered distribution of peaks, a possible indicator of uncertainty and lower fluency. The comparison indicates that metalocutionary cohesion marking can be a component of fluency evaluation, and that RFT/RFA analysis can help to identify these markers.
English: top, L1 male, South-Eastern British English; middle: Chinese L2 female (fluent); bottom, Chinese L2 male (less fluent).

Figure 23.8 Long description
Each row shows story-telling data from readers of English with different degrees of fluency: English native readers in the top row, Mandarin Chinese female readers in the centre row and Mandarin Chinese male readers in the bottom row, showing decreasing degrees of spectral regularity, representing fluency. The left-hand top and bottom panels show amplitude of the waveform and of the superimposed amplitude modulation envelope as a function of time. The right-hand panels represent demodulation of the A M envelope as a low frequency spectrum below 5 Hertz. Peaks in the spectrum show different speech rhythms and are termed rhythm formants. The results show relatively even frequency distribution in the English native reader spectrum, somewhat more irregular frequency distribution in the Mandarin Chinese female spectrum and even more irregular frequency distribution in the Mandarin Chinese male spectrum. The degrees of irregularity are interpreted as degrees of fluency.
23.8 Stylometric Rhythm Comparison with RFT/RFA
23.8.1 Comparison Methods
Having analysed different kinds of data, RFA results from different data samples can be compared. RFA output is a set of vectors of spectral parameters that are relevant for rhythm analysis. The values include frequency and amplitude envelopes; spectra and trajectories of highest-magnitude frequencies in the spectral slices of spectrograms; FM and AM magnitude peaks; and vector variance.
Unsupervised clustering algorithms are used to compare rhythms of different speakers as an alternative to classical difference testing. In Section 23.8.2 k-means clustering is shown as a scatter plot with marked clusters. Vector pairs can also be compared using distance metrics and display of the resulting distance network. Another method is to use the values from a distance network together with a clustering criterion to calculate a hierarchical dendrogram (Section 23.8.3).
23.8.2 Comparison of Newsreading and Poetry Reading
The data compared in this section are from the Aix-MARSEC database (Auran et al., Reference Auran, Bouzon and Hirst2004) and are identified by ID in the figures: newsreadings and poetry readings (Gibbon, Reference Gibbon2022), with mainly male readers. Excerpts from the selected recordings are as follows (shorter pauses are marked ‘|’ in the newsreading transcript, longer pauses as ‘||’; rhyming lines are marked ‘||’ and half-lines ‘|’ in the transcript of the poetry reading):
BBC news extract: A thousand people were led to safety | after being trapped by a fire | in the London underground last night. || Many had to walk along the track to the nearest station.||
Poem Eunice, written and read by John Betjeman, first stanza: With her latest roses | happily encumbered || Tunbridge Wells Central | takes her from the night, || Sweet second bloomings | frost has faintly umbered || And some double dahlias | waxy red and white.||
The annotation-mining results in Table 23.2 show that syllable and word rates are faster for the newsreading (‘B’) than for the poetry reading (‘H’): 5.53 syll/s versus 3.89 syll/s, and 3.68 word/s versus 2.65 word/s. The IPU rate for the newsreadings is slower mainly because the utterances are longer than the lines of the poetry readings. Despite these differences, the nPVI values for syllables (51:53) and words (68:69) are almost the same in the two cases. The IPUs (77:31) show a striking but expected difference: the newsreading IPUs are very irregular while the poetry reading IPUs are very regular. Standard deviation and coefficient of variation confirm the difference, suggesting that automatic comparison may be possible.
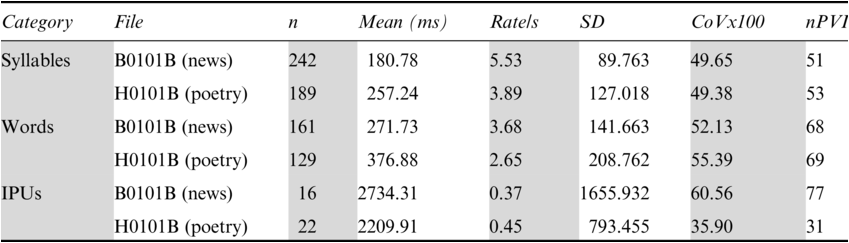
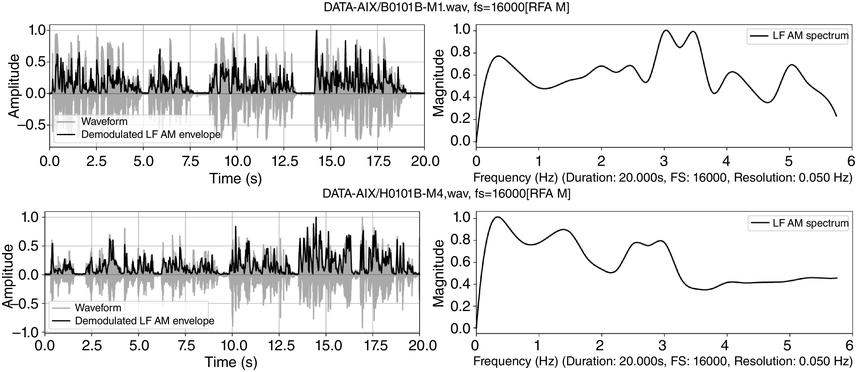
An RFA analysis of 20 s of each recording was made, from 15 s to 35 s into the recording. The results are shown in Figure 23.9, with the demodulated AM envelopes of selected intervals of the newsreading (upper row) and the poetry reading (lower row) – in the left-hand panels – in the time domain, and the holistic LF spectra of these intervals – in the right-hand panels – in the frequency domain. The demodulated envelopes have very different amplitude distributions.
RFA demodulation and LF spectrum outputs for a newsreading (top) and a poetry reading (bottom).
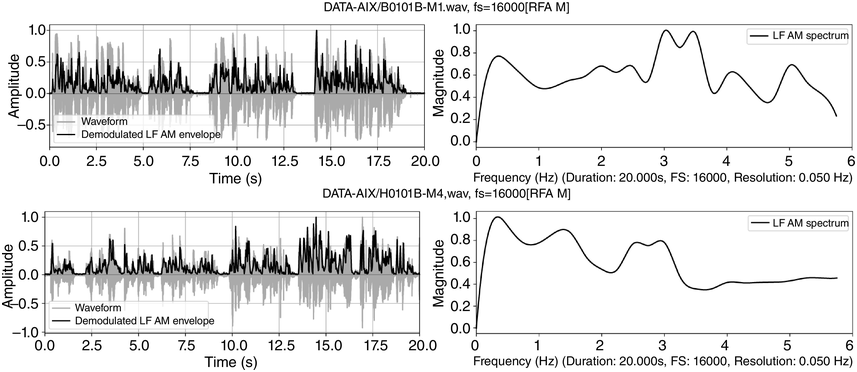
Figure 23.9 Long description
The top two panels show time-domain and frequency domain visualisations of data from a 20 second radio news reading. The bottom two panels show time domain and frequency domain visualisations of 20 seconds of data from the poet John Betjeman reading his poem Eunice.
The LF spectral differences correspond to the annotation-mining results. The left-hand rhythm formant of the newsreading (about 0.3 Hz) corresponds approximately to the mean IPU rate (0.37 IPU/s). The peaks between 3 and 4 Hz approximate to the mean annotated word rate of 3.68 syll/s, and the peak at about 5.2 Hz approximates to the mean annotated syllable rate of 5.53 Hz. Different syllable types and small variations in timing account for the bandwidth of frequency variation within the different spectral regions.
So far, the broad peak at 1.5 Hz and the peak at 5 Hz in the poetry readings are unaccounted for. The situation is quite complicated because the fourfold structure of the poem (syllable, word, half-line, line) does not easily match the three phonetic categories of syllable, word and IPU. The broad peak at 1.5 Hz may mean somewhat variable half-line durations, and the broad peak at 5 Hz may denote weak, unstressed syllables. The LF spectrum of the poetry reading (lower right) differs: the IPU rate (lines of the poem) was measured at 0.45 Hz, and a peak is observed at approximately 0.4 Hz. There are also peaks at 1.5 Hz and 3 Hz, and at just under 4 Hz, and at 5 Hz. The small 4 Hz peaks relate to the 3.89 syll/s measured syllable rate, and the 2.65 word/s rate relates to the frequency peak at about 2.7 Hz.
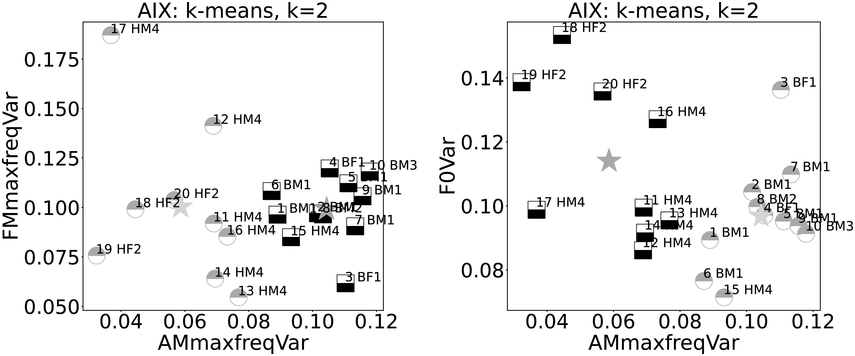
Ten examples each from these two reading registers are compared using k-means clustering, k=2. The graphs in Figure 23.10 show the AM spectrogram trajectory on the x-axis. The left-hand graph has the FM spectrogram trajectory of highest-magnitude frequencies on the y-axis, and the right-hand graph y-axis shows F0 variance (newsreading: ‘B’, poetry reading: ‘H’; male: ‘M’, female: ‘F’; speaker index: numbers; centroids as stars). The x-axes show a near-partition between the registers, with just one ‘H’ outlier. The FM spectrogram trajectory (y-axis) does not show clear category separation, while F0 variance (relating to linear F0 range) shows higher values for female readers.
Comparison of variances of newsreadings (B) and poetry readings (H).

Figure 23.10 Long description
Each plot shows the relationship between two variables. The left-hand plot shows variance of amplitude modulation on the x axis and variance of frequency modulation on the y axis. The distribution of the two data types shows a clear separation according to data type and k-means cluster along the x axis but random distribution along the y axis. The right-hand plot shows the distribution of the two data types according to A M maximum frequency variance and fundamental frequency variance. The data types are assigned accurately to clusters on the x axis but are randomly distributed on the y axis.
When distances between the AM spectrogram trajectories (paths of frequencies with highest magnitude in each spectral slice) are compared with an additional criterion of agglomerative hierarchical clustering, a clear partition between the two registers emerges (see Figure 23.11); the length of the branches indicates the size of the inter-cluster difference. This result is obtained reliably with different common distance metrics (Chebyshev, Euclidean, Manhattan) and all available clustering criteria (including farthest neighbour, nearest neighbour, mean, median and variance minimisation). It is not obtained with Cosine and Pearson distance, showing the relevance of absolute difference, not trajectory shape.
Hierarchical clustering of newsreading and poetry reading (Euclidean distance and farthest neighbour clustering).
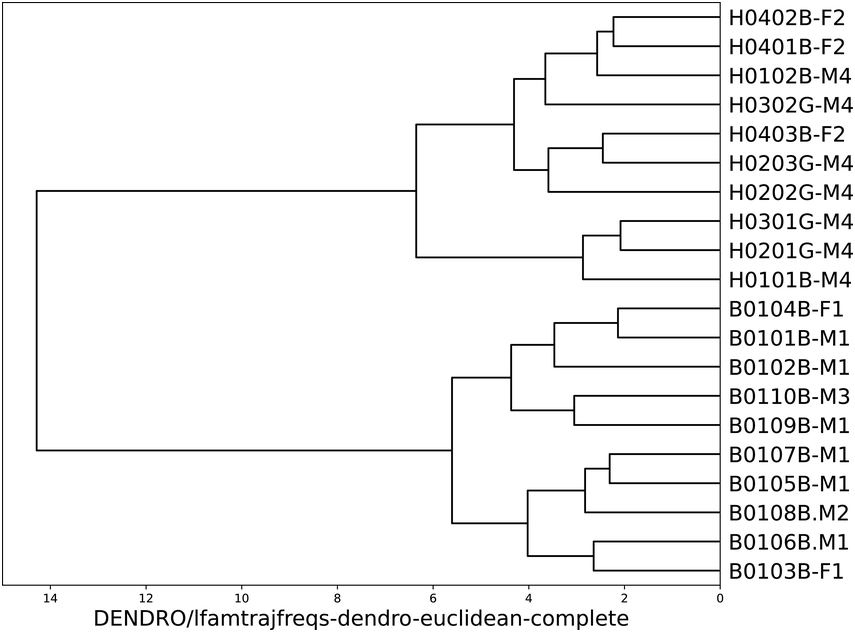
Figure 23.11 Long description
The major branch shows a perfect partition between the two data types. The subgroups in each data type are not further investigated. The comparison criterion is the low frequency spectrum trajectory derived from the amplitude modulation envelope, and the data are compared using Euclidean distance and complete linkage, also known as farthest neighbour linkage.
23.8.3 Comparison of Poetry Genres
In a cooperative ventureFootnote 3 with a specialist in Chinese–English literary translation, two types of poetry were examined, not in contemporary languages but in a hybrid scenario: Tang dynasty Chinese poetry from the seventh and eighth centuries CE in modern recitations from the early-twenty-first century CE (see also Gibbon, Reference Gibbon2022).
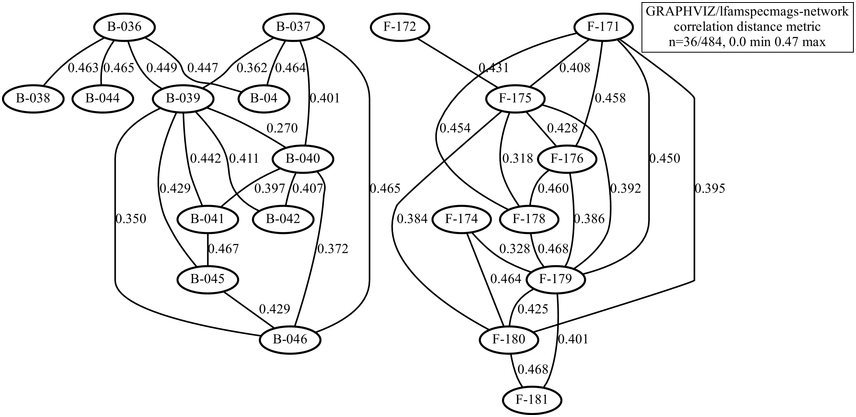
The types of poem to be compared are the five-character line and seven-character line genres, with 11 poems of each type, including rhythm influences from different conventional tonal patterns. Intuitively, it is expected that the rhythms of the two genres differ at the level of line-length rhythms. The demodulated signals were duration-normalised and the spectrum shapes, rather than distance, were compared using a Pearson distance measure, for example 1-abs(r). The resulting network is shown in Figure 23.12. An exact partition was found at a distance limit of 0.47 (the range is 0 … 1): the five-syllable (‘B’) poems are on the left in the figure, and the seven-syllable (‘F’) poems are on the right. There is sufficient distance between B and F genres and sufficient intra-genre proximity to yield separate B and F graphs.
Distance network with modern recitations of two genres of Tang dynasty poetry.

Figure 23.12 Long description
The nodes represent different readings, and the partition between the two networks represents a partition between two different poetry genres. The edges between the nodes represent the numerical distances or differences between the readings.
23.9 Results and Conclusions
In preparation for the rhythm analyses and comparisons, close attention was paid to methodological assumptions about register, rhythm and phonetic analysis as determinants of models of the physical reality of rhythm, in the sense noted at the beginning of the Introduction. Exploratory case studies of six different register scenarios and their dynamic rhythm formant properties were carried out, and unsupervised cluster comparisons were conducted with RFT and RFA, a recently developed modulation-theoretic signal-processing framework, using annotation mining as a heuristic source of hypotheses for these analyses. The analyses demonstrated distinctive rhythms in authentic natural data from spoken registers and their metalocutionary functions as indexical markers of locutionary cohesion.
The case study datasets are very small, so the results, though clear, may not be fully generalisable. Nevertheless, exploratory case studies of this kind are useful sources of hypotheses for future research. Further exact numerical modelling of rhythm formant properties of frequency, magnitude, resonance, bandwidth and persistence remains to be done. The important point to be retained, however, is the proposition that natural real-time rhythms with long-term LF acoustic properties can distinguish between speech registers, styles or genres.
Open issues for future work concern more detailed rhythm properties that can be found in the natural performance of speech, as in musical performances, such as syncopation, attack and decay, or sustain and release. Some of these properties depend on the phonotactics of languages (for example, a preponderance of voiceless fricatives as opposed to sonorants may relate to an ‘attack’ category), as in the well-known pair takete–maluma (Köhler, Reference Köhler1929) with voiceless obstruents in the first word and nasal sonorants in the second. Such properties may be relevant for explaining subjective attractiveness or unpleasantness judgments of rhythms and musicality in typologically different languages.
The results indicate that there are ‘real-time rhythms’ beyond the abstract ‘linguistic rhythm’ domain that can be captured by means of physically grounded empirical analysis, and that have identifiable metalocutionary functionality, marking meaningful cohesive locutions. Applications are anticipated not only in acoustic phonetic speech stylometry, as in the present study, but in speaker, language and register identification and search, including forensic search, pertaining to other categories and dimensions of speech in and beyond the acoustic domain.
Summary
Spectral properties of amplitude and frequency modulation of speech are cues to physical correlates of speech rhythms. Low frequency spectral differences approximate to annotation-mining results and correspondences between rhythm formants in the frequency domain, and word, phrase and discourse units can be established. Rhythm comparisons are visualised using the distance networks and hierarchical clustering that characterise text stylometry and dialectometry.
Implications
Spectral analysis shows that the term ‘linguistic rhythm’ for numerical encoding of grammatical structure is far from providing a general rhythm theory with empirical grounding of speech rhythms. Measurable spectral properties of spoken language relate to linguistic units as well as to the rhetorical and poetic patterns of speech, and also extend stylometric and dialectometric studies into the real-time physical domain of speech. The RFT/RFA framework provides a path towards more detailed investigation of the prosodic correlates of linguistic categories and an acoustic grounding for studies of neural oscillations.
Gains
The novel concept of rhythm formant advances modulation-theoretic comparison of speech rhythms by setting specific spectral properties in relation to linguistic units. Further, the formal semantics of rhythm, defined as metalocutionary indexical pointers to cohesive patterns in the lexico-syntactic utterance patterns, here defined with finite state machines, represents a step towards a formal semantics of prosody. Practical uses in speech classification, self-taught language-learning applications and language fluency evaluation are anticipated.


 Open access