


Introduction
September 2021 marked the end of Angela Merkel's 16‐year‐era as German Chancellor. While the SARS‐CoV‐2 pandemic overshadowed her last term in office, one of the defining moments of her legacy was her role in the so‐called ‘EU refugee crisis’. On September 5, 2015, Merkel decided to allow thousands of asylum seekers to cross the border into Germany after suspending the Dublin Regulation – an European Union (EU) regulation restricting migrants’ rights to claim asylum in the EU member state they first set foot in. Between 2015 and 2017, Germany received approximately half of all asylum claims submitted across the EU, with 1.1 million applications in 2015 alone (Brücker et al., Reference Brücker, Jaschke and Kosyakova2019).
Merkel's decision was met with fierce criticism at the time. One of the critics’ key concerns in 2015 was that the ’failure‘ to close Germany's borders to potential refugees would create a ’pull effect‘ by signaling an open‐door policy to aspiring migrants worldwide, thus leading to higher levels of subsequent migration to Germany.
In this short research note, we pursue a cross‐validation strategy to assess the validity behind the ‘pull effect’‐hypothesis (often referred to as the ‘Merkel effect’ in Germany) by using various data sources and modeling approaches. This approach provides convergent evidence by showing consistent results across data sources and models. This cross‐validation or ‘triangulation’ strategy lends credibility to the results while mitigating limitations associated with each individual data source or estimation method.
We analyze migration both in terms of aspirations to migrate to Germany and actual migration flows into Germany and assess changes resulting from Merkel's 2015 decision over time. After providing a descriptive picture of migration trends pre‐ and post‐2015 for Germany, we apply an inferential approach using a series of panel analyses, event study models and difference‐in‐difference estimations to account for additional intervening factors. We use data on asylum claims, migration inflows, emigration intentions and Google searches.
Consistent across data sources and models, we do not find any evidence that Merkel's decision increased migration to Germany in subsequent years. The main results suggest that Merkel's famous 2015 decision was the culmination of a process that started before rather than being the cause of a ‘pull effect’ that induced a new migration dynamic. The September 2015 policy change is thus a prime example of an endogenous reaction of policymakers to a trend that has subsequently been mischaracterized as a cause of said trend. We conclude by discussing potential reasons for the absence of any lasting ‘pull effect’ and the external validity of this particular case study.
With the global forced displacement continuously rising (UNHCR, 2020), the German case provides an important policy lesson regarding the medium‐term implications of welcoming populations seeking refuge. Providing such empirical evidence has again become highly relevant given the recent Russian invasion of Ukraine and the ensuing displacement of millions of Ukrainian refugees across EU countries. The 2015 case study also contributes to long‐standing debates in various academic fields (including economics, sociology and political science) regarding the effects of migration policies on migration flows (Czaika & de Haas, Reference Czaika and de Haas2013; Freeman, Reference Freeman1994). The evidence of such effects is highly mixed. As (many) policymakers rely on empirical evidence to guide important decisions, more studies are needed to reach converging results and understand what drives studies’ differences.
Effect of migration policies and the pull effect hypothesis
The ‘pull effect’ hypothesis was discussed widely in the media in 2015 and 2016. In an interview with a leading German newspaper, Oxford professor Paul Collier described ‘hundreds of millions of people’ searching for a better life who, once set in motion, would cause an unmanageable situation. Collier blamed Merkel's decision for the ‘refugee crisis’ by ‘inviting’ migrants to make their way toward Germany.Footnote 1 Merkel's own finance minister and party member Wolfgang Schäuble was quoted as saying, ‘in the countries where refugees come from and where people contemplate migration, people are asking themselves, “why do we stay here if we are so welcomed in Germany?”’ (Alexander, Reference Alexander2018).
At the heart of the ‘pull effect’ claim lies the general assumption that government policies affect subsequent flows in a lasting way. The assumption applies to the case of welcoming policies (such as Merkel's 2015), but also the reverse, government policies to deter or dissuade migrants from coming to a particular destination country. Recent examples of deterring migration include efforts to externalize asylum processing (e.g., the United States, United Kingdom and EU), border reinforcements (Eastern Europe, the United States and Turkey) and information campaigns (the United States and EU) (e.g., Fitzgerald, Reference FitzGerald2020; Pagogna & Sakdapolrak, Reference Pagogna and Sakdapolrak2021).
Overall, the available empirical evidence on the effects of migration policies on migration flows is limited and mixed (Czaika & de Haas, Reference Czaika and de Haas2013; de Haas et al., Reference de Haas, Czaika, Flahaux, Mahendra, Natter, Vezzoli and Villares‐Varela2019). While some studies argue that migration policies have essentially no impact on migration flows (Bhagwati, Reference Bhagwati2003; Massey et al., Reference Massey, Durand and Pren2014; Ryo, Reference Ryo2013), others have shown significant effects of policy changes or general policy openness on subsequent migration flows (Bazzi et al., Reference Bazzi, Hanson, John, Roberts and Whitley2021; Beine et al., Reference Beine, Docquier and Özden2015; Bratu et al., Reference Bratu, Dahlberg, Engdahl and Nikolka2020; de Haas et al., Reference de Haas, Czaika, Flahaux, Mahendra, Natter, Vezzoli and Villares‐Varela2019; Fitzgerald et al., Reference Fitzgerald, Leblang and Teets2014; Freeman, Reference Freeman1994; Helbling & Leblang, Reference Helbling and Leblang2019; Neumayer, Reference Neumayer2004; Ortega & Peri, Reference Ortega and Peri2013). One explanation for inconsistent or contradicting results is the large variation in (national, legislative and geographic) contexts, target policies (border enforcement, social benefits, asylum processing and rights, employer sanctions, etc) and migration groups. Another reason why findings appear to be difficult to generalize across case studies is a lack of discussions about (causal) mechanisms. Despite notable exceptions (Fitzgerald et al., Reference Fitzgerald, Leblang and Teets2014; Neumayer, Reference Neumayer2004), most studies remain silent on how exactly policies shape flows. Mechanisms are mostly implicitly assumed but rarely explicitly stated and discussed.
The aspiration‐capability framework (Carling, Reference Carling2002; de Haas, Reference de Haas2021) understands migration as a two‐step process of forming aspirations to leave (or not) and subsequently acting on these aspirations (or not). Policies, such as the suspension of the Dublin Regulation at the German border in September 2015, can have varying effects depending on the phase of the decision‐making process. First, policies may directly impact migration flows through physical and geographic borders and enforcement (e.g., border checks and barriers) that can reduce migration by physically limiting individuals’ capabilities to move. Second, policies may influence aspirations for migration as ‘signals’ of openness may change potential migrants’ cost‐benefit calculations (Fitzgerald et al., Reference Fitzgerald, Leblang and Teets2014). Policies signaling openness would reduce the (perceived) inherent costs and risks involved in undertaking migration, particularly in the context of irregular and forced migration (Todaro & Maruszko, Reference Todaro and Maruszko1987). It may also signal a welcoming society more likely to support migrants after arrival. For example, some claim that changes in governing party ideology towards more open migration policies (relative to the government in origin countries) can attract migration (Bove et al., Reference Bove, Efthyvoulou and Pickard2023). Thus, learning about the possibility of doing so, due to welcoming policies by potential destination countries, may spark migration intentions. For others who already hold migration aspirations, a perceived greater openness of Germany after the policy change may redirect migration flows or induce previous ‘involuntary non‐migrants’ (Carling, Reference Carling2002), that is, people with migration aspirations who (previously) lacked capabilities to migrate.
At its broadest conception, the ‘pull effect’ hypothesis is status‐agnostic, including irregular, asylum‐related and regular migration. Welcoming policies targeting one particular group (asylum seekers) may spill over to other migration channels as Germany is more generally seen as a more open and welcoming destination country. In this case, signaling openness and a welcoming attitude toward migrants could induce a sustained increase in migration intentions and actual migration to Germany. Given that visas are hard to come by for non‐EU citizens, many mixed migrants could be expected to try their luck as asylum seekers.
In contrast to these arguments, the ‘pull effect’ hypothesis may be a priori implausible on theoretical grounds. First, the pull effect hypothesis assumes that migrants are informed about policy changes and the relative openness and restrictiveness of destination countries. The assumption that potential asylum seekers use information about policies in destination countries when making decisions has often been challenged (Crawley & Hagen‐Zanker, Reference Crawley and Hagen‐Zanker2018; Fleay et al., Reference Fleay, Cokley, Dodd, Briskman and Schwartz2016; Gilbert & Koser, Reference Gilbert and Koser2006). Second, migration trends may follow a ‘regression toward the mean’ process, where peak migration years are unlikely to be followed by similarly high levels of migration. That may be because potential migrants who were considering leaving have already done so, decreasing the pool of prospective migrants to be affected by the policy.
Data and empirical strategy
Data sources and key measurements
To test the ‘pull effect hypothesis’, we leverage several data sources (see more details on sources in the Supporting Information Appendix I). Replication materials are available at https://osf.io/fpsej/.
First, we use data on migration flows to Germany based on the number of new registrations of established residents in a county provided by the Federal Statistical Office ’Destatis‘. We use complementary data for flows by the European Statistical Office (Eurostat) to compare migration to Germany with other EU destination countries and migration statistics released by the organisation for economic co‐operation and development (OECD, 2008) for additional econometric analyses (see Supporting Information Appendix's Section II.1). Second, we use data on the number of new asylum claims provided by the Federal Agency for Migrants and Refugees (BAMF). Third, we analyze migration aspirations using the estimated number of people who intend to migrate to Germany as measured by the Gallup World Poll (Gallup, 2008), which has been collected since 2006 and includes nationally representative surveys conducted regularly (usually annually) for most countries worldwide. Previous studies showed that migration intentions strongly correlate with actual migration behavior (Tjaden et al., Reference Tjaden, Auer and Laczko2019). Fourth, we analyze online search interest in migration from Google search data made available through the public Gtrends API. Google searches have been used to proxy migration aspirations (Böhme et al., Reference Böhme, Gröger and Stöhr2020) and used successfully to predict migration flows (Avramescu & Wiśniowski, Reference Avramescu and Wiśniowski2021; Boss et al., Reference Boss, Groeger, Heidland, Krueger and Zheng2022; Wanner, Reference Wanner2021). We use an adjusted and weighted measure to reflect the relative search intensity of migration‐related searches in connection with specific destination countries (see Section I.1 of the Supporting Information Appendix for details).
It is important to note that migration is a complex phenomenon involving varying drivers, populations, legal channels and legislation. The ‘pull hypothesis’ mainly relates to irregular and asylum‐related migration rather than ‘regular’ migration (such as work visas or students). The ‘welcoming policy’ targets asylum seekers, yet its indirect effects may also apply to any type of migrant. Using total migration flows allows us to exclude the possibility that ‘welcoming policies’ regarding asylum seekers spill over to regular channels because Germany becomes more visible and viable as a general destination for potential migrants. Furthermore, there are regular flows that are a direct derivative of asylum‐related migration, such as family reunification. Regarding our data sources on ‘aspirations’, we have no knowledge of which types of migration flows that intentions may translate to. Consistent with the ‘pull effect’ as phrased by Collier and others (see previous section), any detectable increase in aspirations to migrate to Germany attributable to welcoming policies would provide evidence in support, regardless of the channel an individual uses for migration.
Overall, our empirical cross‐validation strategy prioritizes the breadth of data sources to avoid relying on individual sources, each of which faces limitations.
Empirical strategy
Each data source requires customized models for each outcome variable. After reporting descriptive statistics on time trends across all outlined indicators by destination and origin region, we present multiple econometric analyses, each relying on different assumptions and data. Table 1 provides an overview of approaches by outcome variable. Due to space constraints, we provide details on model specifications in Section II of the Supporting Information Appendix. Replication materials are available at https://osf.io/fpsej/.
Overview of estimation approaches and data

Table 1 includes data sources with varying time frames. The analysis of annual migration flows focuses on longer‐run differences across origin and destination countries. This variable captures all forms of migration.
The second set of analyses zooms in on first asylum claims, the best available corridor‐specific (i.e., origin to destination country) measure of asylum seeker arrivals. This analysis can rely on monthly data, thus allowing us to assess timing in more detail. Still, one must remember that the asylum claim may occur several months after arrival. Unfortunately, no precise and comparable data across EU destination countries would allow measuring effects on monthly arrivals, neither for migration in general nor specifically for asylum seekers.
The third set of analyses examines the intention to migrate at the origin country level. In the aspirations‐capabilities framework, it can be argued to focus on the aspirations, whereas the previous two approaches also capture the role of capabilities, including hurdles posed by the policy environment. Given that the data used in this approach are available at the daily level, we can precisely assess what happened to migration intentions in origin countries in the days around Merkel's statement.
The final piece of evidence we use, Google searches, provides us with a measure of the extent to which people in origin countries have been looking for information about migration and asylum in Germany. This information‐seeking can be interpreted as a step that will partly inform migration intentions and make people more informed about their capabilities.
Results
Results of descriptive analyses
Descriptive results based on univariate time trends neither provide any conclusive evidence nor do they suffice to debunk the ‘pull hypotheses’. However, a first glance at the time trend is important to understand the historical situation before providing more inferential evidence (see 4.2.).
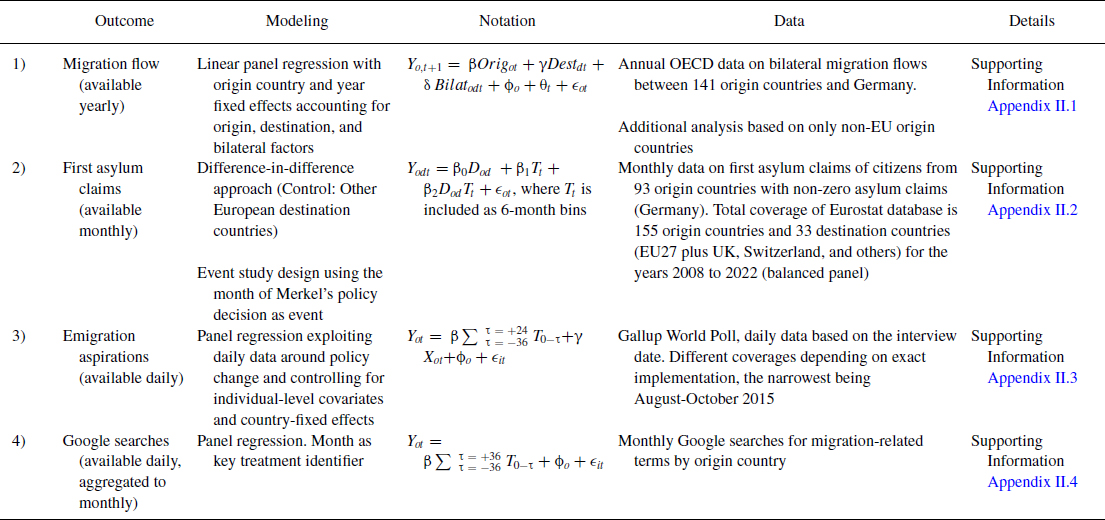
Figure 1 shows actual and potential migration to Germany from 2000 to 2020. Panels A and B display the value of each year as a percentage relative to the value in 2015 – the year of Merkel's famous decision to keep the borders open. Panel A shows that immigration flows in 2000 were less than half of the 2015 level, and registrations of asylum seekers were approximately 10 per cent. We observe a slow but steady increase in the number of immigrants and asylum seekers between 2006 and 2013. After 2013, the number of immigrants and asylum seekers in Germany grew steeply. 2015 appears to be the peak of a trend rather than its inception. After 2015, we find a sharp decline in immigration and asylum flows to Germany. Panels C and D display the same values as annual percentage changes, illustrating the steady increase in asylum claims and migration leading up to 2015. Intentions and internet searches are subject to more volatile annual fluctuations but do not suggest any increases post‐2015.
Migration to Germany peaked in 2015 (Percent relative to 2015)
Notes: Immigration (Destatis); Asylum Applications (BAMF); Intention (Gallup World Poll); Google Trends (Gtrends API). Asylum registrations are based on EASY registrations (pre‐2017). Since this series was discontinued, we complement it with official asylum applications (post‐2017). Details on pre‐processing the data can be found in Supporting Information Appendix I.

Panel B in Figure 1 shows the ‘potential’ migration (i.e., aspiration) to Germany over time. Global potential migration to Germany grew steadily between 2011 and 2014. In 2014, potential migration had already reached the level of 2015. The level slightly increased in 2016 before decreasing markedly in 2017 and 2018. Concerning the number of individuals who searched for Germany in the context of visa and immigration on Google's online search engine, we observe a downward trend after post‐2015, following an almost linear upward trend between 2006 and 2013. These results remain unchanged when restricting the sample to major countries of origin of migrants in Germany (see Figure A1 in Supporting Information Appendix's Section III).
Another possible expression of the ‘pull effect’ hypothesis is that Germany may not have become more popular overall but became a more popular destination relative to other countries. Figure A2 (Supporting Information Appendix, Section III) shows that none of the migration indicators, including immigration, asylum seekers, intentions or Google searches, indicate a larger difference between Germany and other destination countries following 2015. On the contrary, the results suggest several increases in Spain, Italy and France relative to 2015 (depending on the respective indicator) and a faster decrease in migration to Germany relative to other EU countries.
Results of econometric analyses
General migration inflows
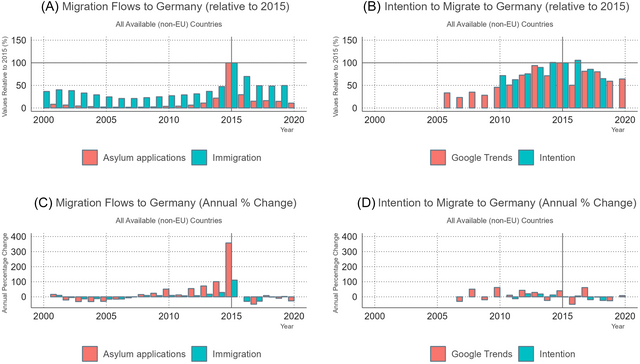
Figure 2 shows the coefficients of the year‐fixed‐effects ( ${{\theta }_t})$ from the panel model on migration flows to Germany (see Supporting Information Appendix's Section II.1) that uses origin and destination factors, such as unemployment rates, as well as bilateral factors, such as migration policies and networks. The results indicate that there was no increase in migration inflows after 2015. By contrast, 2015 marked the high‐water mark of the unexplained, time‐varying components of the immigration inflows captured by the year fixed effects. There is thus no indication of a significant Merkel effect in yearly immigrant inflows to Germany. The increase in immigration to Germany started already much earlier, as the panel data show.
Yearly inflows peaked in 2015 and then declined (year fixed effects)
Notes: Migration data from OECD and Destatis, population and unemployment data from world development indicators. Authors’ calculations. Panel model (see equation 1 in Supporting Information Appendix, II.1) with country and year fixed effects as well as controls for the size of the immigrant stock, the population at origin, and unemployment at origins and in Germany. Estimates for all available origin countries except main origin countries of asylum seekers (see text). Broad and narrow bars indicate 95 and 99 per cent confidence intervals, respectively. The zero line indicates the long‐term average conditional on the fixed effects, controls, and the plotted coefficients. Log points x can be translated into percentage point differences using ex – 1. For example, comparing the point estimates for 2014 and 2010, e 1.524/e 0.651 = 2.39, which indicates, conditional on covariates, 2.4 times more first asylum claims in 2014 compared to 2010.

To test the robustness of this finding, we also estimate the same model based on a sample only including non‐European origin countries (see Figure A3, Supporting Information Appendix Section III). The results remain unchanged.
Asylum applications
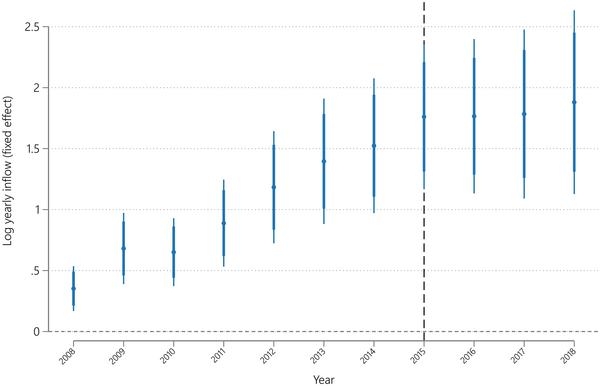
We first use an event study approach (see Section II.2 of the Supporting Information Appendix for details) to show how monthly first asylum claims changed in Germany over time. Figure 3 plots the estimated coefficients of the monthly difference in asylum claims from the long‐term average in a 60‐month window around September 2015. The dashed vertical line marks the event of interest (Merkel's 2015 decision). We compare how the number of asylum seekers to Germany from origin countries developed in comparison to numbers from ‘safe countries of origin’. Figure 3 shows that the number of asylum seekers from the former already started rising significantly three years before September 2015. In March 2013 (26 months before September 2015), first asylum claims were already about 0.7 log points higher than from ‘safe countries of origin’. The estimated difference was relatively stable at around 1.0 log points difference from 2013 until 2017, only under‐ and then overshooting it in late 2015 to 2016 as part of the lag in asylum processing. That pattern clearly shows that the large increase in asylum numbers occurred long before Merkel's policy shift in 2015.
Asylum applications peaked before 2015 and then declined (when accounting for the administrative backlog)
Notes: BAMF data, authors’ calculations. Model as specified in equation 3 (see Supporting Information Appendix II.2). The estimates in this graph are without any control variable ${\bm{X}}_{{\bm{ot}}}$. Broad and narrow bars indicate 95 and 99 per cent confidence intervals, respectively. The zero line indicates the long‐term average minus the fixed effects and the plotted coefficients. Note that coefficients for 7–12 months are driven by backlog in asylum applications of individuals who already migrated to Germany in the previous year (see Supporting Information Appendix I.2 for detail). Log points x can be translated into percentage point differences using ex – 1, for example, e0.5‐1 = 0.649, which indicates 65 per cent more first asylum claims than in the long run constant calculated for the full sample between Jan 2008 to Dec 2017.

The graph furthermore indicates that the peak in 2016 mainly resulted from clearing the backlog of the asylum claims of those who arrived during the substantial but short increase in inflows in the fall of 2015 (see the immediate ‘EASY’ registrations in Figure A5, which are not available disaggregated by country). As explained in more detail in the Supporting Information Appendix I.2, the asylum applications indicator is misleading for 2016 because a large share of those applications was filled by asylum seekers who had already arrived and registered in 2015 but could not officially launch their claim due to administrative backlog.
After that, the series returns to a level that is not statistically different from the 2 years before September 2015. There is thus no evidence of a lasting increase in asylum claims that could be easily linked that month's policy decisions.
Further analyses using only Syria as the origin country confirmed the null effect of 2015 (see Figure A4, Section III of the Supporting Information Appendix).
Next, we compare the changes in Germany to changes that occurred in other European countries. We use a balanced panel of 155 origin countries and 33 European destination countries to estimate a panel model that builds on the idea of a difference‐in‐difference estimation (see Supporting Information Appendix Section II.2 for details), where changes in first asylum claims in Germany from different origin countries (treated) are compared to changes in first asylum claims made by people from the same origin countries in other European destination countries (control group).
The coefficients in Figure 4 show how the number of asylum claims made in Germany developed over time compared to the average trend in other European destination countries at the same time. For this we estimate a model consisting of a dummy variable that captures time‐invariant difference between Germany and the other destinations, dummies for different time periods to capture the general trend across all destinations, and finally, the difference between Germany and the other destinations in each time period. The model is estimated in logs, so we obtain log differences. A coefficient of 0.5 thus means that asylum seeker numbers in Germany had, in that time period, increased 0.5 log points (65 per cent) more than the European average. The results in Figure 4 corroborate the findings from Figure 3, showing that the divergence in asylum seeker numbers, indicated by a log difference above zero, occurred far earlier than September 2015. Compared to asylum claims in other European countries, they already started to increase strongly around 30 to 25 months before that date. Furthermore, after September 2015, the number of asylum claims in Germany significantly overshot the September 2015 value in only two of the 6‐month bins after the treatment date and then returned to the 2014–2015 average.
First‐time asylum seeker numbers in Germany relative to other European destination countries, divergence well before September 2015
Notes: Eurostat asylum data. Authors’ calculations. Panel model (see equation 2 in Supporting Information Appendix, without additional controls) estimated in six‐month bins. Broad and narrow bars indicate 95 and 99 per cent confidence intervals, respectively. The overall sample is a balanced bilateral panel of 155 origin countries and 33 European destination countries between 2008 and 2022. The treatment group are asylum numbers from all origin countries in Germany. The control group consists of asylum claims from all origin countries in all other European countries. The six‐month bins are coded as 1/6 in the respective window and zero otherwise, while the September 2015 dummy takes the value of 1 in that month. That way, the coefficients can be interpreted and compared because they refer to the log point difference from the long‐run average minus fixed effects for a given month. Note that coefficients for 7–12 months are driven by a backlog in asylum applications of individuals who already migrated to Germany in the previous year (see Supporting Information Appendix I.2 for details).

If one wants to interpret the post‐September‐2015 coefficients as the causal effect of Merkel's September 2015 statement, the necessary assumption would be that nothing else had changed between Germany and other European destination countries at that time. Given the pre‐treatment trend away from zero, the strong increase in asylum numbers compared to previous years could only be interpreted as causal if asylum seekers had anticipated this policy change already over a year in advance. Since this is highly unlikely, we interpret the results as evidence that there was, at best, a transitory effect after 2015 but no evidence that September 2015 itself was the cause of generally higher asylum seeker numbers in Germany. In addition, the large coefficient for the period 7–12 months after treatment is a result of the administrative backlog in asylum applications of individuals who already arrived in Germany in the previous year (see Supporting Information Appendix I.2 for detail).
Figures A7‐A9 in Supporting Information Appendix III provide robustness checks of this estimation, excluding, for example, non‐EU destination countries or ‘safe countries of origin’ according to the definition in use in Germany. These yield qualitatively similar results.
Migration aspirations (‘potential migration’)
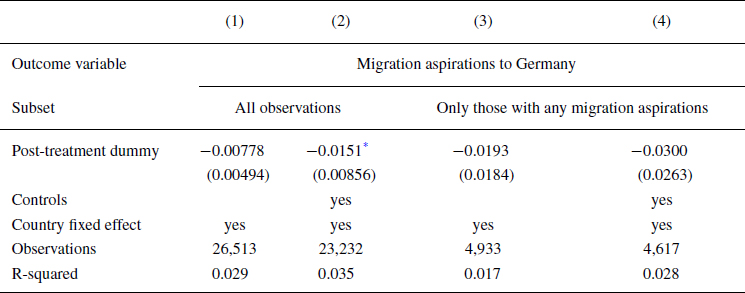
Table 2 reports the results from a regression analysis that assesses whether emigration aspirations increased around the time of the policy change. For this, the survey data allow comparing individuals interviewed around the world within a window of 30 days before Merkel's public announcement and 30 days after (see Section II.3 in the Supporting Information Appendix for details). The necessary assumptions for identification are excludability and temporal ignorability (cf. Muñoz et al., Reference Muñoz, Falcó‐Gimeno and Hernández2020). Excludability means that differences between respondents interviewed before and after the event were only caused by the event – nothing else should have systematically changed across migrants’ potential origin countries on that day. Temporal ignorability means that assignment in time is exogenous. In our case, individuals who differ in their migration interests should not have a different probability of being interviewed before and after the event. The order of fieldwork locations is determined by Gallup's data collection planning teams and is not systematically affected by respondents. It is furthermore highly unlikely that the thought process about migrating to Germany in origin countries determined the specific day of Merkel's announcement. Whether an individual was interviewed before or after the announcement is thus plausibly exogenous.
Migration aspirations and migration plans to Germany did not spike in the month after Merkel's announcement

Notes: Authors’ calculation based on Gallup World Poll as specified in equation 4. Heteroskedasticity‐robust standard errors that cluster at the origin country level in parentheses. *** p < 0.01, ** p < 0.05, * p < 0.1. The outcome variable in Columns 1 and 2 counts all individuals as zero who replied to the intention question and did not want to migrate to Germany.
Individuals who intend to migrate to Germany are coded as 1. The outcome variable in Columns 3 and 4 assesses all individuals with any intentions and excludes those without any migration aspirations. Controls include sex, marital status, number of children, age, age squared, log per capita household income, education level, urban versus rural living location and economic expectations.
The results in columns 1 through 4 in Table 2 indicate that there was no ’Merkel effect’ around the month when Merkel disbanded the Dublin regulation resulting in unregulated entry of asylum seekers at the German borders. For example, the coefficient of −0.00778 for the post‐treatment dummy in Column 2 indicates that a person interviewed right after the policy change was 0.7 percentage points less likely to have reported emigration aspirations than a person who was interviewed in the days before the change in the same country. The difference is not statistically significant. Neither do we find an increase in longer‐term overall intentions to migrate to Germany nor shorter‐run effects on migration plans during the next 12 months. Adding individual‐level controls in Columns 2 and 4 does not make substantial changes. The coefficient for the post‐treatment period is negative and significant at the 10 per cent level in Column 2. Overall, however, that cannot be considered a robust relationship. When using coarsened exact matching (Iacus et al., Reference Iacus, King and Porro2012) to balance the sample (Table A4 in the Supporting Information Appendix), we find statistically insignificant results throughout for both linear regression and logit. Further analyses based on yearly data and a subset of origin countries confirm the overall results (see Table A5, Section IV of the Supporting Information Appendix).
We can conclude that there has been no large overall change in general migration aspirations to Germany from outside the EU around the time of the treatment. Thus, there is no evidence that the alleged ‘Merkel effect’ led to a marked increase in migration aspirations.
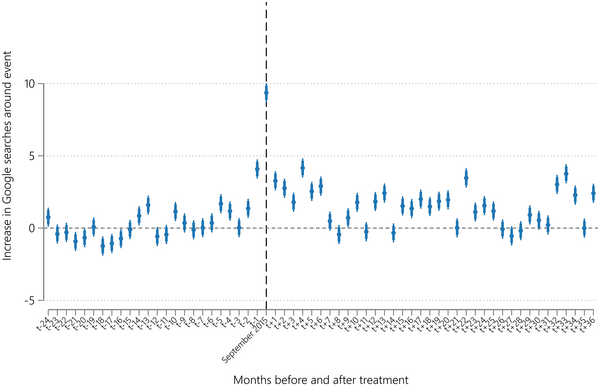
Online search intensity
As the last dimension, we study changes in the online search intensity for Germany in the context of migration‐relevant search terms. The results in Figure 5 show that searches spiked in September 2015 and then decreased quickly. The estimated effect size (9.36) indicates that as a percentage of the month with the highest search volume for ‘Germany’ in a given country, searches were about 9 per cent higher in September 2015 than otherwise. The estimates remain consistently above 0 for the next six months, that is, until March 2016, when additional discouraging policies such as the ‘EU‐Turkey deal’ came into effect. Any estimates may be biased upward because people may have searched for news from Germany during the so‐called ‘migration crisis’. That should make it more likely to find a significant increase in search interest. The null effect we find empirically is thus particularly conservative.
Google searches for ‘Germany’ across all available origin countries spiked around September 2015 and then fell sharply
Note: Google Trends data, authors’ calculations. The model is specified as in equation 1 in the Supporting Information Appendix. Event study estimates predicting the monthly search volumes for “Germany” across all available origin countries. See Supporting Information Appendix I for details on data and variables. Broad and narrow bars indicate 95 and 99 per cent confidence intervals, respectively.

Still, the overall effect is relatively small. The outcome variable is scaled between 0 and 100 for each country, and a maximum of 100 marks the month with the highest number of searches for ‘Germany’ in that country. In the post‐treatment period, searches for Germany were at most about 4 per cent higher on average. Overall, there is no large, persistent increase in searches across countries, although coefficients often remain positive and significantly different from zero. Robustness checks using a Poisson fixed effects model, better suited to the large share of zeros in the outcome variable, show similar estimates with any consistent effects dissipating after March 2016.Footnote 2 We find similar effects when restricting the sample to African origin countries (see Figure A6).
Discussion
Our findings suggest that Merkel's controversial 2015 decision to allow tens of thousands of asylum seekers to cross the border into Germany neither attracted sustained subsequent migration flows nor measurably raised aspirations to migrate to Germany in origin countries worldwide within the following 5 years before the COVID‐19 crisis hit. The evidence presented debunks the so‐called ‘pull‐effect’ hypothesis often put forward in political and media discourse. Merkel's 2015 policy decision is an extreme case where ‘pull effects’ would be most plausible given the broad global media coverage and therefore most likely to be empirically detectable. However, as we show, there is no evidence of a ‘pull effect’ when looking closely at short‐term changes in the days around the policy change or, more broadly, at monthly and yearly data following 2015.
We show that Merkel's famous decision occurred at the culmination of a process that started at least two years before rather than being the cause of a ‘pull effect’ that induced a new migration dynamic. We consistently observe this pattern in four dimensions of migration indicators: migration inflows, asylum applications, migration aspirations and online search intensity. This approach provides convergent evidence by showing consistent results across data sources and models. This cross‐validation or ’triangulation’ strategy lends credibility to the results while mitigating limitations associated with each individual data source or estimation method.
In contrast to patterns predicted by the ‘pull effect’ hypothesis, migration sharply fell during the years after 2015. We will briefly discuss three potential reasons that may explain this sharp decline:
First, Germany took a swift restrictive turn regarding migration policy, including, most famously, (1) the EU‐Turkey deal, (2) limits to family reunification entitlements, (3) facilitating return to ‘safe countries’ of origin, (4) large‐scale funding increases for EU border control and (5) large scale funding increases for refugee‐hosting countries in the Middle East. In addition, several countries along the Balkan route de facto closed their borders in coordination with Austria.
Second, pressures to flee or move onward to Europe changed after 2015. Conflict intensity in Syria, Iraq and Afghanistan decreased compared to pre‐2015, and the conditions in refugee camps in neighboring countries improved. The upward migration trend to Germany started in 2010 and 2011, long before Merkel's famous decision to keep borders open in 2015. Increasing migration flows to Germany in the early 2010s coincided with reports on worsening conditions in countries hosting large numbers of Syrian migrants, especially Lebanon, Jordan and Turkey. Already in 2012, Doctors Without Borders reported that Lebanon had cut medical support for refugees due to funding shortages.Footnote 3 On April 19, 2013, the UNHCR issued a press release entitled ‘Funding gap threatens refugee response in Lebanon’, warning that ‘in one month, and with the current funding, more than 400,000 Syrian refugees in Lebanon will no longer receive food assistance’.Footnote 4 Consistent with migration trends as ‘regression toward the mean’, it is possible that the ‘pull effect’ was never plausible because everyone who seriously considered migrating had already left, reducing the scope for any policy signal to be impactful.
Lastly, the general assumption that most potential migrants in origin countries are well informed about policies in destination countries, and have the necessary means to migrate when the opportunity arises, appears overstated and largely inconsistent with theoretical and empirical work in this area (Crawley & Hagen‐Zanker, Reference Crawley and Hagen‐Zanker2018; Czaika & de Haas, Reference Czaika and de Haas2013; Fitzgerald et al., Reference Fitzgerald, Leblang and Teets2014; Tjaden, Reference Tjaden, Fargues, Rango, Börgnas and Schöfberger2020).
The situation in Germany in 2015 appears unique in many ways. Yet, it bears many similarities to other crises worldwide, including the displacement of five million Venezuelans and their reception by Latin American countries or the forced displacement of Ukrainian refugees since 2022. With global displacement continuing to rise (UNHCR, 2020), it is essential to ask what the German case study can tell us about the broader question of whether and how welcoming migration policies shape subsequent migration trends.
The evidence presented in this study does not support the commonly held belief in policy and media that welcoming policies induce measurable ‘pull effects’ on migration flows. So far, the pull effect hypothesis has received mixed empirical support in academic research. We provide convergent evidence spanning various data sources and models, which suggests that fears of unmanageable, enduring ‘mass migration’ caused by welcoming policy signals are unwarranted. If ‘pull effects’ induced by policies occur at all, they are likely to be temporary and geographically limited. Notably, ‘pull effects’ do not outlive changing policy contexts and appear far less relevant than structural factors such as conflict, economic hardship, and labor demand that motivate individuals to leave their country. Furthermore, migration may increase long‐term through networks as family members attempt to join those who have already settled in destination countries. This is a separate mechanism from the common policy pull effect which is believed to increase migration by virtue of signalling openness, not through existing contacts. Welcoming policies alone do not appear to ignite a process whereby migration flows self‐sustain beyond states’ control.
Acknowledgement
We are grateful for support in data processing from Lina Jeannot and Ba Linh Le who were hired as research assistants in 2022. Tjaden acknowledges funding from the German Federal Ministry Education and Research (BMBF) (WisNA programme). Heidland acknowledges funding by the Mercator Dialogue on Asylum and Migration (‘MEDAM II’, project number 19002900).
Open access funding enabled and organized by Projekt DEAL.
Data availability statement
All replication files are available at the Open Science Foundation (https://osf.io/fpsej/).
Online Appendix
Additional supporting information may be found in the Online Appendix section at the end of the article:
 Xot
Xot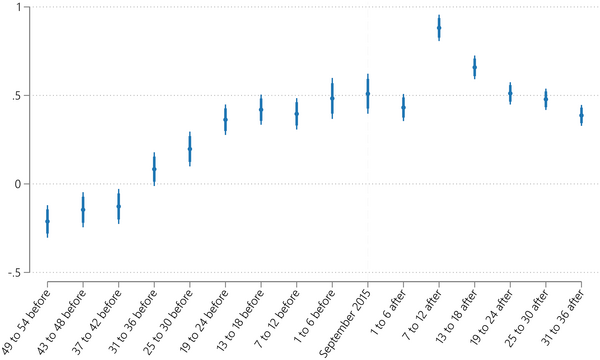


 Open access