





Introduction
Glucagon-like-peptide-1 (GLP-1) agonists have increased in popularity in recent years. They have been shown to have a positive effect on glycaemic control, weight loss, Reference Drucker1–Reference Wilding, Batterham and Calanna3 and cardiovascular health, Reference Lincoff, Brown-Frandsen and Colhoun4,Reference Sheahan, Wahlberg and Gilbert5 but their popularity has largely been driven by their effect on weight reduction. Liraglutide, semaglutide, and tirzepatide are currently approved for the management of obesity. Reference Drucker1 Despite their prevalence, limited data is available on the use of these medications in patients with CHD. Obesity has significant clinical implications in CHD patients, such as adversely affecting haemodynamics in Fontan patients Reference Opp, Jain and Egbe6,Reference Yogeswaran, Anigwe and Salahuddin7 and being associated with Fontan failure. Reference Byrne, Weingarten and Clark8 Obesity has been shown to present at younger ages in patients with CHD than in the general population Reference Vangedal, Thuraiaiyah and Joergensen9 and increases in prevalence as CHD patients get older. Reference Jackson, Fox, Cotto, Harrison, Tran and Keim10 . Because GLP-1 agonists have the potential to be a useful tool in the management of obesity in CHD patients, we set out to examine whether GLP-1 agonists are effective and safe for weight loss in adults with congenital heart disease (ACHD) and explored the effects of sex and CHD complexity.
Methods
We conducted a retrospective cohort study of patients with CHD who were prescribed a GLP-1 agonist from 1/1/2022–3/31/2024 at Yale New Haven Hospital. Charts were identified by searching for patients who were seen in the Yale Adult Congenital Heart Program and had a prescription for a GLP-1 agonist during this period. This was done with the assistance of Yale New Haven Health System’s Joint Data Analytics Team. The charts identified by the Joint Data Analytics Team were reviewed to confirm the patient’s CHD diagnosis. Patients whose only cardiac diagnosis was a patent foramen ovale or who started GLP-1 agonist therapy prior to 1/1/2022 were excluded. Charts were reviewed for data, including age, sex, race, ethnicity, specific diagnosis of CHD, specific GLP-1 agonist, indication, and prescriber speciality. CHD complexity was classified as either simple, moderate, or great complexity according to the 2018 American Heart Association/American College of Cardiology Guideline for the Management of Adults with Congenital Heart Disease. Reference Stout, Daniels and Aboulhosn11 Longitudinal data on patient weight corresponded to the pre-GLP-1 agonist baseline weight from the documented weight closest to the date of documented GLP-1 agonist prescription (min = 0 days and max = 65 days), and at least one weight measurement per calendar month while on GLP-1 agonist treatment.
The primary outcome was change in weight over time, expressed as the difference in weight (kg) from the baseline weight and as a percentage change in weight from baseline. CHD complexity and patient sex were a priori chosen as exploratory factors of interest. Side effects were also reviewed as a secondary outcome.
Statistical methods
Baseline characteristics are described using summary statistics such as frequency (per cent) and mean (SD), and are compared across complexity groups using chi-square tests, Fisher’s exact tests, and ANOVA, as appropriate. Change in weight over time was analysed using linear mixed effects modeling with a random intercept (tested relative to an additional random slope using the Likelihood Ratio Test), including the following fixed effects: month from baseline, sex, ACHD complexity, plus month by ACHD complexity and month by sex statistical interactions. Patient age and medication type were also considered as potential covariates but were not retained in the models due to non-significance and to reduce the model complexity (minimise the degrees of freedom). To assess the sensitivity of the linear mixed effects models to the available length of follow-up, linear mixed effects models were constructed for a minimum of 6 months, 12 months and full follow-up. Results from the linear mixed effects models are summarised as estimated slopes (monthly change in weight) with 95% confidence intervals (95% CI), for the full sample and stratified by sex and ACHD complexity. Due to the small sample size, we relied on the effect sizes and the surrounding 95% CI coverage to make conclusions. Adverse events are presented as frequency (per cent), and differences between complexity groups were tested using chi-square and Fisher’s exact tests, as appropriate.
Results
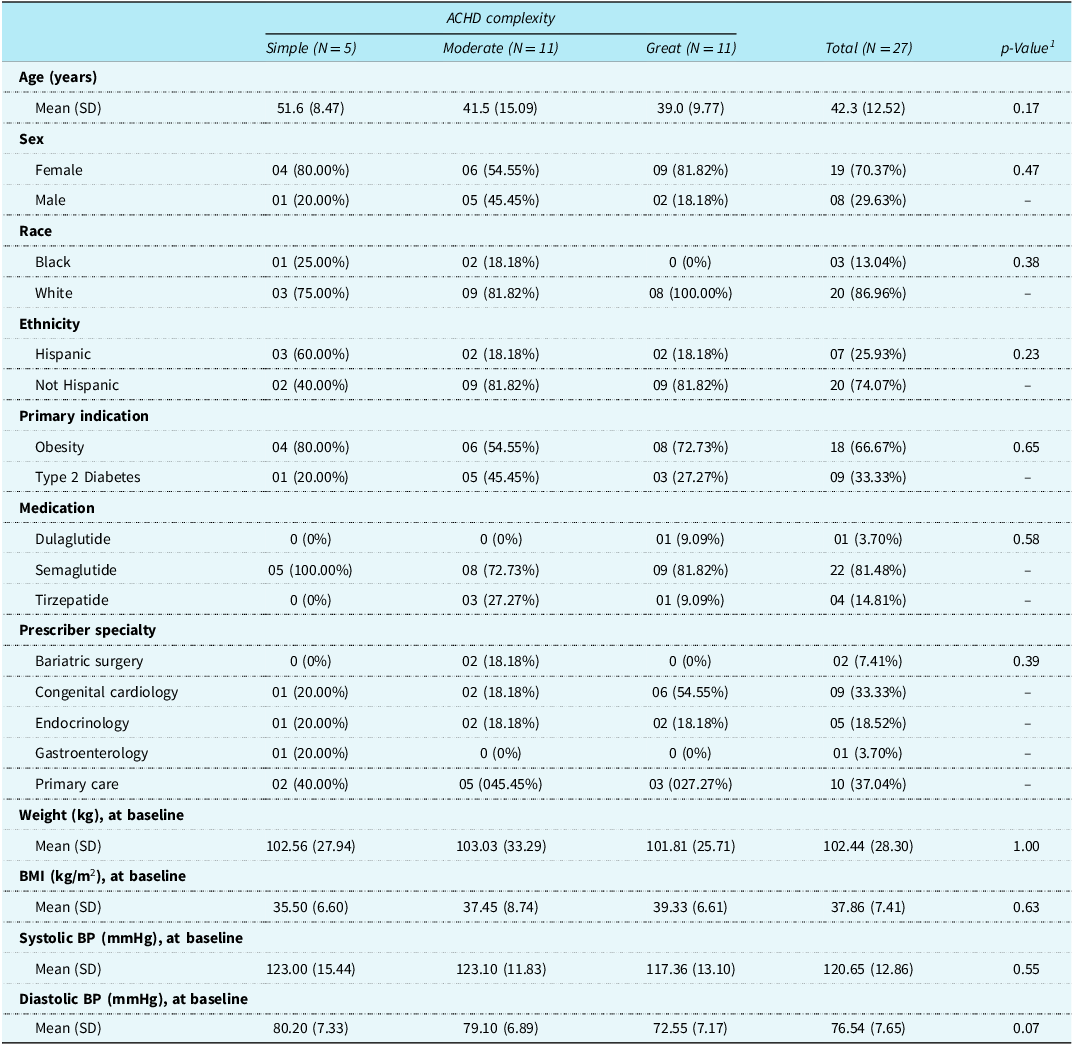
Among the reviewed charts, 27 adults between the ages of 21 and 65 years old met criteria for inclusion in our study: mean age of 42.3 years, and 19 (70.4%) were female. Five (18.5%) were of simple ACHD complexity, while there were 11 patients each of moderate (40.7%) and great (40.7%) complexity. ACHD complexity groups were comparable with regard to age, sex, race and ethnicity distribution (Table 1). Four (14.8%) of the patients in our study had functionally univentricular hearts and had been palliated to Fontan. Along with Fontan circulation, atrial septal defects were the most common CHD diagnosis in our study (n = 4, 14.8%). The next most common diagnoses were tetralogy of Fallot and ventricular septal defect (n = 3 or 11.1% each).
Baseline characteristics in full cohort and by ACHD complexity

Table 1. Long description
The table presents baseline characteristics of 27 adults with congenital heart disease (CHD), categorized by complexity levels: simple, moderate, and great. It includes data on age, sex, race, ethnicity, primary indication, medication, prescriber specialty, weight, BMI, and blood pressure. The table has 12 rows and 7 columns, with column headers such as Age, Sex, Race, Ethnicity, Primary Indication, Medication, Prescriber Specialty, Weight, BMI, Systolic BP, and Diastolic BP. Notable trends include a higher percentage of females (70.37%) and a mean age of 42.33 years. The most common primary indications are obesity (66.67%) and type 2 diabetes (33.33%). Semaglutide is the most commonly prescribed medication (81.48%). The mean weight at baseline is 102.44 kilograms, and the mean BMI is 37.86 kilograms per square meter. The mean systolic and diastolic blood pressure values are 120.65 millimeters of mercury and 76.54 millimeters of mercury, respectively.
1 p-Value from Analysis of Variance for comparison of means (at least one group mean is different) and from Chi-square or Fisher’s Exact test for categorical variables.
ACHD = adults with congenital heart disease; SD = standard deviation; BMI = Body Mass Index; BP = blood pressure; kg = kilograms; m2 = squared metres; mmHg = millimetres of Mercury.
The most common primary indication for prescribing a GLP-1 agonist was obesity, followed by type 2 diabetes mellitus (Table 1). The majority of patients were prescribed semaglutide (n = 22, 81.48%). The remaining patients were prescribed tirzepatide (n = 4, 14.81%) or dulaglutide (n = 1, 3.70%). About a third of patients were prescribed a GLP-1 agonist by their primary care physician; another third was prescribed by congenital cardiology. Average baseline weight and systolic blood pressure were comparable across the three groups, while average baseline diastolic blood pressure was lower in the great complexity group compared to the simple and moderate complexity groups (Table 1).
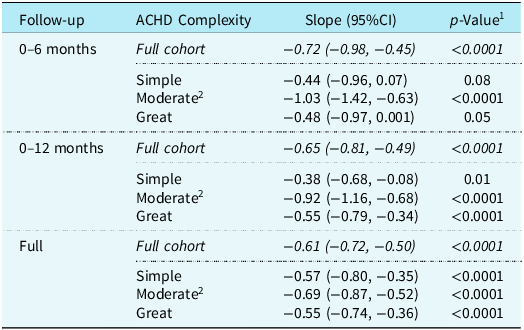
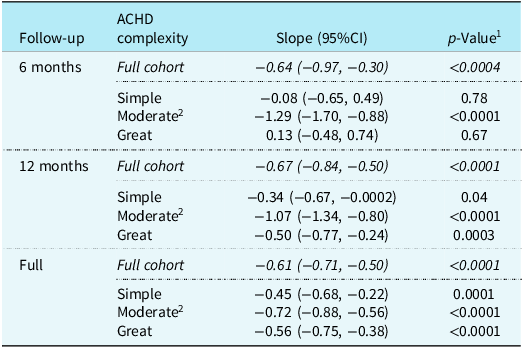
In the full cohort, the median number of follow-up time points was 5 (25th, 75th percentiles: 3, 6), and the median length of observational follow-up was 9 months (25th, 75th percentiles: 6, 16 months). These observational follow-up metrics were comparable across ACHD complexity groups (Supplemental Table 1). In general patients lost weight across all three ACHD complexity groups, and this was corroborated by the use of a linear mixed effects model to show predicted weight over time (Figures 1 and 2). The entire study cohort experienced weight loss across the first 6 months (−0.72 kg/month, 95%CI −0.98, −0.45), 12 months (−0.65 kg/month, 95%CI −0.81, −0.49), and the full period of treatment follow-up (−0.61 kg/month, 95%CI −0.72, −0.50) (Table 2). This was also observed for the percentage weight loss from baseline (Table 3). When comparing the different complexity groups, averaged across sexes, the moderate complexity group had the fastest weight loss during the first 6 months (−1.03 kg/month, 95%CI −1.42, −0.63) and 12 months (−0.92 kg/month, 95%CI −1.16, −0.68) of treatment, but was comparable to the other two ACHD complexities in the full follow-up period (−0.69 kg/month, 95%CI −0.87, −0.52). Patients in the simple and great complexity groups required 12 months of treatment to reach meaningful weight loss. This was also mirrored in the findings for percentage weight loss. Weight loss in the full cohort and by level of ACHD complexity was explained by the weight loss among females, who had a faster rate of weight loss compared to males across all ACHD complexity levels. Males needed to be on the medication for at least 12 months to begin showing meaningful weight loss in the simple and great complexity groups (Supplemental Tables 2 & 3).
In the first panel, each line represents a patient’s observed weight (kg) over time (months). In the second panel, a linear mixed effects model is shown to illustrate predicted weight (kg) over time (months). Both panels are stratified by ACHD complexity.

Figure 1. Long description
The line graph is divided into three panels representing different ACHD classifications: Simple, Moderate Complexity, and Great Complexity. The x-axis represents months from baseline, ranging from 0 to 20 months. The y-axis represents weight in kilograms, ranging from 50 to 200 kilograms. Each line in the first panel represents a patient’s observed weight over time. In the second panel, a linear mixed effects model illustrates predicted weight over time. The lines in the Simple panel show a general trend of weight loss over time. The Moderate Complexity panel shows varied trends with some lines indicating weight gain and others showing weight loss. The Great Complexity panel also shows varied trends with most lines indicating weight loss over time. All values are approximated.
In the first panel, each line represents a patient’s observed percent weight change from baseline (%) over time (months). In the second panel, a linear mixed effects model is shown to illustrate predicted percent weight change from baseline (%) over time (months). Both panels are stratified by ACHD complexity.

Figure 2. Long description
The image consists of two panels. The first panel is a line graph showing observed percent weight change from baseline over time in months, stratified by ACHD complexity into three categories: Simple, Moderate Complexity, and Great Complexity. Each line represents a patient’s observed percent weight change. The y-axis represents weight change from baseline in percentage, ranging from negative 30 percentage to positive 10 percentage. The x-axis represents time in months, ranging from 0 to 20 months. The second panel is a line graph showing predicted percent weight change from baseline over time in months, also stratified by ACHD complexity. The y-axis represents weight change from baseline in percentage, ranging from negative 20 percentage to 0 percentage. The x-axis represents time in months, ranging from 0 to 20 months. The predicted weight change lines show a consistent downward trend across all complexity groups. All values are approximated.
Monthly average weight loss in full cohort and by ACHD complexity

Table 2. Long description
The table presents data on monthly average weight loss in a full cohort and by ACHD complexity over different follow-up periods. It has four rows and three columns. The columns are labeled Follow-up, ACHD Complexity, and Slope (95% CI). The rows are divided into different follow-up periods: 0-6 months, 0-12 months, and Full. Each follow-up period is further divided into Full cohort, Simple, Moderate, and Great complexity groups. The Slope (95% CI) column shows the average weight loss in kilograms per month with 95% confidence intervals. Notable trends include the fastest weight loss in the moderate complexity group during the first 6 and 12 months, while the simple and great complexity groups required 12 months of treatment to reach meaningful weight loss.
1 p-Values from comparison of slope relative to 0 kg/month change.
2 p-Values from comparison of slopes by ACHD complexity with Moderate Complexity as the reference group: Simple p = 0.07, Great p = 0.08 for 6 months follow-up; Simple p = 0.007, Great p = 0.04 for 12 months follow-up; Simple p = 0.42, Great = 0.27 for full follow-up.
ACHD = adults with congenital heart disease; 95% CI = 95% Confidence Interval.
Monthly average percent weight loss in full cohort and by ACHD complexity

Table 3. Long description
The table presents data on monthly average percent weight loss in a full cohort and by ACHD complexity over different follow-up periods. It includes three main follow-up points: 6 months, 12 months, and the full period. The table has 10 rows and 4 columns. The columns are labeled ‘Follow-up’, ‘ACHD complexity’, ‘Slope (95%CI)’, and ‘p-Value’. The rows are categorized by follow-up periods and ACHD complexity levels: Full cohort, Simple, Moderate, and Great. The Slope (95%CI) column shows the rate of weight loss with confidence intervals, and the p-Value column indicates the statistical significance of the results. Notable trends include significant weight loss in the full cohort across all follow-up periods. The moderate complexity group shows the fastest weight loss during the first 6 and 12 months but is comparable to other groups in the full follow-up period. The simple and great complexity groups require 12 months of treatment to achieve meaningful weight loss.
ACHD = adults with congenital heart disease; 95CI = 95% Confidence interval.
1 p-Values from comparison of slope relative to 0*/month change.
2 p-Values from comparison of slopes by ACHD complexity with Moderate Complexity as the reference group: Simple p = 0.001, Great p = 0.003 for 6 months follow-up; Simple p = 0.001, Great p = 0.0004 for 12 months follow-up; Simple p = 0.14, Great = 0.13 for full follow-up.
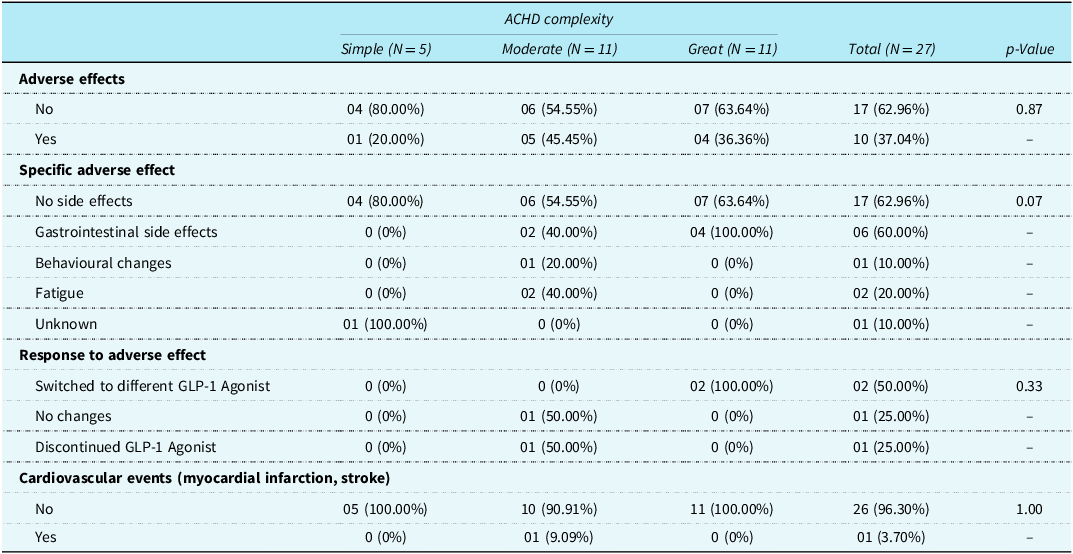
Ten patients reported side effects while taking a GLP-1 agonist (Table 4). The most common side effects were gastrointestinal, such as nausea, acid reflux, and diarrhoea. Two patients had to switch to a different GLP-1 agonist because of side effects. One patient experienced a change in behaviour around eating, which led to the GLP-1 agonist being discontinued.
Adverse events in full cohort and by ACHD complexity

Table 4. Long description
The table presents data on adverse events experienced by patients taking GLP-1 agonists, categorized by ACHD complexity into simple, moderate, and great. It includes information on the presence of adverse effects, specific types of adverse effects, responses to these effects, and cardiovascular events. The table has five rows for adverse effects, six rows for specific adverse effects, three rows for responses to adverse effects, and two rows for cardiovascular events, with columns for each complexity level and a total column. Notable trends include a higher percentage of no adverse effects in the great complexity group and gastrointestinal side effects being the most common. The table also shows that patients in the great complexity group were more likely to switch to a different GLP-1 agonist due to side effects.
p-Value from Chi-square or Fisher’s Exact test.
ACHD = adults with congenital heart disease; GLP-1 = Glucagon-like-peptide-1.
Discussion
This study is the first to explore the effect of GLP-1 agonists on weight among different ACHD anatomic complexity groups. This distinction is important as CHD patients encompass a broad and heterogeneous group. In this study, the moderate complexity group experienced the greatest degree of weight loss compared to the simple and great complexity groups. Females had higher rates of weight loss compared to males in our study. Most patients across all three complexity groups were prescribed GLP-1 agonists for obesity, and semaglutide was the most common GLP-1 agonist prescribed. Reflecting the increasing role of adult congenital cardiologists in prescribing GLP-1 agonists, 1 in 3 patients obtained their prescription from a congenital cardiologist. The side effects experienced by ACHD in our study were similar to those experienced by the general population.
Limited data is available on the use of GLP-1 agonists in patients with CHD. However, our findings regarding weight loss appear to be concordant with what has been reported by other groups. A recently published study on GLP-1 agonist use in a cohort of 8 patients palliated to Fontan found that median weight loss was about 5.6% over a median length of treatment of 265.5 days. Reference Freddo, Ahmed, Edelson, Ortega-Legaspi and Vaikunth12 Similarly, a retrospective study of 70 ACHD patients from Mayo Clinic found that mean weight loss was about 3.7 kg over a mean duration of treatment of 21 months. Reference Thapa, Lara-Breitinger and Lopez-Jimenez13
Our results showed that all three complexity groups had meaningful weight loss starting at 12 months of treatment, with the moderate complexity group experiencing the most weight loss. It is unclear why this group experienced greater weight loss, but it is worth noting that this group had a higher number of patients taking tirzepatide, which has been shown to result in greater weight loss than semaglutide in patients with type 2 diabetes mellitus. Reference Karagiannis, Malandris and Avgerinos14,Reference Moiz, Filion and Toutounchi15 Great complexity patients may not have benefited from GLP-1 agonists as much as the moderate complexity group because the great complexity group includes Fontan patients who may be more prone to complications such as peripheral oedema, Reference Mazza, Gribaudo and Agnoletti16,Reference Khanna, Bhalla, Krishnamurthy and Canter17 which can confound weight. The simple complexity group had the smallest number of patients in our study, so the decreased effect on weight loss in this group may be unique to this small sample of patients.
Females experienced greater weight loss than males in our study, which is consistent with what has been reported in the general population. Reference Yang, He and Han18 A notable finding in our study is that it took more than 6 months of treatment before statistically meaningful weight loss was achieved in the simple and great complexity groups. For the general population, clinical trials on semaglutide and tirzepatide have demonstrated weight loss that begins well before 6 months of treatment. Reference Jastreboff, le Roux and Stefanski2,Reference Wilding, Batterham and Calanna3 This may have been due to inadequate power from the small sample size in our study’s complexity subgroups, as there was statistically meaningful weight loss for the entire study cohort. Practice variations in titration to an effective dose may have also played a role in this finding. It is important to note that not all patients in this study achieved weight loss. As noted in other studies with real-world patients, Reference White, Shu, Rometo, Arnold, Korytkowski and Luo19,Reference Weiss, Yang and Carr20 there were patients who did not lose weight and others who even gained weight (Figures 1 and 2).
Baseline characteristics, including age, sex, race, ethnicity, baseline weight and baseline BMI, were similar between the three groups. The one difference in baseline characteristics that was notable was that diastolic blood pressure was statistically lower in the great complexity group. Fontan patients, particularly those with obesity, have been shown to have lower systemic vascular resistance at baseline, Reference Opp, Jain and Egbe6 which may explain the lower median diastolic blood pressure in the great complexity group. Obesity was the most frequent indication for prescribing a GLP-1 agonist in our patient cohort, and semaglutide was most frequently prescribed. Primary care physicians and congenital cardiologists each prescribed GLP-1 agonists to about one-third of the patients in our study. These findings are similar to those reported in the study from the Mayo Clinic. Reference Thapa, Lara-Breitinger and Lopez-Jimenez13
In our study, the side effects that were most frequently reported were gastrointestinal, which is consistent with what has been reported in studies on ACHD patients Reference Freddo, Ahmed, Edelson, Ortega-Legaspi and Vaikunth12,Reference Thapa, Lara-Breitinger and Lopez-Jimenez13 as well as in the general population. Reference Jastreboff, le Roux and Stefanski2,Reference Wilding, Batterham and Calanna3 An unusual side effect that was reported was aggressive behaviour around food. This is atypical for semaglutide and tirzepatide, although psychiatric disorders have been reported as adverse events in clinical trials. Reference Jastreboff, le Roux and Stefanski2,Reference Wilding, Batterham and Calanna3 The overall rate of side effects reported in our study (37%) is lower than what was reported in clinical trials for semaglutide and tirzepatide. Reference Jastreboff, le Roux and Stefanski2,Reference Wilding, Batterham and Calanna3 However, the retrospective nature of this study may have limited our ability to capture all side effects.
Limitations
Despite this study’s promising results, the small sample size was a significant limiting factor. To mitigate that, we presented our results with confidence intervals. Larger studies will be needed to fully understand the effects of these medications on different subgroups of adults with CHD. Echocardiography and cardiopulmonary exercise testing data were not consistently available for all subjects, limiting our ability to analyse cardiovascular endpoints such as changes in ventricular function or oxygen consumption. Retrospective cohort design and data from a single centre limit this study’s generalisability, but the results presented here can be used as a basis for a more robust prospective multicentre study, particularly in the single ventricle population.
Conclusion
This study provides evidence that GLP-1 agonists are effective for weight loss in ACHD patients, with the greatest weight loss in females and patients with moderate ACHD complexity. Moreover, GLP-1 agonists in the ACHD population have a side effect profile typical for these agents. Further studies with larger cohorts and long-term follow-up are needed to establish the benchmarks for weight loss and a complete safety profile in ACHD patients.
Supplementary material
The supplementary material for this article can be found at https://doi.org/10.1017/S1047951126113109.
Financial support
This research received no specific grant from any funding agency, commercial or not-for-profit sectors.
Competing interests
None.




 Open access

