

1 Introduction
When required to make a decision or judgment, people often solicit advice from others, especially from those they consider experts on the topic in question. These topics may vary greatly, from career management to investment decisions, from issues in personal relationships to problems in daily life. One of the purposes of soliciting advice is to build a wide informational basis on which to make decisions. The utilization of advice is therefore strongly related to an improvement of judgment or decision quality (e.g., Reference Harvey and FischerHarvey & Fischer, 1997; Reference Soll and LarrickSoll & Larrick, 2009; Reference Sniezek, Schrah and DalalSniezek, Schrah & Dalal, 2004; Reference YanivYaniv, 2004a; Reference Yaniv and MilyavskyYaniv & Milyavsky, 2007). Advice taking is mostly investigated by using the judge-advisor system (JAS, Reference Sniezek and BuckleySniezek & Buckley, 1995). In the JAS, one person (the judge) first makes an initial judgment or decision, then receives advice and, subsequently, makes a final (and possibly revised) judgment or decision. Comparing the final to the initial judgment, then, allows to calculate the relative adjustment towards the advice, that is, the percent weight the judge assigned to the advice when making the final judgment (Reference Bonaccio and DalalBonaccio & Dalal, 2006).
Previous research has shown that judges’ advice taking behavior is influenced by a wide variety of advisor characteristics such as the advisor’s expertise (Reference Harvey and FischerHarvey & Fischer, 1997; Reference Yaniv and KleinbergerYaniv & Kleinberger, 2000), reputation (Reference Yaniv and KleinbergerYaniv & Kleinberger, 2000), age or social standing (Reference Feng and MacGeorgeFeng & MacGeorge, 2006), similarity to the judge (Reference Gino, Shang and CrosonGino, Shang, & Croson, 2009; Reference Yaniv, Choshen-Hillel and MilyavskyYaniv, Choshen-Hillel, & Milyavsky, 2011), or the number of advisors (Reference Minson and MuellerMinson & Mueller, 2012; Reference Yaniv and MilyavskyYaniv & Milyavsky, 2007). In addition, advice taking behavior can depend on characteristics of the advice itself. One characteristic that has been systematically investigated is advice distance (Reference YanivYaniv, 2004b; Yaniv & Milavsky, 2007).
Research on the effects of advice distance on advice taking has postulated—and claimed to have consistently shown—a monotone decrease in advice weighting as advice distance increases (Minson, Libermann, & Ross, 2011; Reference YanivYaniv, 2004b; Reference Yaniv and MilyavskyYaniv & Milyavsky, 2007). However, we argue that previous studies draw an incomplete picture of distance effects on advice taking. We will first give on overview of the previous research and then point out why this research cannot fully answer the question how advice distance relates to advice taking.
1.1 Previous studies on distance effects in advice taking
The seminal study on distance effects in advice taking is a study by Yaniv (2004b). Yaniv postulated a monotone negative relation of advice distance and advice weighting (i.e., relative adjustment of one’s opinion towards that of the advisor) which is the most common measure of advice taking (Reference Bonaccio and DalalBonaccio & Dalal, 2006). He derived this hypothesis from early theorizing on attitude change, specifically, within the framework of social judgment theory (SJT, Reference Sherif and HovlandSherif & Hovland, 1961). Since attitude change and advice taking share a number of structural features, it is plausible to take the former to derive predictions for the latter (Morrison, Rothman, & Soll, 2011). In two of Yaniv’s (2004b) experiments, subjects estimated the dates of historic events and received advice which was clustered into one of three advice distance categories: near, intermediate, or far. In line with his hypothesis, Yaniv found that advice was weighted most in the near category and least in the far category with the intermediate category falling in between.
Subsequent studies addressing distance effects on advice taking refer to Yaniv’s (2004b) study and, therefore, explained their findings using the same theoretical framework. The first, by Reference Yaniv and MilyavskyYaniv and Milyavsky (2007), studied advice taking when receiving advice from multiple advisors. They compared judges’ final estimates to a variety of weighting strategies such as averaging one’s own opinion and those of all advisors or taking the median. These model comparisons suggested that judges’ engaged in an egocentric trimming strategy, that is, they ignored those pieces of advice that were most distant from their own initial estimates and averaged the remaining opinions. These findings support the idea that increasing advice distance leads to lower weights of advice when making a final judgment, although it should be noted that the study did not provide a direct test of how advice distance relates to advice weighting.
The third and most recent study investigating distance effects on advice weighting is by Minson et al. (2011). Using different estimation tasks, they tested whether advice distance was related to whether judges placed more weight on their own or on their advisor’s estimates when making the final decision. In line with the original Yaniv study, they found a negative linear effect of advice distance on this dichotomized measure of advice weighting: the farther the advice the less likely judges were to weight the advice by more than 50%.
In sum, previous research unanimously suggests a monotone decrease in advice utilization as advice distance increases. However, this conclusion might be premature both because previous studies were not properly designed to test for the proposed monotone relation, and because they neglect the possibility that advice might even be utilized, in a way, when it receives zero weight. We will elaborate on these points in the following.
1.2 Distance effects on advice weighting: Methodological and theoretical considerations
We argue that, due to methodological limitations, previous studies on distance effects in advice taking were not well-suited to test for the monotone negative relation of advice distance that Yaniv (2004b) originally postulated. The most serious problem is that either the independent variable, advice distance, or the dependent variable, advice weighting, were categorized in the previous studies. In his original study, Yaniv formed three distance categories based either on real advice from previous subjects or on advice generated by a computer as percent deviations from the true values. In both cases, advice distance roughly doubled from the near to the intermediate distance category, but it almost quadrupled when comparing the near and the far category. Hence, advice distance was restricted to three data points, and any deviations from a monotonic relation that might have existed within the range of a given category were impossible to detect.
Similarly, advice distance was categorized in the Yaniv and Milyasky (2007) study. Yaniv and Milyavsky differentiated between the two pieces of advice that were farthest from the initial estimates, on the one hand, and close advice which was comprised of the remaining pieces of advice, on the other. The mere fact that—as observed by Yaniv and Milyavsky—the farthest pieces of advice apparently received a weight of zero does not allow conclusive inferences regarding the shape of the underlying relation of advice distance and advice weighting. A similar problem occurs in the case that advice weighting (i.e., the dependent variable) is dichotomized as in the Minson et al. (2011) study. This dichotomization masks the shape of the relationship of advice distance and advice weighting, again rendering it difficult to properly test a monotone negative relation.
Categorization would not be that much of a problem if a monotone negative relation between advice distance and advice weighting were the only theoretically plausible possibility. However, we shall propose a plausible alternative theoretical account that makes predictions with regard to these distance effects. Furthermore, both SJT and this alternative approach also allow for the possibility of curvilinear distance effects on advice weighting. To understand these possibilities and, hence, to get a more comprehensive picture of how advice distance might be related to advice weighting, we first take a closer look at predictions that can be derived from SJT, and we then introduce an alternative approach that might also explain distance effects on advice weighting.
1.3 Social judgment theory (SJT)
SJT states that attitude change depends on how similar or dissimilar a persuasive message is compared to an individual’s initial attitude. It suggests an inversely U-shaped relation, assuming that moderately different messages produce the greatest attitude change while both messages very similar and very dissimilar to an individual’s initial attitude produce less attitude change. Several studies on attitude change found evidence of a quadratic effect, corresponding to this inversely U-shaped relationship between opinion discrepancy and attitude change (e.g., Reference Aronson, Turner and CarlsmithAronson, Turner & Carlsmith, 1963; Reference FreedmanFreedman, 1964; Reference Insko, Murashima and SaiyadainInsko, Murashima & Saiyadain, 1966).
When we apply SJT to advice taking, we need to take into account that SJT makes statements about absolute opinion change, whereas research on advice taking investigates advice weighting, that is, relative change. As mentioned above, the most common measures of advice taking divide some measure of absolute opinion change by advice distance (Reference Bonaccio and DalalBonaccio & Dalal, 2006). For example, the Advice Taking coefficient (AT, Reference Harvey and FischerHarvey & Fischer, 1997) is defined as: (final judgment − initial judgment)/(advice − initial judgment). Interestingly, a negative quadratic relationship of advice distance and absolute adjustment towards the advice is equivalent to a negative linear decrease of advice weighting, such as measured by the AT score, as advice distance increases.Footnote 1 Therefore, the monotone negative relation found in previous studies is—potentially—in line with the predictions made by SJT, but only to the extent that the absolute opinion change in these studies follows an inversely U-shaped pattern.
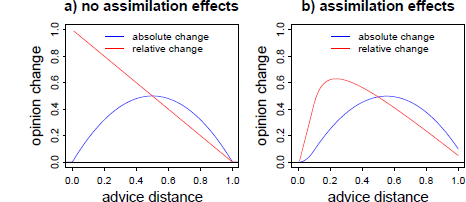
However, SJT also allows for a curvilinear relation of advice distance and advice taking. The core idea behind this non-monotone pattern is as follows: if advice is very close to the decision-makers’ initial opinion, there is an increased chance that he or she will completely neglect the objective difference and, accordingly, retain the initial opinion. In SJT, this has been addressed in terms of an “assimilation effect” (Reference Sherif, Taub and HovlandSherif, Taub & Hovland, 1958). Assimilation effects lead to overestimating the similarity of one’s own attitude, on one hand, and a message from another person, on the other. Sometimes, such messages are perceived as practically equivalent to the recipient’s own attitude, so that the objective discrepancy is no longer considered substantial—rendering further adjustment towards the message seemingly unnecessary. Such a region of practical equivalence (ROPE) is likely to vary among subjects, and even within subjects the size of the ROPE may vary from problem to problem. If such assimilation effects occur, there should be an increased likelihood of the judge assigning zero weight to the advice when it is close to the initial estimate. Figure 1 illustrates the predictions of SJT—with and without assimilation of near advice—regarding absolute and relative opinion change as a function of advice distance. As can be seen from the right panel, assimilation effects lead to a curvilinear relation of advice distance on advice weighting, with low weight of advice for very near advice and for advice that is relatively far from judges’ initial opinion.
Predictions of SJT in its basic form (left panel) and assuming additional assimilation effects (right panel) for both absolute and relative opinion change (advice weighting) as a function of advice distance. Advice distance and opinion change are measured in arbitrary units. The curves in the right panel are based on a simulation of 2,000 judges with ROPEs randomly drawn from a uniform distribution ranging from .01 to 0.2 arbitrary distance units.
1.4 A stimulus-response model (SRM)
As already outlined, SJT is not necessarily the only approach that makes predictions about how advice taking relates to advice distance. In our view, a particularly plausible alternative to SJT is a rather simple stimulus-response model (SRM). According to this model, decision-makers’ absolute adjustment towards advice is proportional to the intensity of the stimulus, that is, how strongly the advice urges the judge to revise the initial opinion. In the context of advice, stimulus intensity could depend on a wide range of features such as the advisor’s expertise or the judge’s own confidence, but all else being equal, stimulus intensity should be directly proportional to advice distance. As with all stimuli, decision-makers’ perception of stimulus intensity (i.e., advice distance) can be subject to diminishing sensitivity (Reference StevensStevens, 1957). A SRM with diminishing sensitivity would predict that absolute opinion change increases with advice distance, but that these increases become successively smaller. That is, absolute opinion change is a monotone positive, but negatively accelerating function of advice distance. On the level of relative opinion change, we would expect a pattern somewhat like that proposed by SJT, namely a monotone decrease of advice weighting as advice distance increases. The difference between the two is that a SRM with diminishing sensitivity predicts a non-linear instead of a linear decrease in advice weighting.
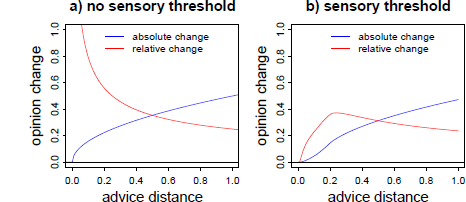
The SRM can also be expanded so that it predicts a curvilinear relation of advice distance and advice weighting, namely by incorporating an equivalent of sensory thresholds. Of course, in the context of quantity estimates in the judge-advisor system, it is implausible to assume that judges will not notice a numerical difference between their estimates and the advice. However, as an analogy to a sensory threshold, they might perceive advice outside their ROPE only as a stimulus that necessitates adjustment. Hence, if advice falls into judges’ ROPE, they will assign zero weight to it. The predictions a SRM makes regarding absolute and relative opinion change are displayed in Figure 2.
Predictions of a SRM in its basic form (left panel) and assuming an analogue to a sensory threshold (right panel) for both absolute and relative opinion change (advice weighting) as a function of advice distance. Advice distance and opinion change are measured in arbitrary units. The curves in the right panel are based on a simulation of 2,000 judges with ROPEs randomly drawn from a uniform distribution ranging from .01 to 0.2 arbitrary distance units.
The patterns predicted by the two theoretical accounts when incorporating ROPEs are clearly distinct from the negative monotone relations that have been considered in the previous literature. However, as outlined above, previous studies did not allow detection of such non-monotone trends in the near regions of advice. Nevertheless, a study by Yaniv, Choshen-Hillel and Milyavsky (2009) hints towards the possibility that very near advice might increase the likelihood of judges retaining their initial opinions. In this study, Yaniv et al. were interested in how judges utilize interdependent as compared to independent advice from multiple advisors. Judges received advice from three advisors who were either randomly drawn from a set of previous subjects, or who were selected because their estimates were particularly close to that of the judge. In the latter case, advice was less informative due to the dependency of the judgments, but there was greater consensus among the advisors. Dependent advice was also closer to judges’ initial estimates than independent advice. When receiving dependent advice, judges were much more likely to assign zero weight to the advice and retain their initial opinion. Whereas Yaniv et al. attributed this effect to the greater consensus among dependent advice, it could have also—at least partially—been due to differences in advice distance.
As we have pointed out, both a monotone negative relation of advice distance and advice weighting as well as an inversely U-shaped relation are plausible given the theoretical frameworks we described. In order to differentiate between monotone and non-monotone relations of advice distance and advice weighting, we need to investigate the whole spectrum of advice distance as a continuous variable. In addition, the exact shape of the monotone relation or the inversely U-shaped relation, respectively, differs between SJT and the SRM. Hence, it is also necessary to investigate both absolute and relative measures of opinion change. In the present research, we will do both.
1.5 Distance effects on judges’ confidence
The possibility of a non-monotone relation of advice distance and advice weighting leads to an interesting question: do low weights of advice generally mean that the advice was not utilized? Focusing on measures of opinion adjustment alone—whether they are absolute or relative – may tell only part of the story. A more complete picture may emerge if we consider a second form of advice utilization, namely, advice as a means of social validation.
An important aspect in research on advice taking—besides the accuracy of the judgments itself—is judges’ confidence. Confidence in the initial estimates is often treated as an input variable, that is, it is used as a predictor of advice taking (e.g., See et al., 2011; Reference Soll and MannesSoll & Mannes, 2011). However, confidence can also be an outcome of advice taking (e.g., Yaniv et al., 2009). For example, judges’ confidence might increase from the initial to the final estimate because they are aware that combining two independent estimates tends to reduce idiosyncratic errors (Reference Minson and MuellerMinson & Mueller, 2012). Here, we are interested in another possibility, namely that a judge receives advice that is—subjectively—very similar to the initial estimate. In this case, judges’ confidence that their current belief is accurate may change from their initial to their final estimate (even when the estimate itself does not change), particularly due to the latter being informed by advice. Such effects of social validation are well-documented in research on group decision making. Confidence in the correctness of a group decision increases with the extent of social support for this decision, and the lack of dissent(Reference Schulz-Hardt, Frey, Lüthgens and MoscoviciSchulz-Hardt, Frey, Lüthgens & Moscovici, 2000; Reference Schulz-Hardt, Jochims and FreySchulz-Hardt, Jochims & Frey, 2002; Sniezek & Kolzow, 1992, as cited in Sniezek, 1992).
Assuming independent estimates, judges should feel validated to the degree that they perceive the advice to be sufficiently similar to their initial estimates. As we explained, the study by Yaniv et al. (2009) provides suggestive support for this conclusion. Based on these findings, and in accordance with Budescu (2006), we suggest that judges’ confidence increases most after receiving near advice, and that this confidence gain decreases gradually as advice distance increases. Thus, low weights placed on near advice would not generally mean that the advice was not utilized, but rather that advice utilization takes a form different from adjusting one’s opinion.
2 Overview of the present research
2.1 Research questions
Based on the reasoning above, we aim to answer the following three research questions. The first concerns the shape of the relation of advice distance and advice weighting. Here, we will investigate whether this relation is a monotone negative trend, as implied by most previous research, or whether there is evidence of an inverse U relation. In an inverse U is found, a follow-up question is whether lower weights placed on near advice are consistent with the idea of ROPEs, in which case judges are more likely to retain their initial opinions, giving zero weight to the advice, when advice is particularly close.
The second question is which of the outlined theoretical accounts, SJT and the SRM, fits our data better. As mentioned above, it may be difficult to differentiate between the two accounts if we restrict the analyses to the level of relative opinion change (advice weighting). We should, however, be better able to make this distinction if we also investigate absolute opinion change: Whereas SJT predicts that absolute opinion change is maximal for moderate advice distance and lower for both near and far advice, a SRM assumes a monotone positive relation, that is, the further the advice is from judges’ initial opinion, the more judges will change that opinion in the direction of the advice.
Finally, we are interested in whether judges utilize advice as a means of social validation, depending on its distance from the initial estimates. In the case of an inversely U-shaped relation of advice distance and advice weighting, the question is whether near and far advice are disregarded equally, or whether the former is merely utilized in a different way, namely as a validation of one’s initial opinion. In the following, we address these questions in a series of six experiments.
2.2 Data reporting and sample sizes
Following the recommendation of Reference Simmons, Nelson and SimonsohnSimmons, Nelson and Simonsohn (2011), we report all cases of data exclusion in the method sections of the respective experiments. We further assert that we report all measures and conditions of the conducted experiments. Sample sizes for the first four experiments were determined based on a power analysis for within-subjects effects in a repeated measures ANOVA, which we originally planned to use in order to analyze our data. Given a moderate effect size for the within-subjects effect ( f = .25), an alpha level of .05 and an aspired power of .95, a design with 15 measurement points, and an assumed average correlation of .44 between measurement points (based on pretest data from N = 20 subjects working on 60 distance estimates in a judge-advisor system), the analysis suggested a minimum sample size of 18 subjects. Since samples sizes of 18 seemed rather low, we then chose to match the sample sizes of the original Yaniv (2004b) study on advice distance, that is, around 25 subjects per between-subject condition. The exact number of subjects in the first four experiments depended on how many subjects showed up to the scheduled experimental sessions. We overbooked all sessions, and due to varying numbers of subjects not showing up, the effective sample sizes varied somewhat. In Experiments 5 and 6, we increased the sample size. Since power analyses for random effects multi-level models are rather complex (and beyond our current grasp), we followed a rule of thumb and aimed for double the subjects per between-subjects condition. We scheduled experimental sessions for 50 subjects in Experiment 5 and 100 subjects in Experiment 6, but due to some subjects not showing up, the final sample sizes were 45 in Experiment 5 and 98 in Experiment 6, respectively.
2.3 Data analysis
The results in this paper were obtained using R 3.1.2 with the packages nlme 3.1-118 and lme4 1.1-7. R itself and all packages used are available from CRAN at http://CRAN.R-project.org/. We used multi-level modelling to analyze the data. The lowest level of analysis is the single trial (level 1), and the models include random effects of subjects (level 2). Specifically, each model contains random intercepts and random slopes of all predictor variable that vary at the level of trial, thus allowing for the effective shape of the curve to vary between subjects. Continuous dependent variables we analyzed using the lme function of the nlme package for R while we used the glmer function of the R package lme4 when analyzing dichotomous variables in the form of multi-level logistic regression. In addition, when the experimental design included potential cross-level interactions, that is, interactions between predictors that varied on the level of trial (i.e., within subjects) and those that varied on the level of subjects (i.e., between subjects), we first tested whether adding these cross-level interaction improved model fit using Likelihood-Ratio tests. In case of a non-significant Likelihood-Ratio we adopted the less complex model as the best-fitting model.
3 Experiment 1
The first experiment assessed how the distance between judges’ initial estimates, on the one hand, and the advisors’ recommendations, on the other, affect advice weighting, absolute opinion change, the likelihood of judges retaining their initial opinion, and shifts in judges’ confidence in the accuracy of their estimates after having received advice.
3.1 Method
3.1.1 Subjects
Twenty-seven undergraduate students ( M = 21.19 years, SD= 2.35) took part in the experiment. The sample consisted of 19 (70%) female and 8 male subjects who either received course credit or a reward of 6 Euro for participating in the study (approx. $8.50 at the time of the study). To ensure subjects’ motivation to perform well, they were informed that the top five of them (i.e., those with the most accurate final estimates) would receive movie theater vouchers worth 15 Euro (approx. $21).
3.1.2 Design and procedure
Experiment 1 followed a one-factorial design with advice distance as a within-subjects factor with fifteen levels of advice deviation. The computer-based study was programmed and run using the software Presentation (Versions 13.0—14.8, http://www.neurobs.com), and all subjects worked on the task individually in separate laboratory rooms. At the beginning of the experiment, all subjects were assigned the role of judges and were, therefore, responsible for making an initial as well as a final estimate. They were informed that they would receive advice before making their final estimate. Subjects were told that their advisor would be randomly selected from a pool of 100 people who had taken part in an earlier experiment using the same estimation tasks, and who had been ranked according to their performance during that experiment. That is, a rank of 1 represented the alleged advisor with the most accurate estimates, and a rank of 100 the one with the least accurate estimates. In order to increase face validity of the supposedly random selection process, subjects were presented with a rapid, repeated passage of the numbers from 1 to 100 that could be stopped by pressing the space bar on the keyboard. Subjects were then told they would receive advice from the person with the rank of the number that was presented when they stopped the random generator. In fact, the computer program always assigned the advisor who ranked 7th in the previous experiment, thereby indicating the advisor’s rather high competence to the subjects. We chose a rather competent advisor because previous research suggests that highly competent advisors are weighted by about 50% on average (e.g., Reference Harvey and FischerHarvey & Fischer, 1997; Reference Soll and MannesSoll & Mannes, 2011; Reference Yaniv and KleinbergerYaniv & Kleinberger, 2000). This leaves maximal room for increasing or decreasing weights as a function of advice distance.
The experimental session consisted of 60 trials in each of which subjects were asked to estimate the airline distance in kilometers between two European Union capitals as accurately as possible. Each trial followed the procedure of the JAS. In the first phase, respondents were presented with the names of the two cities and were asked to state their initial estimate about the distance between them. After they had done so, they were asked to rate their confidence (pre-advice confidence) in the accuracy of their initial estimate on a 7-point Likert-scale ranging from 1 (not at all confident) to 7 (very confident). In the second phase, they were presented with the estimate of their supposed advisor. In the third phase of the trial, subjects were asked to estimate the distance between the aforementioned European capitals once more and to state their confidence in the final estimate (post-advice confidence).
To avoid any potential stereotype-related effects based on gender differences between judge and advisor, the alleged advisor’s gender was matched to that of the subject: Female subjects received advice from “Christine” and male subjects from “Christian”. Subjects were informed that these were not the real names of their advisors; rather, these names had been arbitrarily chosen to ensure the advisors’ anonymity.
In fact, this advice was generated online by computing predetermined relative deviations (in percent) from the respective initial estimates. Using such mechanically constructed advice allows the influence of continuous advice distance on advice weighting to be systematically tested (as done by Yaniv, 2004b). The distance between judges’ initial estimates and the advice that subjects received was manipulated within subjects by increasing or reducing the initial estimate by a specific percentage ranging from ± 5% to ± 75% in steps of 5%. Based on our previous experience that most subjects provide rounded estimates (e.g., by tens of kilometers), we rounded the advice to tens of kilometers in order not to raise suspicion. The sequence of deviations was held constant for all subjects to reduce error variance.Footnote 2 Each positive and each negative deviation was applied twice. The program also contained a fail-safe mechanism in order to prevent subjects from recognizing that the advice was in fact based on their initial estimates. To this end, whenever the advice would have been below 25km or above 7,500km (which was usually the result of subjects’ erroneous input when entering the initial estimates), the program did not modify the initial estimate by a specified percentage but rather presented a random number between 500 and 4,000km, rounded to 10s as an “apparently authentic” distance-estimate. Summed over all subjects, this failsafe was activated in 94 trials (5.8%). As the displayed advice no longer corresponded to the intended level of advice distance in those trials, these trials were subsequently removed from the analysis.
As already mentioned, we provided subjects with an incentive to perform well at the judgment tasks by granting cinema vouchers to the top five subjects. For the purpose of determining those subjects who would receive the bonus payments, performance was assessed via the mean absolute percent errors of the final estimates (see, e.g., Reference Sniezek and HenrySniezek & Henry, 1989, for a comparable incentive procedure).
3.2 Results
3.2.1 Advice weighting
The measure of advice weighting applied in our experiments is the AT score. As already explained above, the AT score reflects the weight percentage assigned to the advice. Values of 0, .50, and 1 result when advice is completely disregarded, weighted equally, and fully adopted, respectively. Although negative values and values greater than 1 are possible, they occur rarely, that is, in less than 5% of the cases (e.g., Reference Gino, Shang and CrosonGino, Shang & Croson, 2009; Reference Soll and LarrickSoll & Larrick, 2009). In line with previous studies, we calculated AT scores for each subject and each trial. AT scores greater than 1 were truncated to a value of 1, and negative AT scores were truncated to a value of 0 (e.g., Gino et al., 2009; Reference Gino and SchweitzerGino & Schweitzer, 2008, Reference Soll and LarrickSoll & Larrick, 2009).
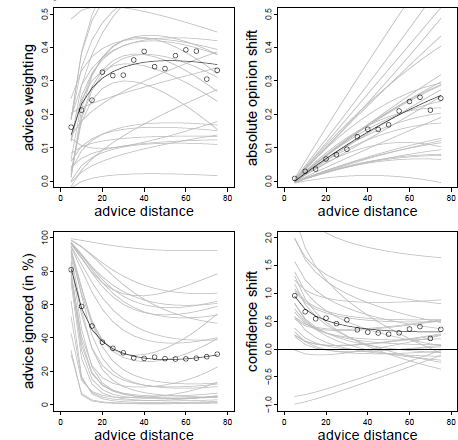
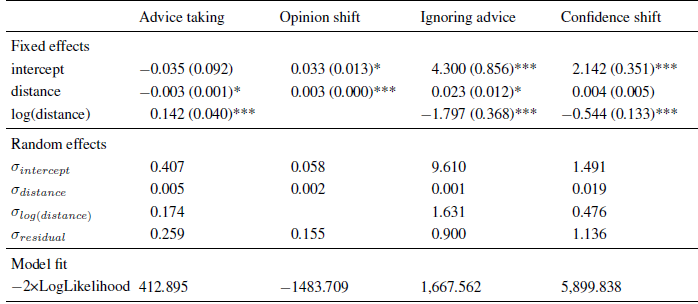
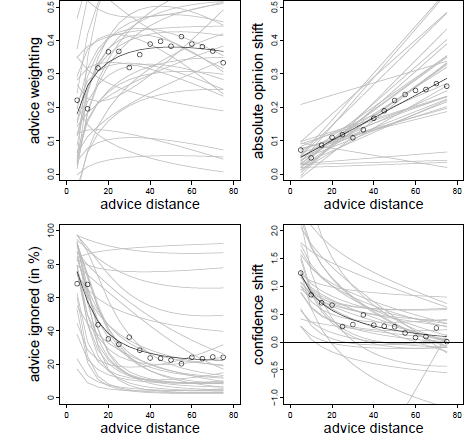
The analysis of the AT scores showed a clear non-monotone pattern. In addition to a significant negative linear effect of advice distance on advice weighting, there was also a non-linear effect as indicated by a significant effect of the logarithm of advice distance (see Table 1).Footnote 3 The combination of these effects resulted in a rather steep increase in advice weighting followed by a slow and steady decline (see also the upper left panel of Figure 3). These results are in line with the idea of a non-monotone relation of advice distance and advice weighting as suggested by both SJT and the SRM when adding ROPEs. That is, advice is weighted less when it is both very close to and far away from judges’ initial estimates.
Advice weighting (upper left panel), absolute opinion shift (upper right panel), frequency of ignoring advice (lower left panel), and confidence shifts (lower right panel) as a function of advice distance in Experiment 1. White dots represent the observed mean values. The bold black line represents the model predictions. Light gray lines represent the fitted data of the individual subjects based on the model’s random effects.
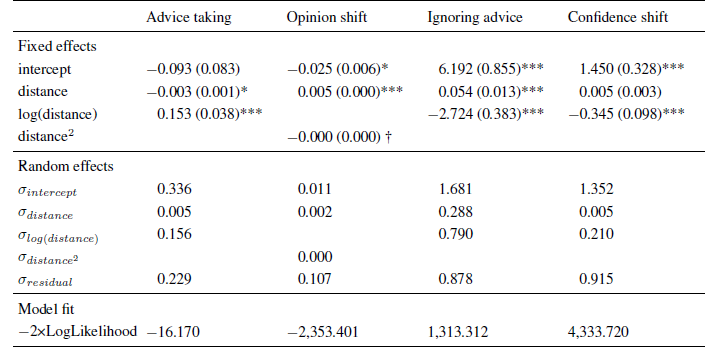
Note: The intercept indicates the expected level of the dependent variable (or its log-odds in the case of ignoring advice) for an advice distance of zero.
* p < .05
** p < .01
*** p < .001.
3.2.2 Absolute opinion shift
We next investigated absolute opinion shift as a function of advice distance because this analysis can differentiate more clearly between SJT and the SRM. Intuitively, one would predict absolute opinion change from absolute advice distance (both measured in kilometers in the case of Experiment 1). However, running the analysis in this way produces different amounts of data points at certain levels of the advice distance continuum, simply because some subjects generally estimated the distances to be greater than others. Specifically, subjects who vastly overestimate the true values might produce a few outlier values that could substantially change he results of the analyses. We remedied this problem in a rather simple fashion, namely by subjecting both variables to the same linear transformation: we first calculated the difference between either the advice or the final estimate and the initial estimate and then divided this difference by the initial estimate. On the level of advice distance this transformation yields the percent deviation of advice form the initial estimate (which is exactly our manipulation of advice distance). On the level of opinion change, the linear transformation corresponds to the percent shift of opinion (note that this transformation does not change the shape of the underlying curve because both variables are subjected to the exact same linear transformation). Similar to the AT scores, we truncated the measure of absolute opinion change at zero. In case the AT score had been truncated to 1 for a specific trial, we truncated absolute opinion change to the maximum percent advice distance (in our case 75%). We then analyzed absolute opinion change in a multilevel model similar to that of the AT scores. We first determined the best-fitting model. The basic model contained the fixed effect of advice distance, random intercepts and random slopes for advice distance. We tested whether adding non-linear components such as squared advice distance or its logarithm (as well as their respective random slopes) increased the fit of the model. While adding the logarithm of advice distance did not improve model fit, χ2(2) = 4.312, p = .366, adding squared advice distance did, χ2(2) = 10.537, p = .032. However, in this model, only a significant linear effect of advice distance emerged (see Table 1). The quadratic effect was negative but not statistically significant. Descriptively, this effect led to a slightly negative acceleration of the curve. Since there was no indication of absolute opinion shifts decreasing in the far regions of advice distance, the absolute opinion change seems more in line with an SRM than with SJT (see Figure 1, upper right panel).
3.2.3 Frequency of ignoring advice
We continued our analyses by testing the idea that there might be ROPEs which lead judges to retain their initial estimates. To this end, we investigated whether judges ignored advice more frequently when it was close to their initial opinions and, thus, likely to fall into their respective ROPE. The dependent variable in this analysis was a dichotomized measure assuming the value of 0 when judges adjusted their estimates after receiving advice and 1 whenever they retained their initial estimate. As can be seen in Table 1, the frequency of ignoring advice was significantly related to advice distance and to its logarithm, the latter effect being negative. Judges were most likely to assign zero weight to the advice when it was closest to their initial opinion (about 80% of the cases). The likelihood of ignoring the advice decreased quite rapidly and was largely stable for distances ranging from 20% to 75% (see Figure 3, lower left panel). This finding is in line with the idea that judges do not shift their opinions in the light of very near advice because advice falls into their ROPE.
3.2.4 Confidence shifts
Finally, we analyzed changes in judges’ confidence. We computed confidence shifts as the difference between subjects’ confidence in their final estimates and the confidence in their first estimates. Positive values of this measure indicate that subjects were more confident in their final estimates than in their initial estimates. As can be seen from Table 1, the linear effect of advice distance was not significant, and confidence shifts were negatively related to the logarithmic distance term. Once a critical level of advice distance had been surpassed (in this case around 35-40%), judges’ increases in confidence no longer differed from zero.
3.3 Discussion
The results of Experiment 1 show that the relation of advice distance and advice weighting is not monotone as previously assumed. Rather, it is characterized by lower weights of advice for both near and far advice. The low weights of near advice are the result of judges’ being more likely to retain their initial opinions when receiving advice close to their own initial estimates, an observation consistent with the idea of ROPEs. However, the results also indicate that advice close to judges’ own initial estimates is likely to be seen as social validation of these estimates. Although judges hardly adjusted their estimates towards near advice, they became more confident in their own estimates at the same time. In other words, very near advice is, in fact, utilized, though not necessarily by adjusting the final estimate but rather by increasing the judge’s confidence that the initial estimate was right in the first place. Finally, our investigation of absolute opinion change revealed an interesting pattern, namely a mostly linear increase with a barely noticeable negative acceleration. The further the advice was from judges’ initial estimates, the more they shifted their opinion towards it. This finding seems more in line with an SRM than SJT, but we cannot rule out that more pronounced nonlinear effects and—possibly—decreasing opinion shifts would have occurred had we investigated more extreme advice distances (we will address this possibility in Experiment 3).
4 Experiment 2
The aim of Experiment 2 was to test whether the results of Experiment 1 would generalize to another task type. This time, subjects were asked to estimate the caloric content of different types of food (e.g., toast, peas, boiled egg; calories per 100g, one food at a time). This task was adopted from a study by Yaniv et al. (2009).
4.1 Method
4.1.1 Subjects
The data from 31 undergraduate students ( M = 24.35 years, SD= 4.35) were analyzed in Experiment 2. The sample consisted of 18 (58.1%) female and 13 male subjects who either received course credits or 5 Euro (approx. $6.80 at the time of the study) for participating. As with Experiment 1, we chose a sample size similar to that in the original Yaniv (2004b) study. As in Experiment 1, the five subjects with the most accurate final estimates additionally received movie theater vouchers worth 15 Euro (approx. $21).
4.1.2 Design and procedure
Experiment 2 was identical to Experiment 1 with two exceptions: first, we used a different task, namely estimating the calorie content of different foods. As with the distance estimates, we rounded the advice to 10s in order not to raise suspicion. The failsafe mechanism was set to create the advice as a random number between 10 and 900 calories, rounded to 10s, whenever subjects’ initial estimates were below 10 or above 2000 (those values were mostly the result of erroneous input). The failsafe was activated in 47 trials (2.5%) that were subsequently removed from the analyses. Second, the order of advice deviations was fully randomized in Experiment 2 to rule out the possibility of order effects. The experiment therefore followed a one-factorial design with advice distanceas the within-subject factor with 15 levels.
4.2 Results
4.2.1 Advice weighting
As in Experiment 1, we began our analysis by investigating advice weighting. As can be seen from Table 2, the results strongly resemble those of Experiment 1. Advice weighting was characterized by a combination of a significant negative effect of advice distance and a significant positive effect of its logarithm. That is, advice weighting increased strongly in the closer regions of advice distance and declined slowly thereafter (see also Figure 4, upper left panel). Thus, the results replicate those obtained in Experiment 1 and support the idea of a non-monotone, inversely U-shaped pattern.
Note. The intercept indicates the expected level of the dependent variable (or its log-odds in the case of ignoring advice) for an advice distance of zero.
* p < .05
** p < .01
*** p < .001
Advice weighting (upper left panel), absolute opinion shift (upper right panel), frequency of ignoring advice (lower left panel), and confidence shifts (lower right panel) as a function of advice distance in Experiment 2. White dots represent the observed mean values. The bold black line represents the model predictions. Light gray lines represent the fitted data of the individual subjects based on the model’s random effects.
4.2.2 Absolute opinion change
We next investigated absolute opinion shift as a function of advice distance. Again, the data were best described by a linear increase in opinion shift as advice distance increased (see Table 1 and Figure 4, upper left panel). Other than in Experiment 1, adding non-linear components did not provide a better fit to the data, χ2(2) = 6.758, p = .149, and χ2(2) = 6.921, p = .140, for a logarithmic and quadratic term, respectively. Hence, the results are more in line with a simple SRM and less so with SJT.
4.2.3 Frequency of ignoring advice
The analysis of the frequency with which judges ignored advice yielded results similar to that of Experiment 1. As can be seen in Table 2, this frequency was positively related to advice distance and negatively to its logarithm. Subjects assigned zero weight to the advice most frequently when it was very close to their initial estimates, and this frequency dropped quite rapidly with increasing advice distance, stabilizing once it reached a moderate distance of 35 to 40% (see Figure 4, upper right panel). Although judges were somewhat less likely to fully ignore the advice in Experiment 2 compared to Experiment 1, the pattern is qualitatively the same and supports the idea that near advice is particularly likely to be seen as practically equivalent to the initial opinion, rendering any adjustments towards the advice mute.
4.2.4 Confidence shifts
Table 2 shows that the there was a negative effect of the logarithm of advice distance on confidence shifts whereas the linear effect was not significant. The pattern strongly resembles that observed in Experiment 1 with strong increases in confidence when advice was near and diminishing confidence shifts as advice distance increased (see Figure 4, lower right panel). Thus, the results support the notion that near advice is used as a means of social validation.
4.3 Discussion
In sum, the results of Experiment 2 replicate those of Experiment 1 using a different estimation task. They suggests a curvilinear relationship between advice distance and advice weighting. Again, objectively similar increments of advice distance produced strong increases in advice weighting when advice was close to the initial estimate and small decreases in advice weighting when the advice was farther away. Based on the linear increase in absolute opinion shift as a function of advice distance, an SRM seems to provide a better account of judges’ advice taking behavior than SJT. Also in line with Experiment 1, advice was weighted by zero most often when it was very near the initial estimates, thus, providing more evidence for the idea of ROPEs. The validating effect of advice was also strongest for near advice and diminished in a nonlinear fashion as the advice became more distant form the initial estimates. Finally, Experiment 2 allows us to rule out the possibility that our findings are due to order effects of the material, since the effects largely remained stable despite randomized trial order in Experiment 2.
5 Experiment 3
We conducted Experiment 3 to address two aspects of the previous Experiments. First, we investigated the distance effects with expert advisors only. The reason for this choice was that the weight usually assigned to expert advice allows for a wider range of differences than weights of advice placed on average quality of advice, which is usually heavily discounted (e.g., Reference Harvey and FischerHarvey & Fischer, 1997; Reference Yaniv and KleinbergerYaniv & Kleinberger, 2000). However, since both Yaniv (2004b) and Reference Bochner and InskoBochner and Insko (1966) found knowledge-specific effects of advice distance on advice weighting or attitude change, respectively, the advisor’s competence may in fact moderate the impact of advice distance on advice utilization. For example, individuals may be more open to dissimilar advice when it stems from an expert source. Second, in the first two experiments we quite arbitrarily chose a range of advice distances with a maximum of 75% of judges’ initial estimates. In both experiments, we found evidence for decreased weights placed on farther advice, but the effects seemed rather small compared to the strong decreases for very near advice. In addition, absolute opinion shifts neither showed a decline in opinion shifts as suggested by SJT nor a particularly pronounced negative acceleration that would result from diminished sensitivity in an SRM. This may very well be a result of an overly narrow range of advice distance. In order to address these issues, we replicated Experiment 1 and introduced a second advisor who was allegedly rather low in expertise. In addition, we expanded the range of advice distance.
5.1 Method
5.1.1 Subjects
Thirty-nine graduate and undergraduate students ( M = 22.00 years, SD= 2.61 years) took part in the study. The sample consisted of 21 (54%) female and 18 male subjects. Subjects received either course credit or payment of 6 Euro (approx. $8.50). Again, the five most accurate subjects received movie theater vouchers worth 15 Euro ($21) to ensure subjects were motivated to perform well.
5.1.2 Design and procedure
Experiment 3 was similar to Experiment 1 with two exceptions. First, the competence of the advisor was manipulated between subjects: half of the subjects received advice from a supposedly competent advisor (ranked 7th out of 100—similar to Experiments 1 and 2) whereas the other half received estimates from a supposedly less competent advisor (ranked 78th of 100). Second, the range of advice distance was expanded. In addition to deviations of ± 5% to ± 75% in steps of 5%, positive deviations of up to 150%, also in steps of 5%, were added. Each positive and negative percent deviation from 5% to 75% was run once, and each (positive) deviation from 80% to 150% was run twice. Deviations of 80% and higher were only applied in the form of positive values, because otherwise it is highly likely that the resulting advice would have appeared unrealistically low. Furthermore, deviations of 100% and higher were applied only in the form of positive values because, logically, there can be no negative distances between two geographical locations. Experiment 3 was a mixed design with the between-subjects factor advisor competence(competent vs. less competent) and the within-subjects factor advice distanceconsisting of thirty levels of absolute advice deviation. The study included 60 trials with advice preset to appear in the same previously randomized sequence for all subjects. We switched back to this procedure since a full randomization, as applied in Experiment 2, did not lead to crucial differences regarding the effects of manipulated advice distance on advice weighting and confidence shift. A failsafe mechanism similar to that in Experiment 1 led to the exclusion of 42 trials (1.8%) from the analyses.
5.2 Results
5.2.1 Advice weighting
As in Experiments 1 and 2, we first analyzed advice weighting. Due to the addition of advisor expertise as a predictor on the subject level, the full model containing all fixed effects is much more complex than those in the previous experiments. We, therefore, used a stepwise approach to determine the appropriate model as outlined above. The basic model contained only the fixed effects of advisor competence and the two components of advice distance. It also included random intercepts and random slopes for the two distance components. We then tested whether adding the cross-level interactions (i.e., the interactions of advisor competence and the advice distance components) led to a significant increase in model fit. This was not the case, χ2(2) = 5.247, p = .073, implying that there was no significant interaction of advice distance and advisor expertise. However, since the Likelihood-Ratio test failed to reach statistical significance by only a small margin, rejecting the more complex model also did not seem justified. We therefore adopted the mode complex model (see Table 3).Footnote 4
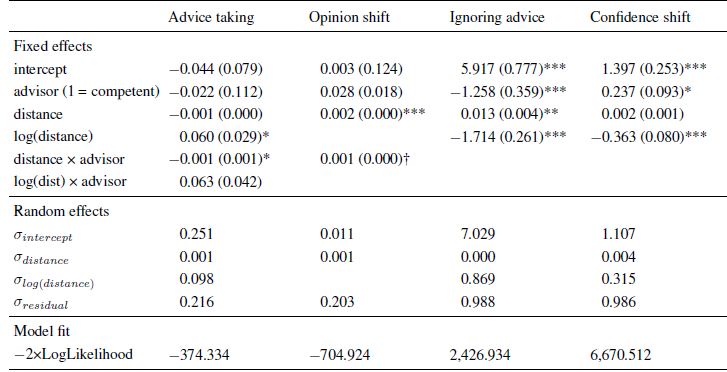
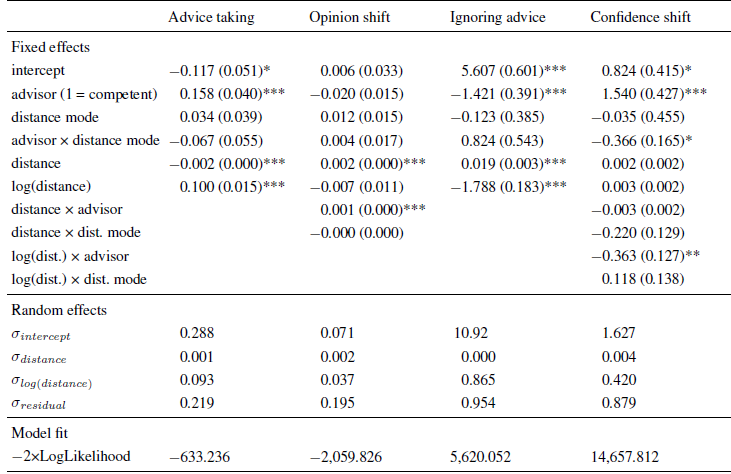
Note. The intercept indicates the expected level of the dependent variable (or its log-odds in the case of ignoring advice) for an advice distance of zero when faced with an advisor low in expertise.
† p < .10
* p < .05
** p < .01
*** p < .001
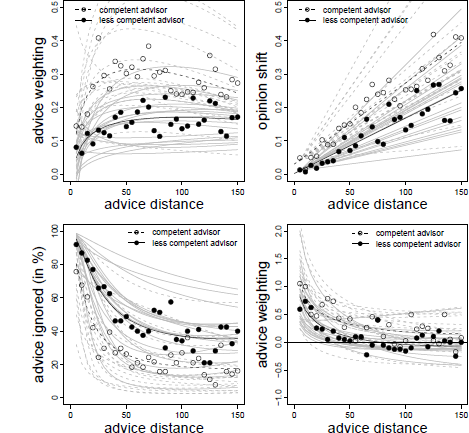
The analysis revealed a significant positive effect of the logarithm of advice distance similar to those in the previous experiments. The effect of advice distance itself was, again, negative, but it was not statistically significant. Instead, there was a significant interaction of advice distance and advisor competence. In order to disentangle this interaction, we analyzed the data separately for the competent and the less competent advisor. For the competent advisor we found the same pattern as in the previous experiment, that is, a significant negative effect of advice distance, B = −0.002 ( SE = 0.001), t(1097) = −3.901, p < .001, and a significant positive effect of its logarithm, B = 0.123 ( SE = 0.035), t(1097) = 3.513, p < .001. For the less competent advisor the logarithmic effect was also significant and positive, B = 0.060 ( SE = 0.025), t(1156) = 2.406, p = .016, while the linear effect—although also negative—was not significant, B = −0.000 ( SE = 0.000), t(1156) = −1.357. p = .175. As can be seen in Figure 5 (upper left panel), we again found a strong increase in advice weighting in the near regions. This increase was followed by a slow and steady decrease for the competent advisor, which was more pronounced than in the previous experiments, most likely due to the extended range of advice distance. The downward trend in the far regions of advice distance was almost unnoticeable for the less competent advisor, probably because the weights assigned to advice from this advisor was substantially lower (11 percentage points, on average) in the first place.
Advice weighting (upper left panel), absolute opinion shift (upper right panel), frequency of ignoring advice (lower left panel), and confidence shifts (lower right panel) as a function of advice distance in Experiment 3. White and black dots represent the observed mean values for the competent and less competent advisor condition, respectively. The dotted and regular bold black lines represent the model predictions for the competent and less competent advisor, respectively. Light gray lines represent the corresponding fitted data of the individual subjects based on the model’s random effects.
5.2.2 Absolute opinion change
Absolute opinion change was best described by a linear increase as advice distance increased. We then tested whether adding the cross-level interaction of advisor and advice distance increased the fit of the model. As with advice weighting, the Likelihood-Ratio test neither strongly supported retaining the baseline model, nor did it show a significant increase in model fit, χ2(1) = 3.050, p = 0.081. We, therefore, decided to adopt the more complex model. Adding curvature to this model in the form of a logarithmic or a quadratic term did not improve the model any further, χ2(5) = 5.649, p = .342, and χ2(5) = 7.278, p = .200, respectively. As can be derived from Table 3, there was a significant effect of advice distance. In line with the Likelihood-Ratio test, the interaction of advice distance and advisor failed to reach statistical significance, but, descriptively, absolute adjustments towards the advice increased more strongly for the competent than the less competent advisor (see Figure 5, upper right panel). The results are in line with those of the previous Experiments.
5.2.3 Frequency of ignoring advice
In line with the previous analyses, we first determined the best-fitting model. This model contained the main effects of advisor, advice distance and its logarithm. Adding the interactions of advisor and the two distance components did not increase model fit.Footnote 5 As in the previous experiments, the frequency of ignoring advice was positively related to advice distance and negatively to its logarithm. In addition, there was a negative effect of advisor competence, suggesting that advice from the competent advisor was, generally, less likely to be ignored (Table 3). The general pattern was, again, in line with the idea of ROPEs, that is, advice from both advisors was especially likely to receive zero weight, when it was very close to the initial estimates. The frequency of ignoring the advice decreased rapidly until it stabilized at moderate levels of advice distance, the only difference being the magnitude of that stable level. For the competent advisor is was around 20% of the trials while it was almost double that for the less competent advisor (see Figure 5, lower left panel).
5.2.4 Confidence shifts
We first determined the appropriate model by comparing a basic model that contained only the main effects with a more complex model that also contained the cross-level interactions. Adding the cross-level interactions did not increased model fit, χ2(2) = 0.272, p = .873. We therefore report the parameter estimates for the basic model (Table 3). Not surprisingly, this model suggests that confidence increases more after receiving advice from a competent advisor. In addition, the validating effect of receiving advice decreased with increased advice distance until it exceeded a certain threshold after which confidence gains seemed to be rather stable (see also Figure 5, lower right panel). This pattern is in line with the results of Experiment 1 and 2.
5.3 Discussion
In sum, the results of Experiment 3 mirror those of Experiments 1 and 2. Furthermore, the influence of advice distance on advice weighting, absolute opinion shift, frequency of ignoring advice, and confidence shifts seems to be largely independent of the alleged advisors’ competence. In those cases where the model comparisons did not clearly reject a model containing interactions of advisor competence and advice distance the results were qualitatively similar for the two advisors: absolute opinion shifts increased as a linear function of advice distance, and the advice was more likely to receive zero weight when it was close the initial estimate. On the level of advice weighting, the high frequency of ignoring near advice led to the familiar curvilinear pattern. Importantly, we found no noticeable curvature in the relation of advice distance and absolute opinion shift although we doubled the range of advice distance. Thus, the data of Experiment 3 provide further support for the idea that advice taking behavior follows the rules of a SRM with ROPEs due to the analogue of a sensory threshold.
So far, Experiments 1 to 3 have consistently revealed that the relation between advice distance and advice weighting is nonlinear and best described by a combination of a positive logarithmic effect and a downward linear trend. These results contradict those of previous studies, in particular the seminal study by Yaniv (2004b). Initially, we argued that this difference is due to the rescaling of advice distance into distinct categories, which made it difficult, if not impossible, to identify the exact shape of the relationship of advice distance and advice weighting. However, this methodological point is not the only explanation for the different findings. Forming distinct advice distance categories might have also led subjects to process advice distance in a qualitatively different manner. In addition, Yaniv used a different estimation task, and although we found rather similar effects using two different estimation tasks, we cannot rule out, that the task Yaniv used leads to a different advice weighting function than those we observed in Experiment 1 to 3. We address these points in Experiments 4 and 5.
6 Experiment 4
In Experiments 1 to 3 we manipulated advice distance continuously in small steps of 5%. As we have outlined above, this fine-grained manipulation of advice distance is necessary when we want to properly analyze the shape of the relation of distance and the measures of advice utilization. In contrast, Yaniv (2004b) provided his subjects with advice that fell into one of three categories regarding the deviation of advice from people’s initial estimates. As mentioned above, the categories used were “near”, “intermediate” and “far”. Although advice varied to a certain amount within these categories, a categorical manipulation might have led subjects to differentiate more clearly between near, intermediate, and far advice than subjects in our study did. In other words, the difference between our findings and those of Yaniv might be due not only to the methodological problem associated with the categorization of the advice distance. Instead, it is possible that this categorization leads judges to perceive advice distance differently, resulting in a different advice weighting function. In Experiment 4 we address this possibility by comparing continuous and categorical manipulations of advice distance.
6.1 Method
6.1.1 Subjects
The data of 104 graduate and undergraduate students ( M= 21.32 years, SD= 2.59 years) were collected in Study 4. Sixty-eight (65%) of the respondents were female and 36 were male. As in Studies 1 to 3, subjects received either course credit or 6€ (approx. $8.50) for participation, and we again provided additional incentives in the form of movie theater vouchers worth 15 Euro ($ 21) for the top five performing individuals.
6.1.2 Design and procedure
Task content and trial structure of Experiment 4 were identical to Experiment 3, except that we added the mode of manipulating advice distance as a second independent variable (in addition to advisor competence). That is, the distance between the initial estimates and the received advice was either continuously altered as in our previous studies or it was varied within four categories regarding the distance to their initial estimates (near, intermediate, far, very far). The deviations in the continuous distance condition were slightly different from those applied in Experiment 3 to increase comparability of the two distance mode conditions in the statistical analysis. Continuous advice differed between ±5% and ±70% as well as +75% up to +140% from the respondents’ initial estimate, in steps of 5%. Each positive and negative deviation from 5% to 70% was applied once, and each (positive) deviation from 75% to 140% was run twice. The four levels of advice distance in the categorical condition were chosen to equal the mean deviation of a set of seven consecutive continuous distance categories: For example, the deviation in the “near” category was 20%, which is equivalent to the mean of the continuous deviations between 5% and 35%. Following this procedure, a total of four distance categories resulted: 20%, 55%, 90% and 125%, with 20% and 55% being applied as both positive and negative deviations to establish maximum comparability of the two modes of distance manipulation. Distances of ±20% and ±55% were run seven times and deviations of 90% and 125% were run fourteen times each. Subjects therefore had to work on 56 trials in one of the two distance mode conditions, and the alleged advice was, on average, equally far away in both conditions.
Also, as in Experiment 2, the order of advice deviations was fully randomized in Experiment 4 to avoid confounding the sequence of advice deviations with the mode of advice manipulation. We excluded 206 trials (3.5%) from the analyses as they triggered a failsafe mechanism similar to those used in Experiments 1 and 3.
6.2 Results and discussion
6.2.1 Advice weighting
We began the analysis by determining the model most appropriate to describe our data. We started with a basic model containing fixed effects of advisor expertise and distance mode, their interaction, the fixed effects of advice distance and its logarithm, random intercepts, and random slopes for advice distance and its logarithm. A more complex model that also contained the two-way cross-level interactions did not provide a better fit to the data, χ2 (4) = 0.293, p = .864. Neither did the full model which also contained the three-way cross-level interactions, χ2 (6) = 0.592, p = .997. We therefore report the parameter estimates for the basic model (Table 4).
Note. The intercept indicates the expected level of the dependent variable (or its log-odds in the case of ignoring advice) for an advice distance of zero when faced with an advisor low in expertise and working in the categorical distance mode.
* p < .05
** p < .01
** p < .001
In line with the findings of Experiments 1 to 3, there was both a negative effect of linear and a positive effect of logarithmic advice distance on advice weighting. Not surprisingly, advice from the allegedly competent advisor was weighted more strongly than that of the less competent advisor. Finally, neither the main effect of distance mode nor its interaction with advisor expertise were significant. Hence, the distance effects on advice weighting did not depend on the mode of distance manipulation. In line with the results of Experiment 3, whether advice was provided by an allegedly competent or less competent source, the relationship between advice distance and advice taking was, once more, characterized by a strong increase in advice taking followed by a slow decline (see also Figure 6). These results suggest that the discrepancy between our findings and those of Yaniv (2004b) are unlikely to be the result of subjects perceiving advice distance differently based on the way it was operationalized.
Advice weighting, absolute opinion shift, frequency of ignoring advice, and confidence shifts as a function of advice distance in Experiment 4 by distance mode (continuous vs. categorical). White and black dots represent the observed mean values for the competent and less competent advisor condition, respectively. The dotted and regular bold black lines represent the model predictions for the competent and less competent advisor, respectively. Light gray lines represent the corresponding fitted data of the individual subjects based on the model’s random effects.
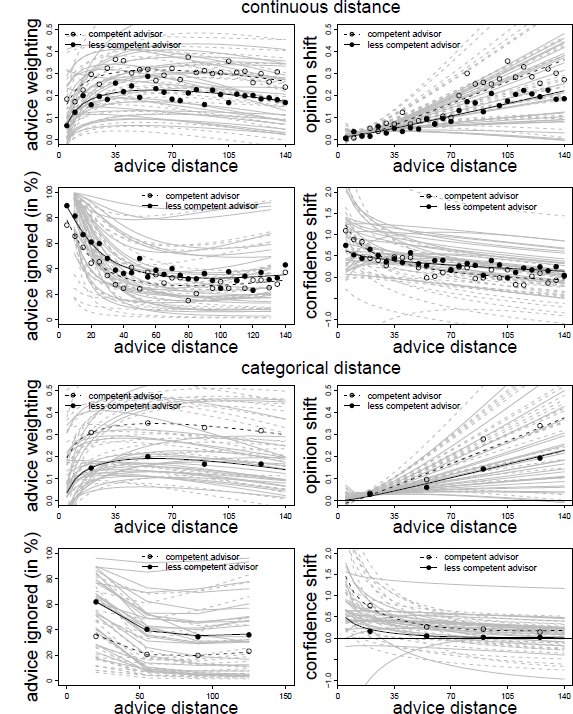
6.2.2 Absolute opinion change
As with the AT scores, we first identified the model that best described our data. The basic model contained the between-subject variables, their interaction, advice distance, random intercept, and random slopes for advice distance. Adding the two-way cross-level interactions led to a significant increase in model fit, χ2(2) = 11.301, p = .004, but adding the three-way interaction did not further improve it, χ2(1) = 0.644, p = .422. As in the previous Experiments, we also tested whether model fit increased when we added non-linear terms and the corresponding random slopes to the model. Model fit increased both when adding the logarithm of advice taking and squared advice distance, χ2(4) = 15.481, p = .004, and χ2(4) = 11.149, p = .025, respectively (adding interactions of the between-subject variables and the non-linear terms did not improve the model further, both p < .16). Since the increase in model fit was greater for the model containing the logarithm of advice distance, we adopted it as the best-fitting model.
As can be seen from Table 4, the results are similar to those of Experiment 3, that is, absolute opinion shifts were significantly related to advice distance, and the increase was stronger for the competent advisor, as indicated by a significant interaction of advisor expertise and advice distance. The logarithm of advice distance was far from significant, and accordingly, the curvature of the relation of advice distance and absolute opinion shift is negligible (Figure 6). Distance mode or any of its interactions with the other variables had no effects on absolute opinion shifts, suggesting that the operationalization of advice distance is unlikely to influence the way subjects process and react to advice distance when revising their estimates.
6.2.3 Frequency of ignoring advice
Following the logic of the previous analyses, we first identified the best-fitting model. The basic model was similar to that of the AT scores, containing all fixed and random effects with the exception of the two-way cross-level interactions and the three-way interactions. A model containing these two-way interactions did not provide a better fit to the data, and neither did the full model, χ2(2) = 0.790, p = .674, and χ2(6) = 4.672, p = .587. Hence, we report the parameter estimates of the basic model in Table 4. The results closely resemble those of Experiment 3. The frequency of ignoring advice was positively related to advice distance and negatively to its logarithm, leading to the familiar pattern of high proportions of zero adjustment for advice closest to the initial opinions and a sharp decline thereafter. In addition, there was a negative effect of advisor expertise, indicating that advice from the competent advisor was ignored less often. Distance mode and its interaction with advisor expertise had no significant effect on whether judges retained their initial estimates. Combined with the finding that adding further interactions containing distance mode did not improve the model fit, we can conclude that the way advice distance is operationalized does not affect judges’ decision whether to adjust their initial opinions in the light of advice.
6.2.4 Confidence shifts
We determined the best-fitting model, starting with a model similar to the basic model for the AT scores. Adding the two-way cross-level interactions provided a significantly better fit, χ2(4) = 21.689, p < .001, but further adding the three-way cross-level interactions did not, χ2(2) = 2.244, p = .326. Hence, the best-fitting model contained all effects with the exception of the three-way interactions, indicating that the effect of advice distance on confidence shifts was in some way dependent on the between-subject. As can be derived from Table 4, confidence gains were higher when the advisor was allegedly competent. In addition, there was an interaction of advisor and distance mode on confidence shifts. The only significant effect of advice distance was an interaction of the logarithmic distance term and the advisor.
In order to further investigate this interaction, we analyzed confidence shifts separately for the competent and less competent advisor. The respective multi-level models contained all the effects of the best-fitting model for the confidence shifts save those including advisor expertise. For the competent advisor, we obtained the familiar pattern of results. Confidence shifts were negatively related to logarithmic advice distance, B = −0.6532 ( SE = 0.1643), t(2745) = −3.977, p < .001. There was also a significant positive effect of the linear advice distance term, B = 0.0057 ( SE = 0.0027), t(2745) = 2.086, p = .037. Neither distance mode nor any of the interactions were statistically significant, all | t|s < 1.266, all ps > .206.
For the less competent advisor, the linear and logarithmic effects of advice distance were considerably smaller and failed to reach statistical significance. In fact, none of the model variables were significantly related to confidence shifts in the less competent advisor condition, all | t|s < 1.078, all ps > .281. This is most likely the result of a floor effect. When paired with the less competent advisor, judges’ confidence gains were rather small to begin with. Therefore, there was considerably less room for further decreases than in the competent advisor condition. However, descriptively, the shape of the relation of advice distance and confidence shifts was similar in both advisor conditions.
The results for confidence shifts in Experiment 4 are, thus, largely similar to those in Experiment 3. At least for competent advisors, subjects felt more confident in their final estimate when the advice was closer to their initial estimates, and the data were best described by a negative logarithmic trend (Figure 6).
6.3 Discussion
The results of Experiment 4 replicate those of the previous experiments. They also rule out the possibility that our findings differ from those of Yaniv (2004b) because manipulating advice distance in categories rather than as a continuum leads to qualitatively different weighting functions. In fact, regardless of whether we presented advice in a fine-grained continuous manner or in distinct categories, we found the same pattern for all four dependent variables. In addition, the results of Experiment 4 favor the SRM over SJT when describing absolute opinion shifts as a function of advice distance since we did not observe any inclination of reduced opinion shifts in the far regions of advice distance.
7 Experiment 5
So far, the results of Experiments 1 to 4 suggest that the relationship between advice distance and advice weighting is more complex that previously assumed. Although we already ruled out that the discrepancies between the results of our experiments and those by Yaniv (2004b) were due to judges processing distinct advice distance categories in a qualitatively manner, there are further methodological differences that might cause these differences. For example, Yaniv (2004b) used a different estimation task, namely estimating the dates of recent historic events. This estimation task differs from the ones we used in two ways: first, unlike with distances or caloric estimates, there is no natural zero; second, subjects may have been less likely to round their answers than in the tasks we previously used. Additionally, in the Yaniv study, subjects received advice from several different advisors, whereas in our study the advice was allegedly provided by the same advisor on all trials. Finally, Yaniv used a different incentive structure. Subjects in his study were rewarded on the basis of their own performance, irrespective of the performance of other subjects. In order to test whether any of these differences might results in a different shape of the relation of advice distance and advice weighting, we replicated Experiment 1 with a methodology closely resembling that of the original Yaniv study.
7.1 Method
7.1.1 Subjects
The data of 45 graduate and undergraduate students were gathered in Experiment 5. We did not collect demographic information on subjects in Experiment 5. Subjects received a show-up fee of 3 Euro and could earn up to 6 additional Euro based on their performance on the judgment task. On average, subjects received a bonus of 2.96 Euro ( SD = 0.54 Euro).
7.1.2 Design and procedure
Experiment 5 was similar to the previous experiments with regards to the trial structure, which followed the standard JAS. However, the experiment differed from the previous ones as follows. First, we chose a judgment task similar to the one used by Yaniv (2004b). Subjects were instructed to estimate the year of occurrence for a set of 60 historic events. All of these events were part of the recent history of Germany starting with the year 1800. Example events are the year in which Munich celebrated the first Oktoberfest or the year in which physicist Ferdinand Braun made electric currents visible for the first time. Subjects’ input for the initial and final estimates was restricted to numbers ranging from 1800 to 2013 in order to prevent erroneous estimates.
The second difference was the way we operationalized advice distance. As in Experiments 1 and 2, we manipulated advice distance only as a within-subjects factor. This time, however, we did not manipulate advice as percent deviations from the initial estimates. Because for historic dates there is no natural zero, percent deviations are likely to confound the year of occurrence and perceived advice distance. The reason for this is that, in the case of historic events, percent deviations would produce smaller deviations for events that lie further in the past despite such events usually being more difficult to estimate. Hence, prior to programming Experiment 5, we asked 30 subjects from the same population to work on a pretest in which they estimated all 60 historic events once individually. Based on the pretest data, we calculated the mean absolute deviation in years for each event. This value served as a baseline to calculate the deviations in Experiment 5 and accounted for variations in task difficulty. We manipulated advice distance by multiplying the baseline distance by values ranging from ±0.05 to ±1.50 and rounded the resulting value. The resulting deviation was then added to subjects’ initial estimate. Advice distance was truncated to a minimum of ±2 years. This prevented advice from being identical to judges’ initial estimates and allowed judges to apply the most common weighting strategies, namely choosing between the two estimates and averaging them (Reference Soll and LarrickSoll & Larrick, 2009). In cases in which advice would have assumed values greater than 2013 or smaller than 1800, we reversed the sign of the deviation in order to maintain credibility of the advice. Note that this manipulation of advice distance, combined with the limitation of subjects’ estimates, made other failsafe mechanisms obsolete. Accordingly, there was no need to exclude any of the trials in Experiment 5 from the analyses.
Third, subjects were informed that they would receive advice from different advisors. Each advisor was indicated by a different number (e.g., #16), and it was stressed that the number was not related to the ability of the advisor, but rather served to maintain the advisors’ anonymity. That is, other than in the previous experiments, subjects had no information about the alleged expertise of their advisors. While the order of the historic events was fixed for all subjects, the number of the advisor and the advice distance were fully randomized. Finally, we changed the incentive structure, adopting a mode of payment similar to that used by Yaniv (2004b). For each estimate that was above average in accuracy, subjects received 10 cents. Average performance was assessed by averaging the absolute deviation of the 30 pretest subjects.
7.2 Results and Discussion
7.2.1 Advice weighting
As in the previous experiments, advice weighting was characterized by a positive effect of the logarithm of advice distance and a negative linear trend (see Table 5). As can be seen from Figure 7 (upper left panel), we obtained the same pattern as in the previous experiments despite changing the estimation task, the incentive structure, and providing advice from different advisors. These results show that the curvilinear relation of advice distance and advice weighting is not specific to the methodology we used in the first four experiments. Furthermore, they suggest that Yaniv (2004b) did not find the curvilinear relation because of the categorization of advice distance and not because any of the methodological differences between his experiments and our Experiments 1 to 4 changed the nature of the relation of advice distance and advice weighting.
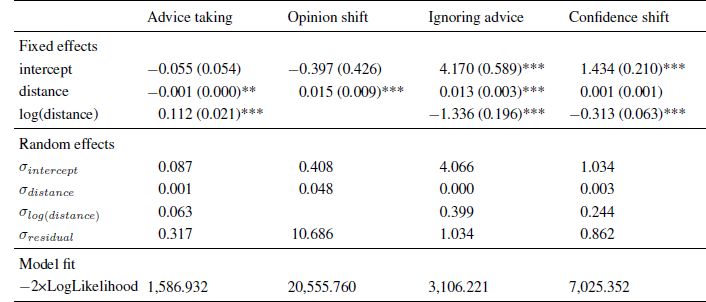
Note. The intercept indicates the expected level of advice taking or confidence shifts for an advice distance of zero.
* p < .05
** p < .01
*** p < .001
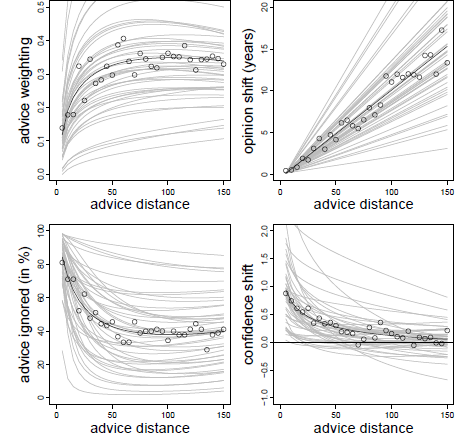
Advice weighting (upper left panel), absolute opinion shift (upper right panel), frequency of ignoring advice (lower left panel), and confidence shifts (lower right panel) as a function of advice distance in Experiment 2. White dots represent the observed mean values. The bold black line represents the model predictions. Light gray lines represent the fitted data of the individual subjects based on the model’s random effects.
7.2.2 Absolute opinion change
Due to the way we operationalized advice distance in Experiment 5, and because estimates of historic dates do not have a natural zero, measuring opinion shifts as percent changes of the initial estimate makes little sense. However, since we investigated only historic events from the recent past, all subjects were equally well-aware of the proper upper and lower bounds of the target values. Thus, the variance of subjects’ estimates was constrained by the task itself, allowing us to treat absolute opinion change in years as the dependent variable. As in the previous experiments and consistent with an SRM, absolute opinion shift increased as a linear function of advice distance (Table 6 and Figure 8, upper right panel). Adding the logarithmic or the squared distance term and their corresponding random slopes did not improve the model, χ2(4) = 1.556, p = .817, and χ2(4) = 6.430, p = .169, respectively. Apparently, our findings regarding absolute opinion shifts hold when using a methodology and judgment task similar to Yaniv’s (2004b).
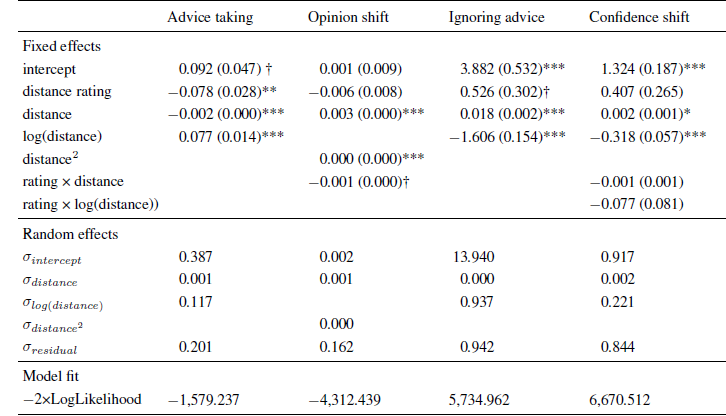
Note. The intercept indicates the expected level of advice taking or confidence shifts for an advice distance of zero in the condition without distance rating.
† p < .10
* p < .05
** p < .01
*** p < .001.
Advice weighting (upper left panel), absolute opinion shift (upper right panel), frequency of ignoring advice (lower left panel), and confidence shifts (lower right panel) as a function of advice distance in Experiment 3. White and black dots represent the observed mean values for the distance rating and no rating condition, respectively. The dotted and regular bold black lines represent the model predictions for the rating and no rating condition, respectively. Light gray lines represent the corresponding fitted data of the individual subjects based on the model’s random effects.
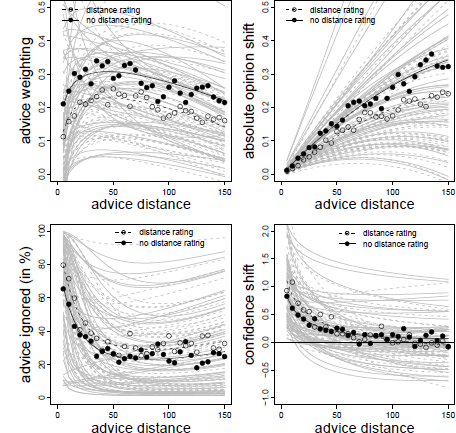
7.2.3 Frequency of ignoring advice
As in the previous Experiments, we found that the frequency of ignoring advice was positively related to advice distance and negatively to its logarithm (see Table 5). Consistent with the notion of ROPEs, subjects ignored advice most frequently (about 80% of the time) when it was closest to their initial opinions. With increasing advice distance, this frequency declined rapidly until it stabilized at a level of around 40% (see Figure 7, lower left panel).
7.2.4 Confidence shifts
As Table 7 shows, there was a significant negative effect of the logarithm of advice distance, while the linear effect was not significant. This pattern is in line with the previous experiments and lends support to the idea of near advice being utilized as a form of social validation (Figure 7, lower right panel). Consistent with the analyses of the other dependent variables, the results suggest that our findings are stable across different estimation tasks and operationalizations of advice distance.
7.3 Discussion
In sum, the data of Experiment 5 further speak to the generalizability of our findings. The relation of advice distance to our four dependent variables was similar to that of the previous experiments despite using a different judgment task, operationalizing advice distance in a different fashion, and pairing subjects with allegedly different advisors on each trial. Furthermore, Experiment 5 rules out the last methodological differences between our study and that of Yaniv (2004b) as potential explanation for the different findings.
8 Experiment 6
In a previous version of the manuscript, Experiment 6 was designed to test a potential mediator of the relation of advice distance and advice weighting, namely perceived distance of the advice. During the revision of the manuscript this mediation test became obsolete. However, since we committed to reporting all data and because Experiment 6 had a much larger sample size than Experiments 1 to 4, we report it as more powerful replication.
8.1 Method
8.1.1 Subjects
The data of 98 graduate and undergraduate students were gathered in Experiment 6. We did not collect demographic information on subjects in Experiment 6. Subjects received a show-up fee of 3 Euro and could earn up to another 6 Euro based on their performance on the judgment task. On average, subjects received a bonus of 1.14 Euro ( SD = 0.58 Euro).
8.1.2 Design and procedure
Subjects in Experiment 6 worked on the calorie estimation task used in Experiment 2. Experiment 6 was largely identical to Experiments 1 and 2, except that we added an advice similarity rating as a between-subjects factor. Half of the subjects rated how similar they felt the advice was to their initial estimate prior to making their final estimate whereas the others did not. The other half of the subjects did not rate the similarity of the advice.Footnote 6
As in Experiment 3, advice distance in the main trials, ranged from 5% to 150%. We applied each distance ranging from ±5% to ±75% in 5%-increments once, and each distance from 85% to 150%, also in steps of 5%, twice. Advice distance was truncated at the lower end so that advice differed by at least two calories, thus preventing advice from being identical to the initial estimates while allowing for choosing and averaging. In order to maintain credibility of the advice, we again included a failsafe mechanism. Whenever the advice would have assumed values smaller than 10 or larger than 3000 calories, the computer instead randomly generated a caloric estimate between 20 and 900 calories. The 76 trials in which this failsafe mechanism was activated (1.3%) were excluded from the analysis. As in Experiment 5, subjects received advice from different advisors, and they did not receive any information about the expertise of their advisors. Finally, subjects were paid a bonus based on their performance. For every estimate that was within 20% of the true value, subjects received another 10 Cents.
8.2 Results
8.2.1 Advice weighting
We first compared a model containing similarity ratings, advice distance and its logarithm as fixed effects as well as random intercepts and random slopes for the two distance components. Adding the cross-level interactions of the distance terms and similarity rating did not improve the model fit, χ2(2) = 0.771, p = .680, indicating that the distance effects were in no way moderated by the similarity ratings. Hence, we report the parameter estimates for the basic model (Table 66). In line with the previous Experiments, the model contained the familiar combination of a negative linear and positive logarithmic effect on advice weighting. There was also a main effect of the similarity rating, indicating that subjects in the rating condition tended to weight advice less by about 8 percentage points. However, the shape of the relation was identical, regardless of whether subjects rated the similarity of advice or not (Figure 8, upper left panel).
8.2.2 Absolute opinion change
We first determined the best-fitting model. The basic model included the fixed effects of similarity rating and advice distance as well as random intercepts and random slopes for advice distance. Adding the interaction of similarity ratings and advice distance did not improve the fit of the model significantly, χ2(1) = 3.123, p = .077. However, since the Likelihood-Ratio was close to statistical significance and indicated that similarity rating possibly affected the relation of advice distance and opinion shifts, we preferred the model containing the interaction term. As in the previous experiments, we next tested whether adding non-linear terms and their respective random slopes further increased model fit. Both adding the logarithmic and the squared advice distance term improved the model significantly, χ2(4) = 35.440, p < .001, and χ2(4) = 42.152, p < .001, respectively. Adding the interaction of the non-linear term and distance rating had virtually no impact on the models’ fit, both p > .90. Based on the models’ likelihood, we adopted the model containing not only the linear but also a quadratic effect of advice distance as the best-fitting model.
Table 6 shows that opinion shifts again increased as a linear function of advice distance. The interaction of similarity ratings and advice distance was not statistically significant, but it suggested that opinion shifts of subjects who had rated advice similarity increased at a somewhat slower pace. This effect corresponds to the somewhat lower weights of advice among subjects who rated he similarity of advice observed in the analysis of the AT scores. In addition, there was a notable curvature in the data, but although the model contained the quadratic term of advice distance, visual inspection of the resulting curve is more indicative of a negatively accelerating increase in opinion shifts than of a reverse in the trend for far advice (Figure 8, upper right panel). Thus, the data once again seem more in line with an SRM than with SJT.
8.2.3 Frequency of ignoring advice
We obtained the familiar pattern for the frequency of ignoring advice, namely a positive effect of advice distance and a negative effect of its logarithm (see Table 6). Adding the interaction of the advice distance components and distance rating had no significant effect on model fit, χ2(2) = 3.262, p = .196. We find the familiar pattern with the highest proportion of ignored advice for advice closest to the initial opinions, rapid declines in the frequency of ignoring advice, and stabilization at a level of 30–40% once advice was moderately far away (see Figure 8, lower left panel). In line with the finding that judges weighted advice somewhat less in the distance rating condition, the proportion of ignored advice was slightly, but not significantly, higher when judges rated the similarity of the advice.
8.2.4 Confidence shifts
We first compared the model fit of a basic model that lacked the cross-level interactions with the full model which contained them. Adding the cross-level interactions of advice distance and its logarithm, on one hand, and similarity ratings, on the other, significantly improved model fit, χ2(2) = 5.994, p = .049. We therefore report the parameter estimates for the full model (see Table 6).
In line with the previous experiments, there was a negative effect of logarithmic advice distance. This time, there was also a small positive linear effect of advice distance, but this effect did not produce a pattern that was qualitatively different from those obtained in the previous experiments (Figure 8, lower right panel). Similarity ratings had no effect on confidence shifts. Despite the increased model fit of the full model over the basic model, neither the interaction of the similarity ratings and advice distance nor that of the similarity ratings and logarithmic advice distance reached statistical significance. This suggests that the relation of advice distance and confidence shifts was independent of the similarity ratings.
8.3 Discussion
Experiment 6 once again replicates the curvilinear relation of advice distance and advice weighting. The same is true for the frequency of ignoring advice and confidence shifts, that is, Experiment 6 also supports the idea of ROPEs as well as the validating effect of near advice. The results regarding absolute opinion shifts are also in line with the previous experiments in that they are more suggestive of an SRM than of SJT when it comes to describing opinion shifts. The notable difference is that, this time, we observed a non-linear relation of advice distance and absolute opinion shift. However, despite the significant quadratic effect of advice distance on opinion shift, we did not find evidence of an actual decrease in opinion shift for advice very far from the initial estimates. Thus the data are in line with the idea of an SRM with diminishing sensitivity. The fact that we found the non-linear pattern in Experiment 6 but not—or at least not statistically significant—in the remaining experiments might be due to the greater sample size and, therefore, greater test power of Experiment 6.
9 Additional meta-analysis
We conclude our results section by reporting an analysis that we based on the combined data of our six experiments. It addresses the inversely U-shaped relation of advice distance and advice weighting. The combination of a positive logarithmic and a negative linear effect, as observed in all six experiments, is in line with such an inverse U-shape. However, graphical inspection of our data suggests that the increase in advice taking in the near regions is much more pronounced than the decrease in the far regions. One way to test for actual curvilinearity is to divide the data at the maximum of the predicted curve and to test for linear effects in both sub-datasets. Following this idea, we first combined the data of all six experiments. Since the relation of advice distance and advice weighting was qualitatively similar in the various experimental conditions between-subjects, we collapsed across all between-subject variables. We then predicted AT scores from advice distance and its logarithm and included random intercepts and slopes for subjects nested within experiments. We found the familiar pattern, that is, a non-significant intercept, B 0 = −0.013 ( SE = 0.025), t(19302) = −0.527, p = .599, a negative linear trend, B 1 = −0.002 ( SE = 0.000), t(19302) = −8.690, p < .001, and a positive effect of the logarithm of advice distance, B 2 = 0.101, ( SE = 0.008), t(19302) = 11.979, p < .001.
We then determined the maximum of the predicted function, which is defined as −( B 2/ B 1) for a model containing both a linear and logarithmic term. For our data, the predicted curve was maximal at an advice distance of 63.84%. Accordingly, we split our data so that one subset consisted only of trials with advice distances between 5% and 60% while the second data set contained all trials with distances ranging from 65% to 150%. We then tested for linear effects of advice distance in both data sets. Both models contained random slopes for subjects nested within experiments. The analysis of the subset with the lower advice distances revealed a strong positive linear effect of advice distance, B = 0.002 ( SE = 0.000), t(9202) = 6.636, p < .001. In case of the subset with the far advice, there was a negative linear effect of advice distance, but this effect was not statistically significant, B = −0.000 ( SE = 0.000), t(19302) = −1.534, p = .125. We ran similar analyses, separately for all six experiments and found a positive linear effect of advice distance for advice left of the predicted maximum in all six cases, all p < .001. The pattern was mixed with regards to advice distance to the right of the predicted maximum, though. Whereas the descriptive effects of advice distance were all negative, this downward trend was much less pronounced than the upward trend observed in the near advice subsets. It was significant only in Experiments 1, 2, and 6 ( p = .019, p = .014, and p < .001, respectively), but not in Experiments 3, 4 and 5, ( p = .281, p = .052, and p = .594, respectively). In sum, we find consistent evidence of the lower weights placed on advice near the initial estimates. Descriptively, our analyses are also consistent with previous research in that judges had a tendency to weight advice less when it was far away from the initial estimates.
10 General discussion
In six experiments, we investigated how the distance between judges’ initial estimates and received advice influences advice utilization. Going beyond previous research, we found that advice is not only weighted to a lesser degree when it is very far from judges’ initial opinions, but also when it is very close to them. In all six experiments, we found a curvilinear relation of advice distance and advice weighting characterized by a linear downwards trend as well as a logarithmic effect of advice distance. As our analysis of the combined data revealed, the increase in advice weighting between very near and moderately far advice is reliable, and we can—at least descriptively—replicate the decrease in advice weighting as advice moves further from the initial estimates.
We further found that the low weights of near advice were not simply the result of judges weighting near advice less but—most likely—because they retained their initial opinions more often and weighted the advice by exactly zero. Both the strongly increased frequency of judges ignoring advice when it was near the initial opinion and the fact that this effect diminished rapidly, are consistent with the idea of ROPEs. That is, judges quite possibly noted that the advice was numerically different from their initial estimates, but they considered the difference to be negligible or irrelevant, rending the advice practically equivalent to their initial estimates and making adjustments towards it obsolete.
We also investigated absolute rather than relative opinion change in order to be able to differentiate between social judgment theory (SJT), on the one hand, and stimulus-response model (SRM), on the other. The data, so far, favor an SRM over SJT because absolute opinion shifts did, on average, increase in a monotone fashion as advice distance increased. We did find evidence of an additional nonlinear effect of advice distance on absolute opinion shift in some of our Experiments, but the effects were not particularly strong, and they did not lead to an actual decrease in opinion shifts for far advice in any of our experiments. Of course, while an SRM seems an appropriate description of our data, we cannot rule out the possibility that we would have observed such a decrease if we had expanded the range of advice distance even further. Our findings regarding absolute opinion shifts are quite striking for another reason, however, namely because they show that our understanding of how we revise our opinions in the light of advice depends strongly on the measures of advice taking we apply. Whereas the commonly used relative measures such as the percent weight of advice suggest that advice is utilized less when it is either very close to or far away from the initial opinion, absolute opinion shifts tell a somewhat different story. Here, receiving advice always results in more opinion change the further the advice is away from the initial opinion. This dissociation may lead us to think that far advice had less impact on our judgments than moderately distant advice because it received less weight, even if we revised our initial judgments more strongly in the former than in the latter case.
Finally, near advice led to stronger increases in judges’ confidence regarding the accuracy of their initial judgments, supporting the idea that near advice is not actually disregarded even if judges do not adjust their estimates towards it. Instead, its utilization is reflected in the way judges’ confidence increases (Reference Gino and MooreGino and Moore, 2007). When predicting confidence gains we found a negative logarithmic effect. The considerable increase in confidence when advice was near the initial estimate indicated that judges felt particularly validated by such advice. The further the advice was the less judges’ confidence increased, and once advice distance surpassed a certain distance, judges’ confidence no longer changed at all. This findings is also consistent with Budescu’s (2006) model of confidence in aggregated judgments which suggests that confidence increases as variance (or distance, for that matter) decreases.
10.1 Implications for theory and practice
One important implication of our findings concerns the theoretical basis of distance effects in advice taking. Our study is the first to operationalize both advice distance and opinion change in a way that actually allows testing the assumptions different theoretical frameworks make about the shape of the relation of the two variables. As stated above, we found that a simple SRM was more in line with our data than SJT. On average, absolute opinion change was roughly proportional to advice distance with the exception of Experiment 6 which showed signs of diminishing sensitivity, and the main reason for the strongly reduced weight placed on near advice was that judges more frequently choose to retain their initial estimates when receiving such advice. In addition, we found that advice from competent advisors led to stronger absolute opinion shift, but also to a greater likelihood of adjusting towards the advice at all. This raises a rather interesting possibility, namely that variables affecting advice weighting might do so in two qualitatively ways. For example one variable could increase the absolute adjustments towards the advice while the frequency of adjustments remains constant. Another variable could work in the exact opposite way, that is, while the magnitude of adjustments remains constant, the variable affects the frequency of adjustment. Of, course, a combination of the two effects is also possible. Considering these two qualitatively different ways moderating variables can affect belief revision in the light of advice, it seems necessary to develop theoretical frameworks that make more precise statements regarding the effects of certain variables on advice utilization. As our data suggest, a simple SRM might be a useful starting point for this endeavor.
Second, advice can be utilized in two different ways, namely in the form of adjustment of one’s judgment towards the advice, on the one hand, and adjustments of one’s confidence in the correctness of one’s opinion, on the other. Previous research has investigated both advice weighting and confidence shifts in the JAS (see Reference Bonaccio and DalalBonaccio & Dalal, 2006), but apart from a few exceptions such as recent studies by Yaniv et al. (2009) or Reference Minson and MuellerMinson and Mueller (2012), those variables were investigated separately (i.e., researchers tested one or the other). Our results show that advice weighting does not fully reflect advice utilization. Instead, the perceived similarity of initial estimates and advice seems to have an informational value of its own, and usage of this information is reflected in confidence shifts as well. Hence, we would like to encourage researchers to measure both advice weighting and confidence shifts when studying advice taking in order to provide a more complete picture of how judges utilize advice.
Interestingly, the neglect of confidence shifts as a complementary way to utilize advice implies that previous studies on advice weighting may have underestimated the degree to which judges utilize advice. For example, judges often fail to weight advice as much as they should according to its objective quality (Reference Bonaccio and DalalBonaccio & Dalal, 2006; Yaniv, 2004a, 2004b). However, if the degree to which judges utilized advice as a source of social validation, which would be reflected in increased confidence, was taken into account, the tendency to discount advice might in fact be smaller than previously assumed.
This leads to another question, namely whether the fact that judges place less weight on near advice has notable consequences for judgmental accuracy. Arguably, the closer advice is to the initial estimate, the lower the potential gains in accuracy of the optimal weighting strategy are. In this vein, the increased likelihood of judges ignoring near advice led to a notable decrease in relative opinion change, that is, advice weighting, but its effect on absolute opinion change was not very pronounced because absolute adjustments in the light of near advice were low, in the first place. In some cases, such as the distance estimates we used in some of our experiments, the forgone accuracy gains due to underweighting near advice may be negligible. In others, such as financial forecasts or judgments regarding the medical treatment of patients (i.e., dosage of medication), even small absolute adjustments to one’s opinion and, as a consequence, small increments in judgmental accuracy, may lead to significant differences in the quality of the outcomes. Hence, whether the reduced weight of advice is a threat to judgmental accuracy strongly depends on the respective judgment task.
Finally, the observed results concerning both adjustments of the initial estimates and validation of the judges’ initial estimate seem largely independent of the advisor’s perceived expertise. That is, in general, people seem to rely on the information about the advisor’s competence and consequently apply or show a fundamental level or amount of advice weighting and confidence shift, respectively. On closer examination, however, they do not weight all pieces of advice to the same extent, nor are they equally likely to be ignored, nor do they cause the same confidence shift. Our measures of advice utilization are all dependent on the distance of the advice from people’s initial judgment, which results in different likelihoods, magnitudes of adjustment, and confidence shifts for varying advice deviations. Thus, it is plausible that judges in our experiments (and perhaps also in general) might have used the distance between their own initial estimate and the received advice as an additional source of information about advice quality in order to differentiate between good and bad advice provided by their advisor. Previous research has shown that judges do not assign fixed weights to an advisor when they receive advice from the same source on more than one occasion, but that the de facto weights vary between 0% and 100%, most likely in an attempt to maximize the accuracy of the final estimates (Reference Soll and LarrickSoll & Larrick, 2009; Reference Soll and MannesSoll & Mannes, 2011). Variations in advice distance may be one of the factors underlying the substantial variability in judges’ weighting of advice. To clarify whether the distance affects perceived quality of the advice, future studies should also measure people’s perceptions of plausibility and/or quality of the advice offered.
10.2 Limitations and directions for future research
Our study is, of course, not without limitations. First, our tasks—estimating distances, calories, and historic dates—only cover a relatively small fraction of everyday knowledge. Although we are confident that our results generalize across a wider range of judgment tasks, we cannot rule out that the identified relations between advice distance and our different measures of advice utilization are contingent on special characteristics of such almanac questions. Therefore, one objective of future research is to test whether our results generalize to more ecologically valid judgment tasks such as financial forecasts or climate prognoses.
Second, so far our work is descriptive in nature, that is, it does not allow conclusions about the normative character of advice utilization as a function of advice distance. The reason for this is that we did not use real advice (e.g., by providing subjects with the estimates of other subjects) but rather generated the advice as pre-defined relative deviations from the judges’ initial estimates. While this allowed us to gain full experimental control over the manipulation of advice distance and to make the stimulus material fully comparable between the various experimental conditions, it prevents us from drawing conclusions about the appropriateness of judges’ advice weighting strategies as well as their confidence shifts when receiving near vs. far advice. For example, increases in confidence due to near advice are justified only if consensus implies correctness, that is, if judge and advisor provide independent estimates and their respective individual biases are low.
A critical test of the appropriateness of confidence shifts requires a new set of experiments. Our results provide a basis for designing such future investigations. For example, future studies could address the normative character of the observed distance effects by providing judges with real advice that varies sufficiently in its distance from initial estimates (as done by Minson et al., 2011). This would allow quantifying losses in accuracy compared to a rational benchmark, and it could enable claims about the degree of overconfidence as a function of advice distance. As we have outlined above, this is unlikely to work if the study does not sufficiently cover low advice distances or if it treats advice distance as a categorical rather than a continuous variable, as was the case in Yaniv’s (2004b) study. Interestingly however, the study by Minson et al. (2011) seems to fulfill the requirements we postulate. Reanalyzing their data with the log-linear model we employed and then linking the weights placed on advice to both, judgmental accuracy and confidence shifts might be an easy and elegant way to test whether or to what extent distance effects on advice utilization violate normativity.
Third, similar to the majority of studies on advice-taking in the judge-advisor-paradigm so far, we used a non-interactive setting for the measurement of advice weighting and confidence shifts. Although this allows for close comparability with the findings of previous studies, it might limit the generalizability of findings obtained in this setting to those real-world advice-taking and advice-giving situations that do not involve social interaction between the judge and the advisor. With regard to our research question, it remains to be seen whether the same distance effects occur if the advisor has the opportunity to interact with the judge and can, for example, provide the reasoning behind an estimate that is quite far from the judge’s initial estimate. In such a situation, the plausibility of the judge’s explanation for her or his advice might become a more important indication of advice quality than advice distance and, subsequently, of the weight that should be assigned to the advice. Thus, transferring the investigation of distance effects to real social interaction (either with real subjects or with confederates in the role of the advisor) would be a logical next step to extend the findings presented here.
10.3 Conclusion
Overall, our results stress the importance of taking into account both judges’ adjustment towards advice as well as changes in their confidence when investigating advice utilization. By doing so, we can obtain a more thorough—and more complete—understanding of advice utilization. In essence, our data show that judges do, in fact, utilize advice even if they do not adjust towards it, which is reflected in increased confidence after receiving validating advice. Taking this into account, we have shown how both measures of belief adjustment and confidence depend on the distance between judges’ initial opinions and the advice they received. We feel that these findings add to our knowledge concerning how and why we utilize advice. We are confident that they provide good grounds for further investigations, especially if the duality of advice utilization is taken into account.


 Open access