

Identifying the sources of behavioral variation has long been the predominant goal of the social sciences, including economics. Why do some people take risks with their investments while others act more cautiously? Why do some contribute to charities while others do not? Why do some people vote while others do not? Here we introduce our study, the Genetic and Environmental Foundations of Political and Economic Behaviors: A Panel Study of Twins and Families (PIs Alford, Hatemi, Hibbing, Martin, and Smith), which has the aim of seeking explanations for the broad variation in human economic, social, and political behaviors. The scope of our study includes identifying the psychological mechanisms that operate on these traits, the heritability of complex political and economic traits under varying conditions, and the specific genetic correlates of attitudes and behaviors.
Some of the most dangerous features of human social dynamics attach to politics and economics. Wars are not fought over whether it is better to be an introvert or an extravert but rather over preferences for the best way to structure, organize, and conduct large-scale group life and share resources. Variations across individuals in these beliefs create volatility because disagreements both inside or outside the group can and often do result in hostility. Violence aside, all peaceful political and economic choices, both domestic and international, are permeated by critical unexplained variation. Understanding the complexity of human social dynamics cannot be accomplished without the inclusion of genetic influences. Variation in such behavior, however, is still predominantly attributed to environmental sources by much of the social sciences –– the remnants of parental socialization, particular formative events, educational experiences, and cultural norms to name a few. Behavioral genetic studies, however, have provided convincing evidence that the majority of economic, political, and social behavior is at least partially genetically influenced (for a review, see Hatemi & McDermott, Reference Hatemi and McDermott2012). An extensive literature outside behavioral genetics also suggests that human behavior has biological and heritable foundations. For example, studies in neuroeconomics and political science have identified specific brain regions and neuromodulators associated with choice (Camerer et al., Reference Camerer, Loewenstein and Prelec2005; Fowler & Schreiber, Reference Fowler and Schreiber2008; Schreiber et al., Reference Schreiber, Fonzo, Simmons, Dawes, Flagan, Fowler and Paulus2013; Zak & Fakhar, Reference Zak and Fakhar2006). Indeed, evolutionary psychology has built a considerable empirical literature suggesting that economic, political, and social behavior is rooted in psychological modules shaped under selection pressures (Cosmides & Tooby, Reference Cosmides and Tooby1997; Hoffman et al., Reference Hoffman, McCabe and Smith1998). Behaviors that traditional rational choice frameworks have difficulty explaining –– for example, widespread cooperation and conditional altruism –– fit comfortably within evolutionary frameworks of this sort (Boyd et al., Reference Boyd, Gintis, Bowles and Richerson2003; Fehr & Gächter, Reference Fehr and Gächter2000; Hatemi & McDermott, Reference Hatemi, McDermott, Hatemi and McDermott2011; Hibbing & Alford, Reference Hibbing and Alford2004; Kahneman et al., Reference Kahneman, Knetsch and Thaler1986; Smith, Reference Smith2006).
Yet, despite increasing evidence that a broad range of complex social behaviors are biologically influenced, there is no universal agreement in the social sciences that such traits are even capable of intergenerational transmission. In the field of economic behavior, for example, Cipriani et al. (Reference Cipriani, Guiliano and Jeanne2013) report little relationship between parent and offspring behavior in experimental economic games, yet two twin studies report such behavior to be heritable (Cesarini et al., Reference Cesarini, Dawes, Fowler, Johannesson, Lichtenstein and Wallace2008; Wallace et al., Reference Wallace, Cesarini, Lichtenstein and Johannesson2007). Reconciling these contradictory findings remains paramount.
Similar contradictions are also found in the political science literature. The possibility that genetic differences help explain political differences was first raised 40 years ago by Eaves and Eysenck (Reference Eaves and Eysenck1974) and in detail by Martin et al. (Reference Martin, Eaves, Heath, Jardine, Feingold and Eysenck1986). It was not until the last decade that political science began seriously following up on these foundational studies (see Alford et al., Reference Alford, Funk and Hibbing2005), and a large research effort has since emerged in that discipline (for reviews, see Hatemi et al., 2011a; Hatemi & McDermott, Reference Hatemi and McDermott2012). An important development in this area includes several new social science-driven twin studies. The first was a National Science Foundation study conducted on US twins from the Minnesota twin registry (0721378, PIs: Hibbing, Alford, Funk, Hatemi, and Smith). These data are publically available (www.unl.edu/polphyslab) and have been widely used to explore differences in political attitudes and behaviors (e.g., see Fazekas & Littvay, Reference Fazekas and Littvay2012; Hatemi et al., Reference Hatemi, Medland, Klemmensen, Oskarsson, Littvay, Dawes and Martin2014; Lewis & Bates, Reference Lewis and Bates2013; Ludeke & Krueger, Reference Ludeke and Krueger2013; Smith et al., Reference Smith, Alford, Hatemi, Eaves and Hibbing2012). Two additional ‘politics and genetics’ studies conducted in Denmark (Klemmensen et al., Reference Klemmensen, Hobolt, Dinesen, Skytthe and Nørgaard2012) and Sweden (Oskarsson et al., Reference Oskarsson, Dawes, Johannesson and Magnusson2012) have provided complementary results (see Hatemi, Reference Hatemi2012). A review of all of the empirical research up to 2012 shows that genetic influences operate on individual differences for most political traits (see Hatemi & McDermott, Reference Hatemi and McDermott2012).
The majority of empirical evidence supports the inference that many economic and political attitudes and behaviors are under genetic influence; yet this is not always the case. Individual differences in group affiliation, many religious values, and ethnocentrism appear largely a function of the social environment (Eaves et al., Reference Eaves, Hatemi, Prom-Womley and Murrelle2008; Hatemi et al., Reference Hatemi, Alford, Hibbing, Martin and Eaves2009; Orey & Park, Reference Orey and Park2012). Importantly, where genetic influences are found, it is also clear that such influences are not static or independent –– environmental forces shape the psychological and biological processes that remain interdependent with genetic expression (McDermott et al., Reference McDermott, Dawes, Prom-Wormley, Eaves and Hatemi2013). And, research suggesting the interdependent forces of genes and environment on such traits has raised as many questions as it has answered. What are the pathways, if any, from genes to complex behaviors and preferences, such as risk taking, attitude positions, or ideology? Do genetic influences on such traits share common genetic influences with psychological processes such as cognition, fear, threat, disgust, risk aversion, mate selection, or personality? And if so, what are the specific biological systems that operate on these traits? And under what conditions are specific genetic variants expressed?
There have been a handful of studies that have explored the connection between political preferences, genetic mechanisms, and other parts of the human psychological architecture, focusing on personality (Smith et al., Reference Smith, Oxley, Hibbing, Alford and Hibbing2011; Verhulst et al., Reference Verhulst, Hatemi and Eaves2010; Reference Verhulst, Eaves and Hatemi2012), fear and anxiety (Hatemi et al., Reference Hatemi, McDermott, Eaves, Kendler and Neale2013), cognition and emotion (Dawes et al., Reference Dawes, Cesarini, Fowler, Johannesson, Magnusson and Oskarsson2014; Hibbing et al., Reference Hibbing, Smith and Alford2013; Oskarsson et al., Reference Oskarsson, Cesarini, Dawes, Fowler, Johannesson, Magnusson and Teorell2014), and gender and sexual identity (Hatemi et al., Reference Hatemi, McDermott, Bailey and Martin2011). With a handful of exceptions (see Benjamin et al., Reference Benjamin, Cesarini, van der Loos, Dawes, Koellinger, Magnusson and Visscher2012; Deppe et al., Reference Deppe, Stoltenbergal, Smith and Hibbing2013; Hatemi et al., Reference Hatemi, Gillespie, Eaves, Maher, Webb, Heath and Martin2011b, 2014), most studies did not attempt to identify the specific genetic variants and mechanisms underlying the psychological pathways by which political and economic preferences and behaviors are formed and maintained. In comparison to the centuries of work exploring a strictly social model, such work is but a ‘drop in the bucket’. Much more research is required to disentangle the complicated causal processes that result in traits such as political and economic attitudes and behaviors. Our study was specifically designed to address this lacuna through answering these questions:
-
1. What economic, political and social attitudes and behaviors are heritable and to what degree and how does heritability change under difference contexts? Numerous behavioral genetic studies indicate a range of social attitudes and behaviors are heritable, but this has not been the central focus of heritability studies, and a wide range of traits of central interest to social science (e.g., economic decision making, disposition towards authority or collaborative decision making, political participation, and social affiliation) remain relatively unexplored. The data we collected in this study, including how people make decisions when interacting with others, allow an unparalleled opportunity to address a wide array of research questions through a detailed battery of validated social, political, and economic instruments.
-
2. What are the psychological correlates of social, economic, and political attitudes and behavior, and what is the nature of these relationships? We seek to identify the specific psychological correlates (e.g., morality, personality, aggression, intellect) of attitudes and behavior, and if they are related through common genetic mechanisms, selection into similar environments, or common socialization processes.
-
3. What are the genetic pathways related to economic, political and social attitudes and behaviors? Identifying specific genetic correlates of attitudes and behavior represents an important next step for social science, and one of the central goals of our project is to identify genotype–phenotype correlations and through which biological mechanisms, hormonal pathways, and psychological constructs they manifest.
-
4. How does variation in genes, psychological mechanisms (cognitive/emotional representations), and social and environmental experiences contribute to individual differences in economic, political and social attitudes and behaviors? Connecting genetic influences through mental/representational systems that support individual variation in political, social, and economic attitudes and behavior in varying contexts has rarely been explored. Our study begins to remedy this lacuna.
Materials and Methods
Data were collected in two waves. Between July 2008 and December 2009, 19- to 30-year-old twins participating in an ongoing longitudinal study of heath and cognition (see Wright & Martin, Reference Wright and Martin2004) at the Queensland Institute of Medical Research (QIMR) were invited by mail to participate in the current study. Participants were assigned an encrypted identifier and a web address to a secure online survey; a phone number and email address were provided for potential participants to ask questions or opt out of future contact. Eight hundred and twenty-seven individuals in our target age group (19–30 years) were selected from the study population of 2,720. Up to two phone call reminders were conducted for non-responders. Data were collected from 586 respondents, which included 250 complete twin pairs (97 MZ/154 DZ). Fifty-three individuals explicitly refused, and the remaining 188 refusals were passive, resulting in a 70% response rate. For taking part in the study, participants had the potential to earn up to AUD79.50, depending on their choices in a series of real-money, multiple-person, interactive economic situations. In addition, all participants from both waves were included in a lottery for a new iPhone. The study was approved by the QIMR Berghofer Human Research Ethics Committee and all participants provided electronic or written informed consent.
The second wave was conducted approximately 2 years later between July 2010 and November 2011. We recontacted 379 twins from Wave 1, and ascertained 157 ‘new’ twins from our sample population, and 566 mothers, 360 fathers and 120 non-twin siblings of the twins from both waves (N = 1,605, including partial completions). Participants were compensated AUD50 for their time. One hundred and seven explicitly refused, while the remaining 383 refusals were passive; contact information for 40 potential participants was inaccurate and therefore they were not reachable, resulting in a 77% response rate. Sample characteristics and demographics for both waves are presented in Table 1.
Sample Characteristics and Demographics for Wave 1 and Wave 2 of Study
ⱡ, 379 twins from Wave 1 were re-assessed in Wave 2.
Measures
Measures included economic decision-making, risk tolerance, political participation, issue attitudes, personal efficacy, cognition, trust, economic and political values, rationality, personality, familial influence and socialization, religiosity, morality, life events, and many others. The measures were taken from country-specific general social science surveys such as the American and Australian National Elections Studies, and standardized personality scales and instruments to assess cognitive and emotional traits. Some measures were shortened or modified to fit within the study protocol. The majority of measures were assessed in some form in both waves. We separated measures into four categories –– Economic; Political; Psychological; and Familial, Social, and Environmental. The full questionnaire, including all of the items for each of these topics, more detailed analysis of these items, along with subsequent publications, will be provided on the author's website in the near future. At this stage, our purpose is limited to introducing the topic areas, and providing a preliminary analysis on a few select measures in order to highlight the study's potential.
Results
Economic Preferences and Behaviors
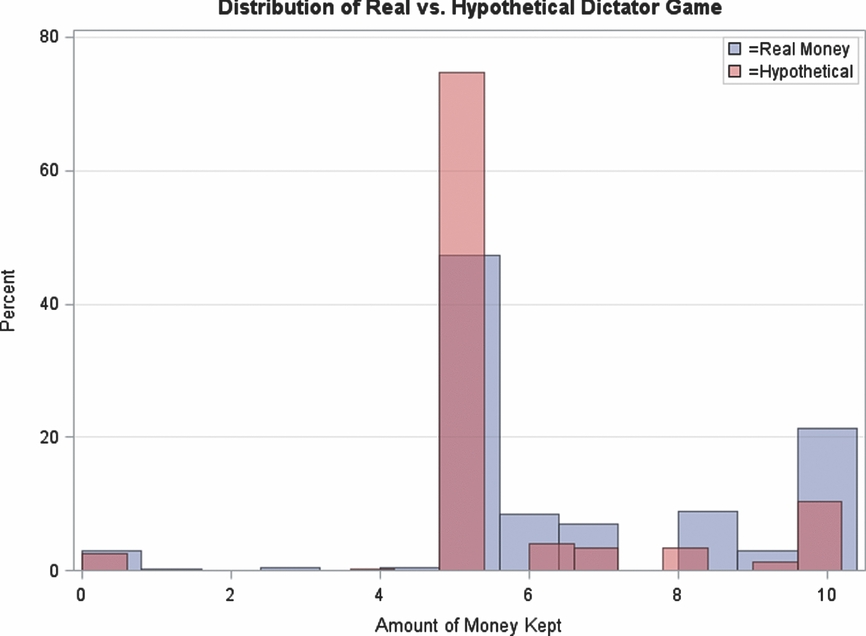
In the first wave, participants took part in a series of experimental frameworks widely used to explore economic behavior and decision-making. These included real money dictator, ultimatum (player 1 and 2), lottery, discount rate, coin-toss gambling, and public investment games interacting with real people in an online environment (see Fehr & Gächter, Reference Fehr and Gächter2000; Güth & Tietz, Reference Güth and Tietz1990; Oosterbeek et al., Reference Oosterbeek, Sloof and de Kuilen2004). These games are useful because they provide a direct way to measure prosocial economic behavior, and the existing literature shows a good deal of variation in individual-level behavior in these games (Eckel & Grossman, Reference Eckel and Grossman1996; Smith, Reference Smith2006). In the first wave, in addition to taking part in experimental economic games for real money (Australian dollars), we also asked an extensive survey battery of attitudes towards economic issues, prospect theory, risk tolerance, and prosocial economic orientations. The second wave included the same dictator, ultimatum player 2, lottery measures but real-money incentives were not used. The design of our study provides a number of important benefits, and preliminary analyses are promising. For example, in the dictator game, where respondents were asked to divide $10 between themselves and one other real person, and whatever amount they decided to keep from the $10 would be theirs to keep, and the remainder would be given to the other person, we found a 0.33 correlation between responses in the real money and hypothetical games. However, as shown in Figure 1, we also found a different distribution in Wave 2, where more individuals reported being more generous in the hypothetical situation than in the case where they were gaining real money. Exploring the psychological and genetic correlates of self-interest/generosity and differences in self-presentation, between real and hypothetical play, will be fully described in future papers.
Distribution of reponses to the real money and hypothetical dictator game.
Political and Religious Preferences and Behaviors
Participants in both waves completed a detailed questionnaire on political preferences, behaviors, and environmental conditions. In Wave 1, political ideology was measured by a 30-item attitudinal measure in a Wilson and Patterson (Reference Wilson and Patterson1968) format. Respondents were also asked questions on how important politics and religion were in their lives. Political discussion was measured by two questions in a national election studies format focusing on how often politics was discussed in the family growing up and how often twins spoke to each other about politics. Vote choice was measured through a series of questions in a manner similar to the way it is done in the voting booth (e.g., respondents were asked to rank order their party choices, to vote above or below the line, etc.). Respondents were also asked who they wanted to see become the Prime Minister. Political knowledge was measured through five items assessing participants’ understanding of the government (e.g., ‘The name of the Federal Treasurer before the 2007 Federal election was …’). Religion and spirituality was measured by five standardized questions on religious denomination, service attendance, religion, and belief in God, heaven, hell, angels, and demons. In Wave 2, political knowledge, vote choice and ideology, trust, interest, and participation were measured in a manner similar to Wave 1, but an additional question measuring the intensity of each attitude, creating five-point Likert-type items, was added to the Wilson–Patterson battery.
Perhaps one of the best indicators of external validity regarding political disposition is to compare our population's voting preferences to the actual election results reported by the Australian Election Commission (http://results.aec.gov.au). Table 2 provides such a comparison for each survey wave. In both cases, our population is quite similar to the official election results.
Comparison of Voter Preferences (Percent Endorsing Each Party)

Percentage calculated for only those that reported voting and identified a party preference.
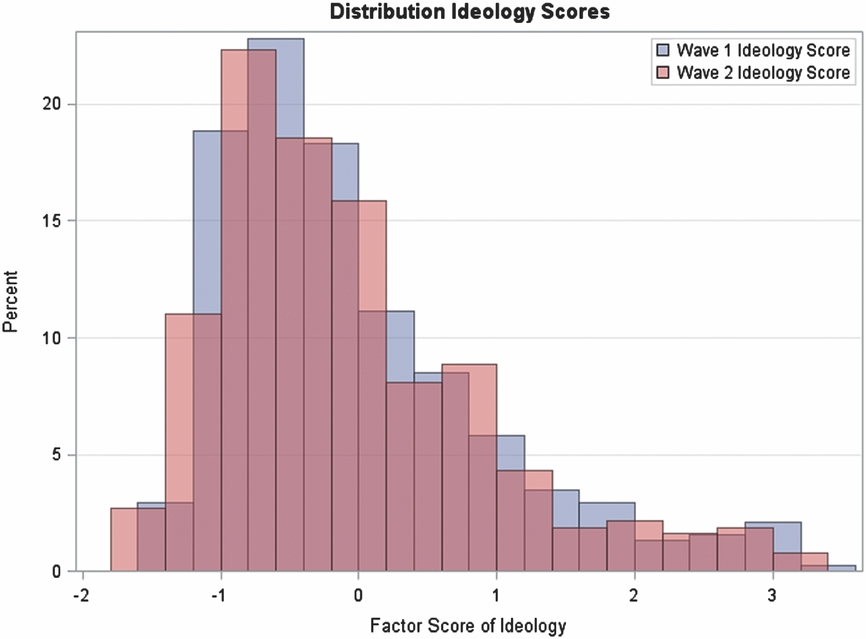
In addition, the distribution of the factor scores of the identical political attitude items is nearly equivalent in both waves, assessed 2 years apart (Figure 2). The correlation between waves is 0.75.
Similarity of distribution of ideology between waves.
Personality
In Wave 1, personality was measured with the 44-item five factor model of personality (John & Srivastava, Reference John, Srivastava, John, Robins and Pervin1999), a 6-item Machiavellianism scale (Allsopp et al., Reference Allsopp, Eysenck and Eysenck1991; Christie & Geis, Reference Christie and Geis1970), an 18-item Baron-Cohen Empathy Quotient, 17 emotion-reading images (Figure 3, also see Baron-Cohen & Wheelwright, Reference Baron-Cohen and Wheelwright2004), a 9-item subset of Buss and Perry's Aggression Questionnaire (Buss & Perry, Reference Buss and Perry1992), a 10-item moral foundation questionnaires (MFQ) (Graham et al., Reference Graham, Haidt and Nosek2009), and a 6-item moral dilemma questionnaire (Hauser, Reference Hauser2006). Wave 2 participants were assessed with the 10-item personality inventory (TIPI; see Gosling et al., Reference Gosling, Rentfrow and Swann2003), a 2-item Machiavellianism scale, a 13-item item literalism, order/closure scale (Baron-Cohen et al., Reference Baron-Cohen, Wheelwright, Robinson and Woodbury-Smith2005), a 10-item disgust scale adapted from Haidt et al. (Reference Haidt, McCauley and Rozin1994), and the 20-item moral foundations questionnaire (www.moralfoundations.org/questionnaires).
Example of emotion reading tasks.

Co-Twin Correlations
Perhaps of greater interest to the external validity of our sample is to compare our genetic and environmental estimates to identical traits in the extant literature (Table 3). Regarding heritability estimates, undoubtedly the most widely explored political trait is the heritability of ideology (see Hatemi et al., 2014). Reviewing the MZ/DZ co-twin correlations (see Table 3), our sample provides very similar heritability estimates to those identified in the extant literature. In addition, our co-twin correlations for belief in God, neuroticism, educational attainment and IQ also reflect those reported in large studies (D’Onofrio et al., Reference D’Onofrio, Eaves, Murrelle, Maes and Spilka1999; Jang et al., Reference Jang, Livesley and Vernon1996; Tambs et al., Reference Tambs, Sundet, Magnus and Berg1989). These, of course, are only a sample of the traits available. We selected these specific traits for comparison because they are the most replicated in the extant literature.
Co-Twin Correlations of Selected Traits

MZ and DZ correlations pooled across sexes, including unlike sex pairs. *IQ was collected previously by Wright and Martin (Reference Wright and Martin2004).
Empathizing and Machiavellianism: Heritability Estimates
The primary purpose of this article was to introduce and describe our study, so that future papers can focus on the substantive topics. Yet, no paper would be complete without at least some novelty. In the following paragraphs, we introduce preliminary analyses from two measures, Empathizing and Machiavellianism.
Are humans rational? Perhaps no question has been more debated in the economic and social sciences. The emerging consensus is that sometimes we are and sometimes we are not, and a host of psychological, situational, contextual, social and economic conditions interact and at times compete in deciding our rationality at any given moment. Only recently have individual differences in psychological traits been considered relevant to economic decisions.Footnote 1 There are thousands of traits that may operate on decision making; here, we explore two traits that reside on the opposite sides of the self-interested spectrum, that so far have not yet been studied in the genetics literature: Baron-Cohen's Empathizing Quotient and Machiavellianism.
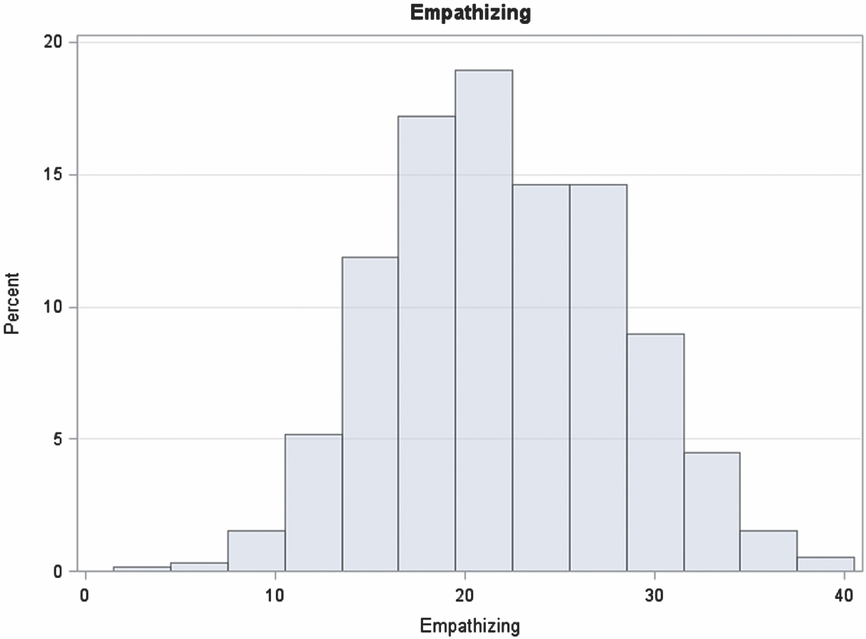
Empathizing was measured with a shortened 18-item version of the Baron-Cohen Empathizing Quotient (for exact questions see Table 4; for details on the measure and scoring key, see Baron-Cohen & Wheelwright, Reference Baron-Cohen and Wheelwright2004). Respondents were given the following instructions: ‘Below is a list of statements. Please read each statement very carefully and rate how strongly you agree or disagree with it by circling your answer. There are no right or wrong answers, or trick questions’. Response options on a 5-point Likert scale ranged from strongly agree to strongly disagree.
Empathizing Quotient: Frequency (%) of Response Options

Percent shown. Sample size = 581. The EQ was only assessed in Wave 1.
These 18 items were scored according to Baron-Cohen and Wheelwright (Reference Baron-Cohen and Wheelwright2004), then summed into a composite score, with a higher number being more empathetic, that is normally distributed with a mean of 22.05 and standard deviation of 6.14 (see Figure 4).
Distribution of empathizing quotient.
Machiavellianism was measured using a 6-item short form of Allsopp et al.'s (1991) Machiavellianism scale (for exact questions see Table 5; see also Christie & Geis, Reference Christie and Geis1970). Respondents were given the following instructions: ‘Please respond yes or no to the following questions’.
Machiavellianism: Frequency of Response Options

Percent shown. Sample size = 581 twins (Wave 1 results only).
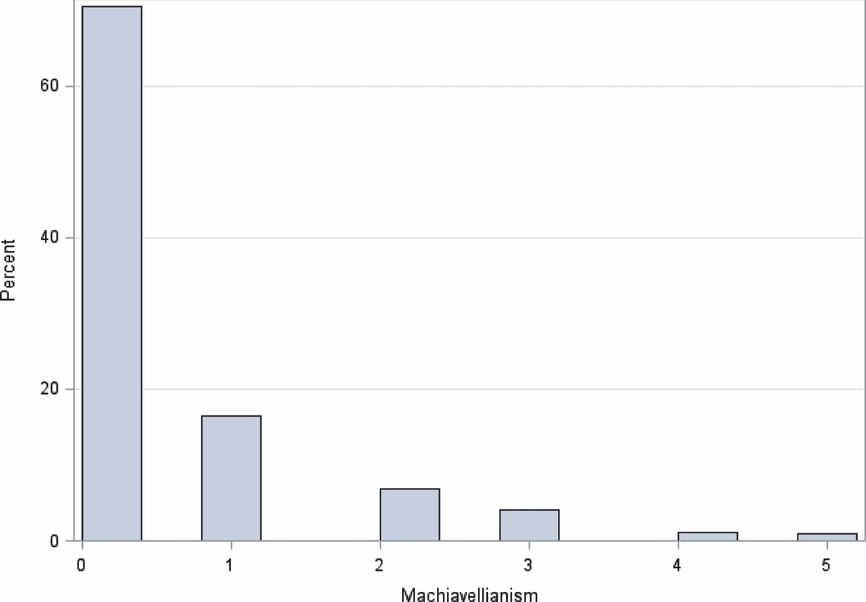
Item 6 was reverse coded, so that higher numbers on all items resulted in higher Machiavellianism. Exploratory factor analyses of the items resulted in the 6th question being dropped for providing a poor fit to the scale. Unlike empathizing, the summed score of Machiavellianism is positively skewed with a mean of 0.52 and standard deviation of 0.98 (see Figure 5). Our distribution is similar to previous studies using this measure; over 70% did not endorse one question and 1% endorsed all five (Allsopp et al., Reference Allsopp, Eysenck and Eysenck1991; Christie & Geis, Reference Christie and Geis1970; Mudrack & Mason, Reference Mudrack and Mason1995).
Distribution of machiavellianism.
We conducted heritability analyses utilizing the Classical Twin Design (CTD) variance components approach, which compares a population of monozygotic (MZ) twin pairs to a population of dizygotic (DZ) twin pairs, where both types of twins are reared together. Shared variance is partitioned into that which is due to genetic effects (A) and that which is due to a shared or common environment (C). Additive genetic effects are the sum of the individual effects of all genes involved. Common environmental (C) influences are those shared by co-twins. Finally, non-shared, or unique, environmental influences (E) represent differences due to different individual experiences and measurement error. Univariate genetic models were conducted using maximum likelihood estimation in a structural equation model fit to the raw data, corrected for age and sex, operationalized in the statistical package Mx (Neale et al., Reference Neale, Boker, Xie and Maes2003). The latent additive genetic factors were 1 for MZ twins and 0.5 for dizygotic twins (DZ), including opposite sex pairs (OS). Correlations between the latent common environment factors were 1 in both MZ and DZ twin pairs. Empathizing was fit to a continuous model and Machiavellianism was fit to a threshold model that assumed each variable had an underlying normal distribution of liability. The thresholds are expressed as z values that discriminate between categories that correspond to the frequency of endorsement for the Machiavellianism indicators.
The findings are quite interesting (see Tables 6 and 7); for males, individual differences in empathizing are largely due to genetic influences, while individual differences in Machiavellianism are largely a function of the shared environment. For females, individual differences in Empathizing and Machiavellianism are almost entirely a function of unique experience or error.
Empathizing and Machiavellianism Co-Twin Correlations by Zygosity

Confidence limits in parentheses. MZM = monozygotic male pairs, MZF = monozygotic female pairs, DZM = dizygotic male pairs, DZF = dizygotic female pairs, DZOS = dizygotic unlike sex pairs.
Standardized Variance Components (95% CI) Sex Limitation Model Fitting for Empathizing and Machiavellianism

Estimates derived from univariate sex-limitation models, including unlike sex pairs, with means corrected for age and sex. a2, c2, and e2 represent additive genetic, common environmental, and unique environmental influence respectively. The first model estimates the full ACE model, in which all three variance components are significant. M = F reflects a model where variance components for males and females are equated. Best fitting model in bold. Italic type represents models that provide a significantly worse fit to the data. 95% confidence intervals in parentheses.
DNA
DNA was previously collected and participants were genotyped on the Illumina 317 K, 370 K, or 610 K SNP platforms. After integration of the data sets, the data were screened for missingness within individuals, pedigree and sex errors, and Mendelian errors. Standard quality control filters were applied to the genotyping, restricting the imputation to samples and SNPs with high data quality (for more details, see Medland et al., Reference Medland, Nyholt, Painter, McEvoy, McRae, Zhu and Martin2009). In addition, specific genotypes were assessed for participants in Wave 2 (see Table 8). These genotypes have been previously identified as potential candidate genes related to the cognitive, emotive and psychological systems that may have a role in economic, political and social decision making and preference structures.
VNTR and CNV Genotypes Targeted for Typing in This Study

Discussion
To the best of our knowledge, there currently exists no other data that includes a wide range of experimental economic games, psychological traits, and social behaviors on twins sequenced across the genome, including specific genotyping for candidate CNVs and VNTRs. As our study progresses, we will investigate whether a broad range of economic behaviors and attitudes are under similar or unique genetic influences; either result could potentially alter the manner in which human behavior is traditionally conceived. Isolating the genetic and social pathways that shape economic and political behaviors and attitudes would heighten our understanding by identifying the combinations of biological systems interacting with specific environments at the core of these behaviors. Once the relevant systems have been identified, further tests can be conducted to explicate the nature of the evolutionary forces that has shaped them. Do the genes give evidence of positive selection? If so, is it recent or late? Are there variations in frequency of particular alleles across cultures (see Harpending & Cochran, Reference Harpending and Cochran2002)? Are gene-gene and gene-culture interactions apparent (see McDermott & Hatemi, Reference McDermott and Hatemi2013)? By answering these questions, we would go some distance toward establishing the nature and history of behaviors that are at the core of being human.
Identifying the genetic and environmental reasons for behavioral and attitudinal variations has all sorts of advantages. For example, these traits are also likely to be connected to other behavioral manifestations such as drug abuse and social pathologies, so research on the genetic and biological bases of economic behaviors, such as risk-taking for example, could be of assistance in understanding and treatment. This project also has the potential to provide the basis for a useful, systematic expansion of behavioral theory. In economics, the standard approach to explaining behavior has been to take preferences as given, and to assume some approximation of self-interested rationality. The behavioral predictions generated by this approach have a mixed record of success. As a result, economists acknowledge that improving theoretical assumptions will require an empirically grounded understanding of the source of preferences (Ben-Ner & Putterman, Reference Ben-Ner and Putterman2000). Preferences need not be taken as given if the cognitive and emotional predispositions that underlie purposive choice can be isolated and identified. In political science, there continues to be significant resistance to the notion that individual differences in attitudes and behaviors are genetically influenced. Disentangling the genetic and environmental influences on political attitudes and behaviors, and how these agents interact, holds the promise of new insights into the sources of political differences.
The impending results generated by this project also hold the potential to influence thinking on a wide range of intellectual and applied issues. A better understanding of the biological processes involved in preference formation could help us not only understand the sources of ideology and the social conflict it generates, but also help policymakers more effectively fashion social policies. For example, the assumption that institutional rules can provide the incentives to channel behavior in a particular way is at the heart of a wide range of public policies. School choice is a classic example: Give parents the freedom to choose schools, loosen constraints on the supply side, and the efficiencies of the market can help address a range of problems in primary and secondary education, assuming that people act rationally. While that is the theory, empirical evidence shows that imperfect rationality is highly evident in choosing schools (Smith, Reference Smith2005). It is quite possible that the failure of a range of public policies to fully achieve their desired results –– not just school choice, but deterrent drug policies, welfare reform, retirement savings plans and many others –– is due to a flawed conception of people as monolithic rationalizers when in fact they may turn out to be behaviorally disparate due partly to genetic diversity. Shedding light on the source of people's quite different motivations and orientations toward social, economic, and political life could help lawmakers improve policies that rely on incentives, which includes everything from public education to social security reform. Several projects utilizing this data have begun, exploring these questions and we look forward to sharing the results in the near future.
Acknowledgments
We thank Soad Hancock and Anjali Henders for project coordination, David Smyth for database management, and Simon Easteal and Susan Tan for genotyping of VNTRs. Most of all, we thank the twins and their family members for participation in the study. This work was supported by the National Science Foundation (0729493,0721707).


