
2.1 Introduction
Large and growing economic inequalities have captured public attention in Canada and the United States. These economic inequalities do not exist in a vacuum, but track along the lines of structural inequalities resulting from historic and continuing racism, anti-immigrant sentiment and xenophobia, and oppression of Indigenous peoples (e.g., Reference Fix, Papademetriou and SumptionFix, Papademetriou, & Sumption, 2013; Reference Orfield and LeeOrfield & Lee, 2005; Truth and Reconciliation Commission of Canada, 2015). These broader structural inequalities lead to disparities in opportunities to develop the language and literacy skills privileged in schools, producing unequal outcomes in students’ achievements in reading and writing (e.g., Reference Duncan and MurnaneDuncan & Murnane, 2011; Reference Shonkoff, Garner and SiegelShonkoff et al., 2012; Reference Snow, Burns and GriffinSnow, Burns, & Griffin, 1998).
Although structural inequalities along socioeconomic, cultural, and linguistic lines have always been features of schooling in Canada and the United States, they have played out differently over time. Now that we are well into the twenty-first century, researchers from various disciplines have begun to reappraise the current magnitude and nature of achievement differences in terms of socioeconomic and sociodemographic factors (e.g., Reference Duncan and MurnaneDuncan & Murnane, 2011; Reference GamoranGamoran, 2015; Reference Shonkoff, Garner and SiegelShonkoff et al., 2012). In addition, researchers have begun to recently examine how these structural inequalities play out differently in the US and Canadian contexts, given their different histories, geographies, demographics, and social policies (e.g., Reference Bradbury, Corak, Waldfogel and WashbrookBradbury et al., 2015).
This chapter aims to synthesize evidence from large-scale studies on the magnitude of disparities between the literacy development of students from low socioeconomic and language-minority backgrounds and that of their more advantaged counterparts in the United States and Canada, particularly regarding reading skills. Among various structural inequalities that are relevant to reading, we focus on socioeconomic status (SES) differences and linguistic diversity (and their interrelationships). We explicitly acknowledge that extensive structural inequalities also exist for Indigenous peoples in both countries across a range of education, health, and social outcomes. We focus specifically on language-minority learners in this chapter primarily because the large-scale research that has examined disparities in reading development has provided valuable insight regarding students from immigrant backgrounds. By focusing on reading development in language-minority learners, we do not intend to minimize or obscure the very real barriers to equitable education in Indigenous communities, nor do we intend to convey that structural forces that affect immigrant students can be generalized to Indigenous communities. Instead, we echo previous calls to address the sociocultural context of reading development and education more broadly in Indigenous communities in both countries (Truth and Reconciliation Commission of Canada, 2015).
We primarily draw together evidence from nationally representative cross-sectional and longitudinal studies from early childhood through adolescence. When useful and appropriate, we provide comparisons between the two countries, but we also interpret findings for each country in the context of international benchmarks for high-income countries (e.g., countries in the Organisation for Economic Co-operation and Development; OECD). In measuring socioeconomic status, we focus primarily on two complementary indices – parental education and family income – while also using composites that incorporate parental occupation and home resources for learning when data are available.
In the sections that follow, we describe our theoretical framework that integrates ecological and developmental perspectives on reading. Next, we summarize key evidence describing differences by socioeconomic status and home-language background for each of the developmental periods. We end by commenting on some of the implications of this evidence and on what has not yet been possible to ascertain from large-scale studies of literacy development in Canada and the United States.
2.2 Ecological and Developmental Perspectives on Reading in Canada and the United States
2.2.1 Ecological and Developmental Framework
We take a perspective on reading that emphasizes ecological influences on child development, while integrating insights from neurocognitive, sociological, and economic perspectives. An ecological model of human development (e.g., Reference BronfenbrennerBronfenbrenner, 1994; Reference Bronfenbrenner, Morris, Lerner and DamonBronfenbrenner & Morris, 2006) helps us understand the development of individual children as influenced by the variety of social contexts in which they are growing, changing, and learning. Specifically, an ecological perspective on reading development acknowledges the central role of the “microsystem” – proximal processes (e.g., teacher’s instructional practices, parent’s interaction styles) in children’s immediate contexts (e.g., classrooms, homes) – in their development of skilled reading. At the same time, this perspective views these proximal processes and immediate context as shaped by multiple broader exosystems – family social networks, neighborhood contexts, school district practices – and macrosystems – overarching patterns characteristic of a given culture or, in the case of our analysis, a national context.
Applying an ecological perspective to reading, in particular, we focus on what Reference Aaron, Joshi, Gooden and BentumAaron et al. (2008) called the “ecological component” of reading in their Componential Model of Reading, which also includes a cognitive and a psychological component. Like these authors, we see this ecological component as influencing and interacting with the development of cognitive skills (i.e., word reading and linguistic comprehension) and psychological attributes (e.g., motivation, interest) required for successful reading (Reference Kieffer and VukovicKieffer & Vukovic, 2012). Neurocognitive research provides further insight into the nature of cognitive development required for reading. We share the perspective of many scholars that reading is a parasitic system on spoken language; that is, that reading written language is a culturally invented and “unnatural” activity, which draws on “natural” language systems that evolved to serve other purposes for Homo sapiens. Given that assumption, it is not surprising that acquiring language is a nearly universal human accomplishment, but that learning to read complex texts with comprehension is far from universal, even in countries like the United States and Canada with compulsory and free education through adolescence. Basic literacy rates are very high in both countries (e.g., 96 percent of fourth-grade students in each country reached the “low international benchmark” on the 2016 Progress in International Reading Literacy Study [PIRLS]; Reference Mullis, Martin, Foy and HooperMullis et al., 2017), but a large gap exists between these two countries in terms of the level of more advanced literary skills required in them for participation in the modern, global economy and democratic processes.
2.2.2 Ecology of Education in the United States and Canada
To apply these perspectives to a cross-national study of reading inequalities in the United States and Canada, we also start by acknowledging some key similarities and differences in the challenges associated with reading in these two countries. First, given the position of English as the common language in the United States and as one of two official languages in Canada, learning to read in these two contexts requires learning the same alphabetic writing system, with a deep orthography (i.e., a spelling system characterized by many inconsistencies and complexities in grapheme–phoneme correspondences; Reference Seymour, Aro and ErskineSeymour, Aro, & Erskine, 2003). Students learning to read in French in Canada are also learning an alphabetic writing system with a moderately deep orthography (e.g., Reference Seymour, Aro and ErskineSeymour et al., 2003). So, the cognitive challenges in learning to read are quite similar for Anglophone students and roughly comparable for Francophone students in Canada as well. (That said, French readers may face particular challenges due to the language’s higher frequency of historically preserved morphological patterns that produce speech-to-spelling inconsistencies; Reference Deacon, Desrochers, Levesque, Verhoeven and PerfettiDeacon, Desrochers, & Levesque, 2017). Second, the United States and Canada, as OECD countries with long histories of stable government, have relatively similar levels of economic and institutional development. As a result, both countries offer free and compulsory education through secondary school, with relatively large levels of average investment in public education (e.g., NCES, 2016; UNESCO, 2016 ). Despite these similarities, the two countries differ in their ecologies of education in major ways. Importantly, these include major differences in the social services available, including the availability in Canada of universal, nationalized healthcare and more robust economic support in Canada than that found in the United States (e.g., Reference Bradbury, Corak, Waldfogel and WashbrookBradbury et al., 2015).
Third, as part of the legacy of settler colonization, the United States and Canada have both been defined by immigration since their founding. They have both varied over time in their treatment of new waves of immigrants – from encouragement through grudging acceptance to xenophobic rejection (Environics Institute for Survey Research, 2019; Reference Waters and PineauNational Academies of Sciences, Engineering, and Medicine, 2015). As these broader forces inevitably affect schools, questions about the education of immigrants and the children of immigrants have been politically charged and answered differently over time. Foremost among these have been questions about schools’ responsibilities as regards to meeting the language- and content-learning needs of language-minority learners, that is, students who speak a language other than the society’s dominant language(s) at home. Of course, the other legacy of settler colonialism in both countries since their inception has been policies and practices that sought to eradicate Indigenous peoples and their ways of being. These have had the cumulative effect both of wiping out Indigenous languages and underfunding Indigenous education efforts, leading to significant education and opportunity gaps for Indigenous students in both countries (NCES, 2019; Truth and Reconciliation Commission of Canada, 2015).
In both countries, education for language-minority and immigrant learners has been defined by major tensions. In the United States, on one hand, these students benefit from civil rights protections, including the right to equal education opportunities guaranteed by the United States federal court decisions (Lau v. Nichols, 1974; Castañeda v. Pickard, 1981; Plyler v. Doe, 1982). On the other hand, US schooling has been characterized by persistent negative attitudes toward bilingual education and immigrant students that produce major inequalities in resources and opportunities to learn (e.g., Reference Gandara, Rumberger, Maxwell-Jolly and CallahanGandara et al., 2003). Canada has a more decentralized educational system, whereby each province has jurisdiction over education. Under this system, there has been relatively little federal attention to teaching language-minority learners in their native language, but the country also has official policies that embrace bilingualism (at least English/French bilingualism) and promote multiculturalism. There has also been a recent resurgence in Indigenous-language revitalization in Canada.
The immigration policies of the two countries have differed in major ways historically and continue to do so, with Canada accepting most immigrants using a points system that favors highly educated and skilled workers while the United States system prioritizes family reunification rather than education and skills (e.g., Reference BloemraadBloemraad, 2006). It is worth noting that the geographic isolation of Canada from the rest of the world – surrounded by oceans to the east, west, and north, and sharing a border with only one other country – has also facilitated highly selective immigration criteria and policies. Given the two countries’ demographic and political histories (and futures), describing the reading development of language-minority learners in the United States and Canada is central to understanding how diversity and structural inequalities in both countries play out in schools.
The two countries also have different histories and public rhetoric concerning multilingualism and multiculturalism. In Canada, French and English have had equal official status in government and all of the services it controls since the Official Languages Act of 1969; in the United States, there is no official language by law, but English remains the overwhelmingly predominant language in government and schooling, with only minor protections for other languages, most of which have been introduced as a result of civil rights actions rather than democratic processes (e.g., Reference CrawfordCrawford, 2004). Moreover, Canadian law (i.e., the 1982 Canadian Charter of Rights and Freedoms; the 1985 Canadian Multiculturalism Act) affirms an official policy of recognizing and promoting multiculturalism (Reference Ambrose and MuddeAmbrose & Mudde, 2015). This proactive encouragement of multiculturalism goes beyond the prohibitions against discrimination that characterize the corresponding US laws (e.g., the 14th Amendment; the 1964 Civil Rights Act). (At the same time, Canada’s Indian Act still engenders discriminatory practices and limits Indigenous sovereignty [Reference JosephJoseph, 2018], which contradicts the spirit of Canada’s commitment to multiculturalism.) Finally, the two countries differ in the fundamental scale of their societies and educational systems. In the United States, roughly 50 million public K-12 students are taught by over 3 million teachers (NCES, 2015), whereas in Canada, roughly 5 million students are taught by approximately 700,000 teachers (Stats Canada, 2016). By point of comparison, New York City schools serve more students than those of every province and territory in Canada, except for the two largest, Quebec and Ontario.
2.2.3 Sociocultural Predictors of Reading Development
Understanding the ecological differences between the United States and Canada leads us to construct hypotheses about the two sociocultural predictors that are our focus: SES and linguistic diversity. Regarding SES, the stronger social safety net available to children living in poverty in Canada compared to that in the United States would suggest smaller effects of SES in the former country than in the latter, given the importance of health and well-being to reading development (e.g., Reference Shonkoff, Garner and SiegelShonkoff et al., 2012; Reference Snow, Burns and GriffinSnow et al., 1998). Regarding linguistic diversity, Canada’s more selective immigration system is likely to result in language-minority learners with more resources and consequently better reading outcomes compared to their counterparts in the United States. That said, if these differences are associated primarily with differences in socioeconomic resources, we would expect smaller differences between language-minority learners in the two countries once we have taken SES into account.
Given our ecological perspective, we resist attributing differences by SES and home-language background to individual students’ characteristics or to those of their families or teachers. Rather, we interpret these differences as the culmination of complex interactions among broad structural inequalities rooted in cultural and historical patterns of oppression and marginalization. These patterns play out in a variety of proximal processes in classrooms that constrain opportunities to learn and develop for some students, while maximizing these opportunities for others.
As we have seen, written text (from orthography through discourse patterns) is “unnatural” and culturally specific. Given this, it is not surprising that reading development will be linked to children’s access to and opportunities to learn the oral language skills for the languages that are privileged in written school texts. For example, when language-minority learners enter kindergarten with limited oral proficiency in the language (or languages) of instruction, we can expect that their trajectories toward proficient reading will differ from those of their peers who enter with strong proficiency in the language of instruction. (That said, language-minority learners’ trajectories often converge with those of language-majority students over time.) Moreover, language-minority students disproportionately come from low-income backgrounds, particularly in the United States (and to a much lesser extent in Canada), so disentangling the effects of poverty and home language on reading development is important to understanding these students’ academic trajectories.
2.2.4 Evidence of Disparities in Reading Achievement
To synthesize evidence on the magnitudes of disparities in reading achievement by SES and home language, we leveraged existing published analyses and conducted new analyses of large-scale, nationally representative datasets. Specifically, we leveraged analyses by an international team of scholars (Reference Bradbury, Corak, Waldfogel and WashbrookBradbury et al., 2011, Reference Bradbury, Corak, Waldfogel and Washbrook2015; Reference Washbrook, Waldfogel, Bradbury, Corak and GhanghroWashbrook et al., 2012) of the US Early Childhood Longitudinal Study – Birth, 2001 cohort (ECLS-B) and Kindergarten, 1998 cohort (ECLS-K:98) as well as the Canadian National Longitudinal Study of Children and Youth (NLSCY) and analyses (Kieffer, 2008, 2011, 2012) of the ECLS-K:98 by one of this chapter’s authors. We conducted new analyses using PIRLS 2006 and 2016 for fourth-grade reading in both countries. When possible, we report results from the most recent PIRLS administration, but rely on earlier datasets when they are the only administrations to include important variables of interest (e.g., parental education). We also conducted new analyses using the OECD Programme for International Student Assessment (PISA) data from 2018 as well as reports from PISA 2009 (which included useful analyses of home-language controlling for SES). Finally, we conducted new analyses with the US National Assessment for Educational Progress (NAEP) data from 2019 for SES and from 2015 for home language (the most recent year when the appropriate variable was available). All new analyses were conducted with online data explorers that appropriately account for weighting, matrix sampling, and other features of the datasets. All of the datasets are nationally representative, so include the full range of racial–ethnic and linguistic diversity in each country. In particular, the participating language-minority learners spoke a variety of languages, though the ability to conduct analyses separately by individual language group was limited.
In reporting and interpreting results, we present effect sizes, that is, standardized differences expressed in standard deviation units. In this way, we focus on the question of the size of the differences found, rather than simply whether differences exist. We interpret the effect sizes using Reference CohenCohen’s (1992) conventions, where 0.2 is small, 0.5 medium, and 0.8 large. This emphasis on magnitudes over statistical significance tests is appropriate because trivially small differences can be statistically significant in large datasets. In addition, effect sizes allow us to make rough comparisons across datasets for which statistical significance tests are not appropriate.
2.3 Differences by Socioeconomic Status
2.3.1 Role of SES in Language Skills at School Entry
Differences in students’ language skills when they enter school provide key insights into the structural inequalities that will play out later, given the well-established role of early reading-related language skills in predicting later reading development (e.g., Reference Snow, Burns and GriffinSnow et al., 1998). Fortunately, this is also a topic on which high-quality and highly comparable data has been collected in both the United States and Canada, particularly recent work by an international team of scholars (Reference Bradbury, Corak, Waldfogel and WashbrookBradbury et al., 2011, Reference Bradbury, Corak, Waldfogel and Washbrook2015; Reference Washbrook, Waldfogel, Bradbury, Corak and GhanghroWashbrook et al., 2012). Specifically, they analyzed data from the Canadian NLSCY and from the US ECLS-K and ECLS-B. Here, we focus on their comparisons of the oral vocabulary skills of four- and five-year-olds in the two countries.
Their results indicated substantial differences in early vocabulary by SES in both countries, with much larger differences in the United States relative to Canada, as shown in Table 2.1. The difference in vocabulary scores between students with at least one college-educated parent and those with parents with high-school education or less was 1.22 standard deviations (SDs) in the United States and 0.66 SDs in Canada. Similarly, when estimated using family-income quintile, differences were large in both countries, but more so for the United States than Canada. Given the potential differences in structural inequalities caused by other demographic characteristics in the two countries, we also provide estimates from Bradbury et al., which have been adjusted for race/ethnicity and parental immigrant status in Table 2.1. These adjusted estimates remained large, but were more similar across the two countries. This suggests that these other structural inequalities, which are historically and fundamentally intertwined with economic inequality, explain some of the differences observed between the United States and Canada.
Table 2.1 Effect-size estimates of differences in vocabulary by SES at ages 4–5
| Specific comparison | Data source | United States | Canada |
|---|---|---|---|
| By parental education (between at least one parent with a college degree and parents with a high-school degree or less) | Reference Bradbury, Corak, Waldfogel and WashbrookBradbury et al. (2011) using ECLS-B & NLSCY | 1.21 | 0.66 |
| Reference Bradbury, Corak, Waldfogel and WashbrookBradbury et al. (2011) using ECLS-B & NLSCY; | 0.86 | 0.71 | |
| Adjusted for race/ethnicity and parent immigrant status | |||
| By income (between the highest and lowest quintile for income) | Reference Bradbury, Corak, Waldfogel and WashbrookBradbury et al. (2011) using ECLS-B & NLSCY | 1.08 | 0.74 |
| Reference Bradbury, Corak, Waldfogel and WashbrookBradbury et al. (2011) using ECLS-B & NLSCY; | 0.84 | 0.71 | |
| Adjusted for race/ethnicity and immigration status |
Note: Parental immigrant status was operationalized as dichotomous and referred to whether both the child’s parents had been born in the country
2.3.2 Role of SES in Learning to Read
After four or five years of schooling, differences in reading achievement by SES continue to be moderate to large in both countries, as shown in Table 2.2. The available data did not allow direct comparisons between Canada and the United States, but nonetheless supported the general claim that differences in both countries are substantial. Consistent with results for early childhood, differences by parental education were moderate to large. For instance, for Canada, reading gaps by parental education in fourth grade on PIRLS 2006 were moderately sized (0.53 SDs), though smaller than the average for all countries participating in PIRLS 2006 (0.66 SDs) and slightly smaller than the corresponding gaps in early childhood vocabulary reported above. (We used PIRLS 2006 rather than PIRLS 2016 here because this was the last year in which parental education was measured.) Comparable PIRLS data were not available for the United States, which did not participate in all aspects of PIRLS data collection, but Reference Bradbury, Corak, Waldfogel and WashbrookBradbury et al. (2011) estimated these same gaps using ECLS-K data to be large in both third grade (0.99 SDs) and fifth grade (1.03 SDs).
Table 2.2 Effect-size estimates of differences in reading achievement by SES in childhood
| Comparison | Data source | United States | Canada | International average |
|---|---|---|---|---|
| By parental education (between at least one parent with a college degree and parents with a high-school degree or less) | PIRLS 2006 (Grade 4) | N/A | 0.53 | 0.66Footnote a |
| Reference Bradbury, Corak, Waldfogel and WashbrookBradbury et al. (2015) using ECLS-K (Grade 3) | 0.99 | |||
| Reference Bradbury, Corak, Waldfogel and WashbrookBradbury et al. (2015) using ECLS-K (Grade 5) | 1.03 | |||
| By composite of home resources for learning (between students with different levels of home educational resources) | PIRLS 2016 (Grade 4) | N/A | 0.48 | 0.66Footnote b |
| By income (between students receiving and not receiving free lunches) | NAEP 2019 (Grade 4) | 0.71 | ||
| NAEP 2019 (Grade 4); Adjusted for race/ethnicity | 0.55 |
a Average across all countries participating in PIRLS 2006.
b Average across OECD countries participating in PIRLS 2016.
Differences in reading by other SES indicators were also moderate to large. The PIRLS 2016 data for Canada include a home educational resource index, which included parental education and occupation, number of books in the home, and other study supports (i.e., having one’s own room to study; having an internet connection). On this measure, achievement differences between Canadian children with different levels were moderate (0.48 SDs) and smaller than the average for thirty-one OECD countries which participated in PIRLS 2016 (0.66 SDs). Again, such analyses were not possible for the United States. Instead, if we look at differences by income on the Grade 4 NAEP 2019, reading differences by free- or reduced-price lunch status were large (Table 2.2). Similarly, on the Grade 3 and Grade 5 waves of ECLS-K, differences by an SES composite (i.e., a combination of parental education, income, and occupation and the school’s percentage of students on free and reduced-price lunch) were also moderate to large in size for US children (Reference KiefferKieffer, 2012). Although these estimates are not strictly comparable across the two countries, they support the general conclusion that reading-achievement differences by SES in middle childhood are substantial in both countries.
Longitudinal studies corroborate these cross-sectional findings of substantial differences but also indicate some narrowing of SES gaps in each country between kindergarten and Grade 3. For the United States, Reference KiefferKieffer (2012) found that SES gaps in overall reading achievement narrowed by about 30 percent between kindergarten and Grade 3 (see also Reference Bradbury, Corak, Waldfogel and WashbrookBradbury et al., 2015). For Canada, a large epidemiological (but not nationally representative) study conducted in one city indicated a dramatic narrowing of gaps by neighborhood SES on a word-reading measure (Reference D’Angiulli, Siegel and HertzmanD’Anguilli, Siegel, & Hertzman, 2004). The latter study was not comparable to Reference KiefferKieffer (2012) and Reference Bradbury, Corak, Waldfogel and WashbrookBradbury et al. (2015), due not only to differences in sampling and SES indicators but also to fundamental differences in the reading skills measured; the greater narrowing of gaps found by D’Anguilli et al. may be specific to word-reading skills, which would be consistent with constrained-skills theory (Reference ParisParis, 2005). Nonetheless, these longitudinal findings suggest some degree of narrowing of SES gaps between early and middle childhood – though the cross-sectional results make it clear that large gaps remain.
2.3.3 Role of SES in Adolescent Reading Development
Similar to earlier developmental periods, evidence suggests moderate to large differences between levels of adolescent reading comprehension in both countries. On the most recent PISA in 2018, both countries demonstrated substantial differences between students in the top and bottom quartiles on an SES composite. As shown in Table 2.3, these large differences were somewhat greater in the United States (0.92 SDs) than in Canada (0.68 SDs), with the latter substantially smaller than the OECD average (0.90 SDs).
Table 2.3 Effect-size estimates of differences in reading achievement by SES in adolescence
| Comparison | Data source | United States | Canada | OECD average |
|---|---|---|---|---|
| By SES composite (between top and bottom national quarter) | PISA 2018 (age fifteen) | 0.92 | 0.68 | 0.90 |
| By parental education (between student-reported parent with college degree and parent without high-school diploma) | NAEP 2019 (Grade 8) | 0.66 | ||
| NAEP 2019 (Grade 8); Adjusted for race/ethnicity | 0.53 | |||
| By income (between students receiving and not receiving free lunch) | NAEP 2019 (Grade 8) | 0.67 | ||
| NAEP 2019 (Grade 8); Adjusted for race/ethnicity | 0.50 |
Other national datasets specific to the United States, including NAEP 2019, also suggest relatively large differences by SES indicators (Table 2.3). These gaps are reduced somewhat when adjusting for race/ethnicity, but remain substantial. Moreover, longitudinal studies using data from ECLS-K indicate that reading-achievement gaps widened between Grade 3 and Grade 8 (Reference KiefferKieffer, 2012; Reference Bradbury, Corak, Waldfogel and WashbrookBradbury et al., 2015), in contrast to these studies’ findings that the same gaps narrowed between kindergarten and Grade 3.
2.3.4 Summary of SES Differences
Looking across early childhood, childhood, and adolescence, differences in reading by SES are moderate to large in magnitude, regardless of the SES indicator used. In early childhood, these differences are notably larger in the United States than in Canada. Childhood differences are also moderate to large in magnitude in both countries, but cannot be compared directly. Canada’s differences are smaller than international averages in childhood. By adolescence, differences remain large in both countries, with larger differences again in the United States compared to Canada. In adolescence, Canada’s SES differences are smaller than the international average, whereas the United States’s differences are similar to this average.
2.4 Differences by Home Language Background
2.4.1 Linguistic Diversity at School Entry
Comparisons of national datasets indicate large differences in vocabulary (measured in the dominant language of English or French) between language-minority and language-majority students when they enter school in both the United States and Canada, as shown in Table 2.4. These results come from the same cross-national research team mentioned above (Reference Washbrook, Waldfogel, Bradbury, Corak and GhanghroWashbrook et al., 2012). Here, language-minority students were defined as those who spoke a language other than the dominant language(s) at home and were either immigrants or native-born children of immigrants. Language-majority students were those who had native-born parents and spoke English (or French in the case of Francophone Canadians) primarily at home. As shown in Table 2.4, the differences in vocabulary scores were similar across the two countries. In addition, adjusting these estimates for income, parental education, and other SES indicators (see note, Table 2.4) did not lead to a substantial reduction in these differences, indicating that large gaps in early language are demonstrated between language-minority and language-majority students, even when comparing those from similar SES backgrounds. This is consistent with the findings of several US studies conducted with smaller samples of Spanish-speaking language-minority learners, which suggest that they enter school with underdeveloped English vocabularies, relative to national norms on standardized assessments (e.g., Reference Mancilla-Martinez and LesauxMancilla-Martinez & Lesaux, 2011a, Reference Mancilla‐Martinez and Lesaux2011b; Reference Manis, Lindsey and BaileyManis, Lindsey, & Bailey, 2004).
Table 2.4 Effect-size estimates of vocabulary differences by home language at school entry (ages 4–5)
| Comparison | Data source | United States | Canada |
|---|---|---|---|
| By home language background (between children of immigrants who speak a nondominant language at home and children of native-born parents who speak the dominant language at home) | Reference Washbrook, Waldfogel, Bradbury, Corak and GhanghroWashbrook et al. (2012) using ECLS-B and NLSCY | 1.11 (0.04) | 1.03 (0.09) |
| Reference Washbrook, Waldfogel, Bradbury, Corak and GhanghroWashbrook et al. (2012); adjusted for income, parental education, and other SES controlsFootnote 1 | 0.98 (0.04) | 1.02 (0.05) |
1 Other SES controls included single parent household, number of children in the home, mother’s age at birth, child gender, and low birth weight.
2.4.2 Linguistic Diversity and Learning to Read
In comparison to results for early childhood vocabulary, differences in reading achievement in Grade 4 between language-minority and language-majority learners appear to be much smaller, particularly in Canada, as shown in Table 2.5. On the 2016 PIRLS, differences in reading comprehension between language-majority and language-minority students were moderately sized in the United States (0.34 SDs) and small in Canada (0.04 SDs). Specific to this survey, the United States gap was similar to differences in other OECD countries (0.32), while the Canadian gap was notably smaller. It is worth noting that the definition of language minority was not identical to the one used so far. Here, language-minority students included those who reported “sometimes” speaking the dominant language(s) at home, while language-majority students include those who reported “always” speaking the dominant language(s) at home; only a trivial number of students (3 percent in Canada, 1 percent in the United States) chose the other answer choice of “never” speaking the dominant language(s) at home, consistent with prior evidence that the vast majority of language-minority learners speak a combination of their home language and the dominant language, particularly after they enter school (e.g., Reference Mancilla-Martinez and KiefferMancilla-Martinez & Kieffer, 2010; Reference Mancilla-Martinez and LesauxMancilla-Martinez & Lesaux, 2011a). Although this definition is not strictly comparable to the one used by Reference Washbrook, Waldfogel, Bradbury, Corak and GhanghroWashbrook et al. (2012), they likely capture roughly similar populations of students.
Table 2.5 Effect-size estimates of reading-achievement gaps by home language in childhood
| Comparison | Data source | United States | Canada | OECD average |
|---|---|---|---|---|
| By home language background (between children who sometimes vs. always speak the language of the test at home) | PIRLS 2016 (Grade 4) | 0.34 | 0.04 | 0.32 |
| PIRLS 2016 (Grade 4); adjusted for home study supports | 0.001 | 0.0001 | ||
| By home language background (between students with and without a primary language other than English at home at kindergarten entry) | Reference KiefferKieffer (2011) using ECLS-K (Grade 3) | 0.48 | ||
| Reference KiefferKieffer (2011) using ECLS-K (Grade 3); adjusted for family SES composite and school concentration of poverty | -0.005 | |||
| By home language background (between students reporting speaking a language other than English at home all or most of the time vs. never) | NAEP 2015 (Grade 4) | 0.35 | ||
| NAEP 2015 (Grade 4); Adjusted for free/reduced lunch status | 0.15 |
Note: Positive values indicate better performance for language-majority speakers, while negative values indicate better performance for language-minority learners. Home study supports include having one’s own room to study in and having an internet connection.
Given differences in immigration policies and patterns that in turn yield differences in the SES of immigrant families in the two countries, we also provide estimates adjusted for a comparable index of SES available from PIRLS 2016 (i.e., the presence of home study supports). The adjusted estimate was very close to 0 for both Canada and the United States, indicating that SES explained nearly all of the apparent differences between language-minority and language-majority students in both countries. This represented a much greater reduction for the United States, indicating greater confounding of SES and home-language backgrounds.
Similarly, United States-specific evidence from national datasets suggests moderately sized differences between language-minority and language-majority learners that decline to small or trivial magnitudes when adjusting for SES. Specifically, analyses of ECLS-K indicated a moderately sized reading achievement gap (0.48 SDs) in Grade 3 that became very close to 0 after adjusting for an SES composite and school concentration of poverty (see also Reference KiefferKieffer 2008, Reference Kieffer2011). Results for the Grade 5 wave of ECLS-K were similar. NAEP 2015 results indicated a moderately sized gap (0.35 SDs) that became small when adjusting for students’ eligibility for free or reduced-cost lunch (0.15 SDs). Across these datasets, US language-minority learners demonstrated reading levels that were substantially below national averages, but quite similar to those of their language-majority counterparts from similar SES backgrounds.
2.4.3 Linguistic Diversity and Adolescent Reading Development
In contrast to evidence for early childhood vocabulary and childhood reading, the PISA 2009 and 2018 data indicate relatively small US reading achievement differences by home language in adolescence (0.33 and 0.27 SDs, respectively); see Table 2.6. These differences were also somewhat smaller than OECD averages. Moreover, for the 2009 PISA, when adjusted for SES (using the PISA composite), this difference reversed in direction, such that language-minority learners outperformed language-majority learners to a small degree (-.10 SDs).Footnote 1 For Canada, PISA data indicated a small gap (0.13 in 2009, 0.24 in 2018) by home language that was notably smaller than the OECD averages. Adjusting for SES, the 2009 gap was reduced somewhat (to 0.08 SDs). Here, language-minority children included those who spoke a language other than the dominant language(s) “most of the time” at home.
Table 2.6 Effect-size estimates of differences in reading comprehension by home language in adolescence
| Comparison | Data source | United States | Canada | OECD average |
|---|---|---|---|---|
| By home language background (between students of immigrants who speak a nondominant language at home most of the time) | PISA 2009 (age fifteen) | 0.33 | 0.13 | 0.57 |
| PISA 2009 (age fifteen) adjusted for SES composite | -0.10 | 0.08 | 0.35 | |
| By home language background (between students who speak a nondominant language at home most of the time and children who do not) | PISA 2018 (age fifteen) | 0.27 | 0.24 | 0.57 |
| By home language background (between students with and without a primary language other than English at home at kindergarten entry) | Reference KiefferKieffer (2011) using ECLS-K (Grade 8) | 0.35 | ||
| Reference KiefferKieffer (2011) using ECLS-K (Grade 8); adjusted for family SES composite and school concentration of poverty | -0.18 | |||
| By Home Language Background (between students reporting speaking a language other than English at home all or most of the time vs. never) | NAEP 2015 (Grade 8) | 0.34 | ||
| NAEP 2015 adjusted for free/reduced lunch status and parental education | 0.02 |
Note: Positive values indicate better performance for language-majority speakers, while negative values indicate better performance for language-minority learners.
Similarly, United States-specific evidence from NAEP 2015 suggests a moderately sized reading-achievement gap in Grade 4 (0.34 SDs). As with PISA, the NAEP gap declined to a trivial size (0.02 SDs) when adjusting for SES (indexed by student eligibility for free or reduced-cost lunch and student-reported parental education). In additional converging evidence from ECLS-K, the United States reading-achievement gap by home language in Grade 8 was smaller than in earlier grades and reversed in direction to favor language-minority learners when adjusting for SES (Reference KiefferKieffer, 2011).
2.4.4 Summary of Home Language Differences
Looking across time, we see that large vocabulary differences between language-minority and language-majority students in both countries at kindergarten entry turn into moderate differences in reading in the United States and small differences in Canada by middle childhood. By adolescence, these differences become small-to-moderate in the United States and remain small in Canada. Moreover, while SES differences do not explain much of these initial vocabulary differences in kindergarten, they do explain a substantial proportion of later reading differences in middle childhood and adolescence. Comparing students from similar SES backgrounds in later grades, we find only small-to-trivial differences between language-majority and language-minority students, with some analyses indicating better performance for language-minority learners. Given the greater confounding of SES and language background in the United States, more of the observed differences are explained by the low SES, on average, for language-minority learners in the United States, compared to Canada.
2.5 Conclusions and Discussion
Despite some limitations in comparability across nationally representative datasets – both between countries and between developmental periods – some general conclusions emerge from this evidence. First, achievement differences by SES in both countries are large across early childhood, childhood, and adolescence, with larger differences in the United States than in Canada whenever comparisons are possible (i.e., early childhood and adolescence). Second, achievement differences by home language background in both countries are the largest for vocabulary in early childhood, moderate or small for reading in childhood, and relatively small for reading in adolescence. Third, for childhood and adolescent reading, differences by home language are much larger in the United States than in Canada, but this cross-country difference narrows or disappears when accounting for differences in students’ SES. We discuss each of the general conclusions below.
2.5.1 Promoting Equity across SES Differences
Our conclusions regarding SES echo those of Reference Bradbury, Corak, Waldfogel and WashbrookBradbury et al. (2015) and provide further support for their suggestion that structural inequalities in both the United States and Canada prevent far too many students from low-SES backgrounds from reaching their potential to become skilled readers. As Reference Reardon, Duncan and MurnaneReardon’s (2011) analyses of national US datasets from the 1940s through the 2000s suggest, these inequalities are greater now than they have ever been since the government began collecting such data. Canada appears to have had some success relative to the United States, but does not escape notable SES differences. Indeed, achievement differences in both countries are large across early childhood, childhood, and adolescence. (For an international perspective, see Nag, Chapter 15 in this volume.)
From an ecological perspective, this relative success on the part of Canada in producing more equal outcomes might reflect influences at local levels (e.g., differences in childcare experiences) as well as influences at broader levels that prioritize social supports (e.g., maternity leave, universal healthcare). Bradbury et al. note these public investments in families as key levers that promote more equity in Canada and that should be considered in public policy discussion about education in the United States. Noting the larger differences by SES in the United States than in Canada at school entry, they argue for the particular importance of investment in early childhood development – including evidence-based preschool and parenting-support programs as well as income-support programs to reduce poverty and its associated stresses among families with young children. Historically, the United States has made large investments in K-12 education, while leaving working families on their own to pay for the education and development of children before age five – precisely the time at which children’s brain development is most influenced by environmental affordances (e.g., Reference Yoshikawa, Raver and MorrisYoshikawa, Raver, & Morris, 2016).
At the same time, our results suggest that both countries could also do more to promote equity among elementary and secondary students. There is a strong and growing global research base on which to recommend specific instructional approaches for improving reading outcomes and how they can be tailored and implemented to meet the needs of students from low-SES backgrounds. From systematic phonics instruction to rich oral-language instruction, many curricula and instructional approaches have been found to be particularly beneficial to students from low-SES backgrounds (see Dickinson et al., Chapter 17, and Schwartz, Chapter 19, in this volume). Although instructional questions remain, we certainly know enough to improve classroom reading instruction in important ways.
2.5.2 Understanding Linguistic Diversity in Relation to SES
Our conclusions regarding language-minority learners underscore the long-term nature of the process of learning to become a proficient reader in a second language. The fact that language-minority students arrive at school with underdeveloped second-language vocabulary but many go on to catch up with their language-majority peers by adolescence aligns with a wide consensus that language learning is a long-term developmental process (National Research Council, 2017). Despite this widespread consensus, educational policies and practices continue to emphasize the short-term underperformance of language-minority learners in ways that may actually hurt their long-term success (e.g., Reference Hopkins, Thompson, Linquanti, Hakuta and AugustHopkins et al., 2013; Reference Kieffer and ThompsonKieffer & Thompson, 2018). In particular, many US policies and practices focus attention on the subset of language-minority learners who are currently and temporarily classified as English learners. This group is defined by their current lack of proficiency in speaking, listening, reading, and writing English. Thus, differences between this selected subgroup and native English speakers is a “gap that can’t go away” (Reference Saunders and MarcellettiSaunders & Marcelletti, 2013, p. 139). Recent analyses of NAEP data over time (Reference Kieffer and ThompsonKieffer & Thompson, 2018) indicate that when one analyzes the entire population of language-minority or multilingual learners, one finds they have made substantial progress in reading and math that is not apparent when analyzing only current English learners.
At the same time, the data provide some support for the hypothesis that the process of learning the dominant language and catching up with language-majority peers is quicker in Canada than in the United States. Canadian gaps by home language are similar to US gaps in early childhood vocabulary, but much smaller by Grade 4. In addition to the social supports described in Section 2.5.1, these differences might reflect how Canadian provinces tend to have intentional educational policies in place to support immigrant students in learning the language of instruction (OECD, 2006). Such policies, in turn, might reflect macrosystem values as reflected in Canada’s commitment to the protection and preservation of multiculturalism through federal law (i.e., Canadian Charter of Rights and Freedoms, 1982; Multiculturalism Act, 1985). That said, it is important to note that Canada is not immune to anti-immigrant and xenophobic sentiments; a recent report on Canadian public opinion revealed that 64 percent of respondents felt that Canada accepts too many immigrants from racial minority groups, and 50 percent felt too many immigrants coming into Canada were not adopting Canadian values (Environics Institute for Survey Research, 2019). Nonetheless, it does appear that Canada’s commitment to multiculturalism creates a more conducive learning environment for immigrant students compared to countries without explicit educational integration policies (OECD, 2006); if so, this may be an example of policy making a difference in spite of countervailing popular sentiment. However, before one takes too rosy a view of Canada’s relative success with language-minority learners, it is worth reiterating that its selective immigration policies favor highly educated and skilled parents.
In addition, our conclusions underscore how much the achievement of US language-minority learners may be constrained by structural inequalities associated with their disproportionately low SES. Although converging evidence suggests that US language-minority learners catch up with their peers from similarly low-SES backgrounds, this is a low bar, given the poor performance of those peers. One potential implication is that US educators may be overemphasizing the need for interventions specific to language-minority and English learners, rather than integrating such efforts into broader approaches to reduce inequalities by socioeconomic status.
This pattern of confounding SES and home language background does not appear to the same extent for Canada. This is likely due to the fact that very different immigration policies and practices are in place in Canada than those in the United States, but also perhaps to a variety of Canadian social policies that reduce the structural inequalities that would otherwise constrain the reading development of both language-minority learners and students from low-SES backgrounds.
2.5.3 What We Can’t Learn from Current Large-Scale Datasets
Although the available data support some interesting conclusions, there remain many questions that cannot be easily answered from the existing large-scale datasets. First, although national and international assessments provide valuable insights into reading development, they pay little or no attention to writing development in either country. Given the importance of writing in college success and access to meaningful employment (e.g., Reference Levy and MurnaneLevy & Murnane, 2004), more attention to writing in large-scale research is warranted. Similarly, oral language is rarely assessed and when it is, it is assessed in superficial ways, despite its key role in literacy development (e.g., Reference Snow, Burns and GriffinSnow et al., 1998). In addition, returning to the ecological approach we have described, there are many variables within the exosystems (e.g., neighborhood contexts, school practices) and microsystems (e.g., instructional practices) that cannot be captured effectively by national and international assessments.
Second, the differences between the United States and Canada in their systems and investment in collecting educational achievement data mean that we have more complete answers for many questions about achievement differences in the United States than we have for Canada. Unlike the United States, Canada maintains few national data-collection systems – in education or otherwise – leaving to individual provinces and territories the responsibility of identifying, collecting, and tracking relevant metrics, including demographic identifiers such as race/ethnicity or Indigenous status. In the context of education, individual provinces/territories implement regular testing programs that focus primarily on language arts and numeracy in both elementary and high school, with some provinces also assessing science and social studies in high school. However, there is little consistency across provinces/territories in what content is assessed or when, resulting in functional barriers to making comparisons across demographic groups even if such data were available. Canada also lacks longitudinal datasets, which limits the ability to monitor changes and trends over time.
Third and more problematic in terms of identifying and correcting for structural inequalities as a result of Canada’s colonial history, provinces/territories have not devised a way to monitor achievement gaps between Indigenous and non-Indigenous Canadians, nor are provinces required to disaggregate data by demographic characteristics. Canada’s legacy of the genocide of Indigenous peoples is well documented (Truth and Reconciliation Commission of Canada, 2015), but Canada also has a history of discrimination against immigrants of Asian and African descent (Reference Ambrose and MuddeAmbrose & Mudde, 2015). The inability to comparably disaggregate data across provinces/territories obscures the successes of marginalized communities and failures of the education system for historically disenfranchised groups over time. This is especially concerning for Indigenous communities, who have experienced repeated neglect from the Canadian government. A recent call to action by Indigenous leaders explicitly summons the federal government to regularly publish educational attainments of Indigenous peoples compared with non-Indigenous peoples (Truth and Reconciliation Commission of Canada, 2015). There is also a need to move beyond standard testing programs that focus only on academic attainment to include outcomes that are important for Indigenous peoples, such as the social, physical, and spiritual wellbeing of individuals and communities (Reference Friesen and KrauthFriesen & Krauth, 2012). The most important message for Canadian policymakers is to work with Indigenous communities to ensure that the right data are collected, policies written, and programs implemented.
2.5.4 Structural Inequalities and Reading Development Revisited
Even now, decades into the twenty-first century, the promises of public education to be the great equalizer remain unfulfilled. In the United States and Canada, structural inequalities in opportunities to learn the complex reading skills required for the global economy persist. So, too, do the legacies – and continuing practices – of racism, classism, xenophobia, and oppression of Indigenous peoples, thereby perpetuating structural inequalities inside and outside of schools. To begin to address unequal outcomes in a real way, we must begin by considering how we make sense of the differences in achievement that we see (see also Navas, Chapter 3, Araújo and da Costa, Chapter 5, and Morgan et al., Chapter 10 in this volume). Too often, these are interpreted as evidence of how students from low-income or language-minority backgrounds are failing to reach the standards set by the educational system; too rarely are these differences interpreted as evidence of how the system is failing them.
3.1 Introduction
According to UNESCO, some 250 million children worldwide are functionally illiterate, even if 50 percent of them have spent at least four years in school (UNESCO, 2014). Despite several efforts to achieve proper literacy development levels, challenges and obstacles remain for several developing countries, including most of South America. In this continent, underachievement encompasses sociocultural, economic, and political factors that affect education in general, and especially reading instruction policies, to different degrees. Substantial efforts have been made so far, and South America, with a diverse population of near 431 million (United Nations Department of Economic and Social Affairs, 2019), has achieved several educational goals in the past decade. Primary-school coverage has become almost universal, and average years of schooling approach those of the developed countries. Nevertheless, even if illiteracy has mainly decreased, the quality of literacy skills remains poor for both children and adults.
This chapter presents some detailed demographics on the status of literacy development in South America. It discusses public policies and the choice of reading instruction method, one aspect that likely has had a strong influence on the development of reading skills throughout several countries of this continent.
3.2 Demographics and Literacy Development in South America
South America is composed of thirteen countries (Argentina, Brazil, Bolivia, Chile, Colombia, Uruguay, Paraguay, Peru, Ecuador, Suriname, Guyana, French Guyana, and Venezuela). To set the stage for our discussion on literacy, it seems valuable to provide demographic data such as those on population estimates, density, socioeconomics, and, for our purposes, the sociolinguistic characteristics of the region.
The population density in South America, on average, is twenty-four per square kilometer, with considerable variation in this number according to locality. Brazil accounts for almost 50 percent of the population of the region; it is the sixth most populated country in the world, and the largest in size in South America (land area of 8,358,140 km2). Table 3.1 presents population estimates and corresponding densities, as well as estimates of the Indigenous population of each country in South America (UNESCO Institute for Statistics, 2020).
Table 3.1 Total population, density, and Indigenous population estimates for countries in South America
| Abbreviation | Country | Population 2020 | Density (people per km2) | Indigenous population |
|---|---|---|---|---|
| BR | Brazil | 212,559,420 | 24.96 | 817,963 |
| CO | Colombia | 50,882,890 | 44.57 | 1,900,000 |
| AR | Argentina | 45,195,770 | 16.26 | 955,032 |
| PE | Peru | 32,971,850 | 25.65 | 5,900,000 |
| VE | Venezuela | 28,435,940 | 31.03 | 724,592 |
| CL | Chile | 19,116,200 | 25.28 | 2,100,000 |
| EC | Ecuador | 17,643,050 | 63.73 | 1,000,000 |
| BO | Bolivia | 11,673,020 | 10.63 | 4,100,000 |
| PY | Paraguay | 7,132,540 | 17.54 | 117,150 |
| UY | Uruguay | 3,473,730 | 19.19 | 76,452 |
| GY | Guyana | 786,550 | 3.66 | 78,492 |
| SR | Suriname | 586,630 | 3.58 | 20,344 |
| GF | French Guiana | 298,680 | 3.58 | 19,000 |
Regarding the languages of the region, most countries have adopted Spanish as the official language except for Brazil, where Brazilian-Portuguese is the official language; Suriname, with Dutch; and Guyana, where English is the official language spoken. Portuguese and Spanish are represented by alphabetic orthographies, which are, for the most part, transparent; more so in Spanish than in Brazilian-Portuguese (Reference Scliar-CabralScliar-Cabral, 2012; Reference Ijalba and ConnerIjalba & Conner, 2006). Because of the large Indigenous population, especially in Bolivia, Ecuador, Peru, Chile, and Colombia, several native languages are spoken with no corresponding writing system. In Bolivia, for example, it is estimated by the National Institute of Statistics of Bolivia that 40.8 percent of children older than six years old are bilingual, 46.8 percent are monolingual in Spanish, and 11.1 percent are monolingual in an Indigenous language, with 27.6 percent speaking Quechua and 18.5 percent Aymara. Bolivia’s constitution, in effect since February 2009 recognizes, thirty-six languages of the Indigenous people of Bolivia as official languages apart from Spanish (i.e., Aymara, Araona, Baure, Bésiro, Canichana, Cavineño, Cayubaba, Chácobo, Chimán, Ese Ejja, Guaraní, Guarasu’we, Guarayu, Itonama, Leco, Machajuyai-Kallawaya, Machineri, Maropa, Mojeño-Trinitario, Mojeño-Ignaciano, Moré, Mosetén, Movima, Pacawara, Puquina, Quechua, Sirionó, Tacana, Tapiete, Toromona, Uru-Chipaya, Weenhayek, Yaminawa, Yuki, Yuracaré, and Zamuco). Therefore, Bolivian states must adopt Spanish officially, and at least one additional official language according to the preference of the region.
Across all countries in South America, laws and regulations aim to protect Indigenous languages and cultures and recognize the importance of intercultural bilingual education for Indigenous children. However, there is still a strong historical trend for Indigenous languages and cultures to vanish. Support for such education is a path to reversing this tendency, but it needs to be implemented carefully, which is often not the case. To worsen the scenario, of the Spanish-speaking countries 78 percent of the Indigenous child population live in poverty, as compared to 40 percent of those whose mother tongue is Spanish only (UNICEF, 2012). This inequality is more significant in the ethnic groups living in the Amazon basin, where almost half the children live in extreme poverty.
Throughout South America, educational reforms that promote intercultural bilingual education have been implemented in conjunction with national language policies that officially recognize Indigenous languages (Reference King and BrownKing, 2008). There are some excellent examples of successful programs, even though the Indigenous population is still the least literate in the region. Education in Peru has historically ignored the first language of Indigenous children and has imposed Spanish as the primary language for reading instruction in schools. However, there have been some efforts to offer a Quechuan education for children of Quechua-speaking parents, and the comparison with Spanish-language education may play a role in ameliorating the Indigenous performance in national tests (Reference Hynsjö and DamonHynsjö & Damon, 2016).
Based on the data collected in the latest version of the Third Regional Comparative and Explanatory Study – TERCE, Reference DelpratoDelprato (2019) investigated whether Indigenous families have lower educational expectations than non-Indigenous families and whether lower Indigenous parental schooling expectations are linked to lower learning achievements by their children. The study included students attending sixth grade (UNESCO-OREALC, 2016) from the following countries: Argentina, Brazil, Chile, Colombia, Ecuador, Guatemala, Honduras, Mexico, Nicaragua, Panama, Paraguay, and Peru. Overall, the results showed that Indigenous parents educational expectations for their children are lower than those of non-Indigenous parents but, once external constraints are accounted for (at the family and school levels), the Indigenous parents’ expectations gap tends to disappear.
The Indigenous population in South America still faces several obstacles to achieving adequate reading competence, whether related to the language of instruction, poverty, discrimination, or low educational expectations. Policymakers should focus on Indigenous students who speak native languages at home, since this group would benefit from intercultural and bilingual education. Such an approach to native language would lower the gaps in literacy achievement, particularly during the first grades, and would certainly help their transition to either the Spanish or Portuguese curriculum. In terms of the discussion of the Indigenous population’s literacy levels in South American countries, it is crucial to consider the relevant points raised by Reference DelpratoDelprato (2019) on the concept of “indigenous literacy.” The author illustrates the case of Quechuan literary practices, which were discontinued after colonization since they were contrary to European traditions (alphabetic writing). Furthermore, the pressure to impose a way to representing an Indigenous spoken language using a given writing system, such as the alphabet, may in itself exemplify the vulnerability of such minority groups. Any attempt to promote the literacy of Indigenous people should consider them essential to decision-making processes.
Another relevant aspect of the demographics of the region is the high variability of the socioeconomic status of South American countries, with substantial differences between private and public education systems, specially for the early years of schooling. This educational inequality is still a reality in South America, and it is evident that there are vast disparities across regions, and within each of the thirteen countries. In this scenario, the question of access to education has been a priority, and most countries have moved their figures to reasonable levels of enrollment in the past decade, as shown in Table 3.2. Uruguay has a total rate of 99.49 percent enrollment in all levels of education in the country with the highest enrollment rates. Guyana is the country with the lowest enrollment rate, with a value of 85.03 percent of the school-age population (UNESCO, 2014).
Table 3.2 Adjusted net enrollment rate (%), one year before the official primary entry age
| Country | Year | |||||
|---|---|---|---|---|---|---|
| 2013 | 2014 | 2015 | 2016 | 2017 | 2018 | |
| Argentina | 97.50 | 99.19 | 99.27 | 99.31 | 97.82 | .. |
| Bolivia | 80.12 | 82.96 | 85.41 | 91.27 | 90.81 | 90.12 |
| Brazil | 89.55 | 92.25 | 90.87 | 97.45 | 98.05 | .. |
| Chile | 93.13 | 95.65 | 95.10 | 95.52 | 93.60 | .. |
| Colombia | 88.56 | 89.19 | .. | .. | 89.42 | 99.23 |
| Ecuador | 98.48 | 98.80 | 98.22 | 97.83 | 97.66 | 94.59 |
| French Guiana | ||||||
| Guyana | ||||||
| Paraguay | .. | .. | .. | 69.49 | .. | .. |
| Peru | 92.40 | 96.54 | 99.47 | 99.59 | 99.38 | 99.23 |
| Suriname | 87.23 | 90.21 | 94.19 | 93.22 | 86.99 | 90.27 |
| Uruguay | 99.64 | 99.89 | 99.83 | 99.52 | 98.29 | .. |
| Venezuela (Bolivarian Republic of) | 80.29 | 90.54 | 94.19 | 87.68 | 85.80 | .. |
Note: There were no data available for Guyana and French Guiana
Some countries have adopted strong public policies to achieve these numbers, both for the general population and, more specifically, for the most vulnerable sectors. The Colombian school voucher program, PACES, aims to facilitate the enrollment and attendance of low-income students at better-quality schools (Reference Angrist, Bettinger, Bloom and KingAngrist et al., 2002). In contrast, a comparable program in Chile (Reference Anand, Mizala and RepettoAnand et al., 2009) provides students with the financial resources to attend schools in more conducive environments. This program also aims to discuss the relevance of education to achieving proper professional training. In parallel, and as early as 1996, with the publication of the National Education Guidelines and Framework Law (the Lei de diretrizes e bases da educação, or LDB), Brazil implemented a basic curriculum in primary and secondary education, increased the number of teaching days, and created a system for the evaluation of educational institutions at all levels. These changes increased options for the integration of vocational education, with considerations for special and Indigenous education. Since then, primary education has been mandatory, and states and municipalities have the legal obligation to provide openings in the public-school system for every child enrolled from first to ninth grade.
Table 3.3 takes a closer look at the advance of enrollment in the Brazilian education system. Even though the average enrollment rate is low for high-school level (71.1 percent), the figures are higher (up to 99.7 percent) for the age range corresponding to primary education (six to fourteen years old), which is mandatory in Brazil.
Table 3.3 Rate of enrollment (%) by age range (education level) in Brazil
| Age/Year | 2012 | 2013 | 2014 | 2015 | 2016 | 2017 | 2018 | 2019 |
|---|---|---|---|---|---|---|---|---|
| 6-14 y | 98.4 | 98.5 | 98.6 | 98.7 | 99.2 | 99.2 | 99.3 | 99.7 |
| 15-17 y | 61 | 62.3 | 64.2 | 65.4 | 67.3 | 67.5 | 68.7 | 71.1 |
This picture reveals unambiguously that access to education has been dealt with seriously by South American governments. The next challenge is to increase the quality of education and to enhance investment into the different levels of education. Investments should range from infrastructure, better curricula for all levels of education, and better salaries to the promotion of evidence-based initial teacher training. What matters is not only the amount of public expenditure on education but also spending it better. Table 3.4 depicts the percentage of expenditure in relation to Gross Domestic Product (GDP) over the past few years for some countries. As a comparison, Finland saw an average of 7 percent of government expenditure on education in this period, whereas, for these countries in South America, the expenditure ranged from 3.30 to at most 6.32 percent of GDP.
Table 3.4 Government expenditure on education as a percentage of GDP (%), South American countries
| Country | Year | ||||||||
|---|---|---|---|---|---|---|---|---|---|
| 2011 | 2012 | 2013 | 2014 | 2015 | 2016 | 2017 | 2018 | 2019 | |
| Argentina | 5.29 | 5.35 | 5.44 | 5.36 | 5.78 | 5.55 | 5.46 | ||
| Brazil | 5.74 | 5.86 | 5.84 | 5.95 | 6.24 | 6.31 | 6.32 | ||
| Chile | 4.05 | 4.53 | 4.73 | 4.88 | 5.34 | 5.42 | |||
| Colombia | 4.47 | 4.37 | 4.88 | 4.63 | 4.47 | 4.48 | 4.54 | 4.46 | |
| Ecuador | 4.73 | 4.64 | 5.00 | 5.26 | 5.00 | ||||
| Guyana | 3.59 | 3.18 | 5.85 | 5.21 | 6.06 | 6.23 | 5.49 | ||
| Peru | 2.66 | 2.92 | 3.30 | 3.70 | 3.97 | 3.81 | 3.93 | 3.72 | 3.85 |
| Paraguay | 3.70 | 3.67 | 3.44 | ||||||
| Uruguay | 4.36 | 4.76 | 4.84 | 5.05 | |||||
Note: There were no data available for Bolivia, French Guiana, Suriname, or Venezuela.
Reference Salazar-CuéllarSalazar-Cuéllar (2014) has provided a thorough analysis of investment in education digging deeper than the literal figures involved and describes the case of Colombia as an example of how and where money should be best invested to provide better educational outcomes. The main question is of how much better educational systems could perform, given the current public expenditure levels. Along these lines, some initiatives involve public policies aimed at improving reading-promotion activities across the country. One example comes, once again, from the Colombian government, which has increased the number of regular readers and access to books across the age range and promoted reading through the construction and organization of public libraries throughout the country. Between 2006 and 2014, 1,404 public libraries were built in Colombia (Ministerio de Cultura, COLOMBIA, 2006). Reference Álvarez-Zapata, Nayrobis, Santamaría and MaricelaAlvarez-Zapata et al. (2008) performed an analysis of the initial impact of public libraries in Colombia and showed positive effects on reading habits, recognizing the excellent quality of training programs for librarians and library personnel.
To evaluate the impact of wealth inequalities on learning for six Latin American countries, Reference Delprato, Köseleci and AntequeraDelprato, Köseleci, and Antequera (2015) used PISA data for 2000 and 2012. The authors used a multilevel analysis to assess the variability of achievement which accounted for student- and school-specific factors as well as heterogeneity of the types of inequalities across schools and time. The conclusion was that access alone did not guarantee an adequate level of academic achievement.
The data for PISA 2018 (OECD, 2019) also show better performance in reading and science for Chile. Overall, for reading and science scores, the six countries in South America that participate in PISA still show a higher number of students at the lowest levels (Levels 1 and 2). Colombia and Peru have improved their reading scores compared to their previous participation in PISA but are still far from the level of literacy expected (Table 3.5).
Table 3.5 Percentages of students for PISA reading and science scores, by PISA proficiency levels and country, 2018
| Reading | Year | Country | Level 1 | Level 2 | Level 3 | Level 4 | Level 5 | Level 6 |
|---|---|---|---|---|---|---|---|---|
| 2018 | Chile | 28 | 33 | 24 | 12 | 2 | # | |
| Colombia | 48 | 30 | 16 | 6 | 1 | # | ||
| Argentina | 51 | 27 | 16 | 5 | 1 | # | ||
| Brazil | 50 | 25 | 16 | 7 | 2 | # | ||
| Peru | 51 | 29 | 14 | 5 | 1 | # | ||
| Uruguay | 39 | 31 | 20 | 8 | 1 | # |
| Science | Year | Country | Level 1 | Level 2 | Level 3 | Level 4 | Level 5 | Level 6 |
|---|---|---|---|---|---|---|---|---|
| 2018 | Chile | 36 | 33 | 23 | 8 | 1 | # | |
| Colombia | 50 | 30 | 15 | 4 | # | # | ||
| Argentina | 53 | 27 | 15 | 4 | # | # | ||
| Brazil | 55 | 25 | 14 | 5 | 1 | # | ||
| Peru | 55 | 29 | 13 | 3 | # | # | ||
| Uruguay | 44 | 31 | 19 | 6 | 1 | # |
# Rounds to zero. Level 1(1a, 1b, below1b)
Note: Percentages may not sum to 100 because of rounding. Some apparent differences between estimates may not be statistically significant.
Another source of information on student achievement is the Third Regional Comparative and Explanatory Study (Latin American Laboratory for the Assessment of Quality in Education, 2015), an initiative of the Latin American Laboratory for Assessment of the Quality of Education (LLECE) in conjunction with its member countries. This study seeks to evaluate the learning achievements of third- and sixth-grade students and identify the associated factors. The TERCE accessed skills in mathematics, reading, writing, and natural sciences, among third and sixth graders, across sixteen countries in Latin America. This institution also applies questionnaires to obtain information on students and their families, teachers, and schools, helping to identify the factors that have the most definite impact on pupils’ learning. The results from the third-grade reading test show that 61 percent of students are within performance levels I and II, related to the comprehension of familiar texts and the use of explicit information from the text. The results of the sixth-grade reading test show that 70 percent of students are within performance levels I and II, related to the comprehension of text based on explicit and implicit elements that enable making inferences regarding the meaning of the text (Table 3.6).
Table 3.6 Distribution of Latin American countries compared to the average scores for the region for reading and mathematics for third- and sixth-grade students at the TERCE (2015)
| Area | Grade | Below | At average | Above |
|---|---|---|---|---|
| Reading | 3rd | Guatemala, Honduras, Nicaragua, Panama, Paraguay, Dominican Rep. | Argentina, Brazil, Colombia, Ecuador | Chile, Costa Rica, Mexico, Peru, Uruguay |
| Reading | 6th | Ecuador, Guatemala, Honduras, Nicaragua, Panama, Paraguay, Dominican Rep. | Argentina, Peru | Brazil, Chile, Colombia, Costa Rica, Mexico, Uruguay |
| Mathematics | 3rd | Guatemala, Honduras, Nicaragua, Panama, Paraguay, Dominican Rep. | Colombia, Ecuador | Argentina, Brazil, Chile, Costa Rica, Mexico, Peru, Uruguay |
| Mathematics | 6th | Guatemala, Honduras, Nicaragua, Panama, Paraguay, Dominican Rep. | Brazil, Colombia, Ecuador | Argentina, Chile, Costa Rica, Mexico, Peru, Uruguay |
An analysis of TERCE’s main results corroborates that inequity in the distribution of learning across different social strata remains a continuing crucial issue, both between and within countries. A leading causal agent is the countries’ economic status. Specifically, production and distribution of income might be a simple explanation of why higher-income countries such as Chile and Uruguay generally show better results, as seen in the performance of the Second Regional Comparative and Explanatory Study (2013). However, the relationship between socioeconomic status and reading outcomes is complex, and many other factors may play a role in this equation (Reference Duncan and MagnusonDuncan & Magnuson, 2012).
3.3 Teacher Training and Reading Instruction in South America
One of the many aspects involved in the discussion of students’ underachievement in international and local assessments in South American countries has been the deficient initial teacher training provided in those countries, especially for those in charge of the early stages of reading instruction. This discussion necessarily involves methods of instruction; a long-standing universal debate has concerned recommended approaches for reading instruction, for example, analytic versus synthetic methods.
The science of reading has produced a vast amount of evidence toward an understanding of the underlying mechanisms that support skilled reading, how reading should be taught, and the leading causes of reading difficulties in the contexts of many different languages and writing systems around the world (e.g., Reference SeidenbergSeidenberg, 2013; Reference MoraisMorais, 2014). Scientific evidence does suggest that a phonological approach is crucial in the early stages of visual word recognition in orthographies such as Spanish or Portuguese (Reference Liberman, Shankweiler, Fischer and CarterLieberman et al., 1974; Reference Cardoso-MartinsCardoso-Martins, 1991, Reference Cardoso-Martins, Joshi and Aaron2013; Reference Castro, Andrade and BarreraCastro, Andrade, & Barrera, 2019; Reference Manrique and SignoriniManrique & Signorini, 1994). Reference Duncan, Castro and DefiorDuncan et al. (2013) investigated phonological development concerning native language and literacy in six alphabetic orthographies, including Portuguese and Spanish, at the beginning and end of the first year of reading instruction. Based on their results, they argue that phonics instruction promotes an early metaphonological capacity to manipulate phonemes. Additionally, based on another study comparing different orthographies, single-word reading level should be achieved among several languages after one year of formal instruction, especially in those with a transparent orthographic system (Reference Seymour, Aro and ErskineSeymour, Aro, & Erskine, 2003). However, for students in several countries in South America, performance in reading tasks was low, both at the decoding and comprehension levels. This is true even though the orthographies are transparent and straightforward, as in Portuguese or Spanish.
In the United States, the National Reading Panel (National Institute of Child Health and Human Development; NRP, 2000) performed a comprehensive evidenced-based review on how children learn to read. Over 100,000 studies published on reading since 1966–2000 were reviewed, and some areas were found to be crucial for reading instruction: for example, phonemic awareness, phonics, fluency, vocabulary, and comprehension. In the United States, where several public policies have emphasized the importance of language and phonological processing aspects in grasping the alphabetic principle, there is still a strong need for changes in the content of initial teacher-training programs. Information about the psychology of reading may be theoretical but also translate into practical situations in the classroom; in other words, there is still a need for teachers to acquire structured skills on the psychology of reading and apply this knowledge from research on reading instruction (Reference Brady, Brady, Braze and FowlerBrady, 2018).
Reference Godoy and VianaGodoy and Viana (2016) compared the linguistic content related to the teaching of reading in two training programs for literacy teachers in Brazil and Portugal. The researchers analyzed two official programs: (a) in Brazil, the National Pact for Literacy at the Right Age (Pacto Nacional pela Alfabetização na Idade Certa – PNAIC) and (b) in Portugal, the National Program for Portuguese Teaching (Programa Nacional do Ensino do Português – PNEP). Whereas the analysis showed similarities regarding duration, number of hours, and material provided, the theoretical approach differed. In Portugal, the program was rooted in theoretical cognitive psychology and linguistics, whereas the Brazilian equivalent lacked references to phoneme awareness or letter-sound correspondences, under a dominant constructivist approach. Hence, only in the former case was the importance of language and metalinguistic abilities for reading and writing development explicitly mentioned.
Other countries have also proposed revisions of initial teacher-training programs to guarantee that teachers implement oral language instruction and intervention based on precursors of reading development (Reference Morales, Barrios, Moscoso and FrancoMorales et al., 2015). In Chile, the program entitled “Aprendizaje Inicial de la Lectura Escritura y Matemáticas” still recommends explicitly integrating the contributions of the whole-language approach, which promotes immersion in a world of print, with contributions from the skills approach, including phonics.
Across South American countries, whole language is the dominant approach to teaching reading in the public educational system. Brazil, Argentina, and Colombia have favored top-down methods, such as whole language (Reference MoraisMorais, 2014). In recent years, Chile and Uruguay have shifted to adopt a skill-based or a mixed approach in reading instruction, and even though the new policy is still recent, it may already have had some impact since both countries have since shown higher levels of achievement compared to their neighbors. In Brazil, the Ministry of Education released “The National Program for Reading at the Adequate Age” (Ministério da Educação, BRASIL, 2012), which proposes that third-grade students should have minimal reading skills. A couple of teacher-training programs have enhanced the initial reading instruction process, but according to Reference MoraisMorais (2014), these programs misinterpreted phonics reading instruction and ignored the scientific evidence on learning to read. The main point of his criticism relates to the fact that teacher-training programs present wrong ideas on the concept of phonics instruction and promote the teaching of isolated sounds with no relation to letters.
Finally, Argentina’s national public policies have moved from a whole-language to a synthetic approach, more specifically one with an emphasis on phonics instruction (Ministerio de Educación de la Nación, ARGENTINA, 2018). In 2019, the government changed the reading instruction policy in Brazil, strongly emphasizing the need to develop basic skills (Ministério da Educação, BRASIL, 2012), as proposed by the National Reading Panel (NRP, 2000), with adaptations for Brazilian-Portuguese language and orthography. It will be possible to estimate the effects of these changes in policies that are based on evidence-based teacher training in the years to come. The proposed program has received criticisms from teachers specially trained in whole language approach, reigniting the conflict between ideologies. Unfortunately, South American countries are far from ending the reading wars (Reference Castles, Rastle and NationCastles, Rastle, & Nation, 2018).
Although there are still some divergent discussions in terms of public policies, the research includes several studies that use evidence-based practices and consider the sociolinguistics characteristics of Portuguese and Spanish. However, there are a limited number of studies on reading for South American Indigenous languages, especially in the early stages (Latin-American and Caribbean Reads Capacity Program, 2016). In Chile, reading and language interventions show improvements after a twenty-seven-week program for low-income, vulnerable communities: The group that received the intervention showed better results than the control group on several skills, including reading comprehension (Reference Mesa, Newbury and NashMesa et al., 2020).
The most emblematic case of a stable public policy on successful reading instruction is found in Sobral, a city of around 207,000 inhabitants in the State of Ceara, Brazil. Since 2001 the students have undergone a process of systematic teaching of early reading and writing skills from kindergarten. The local teacher-training program emphasizes the cognitive sequence for precursors, such as oral language, acquisition of basic reading skills, and focus on reading fluency (Reference BecskehazyBecskehazy, 2018). The fact that this has led to years of increasingly more effective evidence-based reading instruction are verified by the national basic-education ranking, on which Sobral has risen to number 1 out of the country’s more than 5,000 municipalities. Furthermore, on the PISA, Sobral public schools showed higher scores than private schools in São Paulo.
3.4 Concluding Remarks
In the past decade, South America has faced advances and challenges in children’s literacy development. Challenges range from problems related to demographic aspects of the countries (e.g., dense population, enrollment, Indigenous languages) to political and socioeconomic factors (e.g., income-distribution inequality, extreme poverty, high vulnerability, low investment in education). However, there have been some promising advances in research on best practices in reading instruction, some successful experiences of Indigenous education, and the proposition of public policies that promote initial teacher training using evidence-based methods. Considering the complexity of reading instruction and the many challenges faced by the region, if we are to improve literacy development in South American countries, there is an urgent need to overcome socioeconomic barriers and increase the level of investment in primary education, including the establishment of public policies that protect the early development of the most vulnerable children (see also Nag, Chapter 15 in this volume). Moreover, it seems mandatory to improve initial teacher-training quality and continuous education programs focusing on scientifically based knowledge and warrant better opportunities to apply this theoretical knowledge in the form of efficient educational practices (see Dickinson et al., Chapter 17 in this volume).
4.1 Introduction
During the past century, a far-reaching process of decolonization has taken place in the Caribbean, a region of insular territories with mostly native-Creole-speaking communities in between North and South America. However, the processes of the emancipation and liberalization of the colonies did not necessarily lead to self-government of these Caribbean communities. In many cases a political affiliation with the former colonizer remained, as characterized by the use of official languages linked to the colonial past. As a consequence, both indigenous Creoles and colonial languages, such as Spanish in Cuba, French in Haiti, English in Jamaica, and Dutch in Curaçao, are used in contemporary Caribbean societies. An important question is that of how literacy in the native language and second language(s) in Caribbean states develop in the context of the continued use of colonial languages. Literacy development in a postcolonial setting is not only obviously relevant in education; it can also be seen as a marker of identification and cultural distinctiveness as part of a growing autonomy (see also Navas, Chapter 3 and Morgan et al., Chapter 10 in this volume).
In the present chapter, we consider the postcolonial development of literacy in the Caribbean. First, we highlight the sociolinguistic background of language and literacy planning in native and (ex)colonial languages across Caribbean nations. Special attention is given to the use of these languages in education and the effects on the actual attainment of literacy levels in native and colonial languages across Caribbean states. In addition, the focus is on postcolonial literacy development in the Dutch Caribbean as an interesting case in which the Creole language Papiamentu has become highly valued in the media, education, and other social domains, replacing Dutch. We go into the gradual implementation of Papiamentu literacy in the curriculum, the literacy levels in native Papiamentu, and Dutch as a (foreign) colonial language throughout the primary grades and its relations with school success. Finally, we provide a future perspective on postcolonial literacy development in the Caribbean.
4.2 Literacy Development in the Caribbean
4.2.1 Sociolinguistic Background
Sociolinguistic studies provide evidence that the development of literacy has important consequences for individuals and societal communities. It guides personal and communal communication and serves social, economic, and political actions in society (cf. Reference StubbsStubbs, 2013). In the Caribbean context, as societies make the transition from colonization to autonomy, careful language planning is needed, as well as an appreciation of social and cultural resources which does not exclude the possibility of their utilization. The Caribbean islands are among the Small Island Developing States (SIDS), which were first recognized as a distinct group of developing countries at the United Nations Conference on Environment and Development in June 1992. They include countries that tend to share similar sustainable development challenges, including historical underachievement in terms of school success.
In many cases, a Creole variety is the native language of a location’s inhabitants, or the predominant language heard at home. Creole languages derive from pidgins – language varieties that emerge when groups of people, mostly as a result of population movement, develop a new language by simplifying their own language(s) and adding words and phrases from other contact languages. In case a new generation of learners acquires the emerging variety as their home language, the pidgin is then redefined as a Creole (see Reference SiegelSiegel, 2005). Creoles such as Papiamentu in the Dutch Caribbean and Kwéyòl in St. Lucia are autonomous in that the colonial language is not the lexifier language, whereas Creoles such as Jamaican and Trinidad Creoles can be considered more continuous. Creoles can be seen as contact languages in situations where groups of people have to communicate with each other without the availability of a common language (cf. Reference Migge, Léglise, Bartens, Migge, Léglise and BartensMigge, Leglise, & Bartens, 2010a). The most widely spoken Creole is Haitian Creole with more than 10 million speakers. It is estimated that more than 75 million people speak a Creole as their native language, of which the majority develop literacy in a second language, often the colonial language (Reference SiegelSiegel, 2005).
The focus of language planning in Caribbean societies during the past decades has been on the processes and individual variation of literacy and school success in L1 Creole and L2 colonial language(s). The low educational achievements of these societies can, to a large extent, be explained as resulting from a mismatch between the language of the population (mostly a Creole language) and the school language (mostly the ex-colonial language). Only gradually has investment been provided for the codification and further development of Creole languages. Reports of large numbers of class repeats and school dropouts have urged for a broad scientific evaluation of these countries’ educational systems, with a special focus on the role of Creole language, not only as a school subject but also as a possible tool to enhance the development of literacy and school success in the second language (see Reference Migge, Léglise, Bartens, Migge, Léglise and BartensMigge et al., 2010a). Programs of action have been proposed to assist the SIDS in their sustainable development efforts, with a strong focus on the development of human resources via education. Such programs vary widely and appear to be linked with the nature of the individual Caribbean country’s remaining colonial ties, the nature of linguistic diversity, the developmental state of the indigenous language(s), and the language attitudes among the speakers. In most societies passing through a transitional period from colonial to postcolonial time, the tension between the position of indigenous languages and the colonial language brings about an upgrading of the mother tongues and even a takeover of the position of the colonial language (cf. Reference SiegelSiegel, 2005). Decolonization involves not only the appreciation of the mother tongue over a colonial language, but also the strengthening of autonomy and political power. However, in many cases the drive to displace colonial languages tends to be softened because of economic or political forces, usually resulting in a slowing down of the pace of enactment of new laws. According to Reference ChurchillChurchill (1986), the strengthening of indigenous languages generally proceeds stage-wise. It starts out with recognition of their existence as a vehicle for communication and education in the local community. Then it is followed by an extension, a consolidation, and an adaptation phase, leading to multilingual coexistence.
Depending on the situation in a society, language planning may take different forms (see Reference AgerAger, 2001; Reference Appel, Verhoeven, Arends, Muysken and SmithAppel & Verhoeven, 1994). Usually, the first task in a postcolonial state is to determine which language(s) should fulfill the role of national language. In the vast majority of cases, the colonial language is abandoned in favor of one of the indigenous languages. In addition to processes of language selection, the position of minority languages must be dealt with. Accordingly, decisions need to be made about the developmental support of languages used in a society. A common procedure for language support is that of codification, which can be seen as a prerequisite for the standardization of a language. Codification includes at least an explicit statement of the model for standard language usage via dictionaries, grammars, spelling, punctuation, and pronunciation guides, and reference materials. It is important to note that any language variety is modifiable in such a way that orthographies can be developed and lexical elaboration provided. As Reference SiegelSiegel (2010) has pointed out, the development of a standard form of a Creole differs from that of other language varieties in that the Creole needs to be made autonomous from its lexifier so that it is perceived as a separate language. Moreover, the standardized Creole needs to be accessible to the majority of its speakers.
4.2.2 Educational Background
Language policy primarily manifests itself in two domains: the mass media (including social media) and education. As to the mass media, it is a matter of policy to what extent the (post)colonial and indigenous language will perform public functions in the community. Measures in this domain concern the use of written language in institutions, periodicals, and libraries. As to education, different perspectives can be taken on the legal opportunities for both indigenous and (post)colonial literacy education (Reference SiegelSiegel, 2005). There can be a monolingual approach focusing on the indigenous language, or the colonial language, only. There can also be a transitional model in which the indigenous language is used as a vehicle to better learn to become literate in the second language. Children who have learned the writing code in one language do not need to start from scratch in the other. Basic literacy skills can be easily transferred from one language to the other (Reference Chen, Dronjic and Helms-ParkChen, Dronjic, & Helms-Park, 2015). Finally, there can be a model focusing on full biliteracy. In such a case, literacy instruction may start from the indigenous language, the colonial language, or simultaneously from both languages. For a review of the effects of alternative biliteracy instruction models, see Reference Verhoeven, Kamil, Pearson, Moje and AfflerbachVerhoeven (2010, Reference Verhoeven, Cain, Compton and Parilla2017). Although evaluations of multilingual programs in the Caribbean are only beginning to emerge, it can be concluded that the implementation of Creole literacy in the school curriculum brings about an awareness that the native language can be seen as an educational resource for higher motivation and better learning outcomes among students (Reference PereiraPereira, 2018; Reference SiegelSiegel, 2010).
With respect to literacy development in a Caribbean context, an important question is whether learning to read should be taught first in the child’s indigenous language (L1) and then in the second language (L2); simultaneously; or the other way around. It can be argued that the acquisition of literacy will be facilitated when the instruction links up with the child’s linguistic background (Reference CumminsCummins, 2001). Moreover, the child’s motivation and self-concept may increase if the instruction is given in their native language (Reference SpolskySpolsky, 2000). Importantly, there can be linguistic transfer in bilingual reading instruction in that children who have learned to read in one language do not have to start from scratch in another: What they do have to learn is a new written language code. With respect to the acquisition of academic language skills, Reference CumminsCummins (1991: 85) has hypothesized the role of interdependence as follows: “To the extent that instruction in a certain language is effective in promoting proficiency in that language, transfer of this proficiency to another language will occur, provided there is adequate exposure to that other language (either in the school or environment) and adequate motivation to learn that language.” The interdependence hypothesis predicts that optimal input in one language leads not only to better skills in that language but also to a deeper conceptual and linguistic proficiency that can clearly facilitate the transfer of various cognitive and academic language skills across languages. A high level of proficiency in the first language may thus enhance the development of the second language. However, if skills in the first language are not well developed and education in the early years is in the second language, the further development of the second language may stagnate. Importantly, it is argued that certain aspects of bilingual development may also facilitate the more general cognitive and metalinguistic functioning of children (Reference BialystokBialystok, 2001; Reference VerhoevenVerhoeven, 2007). However, the exact conditions under which language transfer typically occurs and just how particular patterns of bilingual development relate to children’s levels of literacy in L1 and L2 are as yet unclear (Reference Durgunoglu and GoldenbergDurgunoglu & Goldenberg, 2011; Reference Verhoeven, Kamil, Pearson, Moje and AfflerbachVerhoeven, 2010, Reference Verhoeven, Cain, Compton and Parilla2017).
The sociocultural background of children in the Caribbean region may also have a large impact on their language and literacy learning. A first relevant aspect is language exposure. Language input in and outside the home environment may have an impact on children’s L1 and L2 development (Reference Lesaux, Geva, August and ShanahanLesaux & Geva, 2006; Nag et al., 2018). Likewise, the home literacy environment may have a differential effect on children’s (bi)literacy development (Reference Dickinson and NeumanDickinson & Neuman, 2006; Dickinson et al., Chapter 17 in this volume,). Another relevant characteristic is the sociocultural orientation of the child and their parents (see Nag, Chapter 15 in this volume). Parental attitudes toward L1 maintenance and L2 learning may have an impact on the child’s attitudes and motivation (Reference AgerAger, 2001; Reference PereiraPereira, 2018). Apart from family-related characteristics, school-related sociolinguistic factors may also have an impact on children’s language and literacy learning in L1 and L2, such as the teacher’s educational level, teaching experience, language proficiency, and sociocultural orientation (Reference Lemberger and Reyes-CarrasquilloLemberger & Reyes-Carrasquillo, 2011; Nag et al., 2016; Dickinson et al., Chapter 17 in this volume).
Finally, initiatives must be taken to develop and implement (bi)literacy programs in schools. For such programs, two sets of curriculum materials should be made available, besides literary books and reference works in the two languages. For the Creole language, it is extremely important that the lexicon is continuously elaborated with new entries in order to enable the development of curricula for basic, secondary, and higher education. For the colonial language, it is critical that curriculum materials are an ethnically appropriate mirror of the local realities. Another important issue is the availability of qualified teachers. Teachers must be well trained in literacies in the language(s) of instruction in order to be able to offer the planned literacy programs. With reference to the teaching of Creole besides French in Guadeloupe, Reference Bolus, Migge, Léglise and BartensBolus (2010) noted that there is a high load on teachers given the fact that the availability of curricular materials in the Creole languages is limited and they are in short supply, so that teachers have to develop their own curricular materials. Therefore, there is an urgent need for teacher training to ground teachers’ knowledge on biliteracy development and apply this knowledge so as to make their literacy teaching more effective.
4.2.3 Literacy Levels in Caribbean Societies
UNESCO (2013) provided global literacy rates of the adult population (fifteen years and older) in Caribbean countries. Overall, the literacy rate in 2011 was estimated to be 92 percent as compared to 90 percent in 2000 and 86 percent in 1990. A breakdown by gender showed that 55 percent of illiterate people were women. Over the years, the literacy rate has grown faster among females, narrowing the gap with men. There is significant variation between the different territories. In Antigua and Barbuda, the Cayman Islands, Trinidad and Tobago, Aruba, and Costa Rica, the illiteracy rate is less than 5 percent; in Puerto Rico and the Dominican Republic, less than 10 percent; in Jamaica, Honduras, and Guyana less than 15 percent; and in Haiti about 50 percent. Trinidad and Tobago is one of the few countries in the region that has participated in the International Reading Literacy Study (PIRLS). Over the years 2006, 2011, and 2016, PIRLS results show a steady improvement in the global literacy benchmark, which may be due to the successful implementation of nationwide programs that were designed to increase literacy levels among students (Reference CharlesCharles, 2013; Reference George and Quamina-AiyejinaGeorge & Quamina-Aiyejina, 2003).
UNESCO data also show that throughout Caribbean territories there is large variation in school trajectories and in characteristics related to the child, the home environment, and schools in the region. With respect to school trajectories, literacy is often taught in the official (ex-colonial) language only. In some cases, literacy instruction in the Creole language is also being implemented (see Migge et al., 2010). In quite a few countries (e.g., Guadeloupe, Haiti, Jamaica), literacy is being taught in the Creole language from scratch. In a quasi-experimental study, Reference Carpenter, Devonish, Migge, Léglise and BartensCarpenter and Devonish (2010) showed that the implementation of a bilingual literacy program in the early primary grades with Jamaican Creole and English as languages of instruction yielded high literacy outcomes in Jamaican Creole with no cost for the development of English literacy (Phillipson, 1990). In another quasi-experimental study, Reference Simmons-McDonald, Migge, Léglise and BartensSimmons-McDonald (2010) found that the introduction of French Creole as the language of instruction for literacy in primary schools in St. Lucia helped poor learners to develop literacy not only in French Creole but also in English as a second language. It is important to note that the pilot studies on bilingual literacy instruction that have been conducted so far have proved to be successful in developing literacy even in those children that show great variation in entrance levels of cognitive and linguistic abilities and cultural orientation, as well as in terms of the socioeconomic background of the family, the literacy practices in the home, and in the school support parents give to the child. Of course, it should be emphasized that experiments with bilingual literacy education can only be successful where there is full institutional support. Reference Migge, Leglise and BartensMigge et al. (2010b) evaluated three projects on the implementation of local languages in primary schools in French Guiana. They concluded that only when long-term support from the authorities is provided, including the development and provision of curricula in the local languages and teacher training in bilingual literacy programs, can sustained levels of biliteracy be attained.
4.3 Creole Papiamentu Literacy Development in the Dutch Caribbean
4.3.1 Historical Context
The Dutch Caribbean comprises a group of islands, also named the Dutch Antilles, which were colonized by the Dutch in 1634. It is made up of the so-called Leeward Islands: Aruba, Bonaire, and Curaçao, with the Portuguese-based Creole Papiamentu as the generally used vernacular in a population of about 300,000; and the Windward Islands: Sint Maarten, Saba and St. Eustatius, with English as the common language of communication in a population of about 43,000. In this section, we focus on the development of literacy on the Leeward Islands, where Papiamentu is the language of children’s primary socialization process (cf. Reference Severing, Weijer, Faraclas, Severing and WeijerSevering & Weijer, 2008). It is interesting to note that until the beginning of the twentieth century, education was offered by missionary posts, with Creole Papiamentu as the language of instruction. However, in 1936 Papiamentu was banned from schools after a renewed economic interest in the islands on the part of the Dutch authorities in the Netherlands, despite the fact that Papiamentu was spoken by the vast majority of the population. Since then, the use of Dutch in schools was prescribed, whereas Papiamentu was considered to be an obstacle to learning. Formal education could best be characterized as L2 submersion, with children who spoke Papiamentu as their main language being engaged in Dutch instruction. Not until 1986 was Papiamentu assigned a place in the primary school curriculum on Curaçao and Bonaire. Thanks to great efforts in language codification and curriculum development, the role of Papiamentu within schools greatly expanded, while the majority of the instruction nevertheless took place in Dutch. From 2008, Dutch, Papiamentu, and English were recognized as the three official languages on the islands.
According to estimates, Papiamentu is the mother tongue of almost 80 percent of the population on the Leeward Islands. Most children first come into contact with Dutch at school. As Dutch is not spoken or hardly spoken in the child’s environment, it can be considered a foreign language. The language situation can best be characterized with the term “diglossia” (cf. Reference Appel, Verhoeven, Arends, Muysken and SmithAppel & Verhoeven, 1994; Reference ManaganManagan, 2016). On the one hand, there is the Creole Papiamentu, which was traditionally held in relatively low esteem but functions as the general lingua franca. On the other hand, there is Dutch, which has a relatively high social status and is generally learned as a foreign language in school. However, as a result of increasing political independence, Papiamentu’s status has increased dramatically in recent years, with the language being highly valued and increasingly used in formal situations. For example, most newspapers are published in Papiamentu and parliamentary debates also take place in that language (cf. Reference Severing, Weijer, Faraclas, Severing and WeijerSevering & Weijer, 2008). Moreover, serious attempts have been made to make Papiamentu suitable as a language for instruction by elaborating its lexicon with new entries, developing school curricula for language, literacy, and content matters, and by grounding teacher training in a multilingual perspective (Reference Severing, Weijer, Faraclas, Severing, Weijer and EchteldSevering & Weijer, 2010). In a recent study, Reference PereiraPereira (2018) investigated how 108 teachers in Aruba valued the role of Papiamentu in education. The great majority of teachers promoted educational reform that gives an important place to Papiamentu in the curriculum. They also pointed to the necessity of specific in-service training of teachers to prepare them for multilingual education. Twelve teachers with experience in Scol Multilingual – an innovative bilingual-education experiment on the island – were also interviewed; they indicated improved learning attitudes and better academic outcomes on the part of their pupils. In another survey, Pereira interviewed 1,141 parents of children at primary education level. By far, most parents were extremely supportive of educational reform from monolingual Dutch toward bilingual Papiamentu–Dutch education.
4.3.2 Early Language and Literacy Development
In a recent survey, the exposure to Papiamentu and Dutch of 183 children aged nought to four years on the island of Bonaire was examined (Reference Odenthal and BouwmanOdenthal & Bouwman, 2016). The children’s parents were interviewed as regarded their language of primary socialization, frequency of storybook reading, preferred television channels, and use of preschool facilities. It was found that the great majority of native parents from the Dutch Caribbean used Papiamentu as the primary home language, with only limited exposure to Dutch. Among a small minority of parents originating from other South American territories and from the Netherlands, the main languages in the home were reported to be Spanish and Dutch respectively, with limited contact with Papiamentu. With respect to storybook reading, parents reported reading to their child more often in Papiamentu than in Dutch. However, in one third of the cases, no storybook reading was reported by parents. Preschool facilities were reported to be widely used. In most cases the caretakers spoke Papiamentu or Papiamentu and Dutch, and the use of Dutch only was reported to be rare.
A quasi-experimental study examined the preliteracy development in Papiamentu and Dutch of eighty children aged four to six and living on the island of Curaçao (Reference NarainNarain, 1995; Reference Narain and VerhoevenNarain & Verhoeven, 1994). Children’s abilities in receptive and productive vocabulary, sentence reproduction, and narrative comprehension were assessed in Papiamentu and Dutch, and their phonological awareness in Dutch was also assessed. Children’s performance on these tests were measured at three moments: at the beginning of kindergarten, and after one and two years of education in kindergarten. At the end of kindergarten, the children’s phonological awareness was also measured. In order to explore the relationship between language proficiency and background features, sociocultural background characteristics (preschool duration, sociocultural orientation of the child and the parent, linguistic exposure, language used by the teacher) were also measured.
The results on the development of language abilities over time are presented in Figure 4.1. In all four linguistic skills examined in Papiamentu and Dutch, there was significant progress over time. Comparison of the two languages shows that participating children on Curaçao are significantly stronger in Papiamentu than in Dutch throughout the entire kindergarten school period and at all linguistic levels. Figure 4.1 also shows that the scores on productive vocabulary, sentence reproduction, and narrative comprehension were relatively low throughout the kindergarten period.

Figure 4.1 Means for the tests for receptive vocabulary, productive vocabulary, sentence reproduction, and narrative comprehension in Papiamentu and Dutch at the beginning (K1) and after one year (K2) and two years (K3) of kindergarten
It is important to note that evidence of cross-language transfer was also found. Over the two years of kindergarten, the longitudinal relations between Papiamentu-language abilities on the one hand and Dutch-language abilities on the other turned out to be extremely strong. Interestingly, there was also evidence of significant relations from L1 Papiamentu to L2 Dutch over time, as assumed in the framework of linguistic transfer (e.g., Reference Chen, Dronjic and Helms-ParkChen et al., 2015).
Two other important findings came out of the study. One is that sociocultural variables substantially predicted the children’s first- and second-language proficiency. Duration of preschool and the child’s cultural orientation combine to determine almost 40 percent of the variance in Papiamentu-language scores whereas the child’s linguistic exposure and parents’ cultural orientation explained 80 percent of the variance in Dutch-language scores. At the end of kindergarten, the language used by the teacher explained about 25 percent of the variance in Papiamentu-language scores. Simultaneously, language exposure at school and at home and the child’s cultural orientation together determine 77 percent of the variance in Dutch-language scores.
The other finding was that the degree of bilingual competence in children predicted their phonological awareness, which can be seen as an important precursor of their literacy development. The scores on phonological-awareness tasks were highest for children who scored above average in both languages, intermediate for children who scored above average in one language, and lowest for children who scored below average in the two languages. Apparently, a high level of bilingualism leads to good insight into the structure of language as such. This is in line with earlier research and theorizing (cf. Reference BialystokBialystok, 2001; Reference Cummins and RiveraCummins, 1984).
4.3.3 Bilingualism and Learning to Read
With respect to the development of basic literacy skills, Reference Prins-Winkel and MullerPrins-Winkel (1983) stated that Dutch-only language education on the island of Curaçao primarily leads to a high level of functional illiteracy. Children often prove to be able to perform reasonably well in the subject of Dutch as a foreign language, but have great difficulty using the language in everyday situations which require its written use. Recent evidence for this claim comes from a study by Reference Odenthal and BouwmanOdenthal and Bouwman (2016), who studied the language and literacy levels of 940 children in Bonaire in the age range of nine to eighteen. In a questionnaire, children reported that Papiamentu was spoken at home in almost 90 percent of families, in half of the cases in combination with Dutch. For half of the children, Papiamentu was the dominant language in school, while for 40 percent the dominant school language is Dutch. Outside school, children reported reading more books in Papiamentu than in Dutch. In Grades 2–5, children’s word-decoding fluency (the number of isolated words read in one minute) and reading comprehension were assessed. It was found that children on Bonaire developed L2 word-decoding skills across the grades. However, they stayed behind their monolingual Dutch peers in the Netherlands. The children’s reading-comprehension levels across the grades were extremely low compared to those of their Dutch peers. Finally, the literacy levels in Papiamentu and Dutch of 1,067 students at the end of secondary school were examined. The students from Bonaire remained behind in Dutch literacy compared with their peers in the Netherlands, whereas their level in Papiamentu literacy was higher than their Dutch. However, it should be noted that both in the Netherlands and in Bonaire there are three different educational tracks in the secondary school system (lower-vocational, higher-vocational, and pre-university level), with fewer students from Bonaire in the two higher tracks.
In several other studies attempts were made to examine the literacy development of children in both Papiamentu and Dutch. Reference SeveringSevering (1997) and Reference Severing and VerhoevenSevering and Verhoeven (1995) examined the development of word decoding, reading vocabulary, sentence comprehension, and text comprehension in written Papiamentu and Dutch from Grades 5 and 6 in primary school, with literacy being taught in Dutch and Papiamentu being taught as a subject for only half an hour a week. In Figure 4.2, the means of children’s word decoding (number of words read aloud correctly in one minute), reading vocabulary, sentence comprehension, and text comprehension at the beginning and end of Grade 5 and at the end of Grade 6 are presented.

Figure 4.2 Means for the tests for word decoding, reading vocabulary, sentence comprehension, and text comprehension in Papiamentu and Dutch at the beginning (B5) and the ends of Grades 5 (E5) and 6 (E6)
It was found that primary-school children on Curaçao learned to decode words significantly better in Dutch than in Papiamentu, but that their performance on reading vocabulary, sentence comprehension, and text comprehension was significantly better in Papiamentu than in Dutch. For word decoding, children were overall better in Dutch compared to Papiamentu, bearing in mind that reading instruction took place in Dutch. But the differences became smaller over time. For reading vocabulary, sentence comprehension, and reading comprehension, significant progress over the grades was also evidenced. The children scored higher overall in Papiamentu as compared to Dutch, and even more so for reading vocabulary. Next, the researchers examined to what extent the children’s reading abilities in Papiamentu and Dutch were related. In both Papiamentu and Dutch, word decoding, reading vocabulary, and reading comprehension abilities were not only longitudinally related but also cross-linguistically related to each other. Interestingly, the development of Papiamentu word-decoding ability could to a large extent be predicted from the level of Dutch word-decoding ability. This finding shows that the language of instruction has a high impact on the children’s literacy development and that development of Papiamentu literacy skills takes place even without much formal instruction in school. However, it is interesting to note that for reading comprehension it was the other way around, with transfer going from Papiamentu (the strongest language) to Dutch (the weaker language) despite the lack of instruction in Papiamentu.
The study by Severing and Verhoeven also explored to what extent the variation in Papiamentu and Dutch reading abilities is associated with factors which can be related to the child or their family background. Papiamentu word decoding at the three testing times was negatively associated with grade repetition and positively with the child’s reading behavior, whereas Papiamentu reading comprehension was negatively associated with grade repetition and positively with cognitive skills and socioeconomic status. For Dutch, word decoding and reading comprehension across the grades were negatively associated with class repeats and positively with cognitive skills, attitude toward Dutch, exposure to Dutch, and socioeconomic status. Dutch word decoding was also related to the child’s reading behavior. These findings show that both child factors related to the child – such as cognitive skills, class repeating, and reading behavior – and background factors related to language exposure, language attitudes, and socioeconomic status contribute to the prediction of literacy in Papiamentu and Dutch.
In three recent studies, the variation of Papiamentu and Dutch reading in the Dutch Caribbean was further explored. Reference HenderickxHenderickx (2018) examined the effect of the order of literacy instruction on word-decoding and reading-comprehension abilities in Papiamentu and Dutch in 166 children from Grade 3 and 140 children from Grade 5. For half of the children in each cohort, the order of reading instruction was Papiamentu–Dutch (i.e., Papiamentu starting in Grade 1, Dutch starting by the end of Grade 2), and for the other half it was Dutch–Papiamentu. Overall, the word-decoding scores in the two grades were about the same in Papiamentu and Dutch. This may be because there is a great deal of overlap in the letters and literacy conventions used in the two languages. Importantly, the reading-comprehension scores in the two grades were found to be higher in Papiamentu. The instruction order Dutch–Papiamentu yielded higher scores on Dutch reading comprehension, with no impact on Papiamentu reading comprehension, in both grades. Apparently, a high reading proficiency in Dutch as a foreign language is largely dependent on the amount of reading instruction and reading exposure in that language.
Reference Mercelina, Segers, Severing and VerhoevenMercelina et al. (2023) examined the variation in early decoding development in Papiamentu (Creole L1) and Dutch (postcolonial L2) from kindergarten to second grade of 156 children while considering order of initial decoding instruction (L1 or L2), kindergarten precursors, and transfer effects. Results revealed that in the case of L1 decoding instruction, the development of letter knowledge and decoding was higher in Papiamentu and in the case of L2 decoding instruction it was higher in Dutch. When instruction started in L1, Papiamentu decoding development was statistically significantly predicted by phonological awareness and letter knowledge, and Dutch decoding development by letter knowledge only. When instruction started in L2, Dutch decoding development was statistically significantly predicted by phonological awareness, letter knowledge, short-term memory, and speech decoding, and Papiamentu decoding development by letter knowledge and vocabulary. Transfer effects were found from the language of decoding instruction to the other language with L1 precursors significantly predicting L2, but not the other way around. These results reveal the pivotal role and benefit of including the L1 in early bilingual decoding development in a postcolonial context.
Finally, Reference Van der Elst-Koeiman, Segers, Severing and VerhoevenVan der Elst-Koeiman et al. (2022) examined the Papiamentu (L1) and Dutch (L2) reading comprehension development of 293 fourth-grade students in postcolonial Dutch Caribbean schools. It was found that reading comprehension in Papiamentu and Dutch was predicted by initial language of alphabetization, on the one hand, and word decoding, receptive vocabulary, and grammatical ability on the other hand. There was also evidence of linguistic interdependencies for decoding and reading comprehension between languages. The results highlight the importance of language of instruction for Papiamentu and Dutch reading skills.
4.3.4 Literacy and School Success
A number of studies have examined the relationship between language skills and school success. A classic study is that of Reference Prins-WinkelPrins-Winkel (1973). In the context of monolingual Dutch-language education, she related children’s academic performance to their intelligence, their socioeconomic class, and their home language. General cognitive abilities and socioeconomic class proved to have a positive correlation with academic performance, a finding corroborated by other research in this field. Furthermore, the home language proved to be a predictor: The more Dutch was spoken at home, the better the academic performance at the Dutch-only school. On the other hand, Reference Kook and VedderKook and Vedder (1989) found that Papiamentu-speaking children at middle-class schools scored as well in spelling and vocabulary tests as the Dutch-language children at those schools. They therefore concluded that the child’s home language does not by itself have a decisive influence on academic performance. This is in line with findings in other parts of the world (cf. Nag et al., 2018). A few studies have revealed that the exclusive attention to Dutch in education did not lead to positive educational results. First, periodically gathered statistics proved how low the educational return was during the time of Dutch monolingual education. As a result of the high level of discontinuity between the language offered to children at home and at school, over 60 percent of the children were found to have repeated one or more years in primary education (Minister of Education and Culture, 1992). Reference OlthetenOltheten (1980) examined the determinants of nonpromotion in primary education. Sociocultural characteristics and the family’s socioeconomic position, regional differences, and the efficacy of the school proved to primarily predict children’s nonpromotion. Finally, Reference SeveringSevering (1997) examined the relation between word decoding and reading comprehension abilities in Papiamentu and Dutch in fifth and sixth grade on the one hand and educational success by the end of primary school on the other. Notwithstanding the fact that formal literacy instruction throughout the grades had been given to a large extent in Dutch and that educational success was measured in Dutch only, it was found that not only children’s literacy attainment in Dutch but also their literacy development in Papiamentu significantly predicted their success in secondary education.
4.4 Future Perspectives on Literacy Development in the Caribbean
To conclude, research has evidenced an important impact of the role of Creole languages in enhancing literacy development and school success in Caribbean education. The studies carried out in the Dutch Caribbean and elsewhere show some important findings. To begin with, they show that at the onset of primary education, Papiamentu is by far the dominant language. This is educationally relevant since it has been well documented that, in a multilingual context, literacy is best taught in the strongest language children have at their disposal (Reference Verhoeven, Kamil, Pearson, Moje and AfflerbachVerhoeven, 2010). Research also showed that even in a Dutch school setting, reading comprehension scores in Papiamentu tended to be higher than in Dutch. Importantly, evidence of cross-language transfer was also evidenced in kindergarten and in the primary grades, showing that language and literacy skills learned in Papiamentu could be transferred to similar skills in Dutch. Moreover, a high level of bilingual proficiency was found to be associated with a high level of metalinguistic awareness, which is highly relevant for children’s insight into the alphabetic principle. Another important research outcome was that the introduction of Papiamentu as a school language did result in substantial gains in that language without a cost of skills in L2 Dutch. Starting from a bilingual literacy curriculum it was found that the order of instruction did not affect word decoding outcomes. It did affect reading comprehension in that Dutch reading comprehension benefitted from an early start in the curriculum. Of course, research has only started to uncover the steps children in the Caribbean make in becoming literate in native Creole languages and second languages as it relates to their academic success. More research is needed to explain the large variation in linguistic skills and motivation that children bring to school in relation to the use of first and second language(s) in the school curriculum. Research should also focus on the language of higher education and how student success in academic languages there is affected by the patterns of language use in primary and secondary schools.
From the perspective of sustainability, the impact of Creole languages and of the teachers and parents in bilingual education can be regarded of utmost importance and should optimally be fostered in connection with cultural orientation and school success (Reference Dijkhoff, Pereira, Migge, Leglise and BartensDijkhoff & Pereira, 2010). With a view to improving the success rate in education, it seems advisable to introduce Creoles or other indigenous languages as teaching languages in education on a large scale. The fact that census data report major numbers of class-repeat, students with low-level academic outcomes, and school dropouts suggests the need for investment related to the development of bilingualism, literacy, and school success (Reference Delgado, Lecompte, Lao, Mopsus, Echteld, Severing, Faraclas, Faraclas, Severing, Weijer, Echteld, Rutgers and DupeyDelgado et al., 2016). At this point in time, Creole languages constitute the mother tongue of the vast majority of the population and are the languages of choice for all socioeconomic classes across a wide range of Caribbean territories. In many places, Creoles have already been accepted as teaching languages in infant school and special education and as the professional language in primary education. It seems plausible that with these educational reforms there will be fewer children repeating years and dropping out, and that the pupils’ level of education will, on average, be higher at primary schools where the mother tongue is officially recognized as the language of instruction.
From a sociolinguistic point of view, it is clear that the development of the indigenous language(s) in a (post)colonial society can have a great impact on the individual child and its community. It provides a major socialization channel into the community and a means to get to know its historical roots. Accordingly, it can be seen as a cornerstone for the optimum attainment of both intragroup communication and ethnic continuity. Importantly, the mother tongue of children can be seen as the best vehicle to teach children academic subjects such as literacy and math (Reference Verhoeven, Cain, Compton and ParillaVerhoeven, 2017). Once children have learned these skills in their first language, they can be easily transferred to other languages, such as the colonial language. Of course, the colonial language can fulfill a role in intergroup communication and in schooling in higher-education settings. It can be argued that functional bilingualism in colonial settings can only be feasible if the language needs of speech communities are seriously taken into account by the authorities. With respect to language and educational planning, we recommend that policymakers analyze the language needs of communities by means of quantitative surveys and ethnographic interviews with teachers, parents, and students, as well as other community representatives. Such analyses of linguistic needs should yield guidelines for the determination of final objectives in education (see Reference PereiraPereira, 2018).
If there is a need to use the native language in education, adequate information and instructional materials in that language and qualified teachers must be made available in the native language. A distinction can be made between different kinds of educational arrangements. First of all, different roles can be acknowledged for the native language(s) and the (post)colonial language under consideration. These roles may vary from no encouragement to a short-term transitional medium, or a medium for language maintenance. When a bilingual program is foreseen, two sets of materials need to become available. For material in the indigenous language, the problems may be even greater. When the language is unstandardized, work on language standardization must be done beforehand. In addition, new instructional materials must be developed for all school subjects. Besides the development of curricula, literary books and reference works must be published and implemented (see Reference SiegelSiegel, 2010). In case materials in the colonial language are still being used in schools, they should be carefully checked for cultural bias. Curricula in colonial languages often reflect the values of vernacular(s) country of origin, which makes it difficult for children to relate them to their local context. In order to arrive at a better connection between the child’s background knowledge and the content of the foreign language curriculum, materials should be produced which reflect an ethnically and culturally appropriate picture of society.
The case of language planning in the Dutch Caribbean makes it clear that the standardization of a Creole and its implementation in education is feasible. However, a few words of caution are in order. First, the consequences of language planning usually bring about high costs. The poor socioeconomic background of (post)colonial states may hamper the execution of educational plans there. The provision of new instructional materials in the vernacular(s), as well as in the colonial language(s) – now being taught as a foreign language – will bring about high cost implications. Another important delimiting condition for bilingual literacy education is the availability of qualified teachers. Teachers must be well trained and competent enough to be able to offer literacy programs in primary and secondary education. An efficient administrative school board in charge of the implementation of innovative attempts in bilingual education should also be available. The success of innovations in bilingual education are not only dependent on the skills that teachers bring to the school; teacher attitudes are also extremely important in bringing about a fundamental renewal of education. Positive responses to educational renewal can be stimulated through intense school and community involvement during the process of curriculum development and implementation. All too often, implementation and evaluation have been neglected as necessary stages in language planning. In many cases intentions and orientations have been emphasized without attention being paid to the effects of proposed legislation. In this light, Reference PereiraPereira (2018) advocated an integrative approach to the use of Creole in the classroom with sustainable development as its major objectives, and affective rather than material and physical factors as the key to development.
5.1 Introduction
The European Union (EU) is a political and economic union of twenty-seven Member States (MS).Footnote 1 Its members are industrialized nations that value inclusion and allow free movement of its citizens within the union (Charter of Fundamental Rights of the European Union, European Union, 2016). In most countries in the EU, primary education starts at age six and compulsory education lasts between nine and ten years, but in many countries, students are required to attend vocational programs until they reach eighteen (European Commission/EACEA/Eurydice, 2016). The EU has common educational benchmarks, such as the reduction of the number of low achievers in reading, mathematics, and science in secondary school, and a minimum tertiary education completion rate. The latter stood at 41,2% in 2021, and the 2030 target is 45% (European Commission, 2022). These targets reflect common agreement on what is deemed important to achieve in education and schooling, namely the appropriate qualifications for jobs that should be acquired in professional training and/or via a university degree. Good skills in reading, mathematics, and science are viewed as a prerequisite for integration in the knowledge society (European Commission, 2020), but challenges remain. In the EU, socioeconomic status is still a determinant of education achievement (see also Kieffer & Vuković, Chapter 2, and Nag, Chapter 15 in this volume). Immigrant students have lower achievement levels in reading, mathematics, and science in secondary school (OECD, 2017), and the foreign-born have lower tertiary attainments than native students (European Commission, 2020).
This chapter offers an overview of literacy development in Europe. The focus is on indicators of reading-literacy achievement in countries that are members of the EU and participate in International Large-Scale Assessments (ILSAs). First, we present evidence related to the spread of literacy in Europe and discuss current notions about the relationship between schooling and literacy abilities and about the role of skills for full integration in society. Second, we summarize the evidence on the variation of reading acquisition and development in different linguistic systems. Third, we give an overview of variations in literacy achievement and their relationship with home and school factors. Next, we present current literacy achievement levels in primary and secondary school and discuss their association with home background factors captured in ILSAs. Finally, we summarize the role of ecological factors and conclude by discussing how ILSAs can contribute to our understanding of reading development in Europe and inform policy decisions.
5.2 Literacy and Schooling in Europe
5.2.1 Historical Perspective
Educational attainment grew enormously from 1960 to 1995 in most of the Western world, with the average number of years of schooling nearly doubling (Reference Heckman and JacobsHeckman & Jacobs, 2009). In 2015, in the European Union,Footnote 2 80 percent of youngsters under twenty-five completed upper-secondary education or the equivalent of twelve years of schooling (OECD, 2017). This average is for twenty-two EU countries; the available data still includes the United Kingdom but excludes Bulgaria, Croatia, Cyprus, Lithuania, Malta, and Romania. It is possible that if data were available for the current twenty-seven EU Member States this average would be slightly different. For the EU22, it reflects wide variation among countries in terms of progress over time and differences in recent education attainment rates. For example, while in Portugal the secondary-school completion rate grew from 51 percent in 2005 to 83 percent in 2012, in Hungary it increased only two percentage points, from 80 to 82 percent, during the same time interval. In 2015, in Spain 68 percent of young adults completed secondary school compared to 87 percent in Finland.
The expansion of schooling is a major factor influencing the spread of literacy worldwide and three major periods have been identified in the diffusion of literacy (UNESCO, 2005). Before 1800, reading was already widespread in northern Europe in countries like Denmark, Finland, England, and France, but was confined to the upper classes. In Germanic-language countries and German-speaking regions, more than 50 percent of males were already literate before 1790 (Reference Diebolt and HippeDiebolt & Hippe, 2017). In contrast, in southern European countries like Spain, Portugal, and Italy, illiteracy was the norm. Between 1800 and 1860, little progress in literacy rates was registered in these countries, while in northern Europe modest progress was achieved. Several European countries introduced compulsory education in the first half of the nineteenth century, but actual enrollment in primary schools was very low (Reference Hippe and FouquetHippe & Fouquet, 2015). After 1860, literacy levels improved in much of Europe because of the introduction of legislation regulating compulsory education, although literacy levels in Hungary, Italy, Spain, and the Balkan countries remained low even around 1900. Following low literacy levels in most of nineteenth-century Europe, schooling became more available to all but social elites after the mid-nineteenth century. This change was rooted in the need for record keeping and for skillful labor linked to the use of new technologies, such as the steam engine, that required workers who could maintain and fix machinery. However, the spread of literacy remained a challenge (Reference Hippe and FouquetHippe & Fouquet, 2015) and the situation in the following century was as follows:
During the early twentieth century, literacy levels increased throughout Europe, with few changes in the ranking of countries. By mid-century, central, and northern Europe were reported to have achieved over 95% literacy; Western Europe, over 80%; Austria and Hungary, over 70%; and Italy, Poland, and Spain, over 50% literacy. In Portugal and the Eastern Orthodox countries, adult literacy rates were not above 25%; only after 1945 did the ability to use written languages extend to the masses.
Different factors may account for the cross-country and within-country regional differences in adult literacy rates from the 1800s to the twenty-first century. These include literacy traditions (Reference Elley, Verhoeven and SnowElley, 2001), geographical location, and linguistic background. For example, during the 1800s, geographical proximity appears to have played a role in the spread of literacy from Germany, Switzerland, and the Netherlands to neighboring regions in Belgium, France, and northern Italy (Reference Diebolt and HippeDiebolt & Hippe, 2017). Furthermore, regional discrepancies in literacy rates within a country were often associated with linguistic variations. This may have been the case in Brittany, where French was not widely spoken before the nineteenth century, and which registered much lower literacy rates than other French regions in the 1800s (Reference Diebolt and HippeDiebolt & Hippe, 2017).
The beginning of the twentieth century clearly marked the widespread attendance of all children at least at primary school in most of the industrialized world (Reference Weber, Verhoeven and SnowWeber, 2001), although in some countries the literacy rate of all citizens did not significantly increase until the second half of the century (UNESCO, 2005). During this latter period, the spread of schooling in most of Europe was clearly linked to the attainment of more sophisticated levels of literate ability and to greater economic returns. Put differently, while in earlier periods an individual could be considered literate if he or she could only sign his or her name (Reference Venezky, Barr, Kamil, Mosenthal and PearsonVenezky, 1991) schooling in the second half of the twentieth century made it possible for individuals to further develop reading and writing abilities, and this rise in education levels translated into better jobs and higher salaries (Reference Heckman and JacobsHeckman & Jacobs, 2009). The accumulation of knowledge through schooling, often referred to as human capital, paid off in economic terms. However, at the turn of the century and into the twenty-first century the picture is more complex, because studies show that more school attainment does not translate directly and unequivocally into higher literate abilities.
Research conducted in the last decades has shown that quality of education is a better indicator of life outcomes than quantity of education, as measured in years of schooling (Reference Heckman and JacobsHeckman & Jacobs, 2009). This suggests that “School attainment is not a very good proxy for knowledge” (p. 27) and that, as Reference Hanushek and WoessmannHanushek and Woessmann (2015) contend, “direct measures of cognitive skills offer a superior approach to understanding how human capital affects the economic fortunes of nations” (p. 28). In relation to literacy attainment, children who fail to develop the basic reading skills needed to comprehend what they read by the fourth grade are likely to face reduced educational opportunities (Reference Adams and HiebertAdams, 2009; Reference Chall and JacobsChall & Jacobs, 2003). This, in turn, will affect their chances of acquiring the skills that are essential for full participation in society and in the labor force (Reference Hanushek and WoessmannHanushek & Woessmann, 2015).
As we have discussed, schooling and associated literacy rates in Europe vary from country to country and this variation has been present since the 1800s. While the relation between years of schooling and literacy abilities is not well documented prior to the twentieth century, in the 1800s someone with the ability to sign his or her name would have been considered a literate individual (UNESCO, 2005). If the ability to sign one’s name was already considered a literate behavior in the 1800s, and a useful one in terms of signing a work commitment or property possession (Reference Venezky, Barr, Kamil, Mosenthal and PearsonVenezky, 1991), what reading-literacy skills characterize the European student population of the twenty-first century, and how do children develop them?
5.2.2 Reading Development in Different Orthographies
Several cross-linguistic and/or cross-national studies have looked at how children develop reading skills in different orthographies (Reference Seymour, Aro and ErskineSeymour, Aro, & Erskine, 2003; Reference Vaessen, Bertrand and TothVaessen et al., 2010; Reference Ziegler, Bertrand and TóthZiegler et al., 2010). In the case of alphabetic writing systems, orthographic depth explains different rates of reading development and children seem to acquire reading faster in transparent orthographies (Reference Pollatsek and TreimanPollatsek & Treiman, 2015). The facilitating effect transparent orthographies have in reading development has mostly been established in the first stages of learning to read, first and second grades, and confirmed by studies that ask children to read words and nonwords (Reference SeidenbergSeidenberg, 2013). In a comparative study of reading acquisition in twelve different languages, Reference Seymour, Aro and ErskineSeymour et al. (2003) found that English and Danish first-graders take longer than Finish, Spanish, or Italian ones to master word-decoding skills.
In a transparent or shallow orthography, such as Finnish, there is a one-to-one phoneme-to-grapheme mapping whereby one letter represents one sound and vice versa. Research indicates that there is a continuum, with English being one of the most opaque alphabetic languages – different pronunciations for the same spelling patterns – while French and Danish are positioned somewhere in the middle of the orthographic-depth continuum (Reference Schmalz, Marinus, Coltheart and CastlesSchmalz et al., 2015). For example, in French, spelling-to-sound relations are reasonably predictable, but sound-to-spelling relations are more ambiguous (Reference Schmalz, Marinus, Coltheart and CastlesSchmalz et al., 2015). Among Western European languages, English has the most inconsistent orthography, and this impacts the rate at which English-speaking children develop literacy (Reference Sproat, Cook and RyanSproat, 2016). A child learning to read in English is confronted with the task of learning inconsistent print-to-speech correspondences, such as “ea” having one sound in “bread” and another in “leak” (Reference Schmalz, Marinus, Coltheart and CastlesSchmalz et al., 2015). To a lesser extent, a Portuguese first-grader is also confronted with a phonological inconsistent orthography; for example, “ca” can correspond to /ka/ or /kɐ/ (Reference Ventura, Fernandes, Leite, Pereira and WongVentura et al., 2019). In contrast, a child learning to read in Spanish does not encounter many words that have graphemes that share the same spelling but can be pronounced differently in different words. This facilitates learning to an extent that a child’s ability to name letters and segment speech sounds in kindergarten are not such strong determiners of that child’s reading ability in second grade and beyond (Reference Caravolas, Lervåg and MousikouCaravolas et al., 2012).
Other studies specifically addressing the impact of predictors of reading ability, for example the ability to segment speech sounds or phonological awareness (PA), indicate that reading development is modulated by orthography transparency. PA is a stronger predictor in less transparent orthographies, such as French and Portuguese, than in more transparent ones like Dutch, Hungarian, and Finish (Reference Ziegler, Bertrand and TóthZiegler et al., 2010). Although researchers have questioned the relevance of PA as a reading predictor in different languages because most studies have been conducted in English (Reference ShareShare, 2008), current evidence suggests that PA is a predictor of reading ability across European alphabetic languages (Reference Vaessen, Bertrand and TothVaessen et al., 2010). Reference Perfetti, Verhoeven, Verhoeven and PerfettiPerfetti and Verhoeven (2017) concluded that this association of PA and reading development holds for fourteen European languages. Some studies indicate that accuracy in word recognition is a better predictor of reading ability in less consistent orthographies, whereas variations in speed in more consistent orthographies explain reading performance (Reference Landerl, Ramus and MollLanderl et al., 2013; Reference Pollatsek and TreimanPollatsek & Treiman, 2015; Reference Vaessen, Bertrand and TothVaessen et al., 2010). However, the cognitive processes involved in word decoding – accuracy and speed – are identical in orthographies that vary along the transparency continuum (Reference Hulme and SnowlingHulme & Snowling, 2013; Reference Vaessen, Bertrand and TothVaessen et al., 2010), and this has been observed also in Grades 3 to 6 of primary school (Reference Moll, Ramus and BartlingMoll et al., 2014).
As children move beyond the initial stages of learning to read, knowledge of other aspects of language beyond accurate and fluent word reading, namely grammar and vocabulary knowledge, are associated with reading comprehension (Reference Hulme and SnowlingHulme & Snowling, 2013; Reference SeidenbergSeidenberg, 2013; Reference Sénéchal and WasikSénéchal, 2012). During the learning-to-read phase (Reference ChallChall, 1996) fast word-identification skills serve as the foundation for text comprehension (Reference Perfetti, Gough, Ehri and TriemanPerfetti, 1992), but as the ability to decode words develops, other factors, such as vocabulary knowledge, support reading to learn (Reference Chall and JacobsChall & Jacobs, 2003). In fact, “research indicates that reading with comprehension depends on understanding at least 95% of the words of the text” (Reference Adams and HiebertAdams, 2009, p. 172). This understanding of the meaning of words develops, for example, when preschool-age children are exposed to book reading and parents explore the meaning of print with them. Later, the oral comprehension they developed early in life will assist them in comprehending what they will read by themselves (Reference Sénéchal and WasikSénéchal et al., 2012). For example, Reference Sénéchal, Ouellette, Rodney, Neuman and DickinsonSénéchal, Ouellette, and Rodney (2006) found that preschool Canadian children’s vocabulary knowledge, acquired from parental book reading, predicts reading comprehension in Grade 3. The influence of this home-literacy practice of shared reading on future reading achievement has been found in studies with English- and French-speaking children (Reference Sénéchal, Ouellette, Rodney, Neuman and DickinsonSénéchal, 2006), as well as in studies in other more transparent languages. For instance, in Greek (Reference Manolitsis, Georgiou and ParrilaManolitsis, Georgiou, & Parrila, 2011; Lithuanian (Reference Silinskas, Aunola, Lerkkanen and RaizieneSilinskas et al., 2021); German (Reference Lehrl, Ebert, Roßbach, Pfost, Artelt and WeinertLehrl, Ebert, & Roßbach, 2013; Reference Niklas and SchneiderNiklas & Schneider, 2017; Reference Rose, Lehrl, Ebert and WeinertRose et al., 2018), and Finnish (Reference Silinskas, Lerkkanen and TolvanenSilinskas et al., 2012; Reference Silinskas, Torppa, Lerkkanen and NurmiSilinskas et al., 2020). As Reference Kalb and OursKalb and Van Ours (2014) put it, reading to young children gives them a head start in life. In their study of the impact of book reading by Australian parents they found that children who are read to in the home frequently, three-to-five days a week and six-to-seven days a week, obtain the equivalent of between six-to-twelve months’ higher scores in literacy at eight/nine years of age. Smaller effects of reading to children were found for numeracy skills.
Sénéchal’s home-literacy model (Reference Sénéchal and Wasik2012) postulates that during the preschool years both meaning-based interactions during shared reading and code-based teaching by parents, like naming alphabet letters, contribute to later reading achievement, and this view is consistent with theories of reading development (Reference Mol and BusMol & Bus, 2011; Reference Perfetti, Landi, Oakhill, Snowling and HulmePerfetti, Landi, & Oakhill, 2005). More specifically, shared reading supports vocabulary knowledge (Reference Sénéchal and WasikSénéchal, 2012) and code-based teaching by parents during shared reading can also assist children in learning to read. Nonetheless, “achievement-based skills such as early reading, early math, and letter recognition skills appear to be more sensitive to Head Start intervention attendance than cognitive skills such as IQ, vocabulary, and attention which are less sensitive to classroom instruction” (Reference Shager, Schindler and MagnusonShager et al., 2013, p. 90).
In summary, country variations in reading development are associated with linguistic differences related to orthographic depth in the early years of reading instruction and individual variations in reading achievement are linked to different levels of language knowledge and to the specific contexts, at home and/or at school, where this knowledge is acquired.
5.2.3 Variation in Reading Achievement
Home and school socioeconomic and linguistic contexts are relevant in explaining differences in reading achievement that are already present during the primary-school years. In the United States, for example, the reading gap between students from high- and low-income families and between students of different ethnic and linguistic backgrounds has been well documented (Reference SeidenbergSeidenberg, 2013; Kieffer & Vuković, Chapter 2 in this volume). Similarly, in Europe data from comparative education surveys show that there is a relationship between socioeconomic and linguistic backgrounds and achievement.
Large-scale studies, such as the Progress in International Reading Literacy Study (PIRLS), offer unique information about fourth-graders’ comprehension of authentic texts – the goal of learning to read – and related predictors of reading ability. The contextual information collected in different participant countries via student, home, school, and teacher questionnaires in PIRLS makes it possible to look at reading achievement from an international comparative perspective. This information can be used to study both student-background factors and environmental ones and to explore variations across countries in terms of reading-related literacy universals and particulars (Reference Lenkeit, Chan, Hopfenbeck and BairdLenkeit, et al., 2015). In this sense, PIRLS allows us to characterize the reading-literacy skills of fourth-grade students in European countries and to understand their relationship with different sociolinguistic contexts.
Measures of socioeconomic status (SES) can include income, number of books and children’s books at home, parental education level or occupation level, or a combination of these and other variables indicative of available home resources such as possession of an internet connection and one’s own room (Reference Araújo and CostaAraújo & Costa, 2015; Reference Caro, Sandoval-Hernández and LüdtkeCaro, Sandoval-Hernández & Lüdtke, 2014). Features of supportive literacy environments, such as having books at home, have been conceptualized as a measure of cultural capital and have been found to explain reading-score differences among students (e.g., Reference ParkPark, 2008). Moreover, both a school’s intake of children from a certain range of socioeconomic status levels and the school’s average of students’ cultural capital account for part of the reading-score differences between schools (Reference Caro, Sandoval-Hernández and LüdtkeCaro et al., 2014; Reference Myrberg and RosénMyrberg & Rosén, 2006). This indicates that there is a school compositional effect whereby students in schools with a higher SES composition have higher reading achievement and this trend has been found in Germany, France, and Denmark (Reference Stancel-Piatak, Mirazchiyski and DesaStancel-Piatak, Mirazchiyski, & Desa, 2013). Similarly, Reference Myrberg and RosénMyrberg and Rosén (2006) found that in PIRLS 2001, students’ cultural capital accounted for a great part of the reading-score differences between Swedish independent and public schools. In Sweden the share of students with a migrant background is higher in public schools, and this explains their lower reading achievement scores when compared to private schools. This has been corroborated in Dutch studies that also use PIRLS data and show that students who speak Dutch as a second language have lower achievement levels (Reference Netten, Voeten, Droop and VerhoevenNetten et al., 2014; Reference Netten, Luyten, Droop and VerhoevenNetten et al., 2016).
Literacy achievement in PIRLS in European countries reveals that common underlying factors such as socioeconomic and linguistic backgrounds are associated with student achievement. Nonetheless, the strength of the association between reading achievement and SES and between achievement and family/student characteristics varies across countries. For instance, a positive correlation of parents’ socioeconomic status and children’s fourth-grade reading achievement level is present in all European countries participating in PIRLS 2006 and 2011 (Reference Araújo and CostaAraújo & Costa, 2015; Reference ParkPark, 2008). However, score-point differences between students from high and from low SES backgrounds are wider in some countries than in others and both home-literacy activities and students’ early literacy skills also seem to mediate results (Reference Costa and AraújoCosta & Araújo, 2017). In a PIRLS study that considered aspects of the home-literacy model proposed by Reference Sénéchal and WasikSénéchal (2012), Reference Myrberg and RosénMyrberg and Rosén (2009) found that parental book reading and storytelling during preschool made a positive contribution to reading achievement, and that book reading was mediated by cultural capital, as measured by the number of books at home. Additionally, this study showed that Swedish students’ early literacy skills had a positive impact on their subsequent reading attainment, without any mediating effect of cultural capital or number of books at home. Other studies with PIRLS data that include several European countries (e.g., Reference Martin, Foy, Mullis, O’Dwyer, Martin and MullisMartin et al., 2013; Reference Stancel-Piatak, Mirazchiyski and DesaStancel-Piatak et al., 2013) also support the notion that early literacy skills, such as recognizing letters of the alphabet and being able to write some words, exert a positive influence on achievement. However, Reference Netten, Voeten, Droop and VerhoevenNetten et al. (2014) examined PIRLS data for the Netherlands and found a positive influence of early literacy activities, but not of early literacy skills, on achievement.
In short, students who enter elementary school knowing how to name letters of the alphabet and how to write some words score higher in PIRLS. This has been observed in most European countries, after controlling for SES, except in the Netherlands (Reference Netten, Voeten, Droop and VerhoevenNetten et al., 2014). Nevertheless, the studies reviewed suggest that variations in reading achievement in PIRLS may be related to sociocultural and linguistic factors, as well as to individual literacy abilities and skills. Furthermore, PIRLS studies suggest that individual reading habits and reading for pleasure are related to achievement in Denmark, Sweden, and France (Reference Costa and AraújoCosta & Araújo, 2017), after accounting for SES. Similar findings are reported in a Dutch study that assessed reading ability using the PIRLS variable that measures reading motivation (Reference Netten, Droop and VerhoevenNetten, Droop, & Verhoeven, 2011).
With respect to school factors, analyses of PIRLS data have shown that adequate resources for teaching reading are related with increased reading achievement (Mullis et al., 2017), as is a school’s emphasis on academic success (Reference Costa and AraújoCosta & Araújo, 2017; Reference Martin, Foy, Mullis, O’Dwyer, Martin and MullisMartin et al., 2013). Considering instructional factors, PIRLS studies do not show a strong relation with reading scores. For instance, an emphasis on reading skills in first grade is only positively related to achievement in Grade 4 in one European country – Germany (Reference Martin, Foy, Mullis, O’Dwyer, Martin and MullisMartin et al., 2013). However, this may be due to a restriction of range in reading curricula (see Perfetti & Verhoeven, Chapter 11 in this volume). Similarly, no relationships have been reported between reading achievement and types of reading instruction – whole group vs. small group or individualized instruction and time spent on reading (Reference Shiel and EiversShiel & Eivers, 2009). Reading literacy achievement in PIRLS 2011 compared with PIRLS 2006 has been associated with a decline in students’ ability to answer questions that require higher-order comprehension processes, such as understanding text structure and main idea (Reference Netten, Voeten, Droop and VerhoevenNetten et al., 2014). However, this finding has not been linked to teachers’ instructional strategies or, more specifically, to a different emphasis in reading processes. It remains difficult to ascertain cause-and-effect relations between the way teachers teach comprehension and reading achievement in PIRLS, but studies suggest that reading instruction influences reading ability (Reference Hulme and SnowlingHulme & Snowling, 2013). For example, comprehension instruction that focuses on practicing making inferences from text enhances reading attainment (Reference Elbro and Buch-IversonElbro & Buch-Iverson, 2013).
Turning next to secondary-school attainments, observed variations in reading achievement level reveal that similar student-background factors are associated with achievement and that schools can also make a difference. All rounds of the Program for International Student Assessment (PISA) show, for example, that the higher the SES the higher students score in reading, and that migrant students’ scores are lower than those of native students. In PISA, the reading achievement gap between immigrant and native students is observed even after controlling for SES (Reference Lenkeit, Caro and StrandLenkeit, Caro, & Strand, 2015). Nonetheless, students’ achievement levels reveal that European immigrant students perform better in reading-test items that mirror educational situations or contexts where reading serves the purpose of learning or acquiring information (Reference Costa and AraújoCosta & Araújo, 2012). Moreover, they perform better than native students in test items linked to occupational reading or reading that involves accomplishing a task, such as looking for a job in a newspaper or following directions in the workplace. Conversely, native students perform better in personal and public situations that imply reading for recreational purposes as well as attending public events (e.g., a concert). Last, at the European level immigrant students perform better in exposition and instruction types of text, which again are text types likely found in textbooks used in school (Costa & Araújo, 2012).
Additional student-background factors related to students’ reading achievement in PISA include parental book reading and students’ reading for enjoyment. Results show that the parent effect in reading is present because students whose parents report reading to them frequently during first grade score higher (OECD, 2012). Furthermore, they show that resilient students, as defined by those who score above what would be expected given their SES background, read frequently outside of school.
The school factors associated with reading achievement in PISA are like those found in PIRLS studies. Besides emphasis on academic success, PISA results highlight that school climate – discipline – and student–teacher relations are associated with higher achievement. Students in schools where there is a good disciplinary climate, where teachers support students and emphasize academic achievement, score higher (OECD, 2012, 2013a, 2016). School compositional effects are also present in PISA. For example, students attending schools with a socioeconomically advantaged intake tend to perform better than those attending schools with more disadvantaged peers (OECD, 2010b).
It is with the PISA surveys that the European Commission monitors progress in the EU goal of reducing the share of low achievers in reading, mathematics, and science. However, PISA 2015 results indicate that, on average, the percentage of low achievers in reading has increased slightly from 17.8 percent in 2012 to 22.5 percent in 2018 in the EU (European Commission, 2020). This indicates that almost one fifth of fifteen-year-olds in the EU do not attain a satisfactory level of reading ability that would enable them to interpret texts effectively, although there are wide variations among countries (e.g., the share of low achievers is 26 percent in Hungary, but only 8 percent in Estonia).
In the following section, we present research evidence on literacy levels in the EU based on PIRLS primary-school data and PISA secondary-school data. The analyses illustrate the association of SES and home-literacy practices with reading scores in both surveys and the relation between early literacy skills and reading achievement in PIRLS.
5.3 Literacy Levels across European Societies
5.3.1 Literacy Levels in Children
The International Association for the Evaluation of Educational Achievement (IEA) runs PIRLS every five years to measure trends in the reading achievement of fourth-grade students. At this point in their schooling, students have moved from learning to read to reading to learn (Reference ChallChall, 1996), and PIRLS tests students’ ability to comprehend both literary and informational texts. Its assessment framework defines reading literacy as “the ability to understand and use those written language forms required by society and/or valued by the individual. Young readers can construct meaning from a variety of texts. They read to learn, to participate in communities of readers in school and everyday life, and for enjoyment” (Reference Mullis, Kennedy, Martin and SainsburyMullis et al., 2006, p. 103). Reading comprehension is tested in questions that ask students to do the following: (1) focus on and retrieve explicitly stated information; (2) make straightforward inferences; (3) interpret and integrate ideas and information; and (4) evaluate and critique content and textual elements (Reference Mullis, Martin, Foy and HooperMullis et al., 2017).
The first cycle of PIRLS was carried out in 2001 and in 2016 recorded the participation of fifty countries and eleven regional entities. Twenty-four EU Member States (EU-MS)Footnote 3 collected representative data on the reading literacy skills of their fourth-grade students in 2001. The PIRLS achievement scale is based on item response theory (IRT) and scores are scaled to have an international average of 500 and a standard deviation of 100 points.
Figure 5.1 presents the average reading achievement by country and SES of fourth-graders in the twenty-two EU-MS that participated in PIRLS 2016. The graph shows that in 2016, Ireland, Finland, and Poland were the top-performing countries in Europe. Conversely, Malta, French Belgium, and France were the countries with the lowest reading scores in Europe.
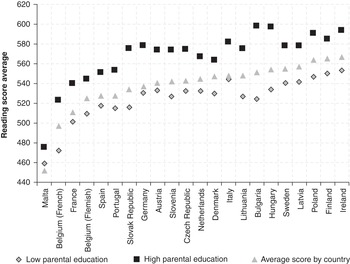
Figure 5.1 Average reading achievement by country and by SES in Grade 4 in twenty-two countries participating in the PIRLS 2016 EU-MS dataset
Notes: Countries are ranked in ascending order of the reading-score average. High parental education denotes completion of tertiary education or higher education, and low parental education denotes completion of up to upper-secondary education.
When we look at the reading scores of low SES students, using low parental educational level as a proxy, we see that those students whose parents have up to a high-school education have lower achievement than students whose parents have gone on to complete higher education. Differences in students’ reading achievement vary from about sixteen to seventy-three points, favoring students with a high parental education level, although the associations differ by country. Larger differences in reading achievement are found in Bulgaria and Hungary, and the smallest in Malta, Spain, and Denmark (Figure 5.1).
Turning next to variables prior to school entry, we use items from the PIRLS home questionnaire which asks parents to indicate how well their children were able to name letters of the alphabet before starting school and how often they or someone in the household read to their children. Evidence from studies with PIRLS data indicate that both greater alphabet knowledge and more frequent book reading at home before the start of compulsory education are associated with students’ achievement in Grade 4 (Reference AliverniniAlivernini, 2013; Reference Araújo and CostaAraújo & Costa, 2012, Reference Araújo and Costa2015; Reference Myrberg and RosénMyrberg & Rosén, 2009). Furthermore, good knowledge of the alphabet and high book-reading frequency benefit children from both high- and low-SES backgrounds across countries. These data are consistent with trends reported in several small-scale studies: Children’s ability to name letters of the alphabet before formal reading instruction begins is one of the strongest predictors of children’s reading ability (Reference Bond and DykstraBond & Dykstra, 1967; Reference RileyRiley, 1996, Reference Piasta and WagnerPiasta & Wagner, 2010), because naming letters shares a reciprocal relation with phonological awareness (Reference AdamsAdams, 1990; Reference Verhoeven, van Leeuwe, Irausquin and SegersVerhoeven et al., 2016). Similarly, parental book reading promotes reading development because when preschool-age children are exposed to book reading, they develop an understanding of vocabulary that is not commonly used in daily oral interactions (Reference Kalb and OursKalb & Van Ours, 2014; Reference Sénéchal and WasikSénéchal, 2012).
Figure 5.2 presents the reading-score average according to alphabet knowledge and students’ SES. High alphabet knowledge is positively associated with student scores. For students from low SES, Austria shows the smallest difference (one point) and Lithuania shows the largest, difference between high alphabet knowledge and low alphabet knowledge (eighty-seven points). For students whose parents have tertiary education, Austria is again the country with the lowest difference in student scores (thirteen points) and Ireland is the country with highest difference (seventy-five points).

Figure 5.2 Average reading achievement according to alphabet knowledge and SES in Grade 4 in twenty-two countries participating in the PIRLS 2016 EU-MS dataset
Notes: Grey lines and symbols correspond to low parental education. Black corresponds to high parental education. Dotted lines correspond to low alphabet knowledge and solid to high alphabet knowledge.
Overall, except for Austria, Spain, and Belgium (Flemish speaking), and France, the differences in reading scores related to alphabet knowledge are larger for the low-parental-education group. That is, children whose parents have a low educational level seem to reap more benefits from knowing the letters of the alphabet very well than children whose parents have higher levels of education. However, as Figure 5.2 shows, within the same SES background knowing the letters of the alphabet very well is consistently related to higher student achievement.
Figure 5.3 shows the association between frequency of book reading before the start of compulsory education and the reading achievement of fourth-grade students whose parents have high and low education levels (SES). It clearly shows that within an SES band, high frequency of home book reading is always related to higher student achievement, although there are country-wise variations in the range within each band. For students whose parents have low educational levels, the Slovak Republic shows the largest effect of preschool book reading (160 points); for students whose parents have high educational levels, Sweden has the largest effect (79 points). The graph also reveals that the contribution of home reading to the achievement of students from distinct SES backgrounds is different in different countries. In particular, in a group of ten countries – Bulgaria, the Czech Republic, Finland, France, Hungary, Ireland, Latvia, the Slovak Republic, Slovenia, and Belgium Flemish – the magnitude of the reading score difference between high and low home-reading exposure is larger for students with low SES. In contrast, in Austria, Denmark, Germany, Italy, Lithuania, Malta, the Netherlands, Poland, Portugal, Spain, Sweden, and Belgium Flemish, the magnitude of the reading-score difference between high parental book reading and low parental book reading is larger for students with high SES.

Figure 5.3 Average reading achievement according to parental book reading and SES in Grade 4 in twenty-two countries participating in the PIRLS 2016 EU-MS dataset
Notes: Grey lines and symbols correspond to low parental education. Dark Black corresponds to high parental education. Dotted lines correspond to low book-reading frequency and solid to high book-reading frequency.
5.3.2 Literacy Levels in Adolescents
PISA is a cross-sectional survey launched in 2000 by the Organisation for Economic Co-operation and Development (OECD). Its purpose is to assess how ready youngsters are to either enter the workforce or continue further studies, enabling countries to monitor their progress in meeting key learning objectives (OECD, 2013a). The OECD has been running this international large-scale assessment of fifteen-year-old students’ skills in reading, mathematics, and science every three years. Each assessment cycle focuses on a main domain or knowledge area and reading was the main domain in 2000, 2009, and 2018, whereas science was the focus in 2006 and in 2015 and mathematics the focus in 2003 and 2012. In PISA, students’ scores are computed according to IRT and standardized with an OECD mean of 500 and a standard deviation set at 100 in 2000.
In PISA 2018, “reading literacy is understanding, using, evaluating, reflecting on and engaging with texts in order to achieve one’s goals, to develop one’s knowledge and potential and to participate in society” (OECD, 2019, p. 28). In much the same way as PIRLS does, PISA examines the extent to which students are able to understand and integrate the information in informational and literary texts by including the following dimensions in its assessment framework: (1) Retrieve texts and access them; (2) interpret and integrate texts; and (3) reflect and evaluate texts. In addition to the achievement score, PISA also collects information on students’ sociodemographic and dispositional characteristics, students’ home environments, and teaching and learning contexts in schools (Reference Lenkeit, Chan, Hopfenbeck and BairdLenkeit, et al., 2015) through the application of student and school questionnaires.
In order to examine the reading achievement of fifteen-year-old European students we focus on the most recent PISA 2018 data, which had reading as a main domain. Figure 5.4 shows the average reading score by country and SES across the PISA 2018 participating EU-MS, for which data are publicly available. The graph shows that there is great variation in students’ reading scores, with the difference in scores among EU-MS reaching about 100 points (Estonia vs Bulgaria). Estonia, Finland, and Ireland are the top performers, while the EU-MS with the lowest performance in reading are Bulgaria, Romania, and Malta.

Figure 5.4 Average reading achievement by country and by SES of fifteen-year-old students in twenty-five countries participating in the PISA 2018 EU-MS dataset
Notes: Countries are ranked in ascending order of the reading score average. High parental education denotes completion of tertiary education or higher education and low parental education denotes completion of up to upper-secondary education.
When comparing the reading scores for high- and low-SES students, using parental educational level as a proxy, we see that students whose parents have tertiary education perform better in reading than the ones whose parents have not completed higher education. Differences in students’ reading achievement vary from about one, in Croatia, to fifty-three points in Poland, favoring the students with a higher parental education level. These findings are in line with those from the previous section showing that differences in reading achievement according to students’ SES are already present in primary education. Additionally, this is in line with evidence from OECD that uses PISA 2009 data. In particular, across OECD countries students with a higher socioeconomic status outperform disadvantaged students in reading on average by thirty-eight score points, or about one year’s worth of education (OECD, 2010b). This corroborates evidence that there is an association between parents’ educational attainment, used as a proxy of students’ SES (Reference Jerrim and MicklewrightJerrim & Micklewright, 2014), and students’ achievement (Reference Pokropek, Borgonovi and JakubowskiPokropek, Borgonovi, & Jakubowski, 2015).
With respect to the home environment, and in accord with Sénéchal’s home literacy model, the PISA home questionnaire implemented in some countries in 2009 and 2018 asked parents how often they read to their children during their first year in primary education (OECD, 2012). Figure 5.5 presents the association between frequency of book reading and the reading achievement of fifteen-year-old students by parental educational level in EU-MS. It is evident that, in general and irrespective of parental educational level, high frequency of home book reading is associated with higher student achievement. The highest contribution of home reading for the achievement of students is found in Luxembourg and Belgium and the lowest difference is found in Croatia. These results are in line with those found using PIRLS data (Reference Araújo and CostaAraújo & Costa, 2015), showing that a higher frequency of home book reading is related to higher student achievement in the same MS, although these results do not pertain to the same cohort of students.

Figure 5.5 Average reading achievement by country, parental book reading, and SES of fifteen-year-old students in twenty-five countries participating in the PISA 2018 EU-MS dataset
Notes: Grey lines and symbols correspond to low parental education. Black corresponds to high parental education. Dotted lines correspond to low book-reading frequency and solid to high-Book-reading frequency. The graph includes EU-MS for which PISA 2018 data is available for the variable “home book reading.”
A comparison of home literacy in PIRLS and PISA shows that reading to young children gives them a head start in reading achievement, as retrospectively reported by parents in PIRLS (e.g., how often children were read to before the start of compulsory education) and during the first year of primary education in PISA (e.g., how often children were read to at the start of compulsory education).
Overall, the analyses presented in this chapter show that in PIRLS students are better readers in fourth grade when they were read to during the preschool years (Reference Araújo and CostaAraújo & Costa, 2015). Similarly, PISA 2018 students who were read to when in first grade are better readers at age fifteen, and this is in line also with findings using the PISA 2009 dataset (OECD, 2011). This highlights the positive reading outcomes accrued from home reading at a young age, a significant finding also with Australian children (Reference Kalb and OursKalb & van Ours, 2014) and with Canadian children (Reference Sénéchal and WasikSénéchal, 2012). Clearly, ILSAs such as PIRLS and PISA provide rich data for cross-country comparative analyses and the contextual information they collect allows us to understand what factors are associated with variations in the reading literacy performance of students. Although they are not longitudinal studies, the findings related with book reading in European countries converge with evidence from longitudinal research in Australia and Canada (Reference Kalb and OursKalb & van Ours, 2014, Reference Sénéchal and WasikSénéchal, 2012). The PISA results, however, also suggest that different European countries present particular relations between reading achievement and home book reading. In Croatia, for example, student scores change very little according to frequency of parental book reading with SES level. In contrast, in Poland, Belgium, and Bulgaria, score differences are much wider according to SES level. It is possible that children’s exposure to shared book reading in preschool kindergarten classrooms also varies among countries and that frequent exposure reduces the effects of home variables, but PIRLS and PISA do not collect such data. Research supports this conjecture and there is evidence that this effective early instruction practice promotes fourth-grade language and reading abilities (Reference Dickinson and PorcheDickinson & Porche, 2011).
5.4 Role of Ecological Factors
5.4.1 Role of Socioeconomic Status
The analyses we present show that there are variations in achievement across countries and that socioeconomic variations within and across countries are associated with differences in reading achievement. High-SES students surveyed in PIRLS and PISA show higher achievement than low-SES students in all EU Member States. In addition, our analyses show that home book reading and early literacy skills can contribute to increased reading achievement in PIRLS for both groups of students. In this sense, early literacy skills and home practices before the start of primary school can help improve the reading abilities of students with different SES.
PIRLS research also shows that a school’s SES composition explains variation in students’ reading achievement in EU-MS (Reference Martin, Foy, Mullis, O’Dwyer, Martin and MullisMartin et al., 2013). The study by Reference Stancel-Piatak, Mirazchiyski and DesaStancel-Piatak et al. (2013) found that in three PIRLS-2011-participating European countries – Denmark, Germany, and France – a school’s average of students’ cultural capital, measured by the number of books at home, was one of the most relevant variables in explaining variation in reading scores. Reference Myrberg and RosénMyrberg and Rosén’s study (2006) found that in PIRLS 2001, students’ cultural capital accounted for a large part of reading score differences between independent and public schools. These findings suggest that it is not only individual/home SES that matters, but that to a lesser extent a school’s SES compositional effect also shapes reading achievement in PIRLS (Reference Araújo and CostaAraújo & Costa, 2012; Reference Costa and AraújoCosta & Araújo, 2017). PISA findings corroborate this with adolescents (OECD, 2013b).
5.4.2 Role of Home Literacy Experiences
Different analyses of PIRLS confirm that both early literacy skills and practices, such as home book reading, in conjunction with other characteristics of effective schools, have a positive influence on achievement (Reference Araújo and CostaAraújo & Costa, 2012, Reference Costa and AraújoCosta & Araújo, 2017). Moreover, PIRLS studies suggest that motivational factors, like students’ enjoyment of reading, are positively related to achievement (Reference Costa and AraújoCosta & Araújo, 2017; Reference Stancel-Piatak, Mirazchiyski and DesaStancel-Piatak et al., 2013).
The home literacy environment, namely home book reading during the preschool years and the first year of primary school, contributes to higher reading achievement in PIRLS and PISA. This is in accord with Reference Sénéchal and WasikSénéchal’s (2012) home literacy model. In addition, and in accord with Reference Sénéchal and WasikSénéchal (2012) and with findings from research that looks at predictors of reading ability, the ability of young children to recognize the letters of the alphabet contributes to reading achievement in PIRLS. In this survey, parents are asked how well their children recognized the letters of the alphabet before the start of compulsory education. Children could have learned them at school or at home or in both settings. In this sense, this predictor of reading attainment in fourth grade is not restricted to the home literacy environment and research indicates that alphabet knowledge can be successfully acquired in school (Reference Shager, Schindler and MagnusonShager et al., 2013).
Findings from other studies that use PIRLS and PISA data and the information collected in student and parental questionnaires reveal interesting links between achievement and students’ sociodemographic and dispositional characteristics (Reference Lenkeit, Caro and StrandLenkeit, Caro, & Strand, 2015). For example, in PIRLS reading for enjoyment outside of school contributes to higher achievement in Denmark, Sweden, and France, after controlling for SES (Reference Costa and AraújoCosta & Araújo, 2017). Similarly, in all EU countries, secondary students who enjoy reading perform significantly better than students who have not developed an interest in reading (OECD, 2010a). This suggests that literacy practices can partially compensate for students’ socioeconomically disadvantaged backgrounds.
5.4.3 Role of Educational Factors
While the relationship of SES and home literacy practices with achievement is similar in all EU-MS, the relation of school-related literacy practices with achievement is more particular in terms of variation across countries. Similarly, for other school-level characteristics, such as emphasis on academic success, there is more variation across countries.
For example, research with PIRLS data shows that a school’s emphasis on academic success is related to higher achievement in France, but not in Denmark or Germany, which suggests that school effects are country specific (Reference Stancel-Piatak, Mirazchiyski and DesaStancel-Piatak et al., 2013). Reference Martin, Foy, Mullis, O’Dwyer, Martin and MullisMartin et al. (2013) used PIRLS 2011 data to study the characteristics of effective schools and their findings corroborate the positive influence of good discipline and of emphasizing academic success. However, a school’s early emphasis on reading skills is only positively related to achievement in one European country – Germany. Conversely, the index of early literacy skills, which includes the ability to name alphabet letters before the start of compulsory education, is positively associated with higher achievement in all European countries (Reference Martin, Foy, Mullis, O’Dwyer, Martin and MullisMartin et al., 2013).
Other factors related to schools and teachers have been found to also influence the achievement levels of fifteen-year-old students in PISA. For instance, students attending schools with a better disciplinary climate and better teacher–student relations perform better in reading (OECD, 2010c). This is supported by school effectiveness research, which suggests that school climate is a factor that explains variance in students´ achievement in reading (OECD, 2013b).
Clearly, PIRLS and PISA-related research has called attention to the school factors that seem to make a difference or that have “an effect on student achievement over and above” student/home predictors (Reference Martin, Foy, Mullis, O’Dwyer, Martin and MullisMartin et al., 2013, p. 111). Nonetheless, evidence of a school´s added value linked to student–teacher relations and instructional practices is limited, especially in PIRLS studies. Moreover, existing PIRLS studies suggest that factors like a school’s academic climate and literacy practices and their relationship with students’ achievement are more country specific than those factors associated with student-background variables (Stancel-Piatak et al., 2013).
5.5 Conclusions and Discussion
This chapter began by offering a historical overview of the spread of literacy in Europe and by discussing current notions about schooling and literacy abilities. Good literacy and numeracy skills equate with good life outcomes (Reference Heckman and JacobsHeckman & Jacobs, 2009) and current ILSAs at the primary- and secondary-school levels offers indicators of these cognitive skills. PIRLS has received considerably less attention as a survey that can tell us how well the world’s fourth-graders read, yet the information it provides can be useful in that it shows the value of early intervention to promote reading achievement (Reference Choi and JerrimChoi & Jerrim, 2016). Given the interdependence between reading and learning, it is important to monitor whether young readers develop good comprehension skills during primary education. Those who do not are at risk of school failure (Reference Adams and HiebertAdams, 2009).
The analyses presented for EU-MS show that Finland is a top performer in both PIRLS and PISA. This only partially supports the notion that results vary according to historical patterns of the spread of literacy in Europe. Literacy was already widespread in Finland in the 1900s, but this was also the case in France, which displays a much lower reading achievement in PIRLS and PISA. In PIRLS, Italy ranks higher than France, but in France literacy was more widespread in the 1900s. Regarding orthographic depth, Irish and English fourth-graders score higher than Spanish and Italian students, but the latter learn to read in quite transparent writing systems. Thus, no facilitating effect of language transparency is observable.
The cross-linguistic studies reviewed indicate that linguistic variations associated with orthographic depth can facilitate or make more difficult the acquisition and development of reading abilities. However, in PIRLS we do not observe a pattern of achievement in different countries indicating that children learning more opaque orthographies have lower reading achievement than those that learn more transparent languages. Different reasons may account for this. Perhaps the effects associated with orthographic depth are only observable at the beginning stages of learning to read. It could also be that because PIRLS uses authentic texts, this produces reading-comprehension results that differ from those observed when word and pseudoword fluency and cloze comprehension tests are used (Reference Cutting and ScarboroughCutting & Scarborough, 2006). As Reference CattsCatts (2009) argues, we should not underestimate the complexity of reading comprehension, which is “not a skill like word recognition that can be mastered in a relative short time, but rather a collection of knowledge and processes that takes many years to acquire” (Reference CattsCatts, 2009, p. 178). In this chapter we highlighted how early literacy skills and practices can affect reading achievement, but other variables related to reading instruction, namely reading comprehension, in different countries may also modulate student performance.
The results also highlight that some countries, such as Latvia, are better positioned in PISA than in PIRLS. Nevertheless, different countries participate in the two surveys, and reading-score averages are calculated for the specific participating countries. In addition, we must keep in mind that the reading assessment frameworks of PIRLS and PISA are similar, but not identical. PIRLS, in particular, seems to assess very basic reading-comprehension processes. When compared to the National Assessment of Educational Progress (NAEP), for example, PIRLS asks for the retrieval of text information that matches verbatim the questions asked while NAEP includes more questions that require higher levels of interpretation (U.S. Department of Education, 2003). Moreover, NAEP passages are written at a seventh-grade level, whereas PIRLS passages are written at a fifth-to-sixth-grade level (U.S. Department of Education, 2003).
Importantly, the research evidence presented based on PIRLS suggests that although SES is a determinant of reading achievement, home book reading and alphabet knowledge can contribute to increased reading scores. PISA data based on parental questionnaires in some participating countries also corroborate the positive influence of book reading to young children. This suggests that what parents do is important. Additional research suggests that both in PIRLS and PISA autonomous, recreational reading outside of school is a factor that relates to higher reading achievement. School factors, such as a positive disciplinary climate and good teacher–student relations, also contribute to increased student scores. Thus, teachers and what teachers do are also important in boosting reading achievement. However, PIRLS and PISA variables present limitations in terms of unraveling possible links between reading instruction and achievement. For example, the role of preschool teachers in exposing children to the same types of home shared-reading experiences is not captured in these surveys.
Still, International Large-Scale Assessments provide a rich basis for designing evidence-based policies and for monitoring achievement trends over time in a comparative perspective. The comprehensive information provided in these surveys and the high number of participating countries make it possible to investigate commonalities and differences in reading achievement and their relationship with student background and ecological factors. In the case of the EU, this is even more relevant because of common educational goals. The results we present suggest, for instance, that to reduce the influence of SES background, countries should encourage interactions around books. Curricula that contemplate teaching the alphabet before the start of compulsory education may also give children a head start in reading. Building a supporting school environment that encourages academic success should also be a priority.
Future research using ILSA should build on the existing evidence about the factors that are related to reading-achievement levels and try to confirm or disconfirm universals and particulars – what is country specific and what is more universal across countries. Most studies conducted thus far are correlational in nature and more research is needed to disentangle cause-and-effect relationships. Additionally, our knowledge of the development of reading skills and their relationship with reading achievement would gain much from observational studies that document how reading curricula are implemented and how reading comprehension strategies are taught in different educational systems.
6.1 Introduction
The understanding of literacy in Russia requires the analysis of several issues. To begin with, historical changes in the provision of education in the region, and the introduction of a modern educational system in preschool (kindergarten age four–six years) and primary school (Grades 1–4) need to be considered. This is because, in recent years, a transformation has been recorded in both the number of educational institutions and the nature of the educational process. Furthermore, the Russian scholarship on writing and reading disorders requires examination in view of several internal contradictions and inconsistencies in the approaches to psychological and pedagogical support available for children with these disorders. The situation may be described as a disconnection between the diagnostic processes and remedial methods used in Russia and the international experience. This chapter will start out with a description of the Russian writing system. This will be followed by an overview of teaching and assessment methods over the past decades. Finally, a reflection will be provided on the identification of children with reading problems and strategies for remediation.
6.2 Features of the Russian Orthography
The Russian orthography is alphabetical, with thirty-three letters representing forty-two phonemes. The relationship between sound and letter is not unambiguous. One letter can correspond to several sounds and vice versa, with one sound indicated by a letter or letters in different ways. In literacy instruction, the main and secondary letter sounds are distinguished and highlighted. In addition, there are elements of syllable writing involved. In the initial stages, children become acquainted with graphics as possible options for designating sounds with letters. In the process of decoding and coding words, problems of different complexity need to be solved. First, as with any alphabetic system, a novice reader is forced to update letter–sound correspondences as they encounter various aspects of the orthography. However, with certain cognitive deficits it may become difficult to identify a letter, since there are several visually similar letters in Russian and acoustically similar sounds as well (e.g., within phonological oppositions). In addition, the syllabic principle of reading requires a consonant postposition analysis. The phonological opposition of the softness–hardness of consonants can be conveyed by letter soft signs or by follow-up vowels. This “economizes” the size of the letter system but creates difficulties for the child, since it is a departure from the principle of one sound–one letter correspondences.
By reading aloud syllable by syllable, novice readers may put a word together, but they may get a phonological variant that does not correspond to a valid pronunciation of the word. This may be due to confusion in letter–sound correspondence, with the main rather than the secondary sound value available for the target letter. For example, the Russian pronunciation is characterized by devocalization of voiced consonants at the end of words, but in writing these sounds are determined by their strong (intervocal) phonetic position: дуб (oak) is vocalized as [dup] in its singular form, but due to its strong, intervocal position in the plural it is written as дубы (oaks) where it sounds voiced [duby]. Thus, even though a uniform spelling for a family of morphemes that are carriers of shared meaning may create decoding challenges, it may optimize reading by providing quick lexical access in an experienced reader’s case. Children need training and the opportunity to build up a sight vocabulary to be able to take advantage of it. At the initial stages, when reading aloud they tend to repeatedly try to choose the closest phonetic word from memory or rely on the available context (Reference EgorovEgorov, 2006).
The process of learning to spell in Russian is somewhat different from learning to read. Russian spelling is not only based on orthographic but also on morphological and grammatical principles (Reference Shcherba and ZinderShcherba, 1983; Reference ZinderZinder, 1987). The morphological principle dominates Russian spelling, involving prefixes, roots, suffixes, which are written consistently. For the child it is important to learn, for example, how to find a word with an explicit, unambiguous spelling among words with the same root. In such case, the learner will have to check the spelling of the last letter in the word сад (‘garden’), comparing it with the word сады (gardens), and will need to proceed vice versa to check the spelling of the unstressed root vowel in the word сады (‘gardens’), comparing it to the word сад (‘garden’), in which this vowel is stressed. There are several morphological principles that underpin Russian spelling, and it may be expected that children will require a high level of morphological awareness to learn to spell in Russian. The grammatical principle governs spellings that convey a particular grammatical meaning. For example, строится and строиться (‘is being built’ and ‘be built’) are the indicative and infinitive grammatical forms of the same verb; they have a different spelling but are pronounced the same way. And finally, unlike the morphological and grammatical principles, some words have deep historical roots such that their contemporary spelling is based only on tradition. In such instances, the child must simply remember the spelling of words or morphemes.
6.3 Teaching Russian Literacy
6.3.1 Analytic and Global Methods
Russian literacy instruction is dominated by the analytical-synthetic method, which is focused on sound units in a word (Reference Lvov, Goretsky and SosnovskayaLvov, Goretsky, & Sosnovskaya, 2000). Methods that are based on global reading do not have wide popularity nor official recognition. They were relatively popular in the early 2000s, mainly in the parental environment: such methods include those outlined by Reference DomanDoman (1998), Reference ReznichenkoReznichenko (2012), and Reference ZaitsevZaitsev (2000), as well as Chaplygin’s cubes (2019).Footnote 1 The first two approaches are global in the full sense, with children being introduced to a word as a whole. Doman’s method is more often used in kindergarten or even preschool. By contrast, Reznichenko’s method is designed for six–eight-year-old learners, gradually guiding them from a global to an analytical approach to decoding and coding the Russian orthography. The contemporary use of such strongly global methods was “tested” in Russia in the 1920s (Reference Lvov, Goretsky and SosnovskayaLvov et al., 2000). The syllabic teaching method (Reference ZaitsevZaitsev, 2000; Chaplygin’s cubes) can be classified as “semi-global”; its historical roots go back to the late nineteenth and early twentieth centuries. In this method, letter–sound correspondences are not explicitly taught; children practice syllable lists instead. This makes it easier to switch to analytical reading.
There are also many variations of the analytical-synthetic method. Russian creators of ABC books have gone from invariant models of teaching to the practical implementation of different technologies. In the Soviet period, from the end of the 1930s to the beginning of the 1980s, the literacy-teaching methodology was quite invariant. Children began school at the age of seven, with primary education for three years. The teacher had one common primer, and the only significant change that occurred during this period was the introduction of separate reading and writing lessons, that is, the transition from co-teaching reading and writing to parallel learning (Reference Lvov, Goretsky and SosnovskayaLvov et al., 2000). The teaching of the Russian language at school was characterized by a transition from practical language experiences to language generalizations, with literacy teaching based on moving from letter to sound. The sound values of a letter were simply communicated, and after a few exercises in which children were asked to find the target sound in a word, they were introduced to reading syllables and then words. These practice exercises began immediately after the introduction of letters, which made it possible for young learners to form implicit conclusions based on experience. The use of a special order in which to introduce the letters helped preserve the rule of simplicity in the lesson and not overload the child. The longest period in Soviet literacy studies is associated with the idea of the gradual introduction of those letters that are difficult in terms of their lack of transparency in letter–sound correspondences. For example, the letter M has only two sound values in any position in the word: [m] and [m ’]. Paired consonants, based on voiceless and voiced features, have four sound values, and the sound values of some vowels depend on their position. Therefore, in the Soviet school primers, the sonorants (m, n, r, l) were introduced first, then the paired unvoiced consonants, followed by voiced ones, with the complex vowels studied last.
From the early 1980s onward, reforms in the primary education system popularized the idea of the need for earlier literacy instruction (Reference SilchenkovaSilchenkova, 2006). This acceleration was perceived as a challenge to teaching practitioners. A gradual transition to four-year schooling began for six-year-old children. During this time, the literacy curriculum also changed by accounting for letter frequency in the Russian language. According to the curriculum developers (Reference Lvov, Goretsky and SosnovskayaLvov et al., 2000), this created the opportunity to offer full, lexically rich texts for reading earlier in the learning program, in order to contribute to a more comprehensive development of children’s literacy skills. However, this frequency-based approach led to the early introduction of complex letters. This problem of complexity was solved by increasing the proportion of exercises for phonological analysis, and by using detailed sound schemes that highlighted sound properties as follows: vowels, consonants, hard sounds, soft sounds, stressed sounds, and unstressed sounds. In our opinion, Goretsky’s curriculum of 1982 strengthened the phonics component in the Russian literacy education by instructing first-graders to master sound–letter connections and to make abstract generalization from these connections in words. Another systemic change in the 2000s was a transition from a unified to a more variable education program, with Russian schools receiving new primers and alphabet books. The elementary school began to be seen as a “school of cultural-activity pedagogy of variative education,” “the basic stage of designing universal educational activities,” the main task of which was to learn how to learn (Reference AsmolovAsmolov, 2013, p. 9).
Proponents of developmental education’s polemic against proponents of the traditional pedagogy had already been going on for a long time. Almost in parallel with the appearance of Goretsky’s alphabet book was the appearance of the school primer by Elkonin and collaborators based on the idea of development-centered child education (Reference ElkoninElkonin, 1992, Reference Elkonin and Feldstein1997). Its structure and content are founded on the principle of a functional meaning of letters and their role in Russian writing, and on the position-oriented principle. The position-oriented principle, on which Russian orthography is based, is actively deduced by students together with the teacher before reading. The path used is from sound to letter. First, sounds from a word are distinguished, then consonant characteristics (hard or soft) are clarified, after which a decision is made as to a letter that should represent the softness of the consonant and the actual vowel. This phonemic analysis precedes word decoding, and children only begin reading the first syllables several months later. This way of teaching literacy is based on the principle of ascent from the abstract to the concrete (Reference ZuckermanZuckerman, 2011). Even the introduction of the child to the rules of Russian morphology remains a subject of pedagogical discussion. And literacy is one of the most controversial issues here. It has been assumed that a preschooler with their syncretic perception of speech is faced with the need to be aware of complex linguistic phenomena and should therefore be exposed to a rich range of complex phonology in a structured way (Reference Velichenkova and VelichenkovaVelichenkova, 2018b). However, it has also been argued that a “language model developed for scientific purposes and a didactic model that is a way of presenting a language in the educational process are not required to coincide” (Reference LeontievLeontiev, 2016, p. 140).
Currently, Elkonin’s system is implemented in two school primers: Reference Zhurova and EvdokimovaZhurova and Evdokimova’s (2014) and Reference Repkin, Vostorgova and LevinRepkin, Vostorgova, and Levin’s (2019), with the former the most widely used (Reference Glagoleva, Arkhipova and BoykinaGlagoleva, Arkhipova, & Boykina, 2019).Footnote 2 A recent federal list of textbooks that schools may use includes six school primers (Order of the Ministry of Education; 2019). The most popular is Goretsky’s textbook, which is used by about 40–60 percent of teachers (Reference Glagoleva, Arkhipova and BoykinaGlagoleva et al., 2019). Although Goretsky’s book is perceived by the pedagogical community as a traditional textbook, all the features of the new school methodology are inherent in it, including an increased role for analytical sound exercises and for the teaching of relevant knowledge in the field of phonetics.
6.3.2 Role of the Home Environment
In the contemporary Russian education system, we have started to observe phenomena very similar to the trends in Russia at the turn of the nineteenth and twentieth centuries: individual home-schooling flourishes in the context of state-education differentiation (Reference ShtetsShtets, 2009). These phenomena are especially characteristic in the initial stage of the child’s education. At the same time, one gets the feeling that the vectors of official and family approaches to teaching reading are regarded as opposites (Velichenkova, 2018а; Reference Velichenkova, Gorilko and BorisenkoVelichenkova & Gorilko, 2019). In the case of home literacy support, there is usually a parent acting as a teacher, and the book that is used by this “naive methodologist” is of particular importance. An approach often adopted by families who are trying to get away from the school primer is to look for a preschool one. Preschool textbooks do not require examination and testing; the choice to purchase them is the parents’ private matter. While only six school primers are on sale, there are about sixty preschool ones available. Despite such a huge selection and the significance of preschool family education, a comparative analysis of the manuals and methods in Russia has not been carried out.
Even more surprisingly, almost half of preschool primers are logopedic, with roots in speech therapy. It seems likely that there are objective factors that make logopedic textbooks attractive for parents. We attempted a comparative analysis of seven modern logopedic ABC books (Reference BatyaevaBatyaeva, 2017; Reference IlyinaIlyina, 2015; Reference KosinovaKosinova, 2006; Reference Krylova, Pisareva and IpatovaKrylova, Pisareva, & Ipatova, 1989; Reference NischevaNischeva, 2004; Reference ZhukovaZhukova, 2016; Reference ZhukovaZhukova, 2017). These primers usually emphasize that they have been compiled based on the authors’ extensive experience, but there is no scientific justification of this experience in peer-reviewed publications. Most authors highlight the traditional nature of the literacy-teaching methodology used in the textbook, and that it is supplemented by speech-therapy technologies. Parents wanting to find an alternative to the modern school primer and relying on their own experience of school accept this message and buy a traditional primer. For example, in the most popular “logopedic ABC book” by Reference ZhukovaZhukova (2017), the order in which letters are introduced keeps to the traditions of the Soviet period: The letters that come first are those that are unequivocal in terms of sound meaning. Other logopedic primers use a different order. Back in the 1960s, the idea emerged of postponing the study of late-mastered sounds (e.g., r, l, sh, s) to assist the literacy of children with a speech pathology. Since, in the case of speech disorders, these sounds are not being pronounced correctly by the time the child enters school, the corresponding letters are postponed to a later part of the curriculum.
Logopedic ABC-book preschool primers do not usually include many exercises for sound analysis and linguistic schematization. After all, they are focused on family education, and subtleties of phonology are inaccessible to the parent. If we compare the volume of speech material of three types (syllables, words, sentences), then it turns out that the logopedic ABC books on average are more extensive than, for example, the school primer by Reference Goretsky, Kiryushkin and VinogradskayaGoretsky et al. (2012) in terms of the numbers of syllables and words for reading. However, in terms of text volume, they are still behind due to the greater level of attention paid by their authors to reading a syllable and a word, and to their use of adapted texts that are shorter and simpler. Thus, in contradiction to the approach of strengthening the role of analytical strategy in schools, training in logopedic ABC books is being built rather more synthetically and at the same time more intuitively.
6.4 Monitoring of Preschool and Primary-Education Outcomes
6.4.1 Monitoring Literacy Education
Preschool literacy teaching is a common phenomenon that is not regulated by the state. Let us try to briefly describe the state system of preschool and school education organization and education quality data. Preschool education is not obligatory; parents can use the services of the state kindergarten when their child reaches three years of age. There are state standards for preschool and school education that describe the requirements for the structure of educational programs, their implementation conditions, and how results should be assessed. The preschool standard (Federal State Educational Standards, 2019) emphasizes preschool education optionality in the Russian Federation. The educational program formulates its targets, but not children’s specific educational achievements. The program is compiled by the educational institution itself based on a sample program which the Ministry of Education has approved and posted on its website (Inventory of Sample Main Basic Education Programs, 2019). In addition to the development of all components of speech, it must only include the formation of sound analytical-synthetic activity as a precondition for literacy teaching. This means that in Russian kindergartens, literacy is not taught in an explicit way. A kindergarten teacher is not confronted with such a task. However, the teacher can conduct classes with children according to the chosen standard textbook, which to some degree develops sound-analytic and synthetic activity, whereas in some cases letters, syllables, and words are presented for literacy development.
Primary education starts at around seven years of age and lasts for four years. There are two state standards for elementary schools: general (valid since 2010) and those for children with special health needs (Health Impact Assessment HIA) (valid since 2016). The programs’ content formulates concrete targets for children to master in which reading literacy occupies a significant place. The disciplines in the philological block include the Russian language, literary reading, and a foreign language. At the time of writing, there are seven textbook series for teaching the Russian language and five for literary reading. The school carries out the assessments to establish whether students have mastered the program. This is done by means of marks attained at an intermediate stage in combination with the results of the final test. There is a state system for the monitoring of education quality. The marks received by schoolchildren through any such monitoring do not affect their final marks; they only serve as a tool for identifying problem areas and the education level in schools as well as in regions.
6.4.2 Literacy Outcomes
Russia has been participating in the PIRLS (Progress in International Reading Literacy Study) since 2001. From sixteenth place in its ranking, Russia has since climbed close to the top, where it has remained since 2006, which may be due to greater parental involvement. Research has consistently shown that Russian parents are the most active participants in the formation of children’s reading literacy among all the participating countries (Reference Mullis, Martin, Kennedy and FoyMullis et al., 2007 [PIRLS-2006]).
In PISA, reading literacy results have been extremely low. Starting in 2000 at twenty-seventh place, Russia kept worsening its position until 2012 (forty-second place), and then in 2015 returned to twenty-seventh place. The discussion about the poor results of Russian children in this study is ongoing (Reference Zuckerman, Kovaleva and KuznetsovaZuckerman, Kovaleva, & Kuznetsova, 2011). Obviously, students’ initial reading competency is well formed, but the complex of competencies that are usually described as making up functional literacy are not sufficiently developed.
The All-Russian Test Work initiative is compulsory in elementary schools; its tests are held once a year on the main subjects (the Russian language in all classes). As to outcomes on the All-Russian Test Work over the past five years, 4.6 percent of the population showed literacy problems.Footnote 3 For writing, 7.8 percent of primary-school graduates could not cope with the test, as shown from their performances on the ability to copy a text, use of spelling and punctuation norms, and independent writing.
6.5 Children with Learning Disabilities
6.5.1 Assistance for Children with Disabilities
Recently, progress has been made in the assistance system for children with learning disabilities. The system has undergone significant changes since 2013, especially in schools. The Law on Education was adopted in 2013 and introduced the concepts of “children with limited health abilities” and “adapted educational programs” (Federal Law of December 29, 2012). A child with limited health abilities (LHA) is defined as “an individual with physical and/or psychological developmental deficiencies confirmed by a psychological, medical and pedagogical commission as hindering education if special arrangements are not in place” (Federal Law of December 29, 2012). Adapted educational programs were created to teach children with disabilities, taking into account the peculiarities of their psychophysical development, individual capabilities, and social adaptation. These programs were focused on children with vision, speech, hearing, and motor impairments, as well as delayed mental development. It is important to note that reading and writing impairments are not specifically distinguished from each other (Reference Volkova and ShakhovskoyVolkova & Shakhovskoy, 1998). Reading and writing disorders are considered only because of either a phonological processes deficiency or general underdevelopment of speech. The terms dyslexia and dysgraphia are simply absent from the school standard, although, as we will see later, they are widely used in professional support systems.
Children who have difficulty in mastering reading and writing are often diagnosed as having a speech disorder or a delay in mental development. Their parents are advised to apply for an adapted program for the child based on a more intensive standard program or an approximate adapted program, (partly) outside the classroom. This new assistance system differs from the one that existed before primarily by virtue of its strengthening of the mediating role of medical-psychological-pedagogical commissions. Unfortunately, there are many unsolved problems with this system. The most important one is personnel. There are no mechanisms to encourage schools to employ a speech therapist. Furthermore, parents tend to mistrust the input of this new institute of medical-psychological-pedagogical commissions.
6.5.2 Public Perception of Children with Reading Disabilities
In 2019, on the initiative of the Association of Parents and Children with Dyslexia and with the financial support of the Our Future Foundation and the Ministry of Education of the Russian Federation, an independent research agency (MAGRAM MR) carried out an unprecedented survey to determine the level of awareness and attitudes toward problems with writing and reading in society and among professionals. Our role was to expertly evaluate the results. The all-Russian population survey included 2,516 telephone interviews (the sample represented the population of the Russian Federation by sociodemographic characteristics). The survey of professionals was carried out using an online questionnaire. The support of the Ministry of Education of the Russian Federation made it possible to collect data on 32,406 school specialists.
The survey found that only 17 percent of the Russian population understands what dyslexia or dysgraphia are. Eighty-three percent do not know these terms: 61 percent of these respondents do not know anything about the problem; 22 percent have heard of the terms but cannot explain their meaning. Young participants (from eighteen to thirty-four years old) demonstrate a higher level of knowledge of the terms in question than representatives of the older age groups. According to almost half of participants (49 percent), one of the main causes of dyslexia/dysgraphia is parents’ neglect their children and failing to provide the necessary participation in their upbringing and education. Thus, the child’s health problem is “shifted” onto the parents. Only a quarter to a third of respondents said that the cause of the problem relates to the child’s neurobiological characteristics. A fourth of respondents indicated that the causes of the problem under consideration lie in the irregularly organized school educational process, including a high level of high teacher workload (28 percent), high-school requirements (25 percent), and insufficient attention from support specialists (24 percent). More than a third of respondents (38 percent) believed that dyslexia in children is quite widespread. However, only 2 percent noted that their family had a child with dyslexia, and less than half of these children received specialized assistance.
To explore professional support for children with dyslexia, school staff were interviewed: primary-school teachers (23,849) school-department managers (3,497), psychologists (2,851), speech therapists (1,549) and speech pathologists (660). Ninety-eight percent of the speech therapists, 87 percent of the speech pathologists, 80 percent of the psychologists, 73 percent of the headteachers, and 66 percent of the teachers were familiar with the problem. Among causes for children’s writing and reading disabilities, teachers mentioned the child’s individual characteristics (63 percent). Half of the survey participants noted parents’ insufficient attention to the problem – rejection of the problem (54 percent) and lack of proper participation in education and training (49 percent). Fifty-three percent also mentioned lack of timely access to specialists. Among the professionals surveyed, the prevalence of the problem was rated as high by most specialists. Content-wise, 67 percent of pedagogical community representatives indicated that remedial classes with underachieving children were held. But many of them (38 percent) stated that classes were held much less frequently than required. Seventy-three percent of the professional representatives interviewed pointed out the insufficient number of psychological and pedagogical support specialists working with children with dyslexia, and 38 percent of them indicated that a substantial replenishment of specialized professionals is necessary. It can thus be concluded that the gap in awareness between the general population and professionals concerning learning disabilities in children and assessing their prevalence is significant.
6.5.3 Research on Developmental Dyslexia
The terms dyslexia and dysgraphia are widely used in the clinical and pedagogical classification of speech disorders. In Russia it is customary to consider reading and writing disorders as separate from each other (Reference Akhutina and VelichenkovaAkhutina, 2018; Reference Grigorenko and ElliottGrigorenko & Elliott, 2012; Reference SadovnikovaSadovnikova, 2011; Reference TokarevaTokareva, 1971; Reference Volkova and ShakhovskoyVolkova & Shakhovskoy, 1998). And this relates to the greater difficulty of mastering the Russian coding than decoding. Dyslexia is generally defined as persistent difficulties in reading. The diagnostic inclusion criterion for dyslexia is the same as for dysgraphia. However, most authors simply indicate the absence of intellectual disability as an important symptom for diagnosis (Reference SadovnikovaSadovnikova, 2011; Reference Velichenkova and RusetskayaVelichenkova & Rusetskaya, 2015; Reference Volkova and ShakhovskoyVolkova & Shakhovskoy, 1998). Reference KornevKornev (1995, Reference Kornev2004, Reference Kornev and Ishimova2010) insisted on the need to apply the criterion of reading level and level of mental development discrepancy. Defining dysgraphia, specialists normally name diagnostic criteria for inclusion (Reference KornevKornev, 1995; Reference SadovnikovaSadovnikova, 2011; Reference Velichenkova and RusetskayaVelichenkova & Rusetskaya, 2015). The main criterion for inclusion is the presence of errors associated with nonmastery of the graphics and a high frequency of such errors. The term dysorthography has been actively used in scientific and pedagogical practice (Reference KornevKornev, 1995; Reference PrishchepovaPrishchepova, 2006; Reference Velichenkova and RusetskayaVelichenkova & Rusetskaya, 2015), alongside the term dysgraphia, referring to the lack of spelling understanding. The diagnostic criteria remain the same for these conditions except for the higher frequency and different type of spelling errors associated with dysgraphia; these indicate a failure to master the morphological, grammatical, and traditional principles of writing.
Standardized reading assessment methods are based on the accuracy and speed of single-word reading (Reference Korneev, Akhutina and MatveevaKorneev, Akhutina, & Matveeva, 2019; Reference Akhutina and VelichenkovaRybchinskaya, Korneev & Akhutina, 2018) and text reading as well as reading comprehension (Reference Akhutina and InshakovaAkhutina & Inshakova, 2008; Reference Rybchinskaya, Korneev, Akhutina, Krylov, Soloviev and KibrikRybchinskaya et al., 2018). In a study by Reference Rusetskaya and VelichenkovaRusetskaya (2018), students in Grades 1–4 were given the same texts to read. It was shown that on average, correct scores increased from 91 percent in the first grade to 97 percent in the fourth grade. Reading efficiency as measured by the words read correctly in one minute increased from 45 words in the first grade to 67 words in the second grade, 84 words in the third grade, and 101 words in the fourth grade. These data show that reading problems in Russian are mainly a matter of reading speed. A psychometric procedure for assessing reading comprehension was proposed by Reference Akhutina and InshakovaAkhutina and Inshakova (2008). They assessed the integrity and coherence of retelling and comprehension in 197 third-graders by addressing accuracy, semantic adequacy of retelling, its deployment, and lexical-grammatical design. It was found that 11 percent of the children showed reading-comprehension problems.
With respect to dysgraphia, we obtained data on the average number of dysgraphic errors in the dictations of sixty-six third-graders in two Moscow schools in 2018. In total, about 600 control dictations of 45–70 words written by the children over one year were analyzed. Dysgraphic errors (2.01 on average) included omissions of letters, mixing graphically similar letters (т-п, б-д, и-у), mixing by acoustic-articulation similarity, rearrangement, perseveration, anticipation of letters, and violation of soft-consonants designation in writing. Furthermore, the development of writing in dictation, copying from printed material, and handwritten text was examined in 216 children from Grades 1 to 4 (Reference InshakovaInshakova, 2013). It was found that children made the most errors in dictation and that the numbers of errors remained constant throughout the grades.
6.6 Conclusions and Discussion
Consideration of literacy achievement in Russia is impossible without considering the changes in the country that have affected the whole education system. The diversification and humanization of contemporary Russian education have led to the search for new teaching methods and changes in the way the system is organized, as well as changes in content at the preschool and school levels. Schools expect new levels of achievement from children that would have seemed inaccessible to previous generations. School teams seek to teach literacy using sophisticated learning tools, and parents and children expect to meet modern educational trends. The way that society has changed in response to these changes in the Russian education system is obvious. It seeks to meet the system’s expectations by strengthening parental support for the educational process, even encouraging parents to get involved in the more accessible aspects of children’s education (see also Schwartz, Chapter 19 in this volume). For example, home preschool literacy support is universally perceived as the norm, and the number of textbooks addressed to parents is growing exponentially. In these conditions, pedagogy should analyze the main vectors of the development of the home methodology in order to understand what the official methodology lacks, given parent expectations. There is an urgent need to assess the social and economic value of such a significant contribution on the part of adults to children’s education.
It can be concluded that in the past decades the system of psychological and pedagogical support for children with writing and reading disabilities in Russia has also undergone changes. However, further reorganization of education for children with special literacy needs is warranted. There is still a lack of personnel and textbooks, while there are also inconsistencies in the legislation, as has been indicated by both school staff and parents. Monitoring of literacy outcomes in Russia is also seen as important. It is now carried out constantly and in all regions. Its results can be compared with those of international projects such as PIRLS and PISA. This trend makes it possible to evaluate the national monitoring, and to control and influence the results in the context of interregional differences, to monitor positive and negative trends. Nowadays, children in Russia demonstrate an adequate reading level by the end of their primary-school education. However, more research is needed to assess the variation in reading literacy of students in secondary education and beyond.
7.1 Introduction
The Sustainable Development Goals (SDGs) adopted in 2015 represent an important opportunity to improve learning globally. For the first time in the history of the successive promises made under global goals, countries have pledged not only to improve learning outcomes but also to measure and report on the percentage of children reaching proficiency in reading and math (UNESCO, 2015). Although learning was mentioned under the prior goal frameworks – Education for All (World Conference on Education for All, 1990) and the Millennium Development Goals (UNESCO, 2000) – much of the two decades of subsequent efforts centered on ensuring access to school, with the assumption that learning would naturally follow (Reference Gove, Chabbott and DickGove et al., 2015). Since those first promises were made, low- and middle-income countries, particularly those in sub-Saharan Africa, have nearly caught up with their wealthier peers in enrolling children in primary school (UNESCO Institute for Statistics [UIS], 2017). But commensurate gains in learning have proved elusive. UNESCO estimates that more than 250 million children around the world are not learning basic reading and math skills, with African children accounting for roughly 40 percent of this total (UNESCO, 2012). Why has closing the learning gap proved so difficult in so many African countries?
Researchers and practitioners point to a variety of factors to explain the persistent lag in learning outcomes, including lack of teacher preparation (Reference Akyeampong, Pryor, Westbrook and LussierAkyeampong et al., 2011), a dearth of teaching and learning materials (RTI International, 2016a–d), and persistent poverty and its associated ills, such as malnutrition and stunting (Reference Black, Walker and FernaldBlack et al., 2017; Reference Engle, Black and BehrmanEngle et al., 2007). Often lacking in these explanations is the role of language (Williams, 2014, and see Verhoeven & Severing, Chapter 4 and Nag, Chapter 15 in this volume). Many children who go to school in Africa receive classroom instruction in a language that is not their own. Estimates vary, but every day, millions of schoolchildren are instructed in a language other than their primary home language. While many children can and do learn to read in a language that is not a home language, this does not happen automatically and the mismatch between home language and language of instruction (LOI) can be a source of significant barriers.
This chapter draws on a unique set of early literacy assessment results and demographic information from six African countries (Ghana, Kenya, Liberia, Malawi, Tanzania, and Zambia) to better understand the role that language plays in influencing early reading outcomes. While these data have been published in individual country reports, the information has not been analyzed and released prominently in the narrative surrounding learning outcomes in the region, although data like those presented in this chapter have begun to reverse this tendency. Following this introduction, we provide a brief history of postcolonial trends in literacy acquisition and language policy in sub-Saharan Africa from about 1960 to the present day, and document current language-of-instruction policies for twenty countries. We outline key questions driving our interest in better understanding the variation in literacy acquisition in a selection of the target countries for which we have data, then document the data and methods used and results. Finally, we discuss the implications of this work for future policy and planning in order to achieve the promises made under the SDGs.
7.2 Language, Literacy, and Schooling in Sub-Saharan Africa
Language and literacy are intricately interconnected. Learners’ familiarity with the language in which they learn to read has important implications for the literacy acquisition process and overall learning outcomes. Narrowing this point geographically, sub-Saharan Africa is densely multilingual, and historical, political, and sociolinguistic factors have heavily influenced each country’s selection of LOI(s). All regional governments face the challenge of balancing the benefits of home-language instruction with the logistical constraints of offering instruction in multiple (often underresourced) languages, the desire for national unity through a common language, and the advantages of access to the global community through international languages. However, governments also differ in how they ultimately resolve these tensions. Frequently in sub-Saharan Africa, the language of the former European colonial power serves as the sole LOI at the secondary and tertiary levels of education, but there is greater variety in LOI(s) at the primary level as well as in the timing of any transitions between LOIs.
As described in Reference AlbaughAlbaugh (2014), LOI policies in sub-Saharan Africa have fluctuated over the years. For example, precolonial and colonial missionary work included the transcription of many previously unwritten African languages; many Protestant missions used local languages as a pragmatic means of promulgating their message to the largest audience possible, resulting in mother-tongue-based education. In the colonial era, the British favored the use of local languages in early primary with transition to English in late primary, while the French valorized assimilation and instruction exclusively in French from the beginning. At independence, most countries continued with the inherited colonial model; thus, whereas the former British colonies experimented widely with African LOIs, most former French colonies held fast to a French-only model through the 1990s. Since then, many francophone countries have become increasingly open to African LOIs (at least in principle), while anglophone countries have vacillated ambivalently. LOI policy remains controversial and continues to shift; many countries are currently in policy transitions, often with a disconnection between the official written policy and actual implementation; reasons range from language attitudes to training and resource shortfalls (Reference TrudellTrudell, 2007). The evolution of literacy acquisition and language policy for an entire continent is beyond the scope of this chapter; however, we refer the reader to the works of Reference AlbaughAlbaugh, 2014; Reference Ouane and GlanzOuane and Glanz, 2011; and Reference TrudellTrudell 2016a and Reference Trudell2016b. To describe the current state of the art, Table 7.1 illustrates the variety of current LOI policies and their implementation in twenty of the forty-six countries in sub-Saharan Africa for which we were able to find information; policies prescribing use of an African language are shaded in vertical stripes, a bilingual model (African and European language together) in diagonal stripes, and a European language in gray.
The LOI policies described above can be categorized into five different types: (1) exclusive home language (L1) immersion – students learn in their home language throughout all cycles of education. This is the norm in many high-income countries, but in sub-Saharan Africa it is applicable only to the minority of students who are native speakers of one of the LOIs offered throughout all cycles (e.g., Kiswahili in Tanzania, English in Liberia or South Africa, French in Cameroon); (2) second- or additional language (L2/LX) immersion – students learn in an unfamiliar language (i.e., not the home or community language) for the whole education cycle, e.g., for most students in Angola, Liberia, and Cameroon; (3) early-exit transitional bilingual – students learn in a familiar language for a relatively short time (e.g., one to four years) before transitioning to an additional language as the sole LOI – for example, in Ghana, Kenya, Nigeria, Uganda, and Zambia; (4) late-exit transitional bilingual – students learn in a familiar language (L1) for a longer period of time (e.g., five to eight years) before transitioning to L2/LX as the sole LOI, for example Democratic Republic of Congo (DRC), Ethiopia, Mali, and Mozambique; (5) additive bilingual – students begin in and maintain learning in L1 while eventually adding a simultaneous L2.
Although recent trends have favored increased use of African languages as LOIs, particularly in early-exit transitional bilingual models, most communities – and therefore schools – are linguistically heterogeneous, especially in urban areas; as a result, even systems implementing an African language LOI policy are not able to offer every child instruction in his or her home language. This becomes evident when we compare the number of living languages in each country in Table 7.1 with the far fewer languages that the country offers as LOI. For example, although Kiswahili is now the official LOI throughout all cycles in Tanzania, during the 2016 nationally representative Early Grade Reading Assessment (EGRA), 44.5 percent of students reported speaking one of the other 124 Tanzanian languages at home (see Table 7.2).
Table 7.1 Current language-of-instruction policies and degree of implementation for selected sub-Saharan Africa countries

Note: Adapted from RTI International, 2016d.
a All living language statistics are taken from Reference Simons and FennigSimons and Fennig, 2017.
b Lei de Bases do Sistema de Educação [Basic Education System Law], No. 13/01 (Angola).
k Reference AnsahAnsah, 2014; Reference Ansah and AgyemanAnsah and Agyeman, 2015; Reference Erling, Adinolfi, Hultgren, Buckler and MukoreraErling et al., 2016.
l Reference Addy, Kraft, Carlson and FletcherAddy et al., 2012; Reference ArkorfulArkorful, 2013; RTI International, 2016c; Reference DiesobDiesob, 2017.
n Reference BegiBegi, 2014; Reference Piper, Miksic, Gove and WetterbergPiper and Miksic, 2011; Reference SpernesSpernes, 2012; Reference Wangia, Furaha, Kikech, Orwenjo, Njoroge, Nudng’u and MwangiWangia, Furaha, and Kikech, 2014.
° The 2010–2020 Liberian Education Sector Plan has a medium-to-long-term goal to “[e]stablish mother tongue to English bilingual education programs in indigenous language communities” and to “[w]ork towards the use of the local community language as the language of instruction in Kindergarten, Grades 1 and 2 of primary schooling” (Republic of Liberia, 2010), but this has not yet been enacted.
p Malawi’s official LOI policy contains some ambiguity. From 1996 to 2014, the policy prescribed the “mother tongue” as LOI for Grades 1–4, with a full transition to English in Grade 5 (Secretary for Education’s letter Ref. No. IN/2/14, March 28, 1996, as shown in Reference Issa and YamadaIssa & Yamada, 2013). In 2014, the Minister of Education announced that English was to become the LOI beginning in Grade 1, in accordance with the new Education Act passed in 2013 (Reference MasinaMasina, 2014). However, the new policy is subject to different interpretations and has not yet been widely implemented; also the National Reading Strategy (2014–2019) of the Ministry of Education, Science, and Technology prescribes language and literacy instruction in both English and Chichewa in early primary (Malawi MoEST, 2014).
s Agence Française de Développement (AFD) and Ministère de l’Éducation, de l’Alphabétisation et des Langues Nationales (MEALN), Mali, 2010; Reference VarlyVarly, 2010; Reference RhodesRhodes, 2012.
t A new policy scheduled to take effect in 2017 prescribes that one of sixteen Mozambican languages be used as LOI alongside Portuguese at the primary level (Ensino primário moçambicano, 2015).
u Portuguese is currently used as the sole LOI throughout all cycles in urban schools and in many rural schools (Reference HenriksenHenriksen, 2010). Pilot projects in rural areas using a Mozambican language and Portuguese bilingually at the primary level began in the 1990s and are ongoing. As of 2015, an estimated 80,000 children in nearly 500 primary schools were learning in 2 languages (ASSECOM, 2015).
x National Policy on Education as cited in Reference AdegbijaAdegbija, 2004, p. 211.
y Reference Okebukola, Owolabi and OkebukolaOkebukola, Owolabi, and Okebukola, 2012; Reference DuzeDuze, 2011.
aa Students choose their preferred LOI from among the twelve approved languages (where available); school governing bodies determine the LOI(s) offered at each school based primarily on local demand (South Africa Department of Basic Education, 2010; Reference HazeltineHazeltine, 2013).
ac Tanzania Ministry of Education and Vocational Training, 2014; Reference TrudellTrudell, 2016a; Reference LugongoLugongo, 2015.
ad A new policy in 2015 replaced English with Kiswahili as the LOI at the secondary level. It is expected that this policy will take years to fully implement (Reference LugongoLugongo, 2015); however, Kiswahili has long been used informally as the de facto LOI alongside or instead of English (Reference Kinyaduka and KiwaraKinyaduka & Kiwara, 2013).
Table 7.2 Summary of country datasets consulted by research question
| Research questions | Country | Level of representation | Year | Grades | Students | Report reference |
|---|---|---|---|---|---|---|
| 1 and 2 | Ghana | National | 2015 | 2 | 7,311 | Ghana Education Service and RTI International, 2014 |
| 3 | Kenya | Project | 2013 | 1 and 2 | 4,222 | Reference Piper and MugendaPiper and Mugenda, 2014 |
| 3 | Liberia | Project | 2011 and 2013 | 1, 2, and 3 | 6,680 | Reference King, Korda, Nordstrum and EdwardsKing et al., 2015 |
| 1 and 2 | Malawi | National | 2012 | 2 and 4 | 5,240 | Pouezevara, Costello, and Banda, 2012a |
| 3 | Malawi | Project | 2010 and 2012 | 2 and 4 | 3,290 | Pouezevara, Costello, and Banda, 2012b |
| 1 and 2 | Tanzania | National | 2014 | 2 | 2,266 | RTI International, 2016a |
| 1 and 2 | Zambia | National | 2014 | 2 | 4,850 | Reference Brombacher, Bulat, King, Kochetkova and NordstrumBrombacher et al., 2015 |
Research suggests that learners need at least six–eight years of instruction in L1, as in late-exit transitional or additive bilingual models, and at least five–seven years of instruction in L2 as a subject before they are adequately prepared to transition to L2 as the LOI (Reference BallBall, 2011; Reference CumminsCummins, 1979; Reference Dutcher and TuckerDutcher & Tucker, 1995; Reference Ouane and GlanzOuane & Glanz, 2011). Given that many countries still offer four years or fewer of instruction in the home language, either in official policy or in practice, and given the underlying linguistic heterogeneity in even the best-case scenarios, it is reasonable to conclude that most children in sub-Saharan Africa spend inadequate time learning in L1.
7.3 Learning to Read in Sub-Saharan Countries
Given this complex, continually evolving language context, we used data from several previously collected national and large-scale regional assessments of early literacy outcomes to explore how language influences early literacy acquisition in the region, with Ghana, Kenya, Liberia, Malawi, Tanzania, and Zambia as target countries. Although the data were originally collected for other purposes, most notably to inform and improve early reading instruction and policy within each context, the review of results and language differences for multiple countries is a novel and (we hope) useful application of the data. The research questions driving our analyses for the six target countries for which we had appropriate data were: (1) What are the key characteristics of children learning to read in the early grades of primary school? (2) Do children who learn to read in L1 perform differently than children learning to read in an L2/LX? and (3) Do children who learn to read in L1 have greater learning gains than children who learn to read in L2/LX?
The data utilized draw from six studies conducted between 2010 and 2016. Student reading results were collected through EGRAs developed for each language and country. The EGRA is an open-source test of early reading skills, with adaptations developed for each country and language following published guidelines and specifications (Reference Dubeck and GoveDubeck & Gove, 2015; RTI International, 2016b). Trained enumerators conduct fifteen-minute individual oral interviews during which students read from paper stimulus sheets or respond to questions read aloud by the administrator. Tasks include letter-name and letter-sound identification, word reading, and passage reading, as well as comprehension questions. Enumerators record student responses on a tablet using an open-source software package designed to capture both student responses and time elapsed (for more information see Tangerine specifications at www.tangerinecentral.org). The assessment is typically accompanied by a demographic questionnaire of student characteristics, including student age, grade, home language, home literacy practices, socioeconomic status, and other key variables. Detailed information for each country-specific dataset, including sampling frame, instruments, and questionnaires, are provided in each of the country reports. Data on Ghana originate from Ghana Education Service and RTI International (2014); on Kenya from Reference Piper and MugendaPiper and Mugenda (2014); on Liberia from Reference King, Korda, Nordstrum and EdwardsKing et al. (2015); on Malawi from both Pouezevara, Costello, and Banda (2012a) and Pouezevara, Costello and Banda (2012b); on Tanzania from RTI International (2016a–d); and on Zambia from Reference Brombacher, Bulat, King, Kochetkova and NordstrumBrombacher et al. (2015).
To address pupil characteristics in the six countries, we relied on self-reported data from demographic surveys conducted in conjunction with the EGRA. As noted, each EGRA survey incorporated questionnaires administered to the student participants, teachers, and school directors (the number of individuals interviewed varied according to the research objectives of the study). Students were asked to indicate the languages they spoke in the home. Table 7.3 provides summary demographic results for key variables for each of the six countries included in subsequent models.
Table 7.3 Descriptive variables included in the models for Ghana, Kenya, Liberia, Malawi, Tanzania, and Zambia
| Demographic | Ghana (2015) | Kenya (2013) * | Liberia (2013) * | Malawi (2012) | Tanzania (2016) | Zambia (2014) |
|---|---|---|---|---|---|---|
| Sample size % | 7,311 | 1,592 | 457 | 3,388 | 7,743 | 4,855 |
| Percentage of students receiving instruction in their home language (self-reporting) | 51.0 | 73.7 | 25.7 | 83.5 | 55.5 | 73.0 |
| “Does someone help you with your homework?”: Yes (self-reporting) | 76.2 | 60.4 | 69.5 | |||
| “Do you read to someone at home?”: Yes (self-reporting) | 62.6 | 57.3 | 75.6% | 53.4 | ||
| “Do you have the school reading textbook?”: Yes (self-reporting) | 53.1 | 10.4 | 14.7 | |||
| “Does someone read to you at home?”: Yes (self-reporting) | 71.1 | 57.4 | 58.3 | |||
| Urban | 27.9 | 25.7 |
Other than the urban classification, all the demographic estimates are created from student responses. The most concerning estimates presented are the percent of students reporting that they have a school reading textbook; students reported having a reading textbook only 10.4 and 14.7 percent of the time in Malawi and Zambia, respectively. On further investigation, it was discovered that in Zambia a new curriculum had been implemented and that at the time of the survey (November 2014) very few students had indeed received a reading textbook. Malawi has the highest percentage of students receiving instruction in their home language (83.5 percent), and from Table 7.1 we can see that the country only has one official language of instruction in the early grades, namely Chichewa.
As a further illustration of the complex role language plays in shaping literacy outcomes, we prepared a detailed mapping of the match between L1 and LOI in two of our target countries: Ghana and Zambia. Each country uses several languages for classroom instruction in the early grades, but their language of instruction policies differ substantially. Zambia – a country with seven officially recognized languages, but an official count of forty-six different languages spoken by the population (Reference Simons and FennigSimons & Fennig, 2017) – declares a school’s LOI based on province. In contrast, Ghana boasts eighty-one different living languages (Reference Simons and FennigSimons & Fennig, 2017), but only eleven are recognized as national languages. However, Ghana’s policy allows LOI to be chosen by the head teacher on a school-by-school basis. This policy, in theory, allows head teachers to better serve their specific population. So, it is surprising that only 51 percent of students in Ghana report receiving instruction in their home language (see Table 7.3). These different language of instruction policies provide a rich setting in which to understand policy impact and how it relates to reading-skills acquisition.
The maps shown in Figure 7.1 below, originally prepared by Reference Pressley, Sou and EdwardsPressley, Sou, and Edwards (2016), illustrate country regions where L1 matched the LOI. Figure 7.1a shows the country regions and the geographic location of the eleven official LOIs for Ghana; Figure 7.1b does so for the 7 official LOIs in Zambia. Maps were generated by superimposing documentation regarding the official LOI for each region on Ethnologue maps of regional majority L1s (Reference Lewis, Simons and FennigLewis, Simons, & Fennig, 2016). In both cases, areas in white indicate language mismatch, while shaded areas indicate a match between the L1 of the majority of inhabitants and LOI. Students in Zambia reported receiving instruction in their home language 73 percent of the time (from Table 7.3) and it is important to note that Figures 1a and 1b do not include population density; while many students in rural areas do not receive instruction in their home language, urban migration has created a situation where many students have moved into a region that uses an unfamiliar language of instruction. Despite the use of African languages in the classroom in the early grades in both Ghana and Zambia, these maps illustrate that this approach can only be classified as a partial implementation, given the wide swaths of the mismatch between L1 and LOI.


7.4 Learning to Read in L1 vs L2
The follow-up question we sought to answer is whether a mismatch on L1 and LOI results in performance differences, that is, whether or not language mismatch correlates with the child being unable to read a single word of text. Figure 7.2 shows an analysis using odds ratios for predicting oral reading fluency (ORF) results from Tanzania, Zambia, Ghana, and Malawi. Odds ratios predict the likelihood that an outcome will occur (in this case that students would score zero on the ORF portion of the EGRA) given a particular condition of interest, in this case L1–LO1 mismatch. On the oral reading fluency section of EGRA, students are asked to read aloud a grade-level passage; results are scored in correct number of words read per minute.

Figure 7.2 Impact of L1 and LOI mismatch on students who could not read a word of connected text (estimates as odds ratios), Grade 2
Note: * p < 0.05, ** p < 0.01, *** p < 0.001
The results indicate that Grade 2 students in Tanzania were 1.56 times (95 percent confidence interval [1.25, 1.95]) more likely to be unable to read a single word if their LOI was not their mother tongue. Similarly, Grade 2 children in Ghana were 1.23 times (95 percent confidence interval [1.02, 1.48]) more likely not to be able to read a word of connected text. The same analysis in Malawi and Zambia, on the other hand, did not find similar associations that were significant. One explanation for this difference is that average results in Tanzania and Ghana appear to be higher than those of Malawi and Zambia; more students reading at a higher skill level means that more variability existed in the data used to detect differences. In other words, if all students are performing poorly, language match or mismatch does not make much of a difference.
This analysis has some limitations, however. For example, the indicator of mother tongue (L1) was self-reported by Grade 2 students (typically seven or eight years of age); thus, response bias is possible. In addition, the students were assessed at school, which means that the research population did not include children not attending school. It is not unreasonable to hypothesize that many children who face an L1–LOI mismatch do not attend school precisely because of those language difficulties. Finally, the indicator is binary – that is, either the child’s L1 is the same as the LOI, or not, although we know that language acquisition for children in African multilingual societies is far more complex than this model can support. That is, the indicator effectively places a child who cannot speak the LOI at all in the same category as a child who speaks it well albeit as an L2/LX, which we acknowledge is a limitation owing to the proficiency measures this dataset relies on. These conclusions are reinforced by assessing an L1–LOI match on average oral reading fluency for Grade 2 students. Figure 7.3 shows the association between better reading fluency and L1–LOI match in Tanzania (p<0.001), Zambia (p<0.05), and Ghana (p<0.05), but not Malawi. Average reading fluency in Malawi is poor for Grade 2 students; thus, while the control model shown attempts to account for socioeconomic status, it is difficult to fully disentangle its impact from mother tongue because students from all socioeconomic backgrounds are demonstrating low reading fluency.

Figure 7.3 Impact of L1 and LOI match on average reading fluency achievement (correct words per minute), Grade 2
Note: * p < 0.05, ** p < 0.01, *** p < 0.001
Even accounting for the limitations of the school-based data, it is not surprising that one sees an association between student reading achievement and students who report speaking the LOI as their L1. What now becomes of interest is the impact of L1–LOI mismatch on learning (in this case, gain scores in oral reading fluency). An analysis of three intervention programs in Liberia, Kenya, and Malawi (shown in Figure 7.4) through the interaction of L1–LOI match and treatment year indicates a lack of association between average oral reading fluency gain and L1–LOI match in Liberia (p = 0.321), Kenya (p = 0.861), and Malawi (p = 0.674). That is, the effect of language match is not found to be as important in determining the average learning gains as other key variables such as quality teaching and learning. This is unsurprising considering the challenges of learning in these countries and the influence of the quality of teaching above all other factors (see country-level reports as specified in Table 7.2). Clearly, individual students will have challenges with learning to read in a language in which they are not orally fluent, but on average it is less of an issue in these countries than barriers such as poverty and receiving poor-quality instruction in the classroom.

7.5 Conclusions and Discussion
The present chapter explores the important question of the relation of language match to learning outcomes in sub-Saharan Africa. Language match is defined as the condition in which a student’s primary language of instruction is the same as the student’s self-reported mother tongue or L1. Analysis of the characteristics of children learning to read in six target countries of study revealed substantial variation. This, coupled with the myriad policies and educational models, highlights the need for country-specific solutions to the challenge of improving literacy outcomes. It can be concluded that there is no one-size-fits-all policy response to the complex language environment that characterizes many countries in the region. What is clear from the learning-outcomes data is that the current policy response across sub-Saharan countries is not producing acceptable learning outcomes. This is only partly due to a mismatch between the language of the child and the language of the curriculum, with many other factors contributing to low learning results (see Nag, , Chapter 15; Asfaha & Nag, Chapter 16; and Friedlander & Goldenberg, Chapter 18 in this volume. While these other factors affect the low overall outcomes in the region, language should not be an additional barrier to children learning to read. Even when the language of the child matches the language of instruction, the gain in oral reading fluency can be considered small.
While acknowledging the limitations of the data, including reliance on child self-report for identification of home language and other key variables, the results provide new insight into the complex challenge of language and learning. We evidenced a large variation in both policy and educational practice across the six target countries. As just one example, the share of students receiving instruction in their L1 ranged from 26 percent in Liberia to 83 percent in Malawi. Language mismatch was shown to have a substantive and significant effect on the probability that a student would perform poorly on the assessment: Students in Ghana and Tanzania whose L1 did not match the LOI scored substantially lower on text-reading abilities. Furthermore, the absence of the effect of language match on intervention impact on learning gains is an indication that the language effect is outweighed by other key issues, such as poverty, instructional quality, and the availability of teaching and learning materials.
As governments map a pathway to 2030 and plot their approach to meeting their obligations under the Sustainable Development Goals, we expect that language-of-instruction policies will increasingly be examined as a possible avenue for learning improvement. These results show that in many cases policy and practice do not match, meaning whatever parameters policymakers think they have put in place are getting subverted by practitioners in schools. In some contexts, when examining which policy levers are the easiest to move, language policy will need to be compared to other options over which governments can exert influence and change. This can be considered a complex process, as getting language policy right requires careful examination of context, resources, beliefs, and practice. As we endeavor to collect additional information about the impact of language policy on learning, the issue will continue to challenge practitioners and policymakers throughout the region for generations to come.
8.1 Introduction
In India, only 44 percent of students in government schools can read Grade 2 texts in Grade 5 fluently, as measured by the ASER test, which focuses on decoding skills (Annual Status of Education Report [ASER Centre, 2018]). According to India’s national census conducted in 2011, 74 percent of the total population of India were considered literate, defined as having the ability to “both read and write with understanding in any language” (Education for All in India, 2011). Within India, there is, however, wide variation, with literacy rates being significantly higher in private schools (Reference Pal and KingdonPal & Kingdon, 2010) and in urban areas (Reference AgrawalAgrawal, 2014).
India – and the entire South and Southeast Asian region – is home to different types of writing systems and linguistic situations; however, literacy acquisition in the region is often defined by the use of alphasyllabic akshara orthographies and multilingualism. Both these characteristics have significant implications for the theory, practice, and policy of literacy acquisition in India. Although the scientific foundations and corresponding practical applications of reading development in monolingual contexts of alphabetic languages have been relatively conclusively established (Reference Castles, Rastle and NationCastles, Rastle, & Nation, 2018; Reference Rayner, Foorman, Perfetti, Pesetsky and SeidenbergRayner et al., 2001; Reference Seymour, Aro and ErskineSeymour, Aro, & Erskine, 2003; Reference Tunmer and HooverTunmer & Hoover, 2019), there is less research examining the psycholinguistic underpinnings of literacy acquisition in alphasyllabic akshara writing systems. The recent literature in akshara reading acquisition lends credibility to the universal mapping principle that learning to read depends on learning how a writing system encodes a spoken language (Reference PerfettiPerfetti, 2003; Reference Verhoeven and PerfettiVerhoeven & Perfetti, 2017), by highlighting the very specific reading processes necessary to decode the particularities of the akshara scripts (Reference Joshi, McBride, Joshi and McBrideJoshi & McBride, 2019; Reference Nag and PerfettiNag & Perfetti, 2014). The research on biliteracy acquisition has also grown over the past several years, especially in cases of literacy acquisition in two alphabetic language (Reference August and ShanahanAugust & Shanahan, 2006), but also in cases of morphosyllabic–alphabetic biliteracy acquisition (Reference Wang, Perfetti and LiuWang, Perfetti, & Liu, 2005; Reference Zhang and KodaZhang & Koda, 2014). However, the research on akshara-alphabetic biliteracy acquisition in functionally multilingual contexts – especially wherein educational resources are very limited – remains relatively uncharted territory (see also Nag, Chapter 15 in this volume).
Our chapter focuses on literacy and linguistic diversity in the most populous nation in the world. We begin with a brief description of the historical and contemporary state of multilingual education policy and practice in India. In addition, the psycholinguistic underpinnings of learning to read in akshara orthographies and of biliteracy acquisition with at least one akshara orthography will be uncovered. Finally, future directions related to literacy development research and practice among diverse populations in India will be discussed.
8.2 Multilingual Education Policy and Practice in India
Functional multilingualism – as Reference Bhatia, Ritchie, Bhatia and RitchieBhatia and Ritchie (2004) call it – is widespread in India. Functional multilingualism refers to the ability for people to “function” in different domains of society using different languages. This has complex and multifaceted implications for improving reading outcomes due to large variances and mismatches between students’ oral-language abilities and the media of instruction in schools, as well as a lack of access to education in a child’s home language (Reference BallBall, 2011; Reference PinnockPinnock, 2009).
At a national level, multilingualism forces India’s education decision makers to craft policies that appropriately sequence the introduction of languages used as media of instruction. According to the 2011 census, there are 1,369 languages from at least 5 different language families spoken in India, and 121 of them have more than 10,000 speakers; however, more than 95 percent of the population speak one of 22 regional languages (Census; Government of India, 2011). In 1946, when India was drafting its Constitution, debate raged over whether to include languages other than Hindi as a national language (Reference JayasundaraJayasundara, 2014). While the Hindi-only camp declared that “people who do not know Hindustani have no right to stay in India” (Dhulekar, 1946, as cited by Reference JayasundaraJayasundara, 2014), several South Indian scholars and activists from non-Hindi-speaking regions of India pushed to maintain English as a national language as well, which resulted in both English and Hindi becoming official languages of the nation. In 1968, the National Policy in Education instated an education policy called the Three-Language Formula, which mandated that by the end of secondary school, all students should be learning three languages (Reference VaishVaish, 2008). In Hindi-speaking states, the three languages are Hindi, English, and another modern Indian language, preferably a South Indian one; and in non-Hindi-speaking states, the three languages are that state’s regional language, English, and Hindi.
In 2019, the central government of India released a draft New Education Policy, which makes amendments to the 1968 policy in that it refers to the “mandatory” teaching of Hindi in states where Hindi is not spoken, as well as inclusion of Hindi from the primary levels. These new directions have led to a backlash and widespread protests in non-Hindi-speaking regions (Reference DasguptaDasgupta, 2019; Reference ShankaranShankaran, 2019; Reference VenkataramananVenkataramanan, 2019), reflecting past protests against Hindi dominance in India. At the pre-primary level, the Draft National Early Childhood Care and Education (ECCE) Policy (Government of India, 2012) argues that the “mother tongue or home language of the child will be the primary language of interaction in the ECCE programs. However, given the young child’s ability at this age to learn many languages, exposure to the national language English in oral form, as required, will also be explored.” These policies reflect the decades-long tensions around this issue of the need to promote multilingual education policies in India, as well as highlighting the necessity for more research to be undertaken to inform the construction of effective multilingual education policies in the country.
At a regional level, there is a need to reconcile the increasingly strong parental and community preference for schools that emphasize English learning earlier in the elementary grades (Reference NagNag, 2014) with the multifaceted positive benefits of learning in the local language for a longer period of time. The preference for English stems mainly from the perception that English is crucial to enhancing a child’s life outcomes (National Council of Educational Research & Training [India], 2005), and from the growing evidence that English is indeed linked with socioeconomic mobility in India (Reference Azam, Chin and PrakashAzam, Chin, & Prakash, 2013; Reference Chakraborty and BakshiChakraborty & Bakshi, 2016; Reference ShastryShastry, 2012). In response to these parental preferences, some government schools, NGO-run schools, and private affordable schools in India have changed their policies and started using English as the medium of instruction from Grade 1 (Indo-Asian News Service, 2019; Reference KurrienKurrien, 2004; Press Trust of India, 2020). Yet research conducted on biliteracy acquisition in India indicates that students must attain a threshold level of reading skills in the local or regional language for a more effective transfer of skills from the local language to English and thus better biliteracy acquisition; it further indicates that this threshold level was not reached until Grade 4 or 5 by most students in a sample of thirteen urban and rural low-income schools in South India (Reference Nakamura, de Hoop and HollaNakamura, de Hoop, & Holla, 2019). Research also shows that about 80 percent of children from nursery to Grade 7 in one sample of low-income schools in urban South India had very small English vocabularies (Reference Nag, Ramkumar and MirandaNag, Rankumar, et al., 2014). International studies highlight a significant link between learning in the mother tongue and a positive sense of identity and self-worth (Reference Tollefson, Tsui, Tollefson and TsuiTollefson & Tsui, 2003; Reference TrudellTrudell, 2005). There is also a rising call from regional activists in India (Reference GejjiGejji, 2019), and the international education community (Reference BallBall, 2011; Reference Bender, Dutcher, Klaus, Shore and TesarBender et al., 2005; Reference BensonBenson, 2005) to maintain regional languages as the media of instruction for longer periods of time in early education. Clearly, more research is needed to inform an effective multilingual education practice that allows for a reconciliation between these complex, competing forces of increasing demand for earlier English learning vis-à-vis an increasing evidence base supporting the later teaching of English.
Also, regionally, policymakers and frontline workers in India face different sets of challenges in urban settings as compared to rural areas while implementing multilingual education policies. A typical child in Bangalore, an urban area in the south of India, may be exposed to – and use – up to four or five languages on a daily basis: a home language which may not be used in the school system at all (in some cases two home languages); a regional language different from the home language, which may or may not be used in schools; one school language as the language of instruction; a second regional school language; and a third language in school, such as Hindi (Reference ReddyReddy, 2011). Indeed, it is common for students in low-income community schools in Bangalore to come from several different L1 backgrounds, including commonly Telugu, Tamil, Hindi, Urdu, Tulu, and Malayalam, with only 15–20 percent speaking the regional language of Kannada (Reference Nag, Snowling, Quinlan and HulmeNag, Snowling, et al., 2014; Reference ReddyReddy, 2011), making mixed mother-tongue-language classrooms relatively common. Reference Mohanty, Panda, Pal, Menken and GarciaMohanty, Panda, and Pal (2010) note that language heterogeneity within classrooms leads to teachers and field-level educational administrators having difficulties navigating prescribed curricular and pedagogic practices alongside the realities of the children’s language capabilities.
In contrast, in rural areas, most children are likely to speak the same language, but they may come from homes that speak marginalized languages and dialect varieties, especially in states with significant tribal populations such as Jharkhand and Chhattisgarh. In these cases, the mismatch between the state language and the children’s mother tongue results in well-documented negative consequences, such as a lack of opportunity to learn in a language the child understands that leads to stunted learning outcomes as well as high rates of dropouts (Reference JhingranJhingran, 2005) (see also Asfaha & Nag, Chapter 16 and Friedlander & Goldenberg, Chapter 18 in this volume).
At the household level, parents and the home literacy environment play a crucial role in children’s language acquisition (Reference Sénéchal and LeFevreSénéchal & LeFevre, 2002), mainly through students’ exposure to a language outside of school (Reference Nag-ArulmaniNag-Arulmani, 2000). There is significant variation in degrees of adult literacy and proficiency in different languages (including the languages of school instruction), and thus there are gaps in the language abilities of parents as well as children, especially in reading, which also hinders the ability of parents to support their children’s literacy acquisition. Likewise, there is also evidence from a sample of about 500 students from 6 low-income communities in South India that there is a dire lack of print materials in any language in many homes (Reference ReddyReddy, 2011). When print was found in homes, the most common print-related items were religious books or decorative or functional items, such as calendars or newspapers used for wrapping goods.
Another key factor determining the success of multilingual education policy in India is the capabilities of the teachers. Reference Nag-ArulmaniNag-Arulmani (2000) found that one of the most important factors in English learning in India is the teacher’s English-language proficiency. Reference KurrienKurrien (2005) identified four types of schools: (a) English-medium middle-high-cost private schools, where teachers are proficient in English, but students have differing levels of knowledge of English; (b) English-medium low-cost private schools, where teachers and students have limited proficiency in and exposure to English, but parents view English as an instrument for upward mobility; (c) government-aided regional schools, where teachers have varying levels of English proficiency, with students from a variety of backgrounds; and (d) government regional schools run by district and municipal education authorities, where both teachers’ and students’ English proficiency and exposure are limited. The National Council of Educational Research & Training (2005) argues that the language proficiency of teachers varies remarkably across schools, with a strong difference observable between government and private schools. Thus, depending on the type of school, the English proficiency levels of teachers differ and, arguably, the teachers’ proficiency, in turn, differentially affects the language proficiency of the child (Reference Shenoy, Wagner, Joshi and McBrideShenoy & Wagner, 2019).
Curricular pace and pedagogical practices are another manifestation of how language choices play out in the classrooms of low-income communities in India. Despite some evidence from private unaided English-medium schools in urban low-income communities that phonics is a more effective teaching method for early decoding and encoding outcomes (Reference Dixon, Schagen and SeedhouseDixon, Schagen, & Seedhouse, 2011), these methods are rarely used in low-income urban communities in Bangalore (Reference Shenoy, Wagner and RaoShenoy, Wagner, & Rao, 2020). In an in-depth qualitative observation of four students in an English-medium school in India, Reference GuptaGupta (2013) reveals that pedagogical practice proceeds through the following stages: teaching isolated letters; then spelling individual words, without any explicit connections to meaning or context; learning grammar by copying sentences and recitation; and finally learning grammatical explanations and terms such as “proposition” and “conjunction” at age five. The study also showed that there was no focus on storytelling, storybooks, or any print support in the classroom other than the textbook. Reference Nag, Ramkumar and MirandaNag, Ramkumar et al. (2014) find similar trends at the preschool level, with disproportionate time spent on copying texts by hand and no activities including storytelling or dialogue or interactive sessions, and short bursts of teaching in both the regional language (Kannada) and English. These findings also highlighted that Kannada was used mainly for punitive commands and teachers were not confident in teaching even in Kannada – which was the teachers’ native language, but a later-acquired language for the students – because of their perception that the students did not have enough linguistic knowledge in that language to learn concepts.
Finally, a paucity in schools of appropriate learning materials that support and augment learning also adversely affects the practice of multilingual education. There are two ways in which this scenario of resource deprivation operates: (1) schools are under-resourced and are not able to provide adequate learning materials such as books and other print materials to their students in any language, and (2) learning materials in a particular language – most likely the regional languages or dialectical varieties – are not available in the learning ecosystem due to the lack of demand from parents and communities for teaching in these languages to take place, and thus the limited supply of such materials. Reference Nag-Arulmani and GhoulandrisNag-Arulmani (2003) notes that there could be wide variations between different types of schools (government vs. private) in terms of learning opportunities, class libraries, culture, and management, which eventually lead to a similar divide in students’ levels of oral-language and reading proficiency. Additionally, a lack of learning materials in vernacular languages, especially in science, can hinder learning among children (Reference Mohanty, Garcia, Skutnabb-Kangas and Torres-GuzmanMohanty, 2006).
In sum, there are immense challenges to the successful implementation of the Three-Language Formula in India’s complex multilingual environment; however, there are also significant opportunities for success with multilingual education in a country that is dedicated to the teaching of more than one language in its policy.
8.3 Psycholinguistic Processes Underpinning Akshara Literacy Acquisition
While many early classification frameworks put forth the notion that there are three main categories of writing systems – logographic (now more commonly called morphosyllabic), syllabic, and alphabetic (Reference GelbGelb, 1952)– more recent frameworks also include the West Semitic abjad as well as the alphasyllabary (Reference Nag and PerfettiNag & Perfetti, 2014; Reference PerfettiPerfetti, 2003). The akshara writing system, along with Korean Hangul and the Ethiopian Ge’ez scripts, commonly fall into the latter category.
Share and colleagues (Reference ShareShare, 2014; Reference Share and DanielsShare & Daniels, 2016) go a step further in unpacking the alphasyllabary category to highlight some of the key features that distinguish the ancient Brahmi-derived orthographies of the Dravidian and Sanskrit languages, akshara,Footnote 1 from alphabetic and syllabic scripts. Examples of such distinction from both alphabetic and syllabic writing systems include the visual prominence of the consonant in the syllabic clusters; the lack of visual resemblance between primary word-initial vowel forms, or their nondiacritic forms, and their secondary diacritic forms (for example, the difference between ಆ, the primary vowel form of /a/ versus ![]() , the secondary diacritic form of /a/); the lack of any graphical representation of the common schwa following consonants (which is hence called the inherent vowel); and the lack of case (majuscule and minuscule letters).
, the secondary diacritic form of /a/); the lack of any graphical representation of the common schwa following consonants (which is hence called the inherent vowel); and the lack of case (majuscule and minuscule letters).
The basic orthographic representations of akshara are vowels and consonants, with the mid central vowel (schwa) inherent to each consonant. Consonants and vowels can be added to the base akshara consonant while keeping the syllabic form intact and prominent. Thus, each syllabic orthographic representation can be a vowel (V) ಅ /a/, a consonant with schwa (Cə) ಸ /sə/, a consonant plus a vowel diacritic marker (CV) ![]() /s/+/a/, a consonant with a consonant diacritic marker and vowel diacritic marker (CCV)
/s/+/a/, a consonant with a consonant diacritic marker and vowel diacritic marker (CCV) ![]() /sh/+/r/+/i/, or even a consonant with a consonant diacritic marker, a second consonant diacritic marker, a vowel diacritic marker, and a long vowel diacritic marker (CCCVV)
/sh/+/r/+/i/, or even a consonant with a consonant diacritic marker, a second consonant diacritic marker, a vowel diacritic marker, and a long vowel diacritic marker (CCCVV) ![]() /s+th+r+i+long vowel marker/. Each of these configurations are represented as single symbol blocks that are visually approximately the same size, retaining syllabic prominence in the orthography (Reference Nag, Cain, Compton and ParrilaNag, 2017).
/s+th+r+i+long vowel marker/. Each of these configurations are represented as single symbol blocks that are visually approximately the same size, retaining syllabic prominence in the orthography (Reference Nag, Cain, Compton and ParrilaNag, 2017).
Reflecting these orthographic features of the akshara, studies are beginning to unpack the psycholinguistic mechanisms that underlie early akshara reading acquisition. One of the central themes in most recent studies is that there is a need for dual syllabic and phonemic sensitivity in order to successfully acquire akshara-decoding ability (Reference NagNag, 2007; Reference Nakamura, Joshi and JiNakamura, Joshi, & Ji, 2018; Reference Koda, Gass and MackeyReddy & Koda, 2013; Reference Sircar, Nag, Winskel and PadakannayaSircar & Nag, 2013; Reference Vaid and GuptaVaid & Gupta, 2002; Reference VasantaVasanta, 2004; Reference Winskel and IemwanthongWinskel & Iemwanthong, 2010), as there is for decoding skills in other alphasyllabaries such as Korean Hangul and the fidäl symbols used in the Ge’ez scripts of Ethiopia (Reference Asfaha, Kurvers and KroonAsfaha, Kurvers, & Kroon, 2009; Reference Cho and McBride-ChangCho & McBride-Chang, 2005; Reference Kim and DavisKim & Davis, 2004; Reference Kim and PetscherKim & Petscher, 2011). Interestingly, however, the precise nature of the sublexical phonological sensitivity required at different stages of early akshara acquisition is still emerging and the evidence is inconclusive. For instance, due to the salience of the syllabic structure in the orthography, studies demonstrate that syllabic sensitivity remains a stronger predictor through the akshara-decoding acquisition process (Reference Nakamura, Joshi and JiNakamura et al., 2018), and phonemic awareness is slower to emerge (Reference NagNag, 2007). However, studies are also highlighting that phonemic-level sensitivity is significant for the mastery of the entire repertoire of symbols (Reference Nesan, Sadeghi, Everatt, Joshi and McBrideNesan, Sadeghi, & Everatt, 2019; Reference Wijayathilake, Parrila, Inoue and NagWijayathilake et al., 2019). Accordingly, there is a wide consensus that akshara-decoding skills require dual syllable–phoneme phonological sensitivity, but the degree to which both are needed in different stages of the acquisition of decoding skills in akshara is a question that remains ripe for further investigation.
A second key feature of akshara is the size of the orthographic registry that needs to be learned. The “extensive” symbol set size (Reference NagNag, 2014), the large set of complex diacritic ligaturing rules, and the need for dual syllable and phoneme awareness lead to a longer acquisition trajectory of approximately four–five years to master decoding skills in the Indic akshara compared to approximately one–two years in most alphabetic languages (Reference NagNag, 2007, Reference Nag2014; Reference Reddy and KodaReddy & Koda, 2013). Scholars have recently begun referring to this as the “orthographic breadth” (Reference Inoue, Georgiou, Muroya, Maekawa and ParrilaInoue et al., 2017; Reference NagNag, 2014), adding a critical dimension of breadth to the much-researched implications of the depth spectrum (Reference Katz, Frost, Frost and KatzKatz & Frost, 1992; Reference Seymour, Aro and ErskineSeymour, Aro, & Erskine, 2003) on early decoding-acquisition ability.
Another key feature of akshara orthographies that makes them distinct from alphabetic orthographies, as well as leading to some challenges for young readers, is the nonlinear arrangement of the symbols. While alphabetic languages spatially arrange their letters in the same sequence as their corresponding sounds, noninitial vowel or consonant phonemic components of akshara are ligatured to the primary consonant in positions above, below, to the right of, and even to the left of the consonant (Reference Share and DanielsShare & Daniels, 2016). For instance, in the word ![]() /hindi/ the
/hindi/ the ![]() diacritic /i/ appears before the ह् /h/ consonant, leading to nonlinear spatial configurations of the phonological sequence. This mismatch between spatial and temporal sequencing of sounds and symbols leads to challenges in decoding acquisition and adds to word-reading acquisition time (Reference Kandhadai and SproatKandhadhai & Sproat, 2010; Reference Vaid and GuptaVaid & Gupta, 2002; Reference Winskel, Padakannaya, Pandey, Winskel and PadakannayaWinskel, Padakannaya, & Pandey, 2013).
diacritic /i/ appears before the ह् /h/ consonant, leading to nonlinear spatial configurations of the phonological sequence. This mismatch between spatial and temporal sequencing of sounds and symbols leads to challenges in decoding acquisition and adds to word-reading acquisition time (Reference Kandhadai and SproatKandhadhai & Sproat, 2010; Reference Vaid and GuptaVaid & Gupta, 2002; Reference Winskel, Padakannaya, Pandey, Winskel and PadakannayaWinskel, Padakannaya, & Pandey, 2013).
Akshara are also visually complex in unique ways. While most cross-orthography comparative research has focused on sound–symbol mapping correspondence differences (Reference Katz, Frost, Frost and KatzKatz & Frost, 1992; Reference PerfettiPerfetti, 2003; Reference Ziegler and GoswamiZiegler & Goswami, 2005), visual-form differences also have consequences for recognition and learning (Reference Chang, Chen and PerfettiChang, Chen, & Perfetti, 2018; Reference Nag, Snowling, Quinlan and HulmeNag, Snowling et al., 2014). Visual-form differences are most often manifested in terms of the degree of discriminability of graphic symbols (Reference Pelli, Burns, Farell and Moore-PagePelli et al., 2006). Reference Chang, Chen and PerfettiChang et al. (2018) propose a measure of visual complexity, which takes into account perimetric complexity (the ratio of the space taken up by the graph to the background unused space of the graph) and other features that amount to the inventory size that needs to be acquired. In this categorization of the complexity of the world’s writing systems, the akshara writing system tends to rank as more complex than alphabetic writing systems but as less complex than morphosyllabic writing systems. Similarly, Reference Nag, Snowling, Quinlan and HulmeNag, Snowling, et al. (2014) demonstrated that the pixel density of Kannada led to significant differences in early reading acquisition. Reference Share and DanielsShare and Daniels (2016) also point out the differences between the initial and noninitial forms of vowels and consonantal diacritics in the Indic scripts as a potential source of confusion for beginning readers. Together, the visual complexity of the akshara writing system uniquely constrains early reading acquisition.
Taken collectively, there are key differences between akshara literacy acquisition and literacy acquisition in alphabetic, syllabic, morphosyllabic, and even other alphasyllabic orthographies. Each of these differences have critical implications for the precise cognitive and linguistic subskills that are required for acquisition of word-reading skills, and the timing of the acquisition of each of these skills.
8.4 Biliteracy Acquisition in Akshara and Other Languages
Biliteracy acquisition is a qualitatively different process from monolingual literacy acquisition primarily because there is dual language involvement in biliteracy acquisition (Reference Koda, Gass and MackeyKoda, 2013). Early theoretical formulations of this dual language involvement centered on the notion of a “common underlying proficiency” that accounted for the significant correlations between reading ability in one’s first language (L1) and one’s second language (L2) (Reference CumminsCummins, 1979, Reference Cummins and Bialystok1991). More recent models have disentangled various reading subcomponent skills as being more or less susceptible to transfer – depending on their language-neutrality or language-specificity. Critically, metalinguistic skills are generally pinned down as those being shared across language, and decoding skills are those most likely to transfer, while certain orthographic constraints and oral-language skills are the least likely to be related across languages (Reference Geva and SiegelGeva & Siegel, 2000; Reference Koda, Gass and MackeyKoda, 2013). One conceptualization of transfer is synthesized in the compelling Transfer Facilitation Model (Reference KodaKoda, 2005; Reference Koda, Koda and Zehler2008; Reference Koda, Gass and Mackey2013) as follows: previously acquired literacy subskills, primarily decoding skills, transfer and affect the development of L2 reading through shared metalinguistic awareness, primarily metalinguistic skills; however, this transfer facilitation is dependent upon the linguistic and orthographic distance between the two languages, as well as L2 print and oral-language input and experience.
Reference Chung, Chen and GevaChung, Chen, and Geva (2019) provide an interactive framework for cross-linguistic transfer in L2 reading, in which they reiterate that the relationship between L1 and L2 reading skills is influenced by cognitive, linguistic, and metalinguistic factors such as language-specific constructs (orthographic mapping, vocabulary knowledge, and oral-language skills) versus language-neutral constructs (e.g., phonological awareness, morphological awareness, conceptual knowledge, background knowledge), L1–L2 distance, and L1–L2 proficiency and complexity. However, they extend the model to argue that transfer itself is also impacted by sociocultural factors such as age of beginning acquisition of the L2, immigration experience, educational settings, and extent of exposure to the L1 and L2.
Several studies provide empirical support for the tenets of these theoretical frameworks of transfer. Studies across an array of typologically diverse language pairs have shown significant correlations between phonological awareness skills in both languages (Reference Abu-Rabia and SiegelAbu-Rabia & Siegel, 2002 in Arabic–English; Reference Bialystok, McBride-Chang and LukBialystok, McBride-Chang, & Luk, 2005; Reference Gottardo, Yan, Siegel and Wade-WoolleyGottardo et al., 2001; Reference Wang, Perfetti and LiuWang, Perfetti, & Liu, 2005, in Chinese–English; Reference Schaefer and KotzéSchaefer & Kotzé, 2019 in isiZulu and Siswati and English; Reference Nakamura, Koda and JoshiNakamura, Koda, & Joshi, 2014; Reference Reddy and KodaReddy & Koda, 2013 in Kannada–English; Reference Wawire and KimWawire & Kim, 2018 in Kiswahili–English; Reference Da Fontoura and Siegelda Fontoura & Siegel, 1995 in Portuguese–English; Reference KimKim, 2009 in Korean–English; Reference Durgunoğlu, Nagy and Hancin-BhattDurgunoğlu, Nagy, & Hancin-Bhatt, 1993; Reference Goodrich, Lonigan and FarverGoodrich, Lonigan, & Farver, 2017 in Spanish–English). Some of these studies and others have also demonstrated that through the cross-linguistic sharing of phonological skills, there is not only an association with improved L2 reading (Reference Kuo, Uchikoshi, Kim and YangKuo et al., 2016; Reference Melby‐Lervåg and LervågMelby-Lervåg & Lervåg, 2011; Reference Reddy and KodaReddy & Koda, 2013; Reference Schaefer and KotzéSchaefer & Kotzé, 2019); but also a causal impact on L2 early reading subskills (Reference Goodrich, Lonigan and FarverGoodrich et al., 2017; Reference Wawire and KimWawire & Kim, 2018). Morphological awareness has also been identified as a prime candidate for cross-linguistic resource sharing in both morphosyllabic–alphabetic biliteracy pairs such as Mandarin/Cantonese and English (Reference Lam, Chen, Geva, Luo and LiLam et al., 2012; Reference Wang, Cheng and ChenWang, Cheng, & Chen, 2006; Reference ZhangZhang, 2013) and in alphabetic–alphabetic biliteracy acquisition, such as Spanish and English (Reference Ramírez, Chen and PasquarellaRamírez, Chen, & Pasquarella, 2013).
While metalinguistic awareness and decoding skills are often correlated between L1and L2, the relationship between orthographic skills tend to be less significantly related in languages that are typologically more distant (Reference Abu-RabiaAbu-Rabia, 1997; Reference Geva and SiegelGeva & Siegel, 2000; Reference Geva, Wade-Woolley and ShanyGeva, Wade-Woolley, & Shany, 1997; Reference Wade-Woolley and GevaWade-Woolley & Geva, 2000 for Hebrew–English bilinguals; and Reference Wang, Park and LeeWang, Park, & Lee, 2006 for Korean–English bilinguals). In addition, L2 linguistic and orthographic input is also critical for L2 word reading (Reference Wang and KodaWang & Koda, 2007).
In multilingual contexts wherein more than two languages are being acquired, it has also been demonstrated that biliteracy skills themselves significantly predict L3 reading ability (Reference Schwartz, Geva, Share and LeikinSchwartz et al., 2007). The directionality of transfer is also questioned in contexts where children have limited input to print in their L1, and studies show that in these cases L2 print input not only supports L2 reading but also reverse transfers to support L1 reading (Reference Asfaha, Kurvers and KroonAsfaha et al., 2009; Reference Pretorius and MampuruPretorius & Mampuru, 2007). Finally, cross-linguistic transfer effects reduce, and within-language effects increase, across grades (Reference Nakamoto, Lindsey and ManisNakamoto, Lindsey, & Manis, 2008; Reference Nakamura, Koda and JoshiNakamura et al., 2014). Taken together, as evidenced by the meta-analysis by Reference Melby‐Lervåg and LervågMelby-Lervåg and Lervåg (2011), there are stronger cross-linguistic relations between L1 and L2 phonological awareness and decoding skills than between L1 and L2 oral-language skills. Crucially, both medium of instruction and writing-system distance also moderate the cross-linguistic effects. Both these moderators play an important role in teaching and learning reading on the Indian subcontinent.
There are few studies that focus specifically on biliteracy acquisition in an Indic akshara language and English. In one example, Reference Reddy and KodaReddy and Koda (2013) examined whether and how the dual syllable and phoneme encoding of phonology in the Kannada orthography might transfer and facilitate reading acquisition in L2 (or more precisely, later-acquired Lx) English. Their results, reflective of other biliteracy studies with typologically differing languages, showed that only the phonemic aspect of phonological awareness from Kannada supported cross-linguistic facilitative effects, suggesting significant orthographic constraints to the biliteracy acquisition process in this case. Also consistent with previous studies, Reference Nakamura, Koda and JoshiNakamura, Koda, and Joshi (2014) revealed that in the case of Kannada–English biliteracy acquisition in Grade 3–8 students, the cross-linguistic relationships that were evident in decoding scores in the earlier grades faded as literacy development progressed, highlighting the increasing role of L2 oral-language skills in the later grades.
In an attempt to apply this cross-linguistic transfer research to the practice and policy question in India of when to introduce a child to literacy instruction in English, Reference Nakamura, de Hoop and HollaNakamura, de Hoop, and Holla (2019) tested whether there was a structural break in the relationship – or a point of “sufficient” mastery – between L1 akshara (Kannada or Telugu) decoding scores and L2 English decoding scores in students in Grades 1–5. Building on the akshara–English biliteracy studies that showed that the independent, significant predictors of reading development in L2 English in India were L1 decoding skills and L2 oral-language skills (Nakamura et al., 2013; Reference Reddy and KodaReddy & Koda, 2013) and that phonemic awareness in Kannada specifically accounted for variance in English decoding, it was hypothesized that after the mastery of the phonemic components within the akshara (a constrained skill, as opposed to oral vocabulary language, which can be considered an unconstrained skill; Reference Snow and MatthewsSnow & Matthews, 2016), L1 decoding ability is at a threshold level of mastery and transfer occurs. This transfer, in turn, leads to exponential improvements in English after the threshold has been achieved. In other words, it was predicted that there would be an L1 decoding transfer “tipping” point after which English decoding acquisition was significantly easier for the child. The results clearly demonstrated that in fact there was such a structural break in the correlation between Kannada or Telugu (depending on the region of study), and English decoding skills, suggesting that an empirical basis for transfer “readiness” can be identified. Furthermore, this study also theoretically contributed to our understanding of biliteracy transfer as a likely nonlinear process.
In sum, it is evident that there are cross-linguistic relations between L1 and L2 reading subskills, primarily through the sharing of metalinguistic skills and transfer of early word-reading skills. This is apparent in akshara–English biliteracy acquisition as well. Furthermore, there is emerging evidence for the possible nonlinearity of the transfer relationship in akshara and English biliteracy, wherein, based on the orthographic properties of the L1, there is a point at which a child has sufficient decoding ability to be considerably better prepared for literacy acquisition in English.
8.5 Conclusions and Discussion
With hundreds of languages, dozens of scripts, multiple writing systems, literacy acquisition in three languages formally required in all schools, and wide variances in socioeconomic groups and access to quality educational programs, India has one of the most diverse, complex, multilingual educational contexts in the world. Although private schools and certain sectors of society excel globally in terms of educational quality and outcomes, those less privileged in urban and rural poor communities continue to struggle to reach even minimal levels of literacy achievement (ASER Centre, 2018).
Multilingualism and multiscriptal learning in India are fraught with challenges as well as issues that make that country’s education system unamenable to the straightforward application of monolingual or even bilingual education research from Western nations and contexts of only alphabetic language learning. Literacy and biliteracy acquisition research from India and South and Southeast Asia, though nascent, are revealing that there are identifiable and teachable cognitive resources and opportunities in multilingual learning that need to be taken into consideration for more effective literacy education. One of the strongest candidates for this is the cross-linguistic transfer of resources from a known or familiar language. For the most part, there are normal distributions in oral-language skills and metalinguistic skills in a native or familiar language – and in contexts of not much else, these resources form a foundation for L1 or mother-tongue literacy acquisition, which in turn can transfer and act as one of the strongest predictors of success of literacy acquisition in a new or later-acquired language. Thus, if drawn upon efficiently, cross-linguistic resource sharing may provide an important opportunity for overcoming some of the challenges and limited resources of multilingual education in low-income communities in India.
In order to begin addressing the Indian literacy crisis and making a dent in global “learning poverty” (World Bank, 2019), it is critical to not only look at macro and systemic education issues but also recognize the importance of the cognitive foundations of learning in diverse multilingual and multiscriptal societies. Programmatic and policy theories of change that are founded in these realities (multiple and varying scripts, bi- and multilingualism, and multiple language involvement in learning to read) are critical to efforts to move the needle on the learning crisis (see also Nag, Chapter 15 and Asfaha & Nag, Chapter 16 in this volume). The research insights from the literacy diversity and multilingualism in India could potentially support this endeavor.
9.1 Introduction
East Asia, the eastern region of the Asian continent, includes China, Japan, South Korea, North Korea, Mongolia, and Taiwan. East Asia is densely populated; its 1.7 billion people make up approximately 22 percent of the world’s population (United Nations World Population Prospects; United Nations, 2019). China has the largest population in the world, with 1.398 billion people (Reference World Bank.World Bank, 2019). The populations are 126.26 million in Japan, 51.70 million in South Korea, 25.55 million in North Korea, and 3.23 million in Mongolia (Reference World Bank.World Bank, 2019). Taiwan is estimated to have 23.78 million people (Worldometer, 2020). Several East Asian countries, such as South Korea and China, have experienced rapid economic growth in the past few decades, whereas Japan’s economy consistently ranks among the top three in the world (Reference SarelSarel, 1997). The 2018 Human Development Index (UNDP, 2018) classified Japan and South Korea as developed countries, and China and Mongolia as developing countries.Footnote 1
Students in most East Asian countries/regions perform well on literacy. The reading scores of Chinese,Footnote 2 Japanese, South Korean, and Taiwanese students were higher than average according to the 2018 Programme for International Student Assessment (PISA), administered to fifteen-year-old students across sixty-five countries (OECD, 2018).Footnote 3 Notably, migrant communities still face many struggles in East Asia. For example, ethnic minorities, such as Filipinos, Indonesians, and South Asians, make up about 8 percent of the population in Hong Kong (Population By-Census, 2016). These minority groups experience both poverty and low education attainment (Reference ChuChu, 2019; Population By-Census, 2016). Similarly, in China, migrant children and children who reside in the countryside consistently perform less well than those who reside in the city (Reference Ren and ZhouRen & Zhou, 2019).
East Asia has a very long history of literary practice. With China being the largest and oldest country in East Asia, its writing system has a profound impact in the region. Written language first appeared in China on oracle bones in around 1400 BC. Since then, the Chinese writing system has undergone a long period of evolution to transform into the characters used today. The modern Chinese writing system is used not only by the 1.4 billion people in Mainland China but also in Chinese-speaking regions such as Hong Kong, Macau, and Taiwan. It is further used by Chinese-heritage speakers in Singapore, Malaysia, and countries around the world. Historically, Chinese characters were the standard written symbols used in Japan and Korea (Reference Feather and SturgesFeather & Sturges, 2003). However, most East Asian countries are biscriptal. Both Japan and Korea eventually developed their own scripts due to the mismatch between their spoken languages and Chinese characters. Today, the Japanese writing system consists of both kanji (Chinese characters) and kana; in Korea, Hanja (based on Chinese characters) has largely been replaced by Hangul. Mongolia also has a captivating history of coexisting scripts. It adopted the Cyrillic script under the influence of the Soviet Union in the 1940s. While the Cyrillic script is now the only official script in the country, the older Mongolian script has been kept, representing the traditional culture.
In what follows, we first present an overview of the writing systems used in China, Japan, Korea, and Mongolia, followed by a description of the educational system in relation to literacy in each country. We dedicate the rest of the chapter to individual variation, neurological foundations, and environmental factors related to literacy development in Chinese, because of the language’s long-standing history, diverse populations of speakers, and major impacts on other East Asian languages and writing systems.Footnote 4 We conclude the chapter by presenting a brief comparison of the factors related to literacy development in Chinese, Japanese, and Korean.
9.2 Writing Systems in East Asia
Modern Chinese characters originated from pictograms that resembled the shape of the object described. In this sense, they share some resemblance to other ancient writing systems in the world such as Egyptian hieroglyphs. The Chinese script now relies on morphosyllabic coding to map print onto speech and meaning (Reference Leong and TamaokaLeong & Tamaoka, 1995). Each character typically represents a syllable and a morpheme. While there are approximately 90,000 characters in modern Chinese (Reference Xu and WangXu & Wang, 2004), a college-educated person typically recognizes 5,000 characters (Reference HueHue, 2003). About 80 to 90 percent of commonly used characters are semantic-phonetic compound characters formed by combining a phonetic radical and a semantic radical (Reference Shu, Chen, Anderson, Wu and XuanShu et al., 2003). For example, the character 粒 /li 4/ (a grain of rice) consists of the phonetic radical 立 /li4/, which provides information about the pronunciation, and the semantic radical 米 /mi 3/ (rice), which provides clues for the meaning. The other three common types of characters are pictographs, ideographs, and semantic-semantic compounds. Pictographs are simple characters originated from drawings of objects, for example, 山 /shan 1/ (mountain). Ideographs are modified pictographs used to express abstract ideas in iconic forms, for example, 上 /shang 4/ (up). Semantic-semantic compound characters are formed by combining two semantic radicals. For example, the character 明 (brightness) is formed by combining 日(sun) and 月 (moon), both of which contribute to the meaning.
The Chinese writing system was brought to Japan in the fourth and fifth centuries. It was introduced to the elites to familiarize them with Chinese culture. Since then, the development of Japanese has been heavily influenced by Chinese in both script and vocabulary (Reference LovedayLoveday, 1996). The Modern Japanese writing system consists of two scripts, syllable-based kana (hiragana and katakana) and morpheme-based Chinese characters, Kanji (Reference Taylor and TaylorTaylor & Taylor, 1995). The Japanese hiragana and katakana orthographies consist of five vowels, and each vowel has a short and long version. Hiragana is mostly used for words that are not represented in kanji and for verbs and adjective conjugations with kanji. Most loan words from English and other European languages are written in katakana. For example, the word restaurant has been adapted into Japanese as Resutoranto/ (ラストランと). On the other hand, kanji characters are used extensively to represent words borrowed from Chinese. While a kanji character keeps the original monosyllabic Chinese pronunciation, the spoken sound of the Japanese word is also added to represent its lexical identity. As such, most kanji characters consist of two or more readings. For example, the character 森 uses its Japanese pronunciation /mori/ when it appears alone, but it adopts the Chinese pronunciation /sin/ in the word forest (森林 /sinrin/).
For a long time, Korean was a spoken language without any written scripts. Chinese characters were brought to Korea around the third century. Upper-class Koreans have since used Chinese characters in royal and historical documents (Reference HolcombeHolcombe, 2017). However, many poorly educated Koreans were nonliterate due to the fundamental differences between the Korean and Chinese languages. To solve this problem, King SeJong invented the Korean script so that people with little education could have access to literacy (Reference Feather and SturgesFeather & Sturges, 2003). The Korean script was officially published in 1446, and was named Hangul (or “Hunminjeongeum”), meaning “the correct sounds to instruct the people.” Hangul was initially opposed by the literary elite, and Hanja remained the prestige script for the next few hundred years. Hangul became the official writing system in the 1880s due to the efforts of the nationalist movement. The use of Hanja has been in decline since the 1970s and it was banned in North Korea completely (Reference Kim-RenaudKim-Renaud, 1997; Reference LeeLee, 1990).
Hangul is a syllabic alphabet consisting of seventeen vowels and eleven consonants. The letters were carefully designed to indicate the shape of the mouth and placement of the tongue when articulating the respective sound. For example, the letter /n/ represents the tongue touching the upper larynx (![]() ) inside the mouth when articulating the /n/ sound, and the letter /m/ (
) inside the mouth when articulating the /n/ sound, and the letter /m/ (![]() ) shows the closed mouth shape when pronouncing the /m/ sound. Hangul is arranged in a nonlinear fashion orthographically. Its letters are shaped into square-like blocks, and the alphabet letters are arranged from left to right, then top to bottom (example: /감/, pronounced as /kam/) (Reference Taylor and TaylorTaylor & Taylor, 1995). Modern Korean includes native Korean words and loan words. More than 70 percent of the loan words come from Chinese and can be written in Hangul or Chinese characters (Hanja). Native Korean words and loan words with European roots are only written using Hangul. Although it remains debatable when and how Chinese scripts were first introduced to Korea, Chinese culture and scripts gained their popularity in Korea during the Han and Tang dynasties (approximately 108 BC to AD 677). Western loan words, on the other hand, were introduced to Korea through Japanese mostly from 1890 to 1945 (Reference SohnSohn, 2006).
) shows the closed mouth shape when pronouncing the /m/ sound. Hangul is arranged in a nonlinear fashion orthographically. Its letters are shaped into square-like blocks, and the alphabet letters are arranged from left to right, then top to bottom (example: /감/, pronounced as /kam/) (Reference Taylor and TaylorTaylor & Taylor, 1995). Modern Korean includes native Korean words and loan words. More than 70 percent of the loan words come from Chinese and can be written in Hangul or Chinese characters (Hanja). Native Korean words and loan words with European roots are only written using Hangul. Although it remains debatable when and how Chinese scripts were first introduced to Korea, Chinese culture and scripts gained their popularity in Korea during the Han and Tang dynasties (approximately 108 BC to AD 677). Western loan words, on the other hand, were introduced to Korea through Japanese mostly from 1890 to 1945 (Reference SohnSohn, 2006).
Modern-day Mongolia uses two scripts. The Cyrillic script was introduced in the 1940s, when Mongolia was a satellite state of the Soviet Union. It is a phonemic writing system that includes all the letters from the Russian alphabet with an additional two letters representing vowels unique to the Mongolian language (Reference GriveletGrivelet, 2001; Reference SandersSanders, 2013). The Mongolian script boasts a much longer history – it was created at the end of the twelfth century, shortly before the start of the Yuan dynasty. The Mongolian script is considered as an abugida script, with its writing arranged in vertical columns and from left to right on a page. While the adoption of the Cyrillic script dramatically improved the literacy rate in Mongolia, the Mongolian script was nearly extinct around the same time. This script was only used in Inner Mongolia in Northern China and continues to be used there today. Despite several attempts to revitalize the Mongolian script in the 1980s and 1990s, the Cyrillic script remains the only official script in Mongolia. The Mongolian script is taught as a school subject but rarely used in daily life (Reference GriveletGrivelet, 2001). The two writing systems represent different attributes. The Mongolian script is associated with Mongolia’s traditional culture and history. The Cyrillic script, on the other hand, is appreciated for its ease of learning and regarded as an instrument for communication (Reference GriveletGrivelet, 1999).
9.3 Literacy Education in China, Japan, and Korea
Literacy education is highly valued in East Asian societies due to the Confucian tradition of student enlightenment (Reference ChengCheng, 2014; Reference ShengSheng, 2014).Footnote 5 Literacy also served practical functions in feudal times – when the general public was mostly illiterate, it was important to have a literate member to handle a family’s business affairs in the written form (Reference LeeLee, 2000; Reference SeebergSeeberg, 1990). Furthermore, achieving a high level of literacy was nearly the only way for students to excel in the imperial examination (科举) and become “scholar bureaucrats“ (士大夫) (Reference ZuoZuo, 2003). In today’s China, education continues to be perceived as an effective way to move up the social ladder. For children of farmers, for example, a university degree enables them to escape from the harsh living conditions of the countryside to resettle in cities; for city residents, good education helps them find high-paying jobs (Reference SeebergSeeberg, 1990; Reference SeebergSeeberg, 1993). The history of the imperial examination shows a widespread and enduring impact on education across East Asia. Japan was the first country to follow China in adopting the imperial examination system, whereas Korea had the longest-standing and most complete system outside of China (Reference LiuLiu, 2006). Even today, education is regarded as a high priority in Japanese and Korean families. Students put extensive amounts of effort into studying to prepare themselves for university entry exams, as attending university improves one’s socioeconomic level (Reference Kell and KellKell & Kell, 2013; Reference Mani and TrinesMani & Trines, 2018).
Modern-day China has a nine-year compulsory education system from Grades 1 to 9 (Reference Li and RaoLi & Rao, 2005). Children officially learn to read when they enter Grade 1. Beginning readers learn to read Chinese using Pinyin, a transliteration system that denotes character pronunciation. Pinyin contains mostly the same letters as the Roman alphabet, and it is completely regular in letter–sound correspondences. A similar phonetic system called Zhuyin Fuhao is used in Taiwan, except that the symbols in this system come from radicals and subcomponents of ancient characters (Reference HuangHuang, 2019). In Mainland China, initially, Pinyin syllables are printed above all characters. As children’s literacy improves, use of Pinyin in children’s text becomes limited to unfamiliar characters and then entirely disappears (Reference Leong and TamaokaLeong & Tamaoka, 1995). By the end of Grade 6, a child is expected to recognize 3,000 characters and to spell 2,500 of them (Reference Li and RaoLi & Rao, 2000). Due to the high memory load of learning to read a morphosyllabic script, dictation and repeated copying of characters are commonly used in literacy instruction. In Hong Kong, children start to learn to read Chinese characters as early as in the first year of kindergarten, at the age of three (Reference McBride-Chang, Tong and ShuMcBride-Chang et al., 2008). The “look and say” method is commonly used to teach Chinese characters without the help of any phonemic coding system (Reference Yeung, Ho, Chan and ChungYeung et al., 2016a). Education in Hong Kong highlights the importance of “bi-literacy and tri-lingualism,” meaning children are required to become trilingual in Cantonese, Mandarin, and English, and biliterate in Chinese and English (Reference Lee and LeungLee & Leung, 2012).
The compulsory education system is also nine years in Japan (Foreign Press Center, Japan, 2010). Japanese students learn 105 kana in the forms of hiragana and katakana as well as 1,006 kanji in elementary school. It is common for Japanese children to start formal schooling with basic mastery of hiragana. Students begin to learn katakana and kanji from first grade. Students are expected to master katakana symbols by Grade 3 and to acquire 1,006 kanji characters by Grade 6, and an additional 1,130 kanji characters by the end of junior high school, in Grade 9.
The South Korean Ministry of Education is currently expanding its nine-year compulsory education to twelve years and is expected to achieve this goal for the entire country in the near future. Similar to Japan, Korean children often begin formal schooling with a basic understanding of Hangul. By elementary school, children are expected to master basic grapheme-to-phoneme correspondences for Hangul letters and learn more complex concepts that alter the phonology of some words such as resyllabification, consonantal assimilation, and the simplification of multiple coda. Currently, 1,800 “common Chinese characters” designated by the ministry of education in Korea are included in the school curriculum. Students are required to master 1,300 Chinese characters by Grade 9. North Korea, on the other hand, implements an eleven-year compulsory education system. Starting from the ages of four to five, students attend one year of kindergarten, four years of elementary school, and six years of middle school (Reference ReedReed, 1997). However, Chinese is excluded from the education curriculum in primary and secondary schools in North Korea (Reference ReedReed, 1997; Reference SongSong, 2002).
9.4 Literacy Development: Focus on China
The Chinese writing system is among the oldest in the world. Unlike many other ancient scripts that were buried in the long course of history, Chinese characters are still in use today, and are used by the largest population in the world (Reference ShuShu, 2003). Logographic symbols were encrypted on pottery about 4,800 years ago (Reference BoltzBoltz, 1994). Around the fourteenth century BC, writing symbols were inscribed in oracle bones. These oracle-bone inscriptions contain more than 3,000 words, including nouns, verbs, adjectives, and pronouns. In the late Shang dynasty (approximately 1,000 BC), writing started to appear on bronze. The script form on the bronzes is very similar to the oracle-bone inscription sand that gained its popularity in the times of the West Zhou, the dynasty that followed Shang (Reference LiLi, 2002).
From 259 to 210 BCE, the Qin Empire, the first united dynasty in China, standardized writing, currency, and metric systems across the country. The emperor modified Chinese characters and their writing structure so they could be used consistently. This unified writing system is named Xiao Zhuan (小篆). Xiao Zhuan then evolved into a more simplified script called Li ShuFootnote 6 (隶书) in the Han dynasty (approximately 200 BC). Li Shu was originally used by slaves and peasants due to its simplified form. As its popularity increased among the general public, this form of writing was adopted by the elite class and became the official system across the country. The number of characters significantly increased in the Han Dynasty, with more than 9,000 characters identified in the earliest Chinese dictionary, “Shuo Wen Jie Zi” (说文解字) (Lan & Matsuoka, 2018). Later in the East Han dynasty (approximately AD 25–200 ), Li Shu gradually evolved into Cao Shu (草书), Kai Shu (楷书), and Xing Shu (行书), all of which are still practiced by calligraphers today.
In 1964, the government in Mainland China simplified 2,238 commonly used characters. These simplified characters have also been adopted in Singapore, whereas traditional characters continue to be used in Hong Kong, Macau, and Taiwan (Reference BöksetBökset, 2006). Because Chinese characters were simplified based on a set of principles, and many simplified characters bear a resemblance to corresponding traditional characters, a fluent reader educated in one script is typically able to read the other (Reference Liu and HsiaoLiu & Hsiao, 2012; Reference BöksetBökset, 2006). However, the simplification of the Chinese script remains highly controversial. Some scholars argue that simplified characters are less aesthetically pleasing and are disconnected from Chinese history and culture (Reference Goodman, Wang, Iventosch and GoodmanGoodman et al., 2012). Supporters contend that simplification promoted literacy among Chinese people, as more than half of the Chinese population were illiterate or semiliterate at the time.
9.5 Individual Variation in Chinese Reading Development
9.5.1 Role of Phonological Awareness
China is a country where many different dialects are spoken.Footnote 7 These varieties are generally classified into seven major groups: Mandarin, Wu, Xiang, Gan, Hakka, Min, and Yue (Reference Li and ThompsonLi & Thompson, 1981). Among these, Mandarin is the standard language of China and used by the largest percentage of the population. Unlike English, which contains more than 6,000 syllables, Mandarin has only about 400 basic syllables and a total of 1,300 syllables when different tones are considered (Reference DuanmuDuanmu, 2007). Mandarin consists of twenty-one initial consonants, two final consonants, three glides, and six vowels (Reference DuanmuDuanmu, 2007). Possible syllable combinations in Mandarin include V (爱, /ai4/), CV (大, /da4/), VC (安, /an1/), and CVC (晚, /wan3/) (Yang, 1988). Mandarin is a tonal language; when the tone of a syllable changes, it turns into a different morpheme. For example, 妈 /ma1/ means mother, whereas 马 /ma3/ means horse. Mandarin has four different tones – high level, rising, fall-rise and high falling. Tones are usually indicated by either tone marks or the numbers 1, 2, 3, and 4 for ease of writing. A small number of syllables (e.g.,了 /le/) can be marked with a neutral tone, also called a zeroth tone. These syllables are shorter and less meaningful than other syllables. Chinese has a large number of homophones. On average, each tone syllable corresponds to five morphemes. These morphemes share the same pronunciation but are represented by idiosyncratic characters in print (e.g., 言, 岩, 盐, 颜, 严, 研, 阎, /yan2/) (Reference DuanmuDuanmu, 2007).
Cantonese is a dialect mainly spoken in Southeast China, including the provinces of Guangdong and Guangxi, and Hong Kong and Macao. Cantonese has a more complex phonological structure than Mandarin (Reference Chen, Anderson and LiChen et al., 2004). It consists of nineteen initial consonants, eight final consonants, and eight vowels (Reference So and DoddSo & Dodd, 1995, Reference ZengZeng, 1994). There are six tones in Cantonese: high level, high rising, mid-level, low falling, low rising, and low level. There are also three “entering tones,” the high-, mid- and low-stopped tones, which appear with syllables ending with /p/, /t/, and /k/. These tones are much shorter in duration and are considered allotones of the three level tones (Reference Bauer and BenedictBauer & Benedict, 1997; Reference So and DoddSo & Dodd, 1995). Despite the considerable differences between Cantonese and Mandarin, the two dialects, as well as all other dialects in China, are represented by the same written text, based on Mandarin. In other words, all Chinese children learn to read in Mandarin, though for many it is not their native dialect. This situation creates unique challenges that are currently understudied and need to be addressed by future research.
Phonological awareness refers to the ability to reflect on and manipulate smaller units of sounds in spoken words (Reference GoswamiGoswami, 2000). Phonological awareness consists of three different levels – syllable, onset-rime, and phoneme in most languages (Reference Lin, Cheng and WangLin, Cheng, & Wang, 2018; Reference Yoon, Bolger, Kwon and PerfettiYoon et al., 2002). Tone awareness is a unique aspect of phonological awareness in Chinese (Reference Chen, Pasquarella, Verhoeven and PerfettiChen & Pasquarella, 2017; Reference Treiman, Zukowski, Brady and ShankweilerTreiman & Zukowski, 1991). There is a one-to-one association between syllables and morphemes in Chinese, and both correspond to characters. For this reason, syllable awareness is salient for children at an early age (Reference Pan, Song and SuPan et al., 2016; Reference Zhang, Lin, Wei, Anderson, Chen, Wang and YangZhang et al., 2014). In Mainland China, when beginning readers learn to read characters using Pinyin, a syllable is usually split into two basic components: an onset (声母 /sheng1mu3/), which is the initial consonant of the syllable, and a rime (韵母 /yu4mu3/), which includes the rest of the syllable (Reference TřískováTřísková, 2011). As a result, onset-rime awareness is also important for reading characters. Finally, because Chinese is a tonal language, Chinese speakers must possess tone awareness to distinguish morphemes with the same syllable but different tones (少 /shao3/ -less, and 勺/shao2/-spoon).
An extensive body of research has found phonological awareness to be critical for success in word reading in alphabetic languages (Reference Lesaux and SiegelLesaux & Siegel, 2003; Reference Linan-Thompson, Vaughn, Prater and CirinoLinan-Thompson et al., 2006). Chinese, as a morphosyllabic script, differs substantially on orthography–phonology correspondences from alphabetic languages (i.e., Korean, English) or languages based on alphasyllabaries (i.e., Japanese). The link between phonological awareness, particularly phonemic awareness, and reading is less straightforward due to the lack of grapheme–phoneme correspondences in Chinese. However, given the use of Pinyin and phonetic radicals to denote character pronunciations, some aspects of phonological awareness, such syllable and tone awareness, may still play an important role in Chinese reading (e.g., Reference Ruan, Georgiou, Song, Li and ShuRuan et al., 2018). It has been found that learning a phonetic alphabet such as Pinyin enhances phonological awareness among Chinese children. Children from Mainland China and Taiwan perform better on phonological-awareness measures compared to their peers from Hong Kong, who read without the assistance of a transliteration system (Reference Huang and HanleyHuang & Hanley, 1995; Reference McBride-Chang, Bialystok, Chong and LiMcBride-Chang et al., 2004). Furthermore, research has shown that syllable and tone awareness are both significant predictors of word reading in Chinese (Reference McBride-Chang, Tong and ShuMcBride-Chang et al., 2008; Reference Tong, Lee, Lee and BurnhamTong et al., 2015). For example, syllable awareness was found to act as a stronger predictor of Chinese word reading than onset-rime awareness in the early grades (Reference Pan, Song and SuPan et al., 2016; Reference Shu, Peng and McBride‐ChangShu, Peng, & McBride-Chang, 2008). By contrast, research examining onset-rime awareness has generated mixed findings. While some studies found onset-rime awareness to predict Chinese word reading (e.g., Reference Ho and BryantHo & Bryant, 1997; Reference Wang, McBride-Chang and ChanWang et al., 2014), others did not (e.g., Reference McBride-Chang, Tong and ShuMcBride-Chang et al., 2008).
9.5.2 Role of Morphological Awareness
Morphemes are the smallest units of meaning. They are combined to build complex words in a language. A root carries the meaning of a word, whereas affixes are auxiliary components that attach to a base.Footnote 8 Affixes can be further divided into inflectional and derivational affixes. Inflectional affixes denote grammatical functions (e.g., book-books). Derivational affixes form a new word from the base unit, and this new word often belongs to a different word class (e.g., book-bookish). The morphological system in Chinese has many distinct features. Chinese does not have grammatical agreement, morphological paradigms, and morphophonemic alternation (Reference PackardPackard, 2000). About 70 percent of Chinese words are lexical compounds formed by combining two roots (e.g., cow: beef meat) (Reference PackardPackard, 2000). In Chinese, one morpheme is typically represented by one syllable in its spoken form and one character in print, for example 天/tian1/ “sky” (Reference DeFrancisDeFrancis, 1984). Occasionally, loan words consist of more than one syllable, for example, 咖啡/ka1fei1/ “coffee,” because characters are used to indicate sounds. In addition to homophonic morphemes, Chinese contains homographic morphemes, which have the same pronunciation and orthographic form. In other words, the same character can correspond to different morphemes. For example, 面 /mian4/ means flour in 面粉/mian4fen3/ (flour powder) but surface in 桌面/zhuo1mian4/ (desk top).
Morphological awareness can be defined as the awareness of the morphological makeup of words and the ability to reflect on and manipulate their constituent morphemic parts. Due to the prominence of lexical compounding and a high density of homophony in Chinese, researchers have examined the role of compound awareness and homophone/homograph awareness in children’s reading development. A morphological construction task is often used to measure compound awareness (Reference Chen, Hao, Geva, Zhu and ShuChen et al., 2009; Reference McBride-Chang, Shu, Zhou, Wat and WagnerMcBride-Chang et al., 2003). Children are first presented with the definition of a familiar word and are then asked to create a novel word that has the same morphological structure. For example, “Striped horse (zebra) is a horse with stripes on its body. What should we call a cow with stripes on its body?” (斑马是身上有斑纹的一种马, 那么身上有斑纹的牛我们叫什么?). The correct answer is “striped cow” (斑牛). Homophone/homograph awareness is often assessed with a morpheme-judgment task. For example, in a homophone-awareness task, children are aurally presented with a word containing the target morpheme (e.g., /hua4/ in 画家 /hua4jia1/ – “paint artist: painter”) and then are asked to choose the word that contains the same morpheme from several options (e.g., 话剧/hua4ju4/– “speech opera: drama”; and 画布 /hua4bu4/ – “paint fabric: canvas”) (Reference McBride-Chang, Shu, Zhou, Wat and WagnerMcBride-Chang et al., 2003; Reference McBride-Chang, Cho and LiuMcBride-Chang et al., 2005; Reference Shu, McBride-Chang, Wu and LiuShu et al., 2006). In a homograph-awareness task, children are aurally presented with a compound word containing a target morpheme (e.g., /hua1/ in 花园 /hua1yuan2/ – “flower yard: garden”), then asked to produce two words with the target morpheme having different meanings in the words (e.g., /hua1/ in 花朵 /hua1duo3/ – “flower blossom” and /hua1/ in 花钱 /hua1qian2/ – “spend money”) (Reference Xie, Zhang, Wu and NguyenXie et al., 2019).
Both lexical compounding awareness and homophone/homograph sensitivity have been found to predict reading outcomes among Chinese children (Reference Chen, Hao, Geva, Zhu and ShuChen et al., 2009; Reference Tong, Tong and McBrideTong, Tong, & McBride, 2017). As the majority of Chinese words are compound words, it is crucial to understand how morphemes can be legally combined to form morphologically complex words (Reference ChanChan, 2013). Studies have found that after controlling for other relevant variables, compound awareness has significant effects on Chinese character reading (e.g., Reference Liu and McBride-ChangLiu & McBride-Chang, 2010), vocabulary (e.g., Reference Liu and McBride-ChangLiu & McBride-Chang, 2010; Reference Liu, McBride-Chang, Wong, Shu and WongLiu, McBride-Chang et al., 2013), and reading comprehension (e.g., Reference Li, Zhang and XiaLi et al., 2017; Reference Xie, Zhang, Wu and NguyenXie et al., 2019). In addition, the high density of homophones and homographs requires children to distinguish among characters that have the same pronunciation (and sometimes also the same orthographic form) but represent different morphemes. Research shows that children who are more sensitive to homophones (Reference Chung and HuChung & Hu, 2007) and homographs (Reference Li, Dong, Zhu, Liu and WuLi et al., 2009) perform better on Chinese character reading and vocabulary tasks (Reference Cheng, Wu, Liu and LiCheng et al., 2017; ; Reference Ku and AndersonKu & Anderson, 2003; Reference Liu, McBride-Chang, Wong, Shu and WongLiu, McBride-Chang et al., 2013; Reference Shu, McBride-Chang, Wu and LiuShu et al., 2006; Reference Wu, Anderson and LiWu et al., 2009). Due to the one-to-one mapping between syllables and morphemes in Chinese, studies comparing morphological and phonological awareness simultaneously often report that the former plays a larger role in reading (e.g., Reference Li, Anderson, Nagy, Zhang, Li, Gaffney and PackardLi et al., 2002; Reference McBride-Chang, Cho and LiuMcBride-Chang et al., 2005; Reference Pan, Shu, Wang and YanPan et al., 2015). This pattern is confirmed by a meta-analysis by Reference Ruan, Georgiou, Song, Li and ShuRuan et al. (2018), who reported that morphological awareness was more strongly associated with word reading and reading comprehension than with phonological awareness in Chinese. Interestingly, the same study found phonological awareness to play a stronger role than morphological awareness in reading English.
9.5.3 Role of Orthographic Knowledge
Characters are composed of strokes, which are the smallest units of written form in Chinese. A stroke is usually a line (一) or a dot (丶). A stroke can be straight or curved (丿), vertical (丨), horizontal, or diagonal (![]() ), and it can contain a “hook” (亅) (Reference Taylor and TaylorTaylor & Taylor, 1995). The visual complexity of a character is usually identified by the number of individual strokes within the character. Characters of higher frequency usually contain fewer strokes, whereas those of lower frequency have more strokes (Reference Li, Zhang and EhriLi et al., 2016; Reference Shu, Chen, Anderson, Wu and XuanShu et al., 2003). On average, the total number of strokes in characters written in the simplified script is approximately 22.5 percent fewer than those written in the traditional script (Reference Gao, Kao and KaoGao & Kao, 2002). Interestingly, readers who have been exposed to traditional Chinese characters showed higher visual-perception skills than those who have been exposed to simplified characters (Reference Chang, Chen and PerfettiChang, Chen, & Perfetti, 2018). Radicals, formed by stroke combinations, are functional units of Chinese characters. There are approximately 800 phonetic and 200 semantic radicals in Chinese (Reference Hoosain, Chen and TzengHoosain, 1992). Most radicals are independent characters with their own meanings and pronunciations; a small number of them are in bound forms that can only appear as a part of a character (Reference Shu, Chen, Anderson, Wu and XuanShu et al., 2003). Among the four common types of characters, pictographs and ideographs are simple characters without an internal structure. Semantic-phonetic and semantic-semantic compound characters are complex characters made up of radicals. The majority of compound characters consist of a left–right structure (e.g, 彩 /cai3/); others have a top–bottom structure (e.g, 菜 /cai4/) or an inside–outside (surrounding) structure (困 /kun4/) (Reference Zhang, Li, Dong, Xu and SholarZhang et al., 2016).
), and it can contain a “hook” (亅) (Reference Taylor and TaylorTaylor & Taylor, 1995). The visual complexity of a character is usually identified by the number of individual strokes within the character. Characters of higher frequency usually contain fewer strokes, whereas those of lower frequency have more strokes (Reference Li, Zhang and EhriLi et al., 2016; Reference Shu, Chen, Anderson, Wu and XuanShu et al., 2003). On average, the total number of strokes in characters written in the simplified script is approximately 22.5 percent fewer than those written in the traditional script (Reference Gao, Kao and KaoGao & Kao, 2002). Interestingly, readers who have been exposed to traditional Chinese characters showed higher visual-perception skills than those who have been exposed to simplified characters (Reference Chang, Chen and PerfettiChang, Chen, & Perfetti, 2018). Radicals, formed by stroke combinations, are functional units of Chinese characters. There are approximately 800 phonetic and 200 semantic radicals in Chinese (Reference Hoosain, Chen and TzengHoosain, 1992). Most radicals are independent characters with their own meanings and pronunciations; a small number of them are in bound forms that can only appear as a part of a character (Reference Shu, Chen, Anderson, Wu and XuanShu et al., 2003). Among the four common types of characters, pictographs and ideographs are simple characters without an internal structure. Semantic-phonetic and semantic-semantic compound characters are complex characters made up of radicals. The majority of compound characters consist of a left–right structure (e.g, 彩 /cai3/); others have a top–bottom structure (e.g, 菜 /cai4/) or an inside–outside (surrounding) structure (困 /kun4/) (Reference Zhang, Li, Dong, Xu and SholarZhang et al., 2016).
Orthographic knowledge in Chinese refers to knowledge of the internal structure of Chinese characters (Reference Ho, Ng and NgHo, Ng, & Ng, 2003). This knowledge includes the position, function, and legal combination of phonetic and semantic radicals that form compound characters. With respect to position, semantic radicals usually appear on the left (75 percent) or top (15 percent) of a character (Reference Feldman and SiokFeldman & Siok, 1999), whereas the common positions for phonetic radicals are right or bottom. Most radicals always appear in the same position, but a small number of them appear in different positions across different characters. Functionally, semantic and phonetic radicals provide cues to meaning and pronunciation respectively. The Chinese writing system is more accurate in representing meaning than phonology. Semantic radicals are generally informative of character meaning. In contrast, a phonetic radical has the same syllable as the character in only about 40 percent of the characters (Reference ShuShu, 2003). The percentage is even lower when tone is considered. Finally, not all semantic and phonetic radicals can combine to form characters. Simply combining a semantic radical and a phonetic radical in their legal positions may or may not form a real character together.
Due to the unique characteristics of the Chinese writing system, a variety of measures have been designed to assess orthographic knowledge. For example, in an orthographic judgment task, children are presented with different types of “novel” characters and asked to judge whether each one could be a real character (Reference Li, Shu, McBride‐Chang, Liu and PengLi et al., 2012). These items may include line drawings with no conventional stroke patterns (![]() ), noncharacters with real radicals in illegal positions (
), noncharacters with real radicals in illegal positions (![]() ), pseudo-characters with real radicals that appear in legal positions but do not combine together (
), pseudo-characters with real radicals that appear in legal positions but do not combine together (![]() ), pseudo-characters with subcomponents that do not exist in Chinese (
), pseudo-characters with subcomponents that do not exist in Chinese (![]() ). Furthermore, specific tasks have been designed to assess children’s awareness of the position and function of phonetic (Reference Ho, Yau, Au, McBride-Chang and ChenHo, Yau, & Au, 2003; Reference Yeung, Ho, Chan and ChungYeung et al., 2016a) and semantic radicals (Reference Yeung, Ho and ChikYeung et al., 2011; Reference Zhang, Li, Dong, Xu and SholarZhang et al., 2016). For example, in a phonetic radical knowledge task, a pseudo-compound character (
). Furthermore, specific tasks have been designed to assess children’s awareness of the position and function of phonetic (Reference Ho, Yau, Au, McBride-Chang and ChenHo, Yau, & Au, 2003; Reference Yeung, Ho, Chan and ChungYeung et al., 2016a) and semantic radicals (Reference Yeung, Ho and ChikYeung et al., 2011; Reference Zhang, Li, Dong, Xu and SholarZhang et al., 2016). For example, in a phonetic radical knowledge task, a pseudo-compound character (![]() ) is paired with three real characters, one with the same semantic radical (破), one with the same phonetic radical (味), and one that does not share any radicals in common (埋). Children are asked to choose the character (味) that has the same pronunciation as the target character. In a semantic radical knowledge task, each item is paired with four pictures, and children are asked to choose the picture that best represents the meaning of the semantic radical (Reference Ho, Ng and NgHo, Ng, & Ng, 2003).
) is paired with three real characters, one with the same semantic radical (破), one with the same phonetic radical (味), and one that does not share any radicals in common (埋). Children are asked to choose the character (味) that has the same pronunciation as the target character. In a semantic radical knowledge task, each item is paired with four pictures, and children are asked to choose the picture that best represents the meaning of the semantic radical (Reference Ho, Ng and NgHo, Ng, & Ng, 2003).
Research has shown that children start to form mental representations of radical forms and positions in Grade 1, and these representations are well established by Grade 3 (Reference Chan and NunesChan & Nunes, 1998; Reference Ho, Yau, Au, McBride-Chang and ChenHo, Yau, & Au, 2003; Reference Li, Shu, McBride‐Chang, Liu and PengLi et al., 2012). Children are faster at rejecting noncharacters that violate legal radical positions than pseudo-characters that follow the legality of radical positions in lexical-decision tasks (Reference Qian, Song, Zhao and BiQian et al., 2015; Reference Wang, Perfetti and LiuWang, Perfetti, & Liu, 2005). Children are able to derive meanings of unfamiliar compound characters using familiar semantic radicals (Reference Anderson, Li, Ku, Shu and WuAnderson et al., 2003; Reference Ho, Ng and NgHo, Ng, & Ng, 2003; Reference Shu and AndersonShu & Anderson, 1997) and pronunciations using phonetic radicals (Reference Anderson, Li, Ku, Shu and WuAnderson et al., 2003; Reference Ho and BryantHo & Bryant, 1997). The pronunciation of an unfamiliar character (e.g, 蜻 /qing1/) can also be predicted by making an analogy to a character (e.g., 清 /qing1/) with the same phonetic radical (e.g., 青 /qing1/) (Reference Ho, Ng and NgHo, Ng, & Ng, 2003). Importantly, research shows that orthographic knowledge of both semantic and phonetic radicals is related to word reading (Reference Leong, Tse, Loh and KiLeong et al., 2011; Reference Peng, Li, Yang and ChenPeng, Li, & Yang, 1997; Reference Yeung, Ho, Chan and ChungYeung et al., 2016b) and spelling (Reference Yeung, Ho, Chan and ChungYeung et al., 2016b). For example, two studies (Reference Ho, Ng and NgHo, Ng, & Ng, 2003; Reference Yeung, Ho and ChikYeung et al., 2011) observed that semantic radical knowledge predicted word reading in Grades 1 and 3, and phonetic radical knowledge predicted word reading in Grades 1, 3, and 5. Reference Yeung, Ho, Chan and ChungYeung et al. (2016a) found that both types of radical knowledge predicted word spelling in Grades 2 and 4. Finally, knowledge of semantic radicals has been found to contribute to reading comprehension (Reference Ho, Ng and NgHo, Ng, et al., 2003). Because the majority of the compound characters introduced in the elementary school curriculum are semantically transparent, semantic radicals provide reliable information about character meaning (Reference Shu, Chen, Anderson, Wu and XuanShu et al., 2003). For example, Reference Yeung, Ho, Chan and ChungYeung et al. (2016a) reported that semantic radical knowledge uniquely contributed to reading comprehension among Chinese children in Grade 4.
9.5.4 Word Reading and Spelling
According to the lexical-quality hypothesis (Reference PerfettiPerfetti, 2007), word identity consists of orthography, phonology, grammar, and meaning, and these features are bound together to secure coherence (binding). Studies have provided evidence in support of the lexical-quality hypothesis in Chinese (Reference Guan and WangGuan & Wang, 2017). Accordingly, phonological awareness, morphological awareness, and orthographic knowledge have all been found to contribute to word reading in Chinese children. With respect to phonological awareness, research has shown that both syllable and tone awareness play an important role in Chinese word reading due to the salience of these linguistic units (Reference McBride-Chang, Tong and ShuMcBride-Chang et al., 2008; Reference Tong, Lee, Lee and BurnhamTong et al., 2015). In terms of morphological awareness, both lexical compounding awareness (Reference Liu and McBride-ChangLiu & McBride-Chang, 2010) and homophone/homograph sensitivity (Reference Chung and HuChung & Hu, 2007) predict word reading because Chinese consists of a large number of compound words and homophones/homographs. In addition, the knowledge of the position, function, and legal combination of phonetic and semantic radicals of compound characters is a reliable contributor to Chinese word reading (Reference Ho, Yau, Au, McBride-Chang and ChenHo, Yau, & Au, 2003; Reference Leong, Tse, Loh and KiLeong et al., 2011; Reference Peng, Li, Yang and ChenPeng et al., 1997; Reference Yeung, Ho, Chan and ChungYeung et al., 2016a). Metalinguistic skills have also been found to contribute to spelling. Previous studies have shown that phonological awareness (Reference Tong, McBride-Chang, Shu and WongTong et al., 2009; Reference Yeung, Ho and ChikYeung et al., 2011), orthographic processing (Reference Ho, Ng and NgHo et al., 2003; Yeung et al., 2015), and morphological awareness (Reference Tong, McBride-Chang, Shu and WongTong et al., 2009; Reference Yeung, Ho, Chan and ChungYeung et al., 2016a) are all related to spelling acquisition in Chinese.
Because Chinese characters are visually complex, repetition of character writing, following the correct stroke order, is a popular approach to fostering children’s literacy development (Reference Lam and McBrideLam & McBride, 2018; Reference Pine, Ping’an and Ren SongPine, Ping’an, & Ren Song, 2003). Several recent studies have examined the role of visual-motor integration in reading and spelling Chinese characters. Visual-motor integration refers to the ability to coordinate visual information and hand movement (Reference Longcamp, Anton, Roth and VelayLongcamp et al., 2005) and is measured by character-copying tasks in Chinese children. This small body of research has provided evidence that visual-motor integration is related to both reading (Reference McBride-Chang, Zhou and ChoMcBride-Chang et al., 2011; Reference Meng, Wydell and BiMeng, Wydell, & Bi, 2019) and spelling (Reference Lam and McBrideLam & McBride, 2018) in Chinese. For example, Reference Wang, McBride-Chang and ChanWang, McBride-Chang, and Chan (2014) observed that after controlling for age and nonverbal intelligence, the ability to copy unfamiliar scripts (Korean, Vietnamese, and Hebrew) uniquely contributed to spelling in kindergarteners (Reference Wang, McBride-Chang and ChanWang et al., 2014). Reference McBride-Chang, Zhou and ChoMcBride-Chang et al. (2011) reported that this ability differentiated Chinese children in Grades 3 and 4 with and without dyslexia and uniquely contributed to reading in the combined sample. In addition, orthographic working memory, measured using a delayed copying task (where children were briefly presented with unfamiliar characters and then asked to write them down from memory), was found to predict both word reading (Reference Chung, Ho, Chan, Tsang and LeeChung et al., 2011) and spelling (Reference Mo, McBride and YipMo, McBride, & Yip, 2018; Reference Wang, McBride-Chang and ChanWang et al., 2014) among kindergartners in Hong Kong.
9.5.5 Reading Comprehension
The simple view of reading model (SVR) proposes that reading comprehension is the cross product of two main components, decoding and listening comprehension (Reference Gough and TunmerGough & Tunmer, 1986; Reference Hoover and GoughHoover & Gough, 1990). Skilled decoding is defined by Reference Hoover and GoughHoover and Gough (1990) as the ability to “rapidly derive a representation from printed input that allows access to the appropriate entry in the mental lexicon” (p. 130), whereas listening comprehension refers to the ability to use phonological, semantic, syntactic, and discourse information to understand language (Reference Hogan, Adlof and AlonzoHogan et al., 2014). Although Chinese is represented by a logographic writing system, there is evidence supporting the SVR model in Chinese (Reference Ho, Zheng and McBrideHo et al., 2017; Reference Joshi, Tao, Aaron and QuirozJoshi et al., 2012; Reference Yeung, Ho, Chan and ChungYeung et al., 2016b). Since characters cannot be read through grapheme–phoneme correspondences, the decoding component in the SVR model is measured by character- and word-reading accuracy and fluency. As for listening comprehension, studies have measured children’s vocabulary knowledge, morphological awareness, morphosyntactic skills, and discourse skills (Reference Chik, Ho and YeungChik et al., 2012; Reference Yeung, Ho, Chan, Chung and WongYeung et al., 2013). Generally speaking, studies examining the SVR model in Chinese have found that decoding and listening comprehension explain a significant amount of variance in reading comprehension, confirming the applicability of the SVR model (Reference Ho, Zheng and McBrideHo et al., 2017;Reference Yeung, Ho, Chan and ChungYeung et al., 2016b; Reference Zhang, McBride-Chang and TongZhang et al., 2012). For example, in Reference Yeung, Ho, Chan and ChungYeung et al. (2016b), the best-fitting model with decoding and listening comprehension explained 83 percent of the variance in reading comprehension among Grade 1 children in Hong Kong, with decoding and listening comprehension accounting for 37 and 46 percent of the variance respectively.
As mentioned in the previous sections, research has examined the contribution of metalinguistic skills (morphological awareness, phonological awareness, and orthographic knowledge) to reading comprehension in Chinese. Studies have demonstrated that morphological awareness, including compound awareness and homophone awareness, contribute to both concurrent and longitudinal reading comprehension, even after controlling for phonological awareness and speed naming (Reference Tong, McBride-Chang, Shu and WongTong et al., 2009; Reference Xie, Zhang, Wu and NguyenXie et al., 2019; Reference Zhang, McBride-Chang and TongZhang et al., 2012; Reference Zhang, Lin, Wei, Anderson, Chen, Wang and YangZhang et al., 2014). Phonological awareness is also shown to play an significant role in reading comprehension among Chinese children (Reference Lau and ChanLau & Chan, 2007; Reference Ruan, Georgiou, Song, Li and ShuRuan et al., 2018; Reference Zhang, McBride-Chang and TongZhang et al., 2012; Reference Zhang, Lin, Wei, Anderson, Chen, Wang and YangZhang et al., 2014). Orthographic knowledge, especially knowledge of the semantic radical, is related to reading comprehension in Chinese due to its contribution to character meaning (Reference Ho, Ng and NgHo, Ng, & Ng, 2003; Reference Yeung, Ho and ChikYeung et al., 2011). In addition to metalinguistic skills, cognitive skills such as working memory have been found to predict reading comprehension among Chinese children (Reference Jing and LuJing & Lu, 2009; Reference Lu and ZhangLu & Zhang, 2007). Reference Jing and LuJing and Lu (2009), for example, observed that higher working-memory capacity was associated with better Chinese reading comprehension.
9.6 Neurocognitive Foundations
The unique features of Chinese orthography have intrigued neuroscientists for many decades. Researchers often use the comparisons between Chinese and English, or between character- and sound-based orthographic systems within Japanese and Korean, to understand the universality and cross-linguistic diversity made possible by the human mind (see also Rigatti et al., Chapter 12 in this volume).
There has been some disagreement in the field as to the extent to which Chinese speakers engage and develop the phonological network in the process of learning to read. An example of a phonological-awareness task is a rhyme-judgment task, such as the question “Do cat and hat rhyme?” In a milestone study of phonological awareness and dyslexia in Chinese, Reference Siok, Niu, Jin, Perfetti and TanSiok et al. (2008) used a rhyme-judgment task and found that Chinese-speaking children recruited left inferior and middle frontal gyrus (IFG/MFG) regions but did not significantly activate the left superior temporal gyrus (STG) regions, classically associated with phonological processing. Similarly, Reference Brennan, Cao, Pedroarena‐Leal, McNorgan and BoothBrennan et al. (2013) showed that only English speakers (and no Chinese speakers) showed a developmental increase in activation in the left temporal and parietal regions associated with phonological processes. Thus, literacy development and dyslexia in Chinese are indeed associated with the development of neural pathways for phonological processing.
Phonological development has also been found to be closely associated with morphological development. The neuroimaging task commonly used to study morphological awareness in Chinese and other languages is a semantic-relatedness task. For example, the words classroom–bedroom are morphologically related whereas classroom–mushroom are morphologically unrelated. Using this paradigm, Reference Liu, Tao and WangLiu, Tao et al. (2013) observed that only typically developing readers (and no children with dyslexia) showed stronger activation for related versus unrelated pairs in left inferior frontal regions. Interestingly, the magnitude of this activation was stronger in typical readers with better reading proficiency, but weaker in children with dyslexia with better reading proficiency. The authors interpreted the finding as suggesting that reading success in Chinese dyslexics is associated with whole-word rather than morphological deconstruction strategies. In other words, neuroimaging evidence suggests that Chinese speakers develop distinct neural mechanisms for whole-word recognition versus phonological as well as morphological word processing and that the latter two might be especially affected by dyslexia in Chinese (Reference Zou, Packard, Xia, Liu and ShuZou et al., 2019).
Importantly, Chinese characters are more visually complex than English words and their complexity may influence children’s neural organization for orthographic processing. Indeed, research evidenced that English-speaking children show stronger activation for line drawings than printed words in brain regions associated with orthographic processing, including occipitotemporal regions and Visual Word Form Area (VWFA). In contrast, Chinese learners show similar patterns of brain activity for both (Reference Krafnick, Tan and FlowersKrafnick et al., 2016). Furthermore, as Chinese children become better readers, they develop a stronger neural association between VWFA and brain regions supporting language (left Inferior Fusiform Gyrus, Supra-Marginal Gyrus) and handwriting (Exner’s area; Reference Li, Zhang and XiaLi et al., 2017). The findings are taken to support the idea that universally, learning to read is associated with the emergence of a tightly interconnected neural network that supports language in speech and in print (Reference Marks, Kovelman and KepinskaMarks et al., 2019). In other words, universally, learning to read is associated with the development of visual word processing regions as well as a tight interconnection between those regions and regions for spoken language processing. Specific to Chinese, there might be a tighter interconnection between neural processes for phonology and morphology as well as more extensive engagement of occipitotemporal regions and motor systems that support recognition and writing of characters (Reference Cao and PerfettiCao & Perfetti, 2016).
9.7 Environmental Factors Related to Chinese Literacy Development
Literacy environment in early childhood education differs across different regions in China. Following the “readiness” approach, educators in Mainland China believe that children need to be physically and neurologically ready for formal literacy education (Liang et al., 1997). As a result, formal literacy education only starts when children enter Grade 1 at age six (Reference Li and RaoLi & Rao, 2000). Nevertheless, young children are often exposed to informal literacy activities at home or other early-childhood-education settings. Chinese parents are usually heavily involved in creating home literacy environments (Reference Li and RaoLi & Rao, 2005). A survey showed that about 50 percent of Chinese households possessed 20 to 100 books for children, and most parents from urban households carried out shared book-reading activities with their children (Reference Zhu and YangZhu & Yang, 2003). Studies have found that informal literacy experiences at home, including shared book reading and storytelling, contribute to children’s vocabulary development (Reference Chen, Zhou, Zhao and DaveyChen et al., 2010; Reference Zhao, Zhou and ChenZhao, Zhou, & Chen, 2008). Educators in Hong Kong, on the other hand, believe that formal literacy education should start as early as possible. This formal approach focuses on character learning. Hong Kong children are introduced to formal literacy education upon entering kindergarten at age three (Reference Li and RaoLi & Rao, 2005).
Although the Chinese government has made continuous efforts to guarantee fundamental education among school-aged children, including implementing the nine-year compulsory educational system from 1986 onward, and investing 4 percent of its GDP in education (Reference ZhuZhu, 2018), the rural–urban literacy gap remains large in China (Reference Wang, Li and WangWang, Li, & Wang, 2018). For example, in Gansu province, 56.7 percent of students from rural regions did not pass the minimum literacy curriculum requirements, whereas only 4.7 percent of students from urban regions failed the requirements. Reference Wang, Li and WangWang et al. (2018) observed significant rural–urban gaps in literacy attainment in Grades 1, 3, and 5 among students from Shandong and Guizhou provinces. This literacy gap was mediated by parental education level and family literacy. A national survey conducted in 2010 showed that parents who resided in rural areas completed 6.3 years of education, compared to 9.5 years of education by those who resided in urban areas (Reference Zhang, Li and XueZhang, Li, & Xue, 2015). Moreover, parents from rural areas are less able to provide books and extracurricular activities for their children, and are thus unable to create an optimal home environment for literacy development (Reference Hu, Fang and LiuHu et al., 2018; Reference Wang, Li and WangWang et al., 2018; Reference Zhao and ShenZhao & Shen, 2010). In addition to home literacy environments, schools in rural areas are confronted with problems that hinder quality education. Schools are located in old or unsafe buildings, with outdated or no technology, and have limited curricular resources. Teachers in rural areas receive lower salaries than their colleagues in the city. As a result, teachers who work in rural schools tend to be less qualified and enthusiastic (Reference Yang, Yu, Zhao and LeiYang et al., 2011).
Migrant children represent another vulnerable group in China. With a large number of people migrating from rural areas to large cities to seek employment opportunities, their children face significant challenges in receiving proper education. Public schools in the city are typically only open to local residents. As a result, children of migrant workers either have to pay expensive fees to enroll in public schools, or attend private schools designated for nonresidents. The quality of education is poor in these private schools, and children are required to pay for their tuition, which brings a financial burden to their families (Reference Ren and ZhouRen & Zhou, 2019; Reference ShenShen, 2008; Reference Yang, Yu, Zhao and LeiYang et al., 2011). Studies have found the quality and continuity of education among migrant children are adversely affected by the instability caused by frequent moving, limited educational resources both at home and school, poor qualifications of teachers, and low expectations (Reference Yang, Yu, Zhao and LeiYang et al., 2011). Yet another group that faces challenges in receiving quality education is that of the “left-behind” children. As parents migrate from rural areas to seek work in cities, their children are often left behind to live with grandparents or other relatives (Reference Hu, Fang and LiuHu et al., 2018). Compared to migrant children in urban centers, left-behind children in rural areas have even fewer educational resources at home and, because of the rural setting, in school. They are also more likely to experience anxiety and depression due to the absence of their parents (Reference Fan, Fang, Huang, Chen and YuFan et al., 2018; Reference Hu, Fang and LiuHu et al., 2018; Reference Zhao and ShenZhao & Shen, 2010).
9.8 Conclusions and Discussion
To summarize, this chapter describes the writing systems, literacy education, and literacy development in East Asian countries. We focus on Chinese when we discuss literacy development because much less is known about this process in Japanese or Korean. Generally speaking, literacy development in Japanese and Korean shares many similarities with that of Chinese in that phonological awareness, morphological awareness, and orthographic knowledge have been shown to predict literacy skills in these two languages (see Reference Koda, Verhoeven and PerfettiKoda, 2017; Reference Wang, Cho, Li., Verhoeven and PerfettiWang, Cho, & Li, 2017 for reviews). However, because each language has unique features, the ways in which these aspects of metalinguistic awareness operationalize in Japanese and Korean are not identical to the ways they do so in Chinese. For example, with respect to morphology, both Japanese and Korean have well-developed inflectional and derivational systems (Reference Koda, Verhoeven and PerfettiKoda, 2017; Reference Wang, Cho, Li., Verhoeven and PerfettiWang et al., 2017), and as such, inflectional and derivational awareness have been shown to contribute to reading in Japanese (Reference Inoue, Georgiou, Muroya, Maekawa and ParrilaInoue et al., 2017; Reference Muroya, Inoue and HosokawaMuroya et al., 2017) and Korean (Reference Wang, Ko and ChoiWang, Ko, & Choi, 2009). In contrast, neither inflectional nor derivational awareness plays a major role in reading Chinese. On the other hand, compound awareness may be a significant predictor of literacy skills across the three languages, as all of them are rich in compounds. Although this relationship has been reported by a considerable number of studies in Chinese (e.g., Reference Chen, Hao, Geva, Zhu and ShuChen et al., 2009) and Korean (e.g., Reference McBride-Chang, Cho and LiuMcBride-Chang et al., 2005), empirical studies still need to be carried out in Japanese.
Indeed, each of the East Asian languages faces unique challenges in literacy acquisition. A major challenge for Chinese is the lack of grapheme–phoneme correspondences. Chinese children must memorize thousands of complex characters to become fluent readers. In addition, the large number of homophones in Chinese adds complexity. Beginning readers struggle with distinguishing homophonic morphemes both in oral language and reading. The Japanese language consists of two scripts, kana and kanji. The combined use of the two scripts makes learning to read a complicated task, as beginning learners must memorize three types of symbols (hiragana, katakana, and kanji) (Reference Koda, Verhoeven and PerfettiKoda, 2017). Learning to read Korean also possesses its own challenges. Although Korean is a highly transparent orthography, its orthography is nonlinear. Korean characters are arranged in syllable blocks in six different ways. The complex variation in its syllable-block patterns requires greater visual-spatial skills for reading and spelling than those required in Japanese (Reference McBride-Chang, Zhou and ChoMcBride-Chang et al., 2011; Reference Wang, Cho, Li., Verhoeven and PerfettiWang et al., 2017).
Regarding the neural bases of literacy in Japanese and Korean, research suggests that learners develop semi-independent neural pathways for the languages’ phonological and character-based writing systems. The neural development and processing of phonological systems closely mirrors those developed for English and other alphabetic languages. For instance, Reference Kita, Yamamoto and ObaKita et al. (2013) found greater recruitment of left superior temporal gyrus regions in adults than children while performing on phonological tasks in kana. Furthermore, children with developmental dyslexia showed less left activation in these regions than typically developing children. In contrast, kanji incurs greater engagement of inferior-temporal and VWFA regions associated with complex sound-to-print mappings and orthographic processes (Reference Coderre, Filippi, Newhouse and DumasCoderre et al., 2008; Reference Nakamura, Dehaene, Jobert, Bihan and KouiderNakamura et al., 2005; Reference Sakurai, Momose and IwataSakurai et al., 2000; Reference Thuy, Matsuo and NakamuraThuy et al., 2004). As in Japanese, comparisons between Hanja and Hangul in Korean also yield evidence of greater engagement of the visual neural systems (bilateral occipital and VWFA) during Hanja reading and greater engagement of the phonological neural systems (frontal and temporoparietal) during Hangul reading (Reference Cho, Kim and BaeCho et al., 2014; Reference LeeLee, 2004; Reference Yoon, Cho and ParkYoon et al., 2005; Reference Yoon, Cho and ParkYoon, Cho & Park, 2005). Thus, within-language comparisons between alphabetic and character-based reading systems in Japanese and Korean resemble findings obtained for cross-linguistic comparisons between English and Chinese, suggesting that the developing brain makes special adaptations for learning to read characters that are visually complex and more consistent in their meaning-to-print than sound-to-print mappings (see also Perfetti & Verhoeven, Chapter 11 in this volume).
The literacy rate in East Asia has improved significantly since the beginning of the last century. From 1910 to 2016, the adult literacy rate rose from less than 50 to 96 percent, whereas the youth literacy rate rose from 80 to close to 100 percent (UNESCO, 2016). A report from UNESCO in 2016 showed that the overall literacy rate in China was 96.4 percent, with 98.2 percent among males and 94.5 percent among females. Both South Korea and North Korea are reported to have a 100 percent literacy rate among both genders, and Mongolia also has a high literacy rate of 98 percent, with females having a higher literacy rate than males. The literacy rates of Japan and Taiwan were not included in the report, but Japan is generally believed to have a near-100-percent literacy rate, and the Ministry of Education of Taiwan reported a 98.87 percent literacy rate (Ministry of Education Taiwan, 2017). Research on literacy development in East Asian languages has turned into a rapidly growing field. Clearly, extensive research has been conducted on Chinese, but more research on other East Asian languages is urgently needed to inform theory and practice.
10.1 Introduction
Literacy educators in Australian schools work in the midst of conditions, opportunities, and challenges comparable to those facing their colleagues in many other settings. These include increasing cultural and linguistic diversity among students, communities, and workplaces, variable support from governments in fiscally unstable times, and continual professional and public debates over curriculum, pedagogy, and assessment, and over the role of research and policy. But Australian educators also encounter distinctive, and some at least distinctively inflected historical, cultural, and economic features that bear on their literacy efforts.
To background our discussion of those efforts, we open with a selection of Australia’s demographic and administrative characteristics. We then describe the less-frequently discussed challenges and opportunities presented to research, practice, and policy by educational engagements with Aboriginal and migrant communities, and the often noteworthy, but generally patchy track record of achievements in literacy and language education arising from those engagements. We advance some lessons that this track record offers on literacy’s relationship to community languages, to pedagogy, to policy formation and maintenance, and to research. We summarize international perspectives on Australian literacy education, including those based on national and international assessment programs, discuss the varied history of research traditions that have both informed and divided the field of literacy education in Australia, and conclude with some observations about the research, policy, and media environments in which literacy is an object of policy, inquiry, and public anxiety.
A selection of features of Australia that provide some background to the following discussion is shown in Table 10.1. We can draw some general inferences: Australia is a large and sparsely populated country, so many Australian schools operate in remote areas or in regions that are far away from the centers of educational policy direction and institutes of teacher education; in general, Australian society is comparatively affluent and moderately equitable; and Australians generally attend senior high school, and many have tertiary qualifications, suggesting a general belief in institutionalized education.
Table 10.1 Some demographic features of selected countries
| Australia | Brazil | Canada | Germany | Japan | OECD mean | |
|---|---|---|---|---|---|---|
| Area (m km2) | 7.7 | 8.5 | 10 | .4 | .4 | 1 |
| Population (m) | 25 | 209 | 38 | 83 | 127 | 35 |
| Per-capita productivity (Adj. US $k) | 55 | 17 | 52 | 50 | 47 | 43 |
| Equity (GINI) | .33 | .54 | .31 | .29 | .34 | .33 |
| Urbanization (%) | 86 | 87 | 81 | 77 | 92 | 68 |
| Population density / sq km | 3 | 25 | 4 | 208 | 317 | 35 |
| Mean years schooling | 12.7 | 7.8 | 13.3 | 14.1 | 12.8 | 12.4 |
| ~% with tertiary qualifications | 44 | 17 | 55 | 30 | 52 | 36 |
There are three types of schools in Australia. In 2019, 67 percent of Australian school students attended government-run schools, 19 percent attended Catholic schools, and 14 percent attended independent schools, many affiliated with religious organizations. Catholic and independent schools are accountable to government-mandated curriculum policies, and are funded, to varying degrees, by contributions from government and parents. The implications of these funding arrangements for equity and quality have long been matters of debate among economists and educationists (see, e.g., Reference Bonnor and ConnorsBonnor & Connors, 2018; Reference Connors and McMorrowConnors & McMorrow, 2015; Reference GonskiGonski, 2011). Assessments of the literacy capabilities of students have figured prominently in these debates.
The functions of government in Australia are divided between federal, state, and local bodies. Traditionally, it is states that take responsibility for school policies and curriculums. Beginning in 2008, however, the Australian government created the Australian Curriculum, Assessment and Reporting Authority (ACARA) to develop and implement a national curriculum. Literacy appears in three places in ACARA’s curriculum: as a strand in the Foundation year (prior to Year 1 of formal schooling) to Year 10 English curriculum (the other two strands are “language” and “literature”); in a national program of standardized tests of literacy and numeracy (NAPLAN); and as one of the seven “General Capabilities” to be applied across all curriculum areas (e.g., numeracy and information and communication technology capability). In addition, ACARA further stipulates three ‘Cross-Curriculum Priorities’: sustainability, Asia and Australia’s engagement with Asia, and Aboriginal and Torres Strait Islander histories and cultures. We turn to two of these “cross-curriculum” accountabilities and to their implications for the teaching and learning of literacy.
10.2 Australian Aboriginal Languages and Literacy
10.2.1 History of Aboriginal Culture and Languages
The first European visitors to the Australian continent were Dutch, and the European name for the continent from about 1620 until well into the 1800s was New Holland. One of the earliest British maps of New Holland was made in 1790, two years after the British settlement at Port Jackson. The map shows details of the geographical features and European settlements of the coastal and an empty interior. The British administration was aware of the significant Aboriginal presence on the continent, but nonetheless deemed it to be “terra nullius” – “nobody’s land” – a legal mechanism that afforded lawful annexation and settlement, and that declared, effectively, that whatever it was that the new settlers were doing, they were not invading (Reference Goot and RowseGoot & Rowse, 2007).Footnote 1
Evidence from archaeology and genetics (e.g., Reference Clarkson, Smith and MarwickClarkson, Smith Marwick et al., 2015; Reference Malaspinas, Westaway and MullerMalaspinas, Westaway, Muller et al., 2016) indicates that, beginning about 60,000 years before the visitors arrived from Europe, the first Australians crossed from the Sunda Peninsula, later to become the Indonesian archipelago, into Sahul, a single continent subsuming what are now mainland Australia, Tasmania, and Papua New Guinea. Genetic research suggests that these first Australians traveled around the coast in both directions with surprising rapidity, filled the interior, and then largely remained in situ; the gene-flow picture of Aboriginal Australia is one of remarkable stability (Reference Malaspinas, Westaway and MullerMalaspinas, Westaway, Muller et al., 2016).
The tentative coastal outlines of the earliest maps made by Europeans provide the initial impressions of outsiders peering into a continent from the edge. For the most part the travelers and settlers who followed them over the next century inherited the restricted gaze of the newcomer, literally unable to see beyond their coastal settlements, and metaphorically unable to see the locals’ unfamiliar social organizations, or their sophisticated systems of land tenure, religious belief, and cultural practice. As for talk and inscription, effectively, what was heard across the land in 1788, and for a long time afterwards, was lingua nullius, nobody’s voice. Two centuries after settlement we now understand that, throughout Australia, Aboriginal people had developed thriving cultures, and filled the continent with at least 250 different languages, each as sophisticated as all other human languages. Figure 10.1 shows linguists’ and historians’ best current mapping of the regions and languages of Australia in 1788.

Figure 10.1 Aboriginal languages map, Australian Institute of Aboriginal and Torres Strait Islander Studies, AIATSIS, Reference HortonHorton (1996)
This map attempts to represent the language, social or nation groups of Aboriginal Australia. It shows only the general locations of larger groupings of people, which may include clans, dialects, or individual languages in a group. It used published resources from 1988 to 1994 and is not intended to be exact, nor the boundaries fixed. It is not suitable for native title or other land claims.
This map shows the extraordinary linguistic diversity and complexity evident on the continent before the European arrival. For tens of thousands of years, the first Australians needed to be competent in several languages in order to communicate and intermarry with neighboring communities, and to accommodate additional language expectations among their children (Reference ClyneClyne, 2005, Reference Clyne, Jupp and Clyne2011; Reference Clyne, Jupp and ClyneJupp & Clyne, 2011). Recent research suggests that the stability of populations, the development of rich narrative cultures, and culture-specific mechanisms of intergenerational transmission, have combined to make Australian Aboriginal people the custodians of the world’s oldest orally transmitted memories, recording, for instance, late-Holocene inundations of the continental shelf that occurred about 10,000 years ago (Reference Nunn and ReidNunn & Reid, 2016), a narrative feat of human memory probably unparalleled on other continents.
In his encyclopedic history of writing, Fischer defined it as “the sequencing of standardized symbols (characters, signs or sign components) in order to graphically reproduce human speech, thought and other things in part or whole” (Reference FischerFischer, 2001, p. 12). For over 50,000 years Aboriginal Australians have produced inscriptions that depicted land features, origin myths, and ideas about land, ancestors, social organization, customs, and moral responsibilities. While not representing speech phonemically, they used painting and sculpture on rocks, wood, and leaves, employing symbols that retained similar meanings over long periods of time within and across regions (e.g., Reference TaylorTaylor, 1996). Depictions of animals that were extinct almost 40,000 years ago have been discovered, as have paintings of the arrival of ships, presumably from Europe less than a few hundred years ago (Reference Kleinert and NealeKleinert & Neale, 2000).
These rich precolonial linguistic assets of Australia, however, were quickly lost. Estimates vary, but the Australian Aboriginal population prior to the arrival of the British settlers seems to have been between 500,000 and 750,000. Since then, as Reference BurnleyBurnley (1988) pointed out,
whatever the actual population level before 1788, the Aboriginal population was decimated with European contact through mortality from diseases which Europeans brought with them, from starvation resulting from dislocation of traditional man-habitat relations, with malnutrition rendering Aborigines more susceptible to contagious diseases, and deaths from conflict with colonial police and settlers. It is estimated that, by 1891, the Aboriginal population had fallen to 40,000 persons, and even by 1981 there had been a recovery to only some 170,000 persons.
Most estimates are that the Aboriginal population on the continent returned to precolonial levels only after about 220 years. But by 2018, of the 250 languages of 1788, more than 100 had become extinct, about 130 were critically endangered (spoken only by the oldest generations and no longer learned by children), and only 13 were currently being learned as first languages by children (AIATSIS, 2019). Those thirteen languages are often classed, in Australia, as “healthy,” using “intergenerational language transmission” as a diagnostic of “health”; but crucially, all thirteen, at the time of writing, fail to meet most of the other key diagnostic factors employed in UNESCO’s Language Vitality and Endangerment report (UNESCO, 2003) for determining language vitality – in particular, “absolute number of speakers” and “proportion of speakers existing within the total (global) population.” They can, therefore, be accurately classified as “critically endangered.”
Researchers have documented grammars, dictionaries, and collections of texts in most of the languages still spoken (Australian Research Council Centre of Excellence on the Dynamics of Languages, e.g., Reference Simpson, McConvell, Thieberger, Arthur and MorphySimpson, McConvell, & Thieberger, 2019; Reference SimpsonSimpson, 2019; Reference Eades, Koch and NordlingerEades, 2014). A rich understanding has emerged of historical relationships within the “Australian language family” (Reference Bowern and KochBowern & Koch, 2004; Reference SimpsonSimpson, 2019). Theoretical linguists around the world have long mined the richness and complexity of Aboriginal languages in pursuing answers to theory-driven questions about the nature and limits of human language in general (e.g., Reference Evans and SasseEvans & Sasse, 2002; Reference Koch and NordlingerKoch & Nordlinger, 2014).
For much of the last two centuries Aboriginal people and their languages were largely ignored. White Australian nation building advanced on the assumption that Aboriginality would be absorbed and assimilated into the new Anglo-Australia. Instead, we now find a vibrant and growing Aboriginal population across Australia, ranging from metropolitan, urban living people to those living in rural and remote locations, speaking one or more of the following languages and/or language varieties:
Traditional Aboriginal languages, of which about 130 are still spoken (Reference Purdie, Frigo and OzolinsPurdie et al., 2008; Reference SimpsonSimpson, 2019);
Standard Australian English, a descriptor used for a variety of English spoken by most Australians (Reference Collins, Peters, Kortmann and SchneiderCollins & Peters, 2004);
Aboriginal English, a nonstandard variety of English, usefully conceived of as a continuum ranging from light acrolectal varieties (closer to standard), with only subtle differences from Standard Australian English, to heavy basilectal varieties that are closer to creoles (Reference Kaldor, Malcolm and RomaineKaldor & Malcolm, 1991; Reference Eades and RomaineEades, 1991);
One of two creole languages, Kriol and Broken, largely English-lexified, but with substrate influence from Aboriginal languages (Reference Harris and SandefurHarris & Sandefur, 1984).
10.2.2 Aboriginal Literacy and Schooling
Despite the obvious cultural importance of Aboriginal languages to the identity of modern Australia, there has generally been little provision or sustained political support for the learning of Aboriginal languages by non-Aboriginal Australians (Reference Oldfield, Lo Bianco, Rennie and HarperOldfield & Lo Bianco, 2019; Reference SimpsonSimpson, 2019). As we outline below, additional language learning in Australian schools, for most of the last century, has remained mostly focused on French, German, Italian, Japanese, Indonesian, and Chinese. Only since 2006 has there been an effort to teach Aboriginal languages in public schools. As a result, in 60 target schools in New South Wales, for instance, about 5,000 primary and secondary students, of whom two thirds are non-Aboriginal, were learning an Aboriginal language in 2008 (Reference Purdie, Frigo and OzolinsPurdie et al., 2008), with recent increases to around 7,000 in 2018.
In 2019, of the top fifteen non-English languages learned in New South Wales schools, three were Aboriginal languages (NSW Department of Education, 2019). At the national level, the Australian curriculum includes language-specific curricula for so-called “world” languages, and a Framework for Aboriginal Languages and Torres Strait Islander Languages (ACARA, 2016a, b; Reference DisbrayDisbray, 2019; Reference Simpson, Disbray and O’ShannessySimpson, Disbray, and O’Shannessy, 2019; and see First Languages Australia, 2020), which aimed to increase students’ learning of Aboriginal and Torres Strait Islander languages. By 2008 there were 16,000 Aboriginal students and 13,000 non-Aboriginal students in 260 Australian schools participating in Aboriginal language and literacy programs (Reference Purdie, Frigo and OzolinsPurdie et al., 2008). These programs ranged from bilingual programs to second-language-learning programs to revival and language-awareness programs. Here we focus on the history of bilingual education and the use of creoles and Aboriginal English in schools, before turning to literacy outcomes.
There were sporadic attempts through the 1800s, often by missionaries, to teach Aboriginal children through the use of their own languages, notably Kaurna, Diyeri, and Arrernte (Reference Gale, Hartman and HendersonGale, 1994). Up until the 1970s, however, most Aboriginal children were educated in English-only schools, and faced the task of acquiring literacy skills in a language other than their mother tongue. The 1970s saw the introduction of bilingual education in about twenty communities, mostly in the Northern Territory, and typically in public schools (Reference DevlinDevlin, 2009; Reference Gale, Hartman and HendersonGale, 1994). These were transitional programs, intended to introduce literacy and numeracy using the child’s first language and then to transfer those skills to English, via graduated increases, across each school year. All of these programs explicitly nominated English literacy, rather than traditional language maintenance, as their immediate goal (Reference Gale, Hartman and HendersonGale, 1994). They exemplify what Reference Baker and WrightBaker and Wright (2017, Reference Reid and SenguptaReid, 2010) described as the “subtractive” model of bilingualism, in which the first language gradually disappears.
Bilingual schooling of Aboriginal children in Australia has a troubled history. Funded by the Australian government but administered by the Northern Territory’s Education Department, the scheme’s support from governments has vacillated. As a scheme affecting only a relatively small number of students, its rationale and details have often been poorly articulated and understood, including by many of those who have made decisions about its direction and funding. Administrators of bilingual education have often failed to understand that learning an Aboriginal language, like learning any additional language, complements rather than hinders developing proficiency in English (Reference Simpson, Caffery and McConvellSimpson, Caffery, & McConvell, 2009). Critically, support for bilingual education never fully embraced the principle that children learning English as an additional language (EAL) need to be taught by EAL-trained teachers (Reference NichollsNicholls, 2005), preferably bilingual teachers who understand the processes entailed in additional language learning (Reference EllisEllis, 2016). Nationally standardized English literacy assessments for children in bilingual schools have failed to assess students’ first-language literacy. Further, evidence that these students were performing at levels lower than nonbilingual schoolchildren in Standard Australian English literacy testing has regularly been used to discredit the scheme by those seeking to reduce its funding (Reference Simpson, Caffery and McConvellSimpson et al., 2009).
Bilingual schools, mostly in remote locations, have struggled to find enough appropriately trained first-language-speaking teachers, have been frequently staffed by non-Aboriginal teachers whose professional training did not prepare them specifically for bilingual classroom practices, and have experienced levels of teacher turnover far higher than mainstream schools (Reference Simpson, Caffery and McConvellSimpson et al., 2009). Despite high levels of multilingualism and oral literacy, the parents of most children in bilingual schools have low levels of written literacy themselves, and, for many children in these remote communities, books and writing play no role in their lives outside of school. Since 2008 the Northern Territory Education Department has mitigated its involvement in a bilingual approach by reintroducing a “Talk English” focus and calling on bilingual schools to focus on English literacy for the first four hours of each school day. Some bilingual programs have complied while others have ignored the department’s directive and insisted on maintaining a “two-way education” balance. In these latter cases, the general aim has been to value both languages equally (Reference DevlinDevlin, 2009; Reference Sellwood and AngeloSellwood & Angelo, 2013). There are promising aspects of this story, with some individual bilingual schools achieving excellent results in the national English literacy tests, the only measure for literacy outcomes available. But bilingual and biliterate education for Aboriginal Australia has a history of policy somersaults and fluctuating levels of funding, support, and commitment.
Most Aboriginal children speak Standard Australian English, Aboriginal English, or a creole variety, whereas the bilingual programs described above cater to only the minority of Aboriginal children who speak an Aboriginal language as their first language. There is clear evidence that Aboriginal English and the two creole varieties, Kriol and Broken, while predominantly English-lexified, are distinct from Standard Australian English. The degree of distinctiveness is greater in the case of the creoles, which in their “heavier” forms are not mutually intelligible. At the acrolectal end of the Aboriginal English spectrum, the lexical, grammatical, and phonological differences from Standard Australian English are comparatively minor (Reference Kaldor, Malcolm and RomaineKaldor & Malcolm, 1991). But a range of more subtle pragmatic differences, ranging from forms of knowledge organization (Reference SharifianSharifian, 2005) to culturally significant ways of using silence and eye contact and to methods of eliciting information through questioning techniques (Reference Eades and RomaineEades, 1991) still create difficulties in communication between Standard Australian English and Aboriginal English speakers.
Apart from a single Standard Australian English–Kriol bilingual program that ran at one school in the 1980s, there has been little use of either creoles or Aboriginal English as mediums of education in Australia. Due to the apparent similarities of these languages with Standard Australian English, speakers of the creoles and Aboriginal English are typically not identified as learning Standard Australian English as an additional language (Reference Wigglesworth, Billington and LoakesWigglesworth, Billington, & Loakes, 2013). A history of attitudes that characterize Aboriginal English as “bad English,” held by both teachers and speakers of Aboriginal English, has further functioned to make Aboriginal English unacceptable as a language of instruction in many community schools. Because Standard Australian English is widely associated with vocational advantage (Reference Disbray and LoakesDisbray & Loakes, 2013), and because there is a continuum of creole-to-Aboriginal English varieties that makes it difficult to choose one language variety over another for schooling purposes (Reference SiegelSiegel, 1999), Standard Australian English has remained unchallenged as the language of both instruction and assessment in Australian schools.
10.2.3 Aboriginal Literacy Outcomes
Aboriginal children in remote communities are outperformed on standardized literacy tests across all English literacy skills by non-Aboriginal children in metropolitan centers (ACARA, 2017). According to the Closing the Gap report (Australian Department of Prime Minister and Cabinet, 2015), school attendance rates have been as low as 14 percent in some remote schools, and in 2014 only 34 percent of Aboriginal students in remote communities met the national minimum standard for Year 7 reading. Similar findings come from the 2017 NAPLAN results: 25 percent of students in remote parts of Australia are achieving at or above minimum standards for reading in Year 3, increasing only to 27 percent in Year 9 (ACARA, 2017). In the “very remote” geographical location category, only 15 percent are at minimum standard by Year 9; and over 80 percent of Aboriginal students across the Northern Territory achieved below the minimum standard for Year 3 reading, spelling, grammar and punctuation, results that are lower than preceding years (ACARA, 2017).
The Programme for International Student Assessment (PISA 2012) report showed a 2.5–3-year gap between non-Aboriginal and Aboriginal literacy rates in Australia (Reference Thomson, De Bortoli and BuckleyThomson, De Bortoli, & Buckley, 2012). Similarly, the Progress in International Reading Literacy Study (PIRLS 2016), drawing on data from fifty countries, points to significant literacy gaps between Indigenous and non-Indigenous Australians: “Australia’s Aboriginal and Torres Strait Islander students attained an average score of 483 points, which was 67 points lower than the average score for non-Indigenous students … In 2016 … students with an Aboriginal or Torres Strait Islander background had almost four times the odds of being a poor reader compared to non-Indigenous students” (Reference Thomson, Hillman, Schmid, Rodrigues and FullartonThomson et al., 2017). Findings such as these have been used by successive governments to criticize bilingual education, and to justify the shift of resources to developing English-only literacy skills. Australian linguists and literacy specialists have noted that the real issue is “the cost and complexity of lifting both performance standards and attendance rates across remote schools. Bilingual education is a decoy” (Reference DevlinDevlin, 2010, p. 3). The recent removal of bilingual programs in many areas has not yielded any increase in English literacy levels.
Those schoolchildren speaking Indigenous forms of English and creoles have also long been recognized to be disadvantaged (Reference Hudson and Taylor-HenleyHudson & Taylor-Henley, 1995), and their failure to achieve expected outcomes, especially in literacy, is well documented (OECD, 2011; Reference SharifianSharifian, 2001; Reference Wigglesworth, Billington and LoakesWigglesworth et al., 2013). Prominent among the drivers of disadvantage are structural differences between Aboriginal English and Standard Australian English, such as:
gender undifferentiated third singular pronoun “ee”;
hypercorrective initial “h” as in “huncle Henry”; and
zero copula usages like “ee gone.”
Such grammatical differences are routinely interpreted by speakers of Standard Australian English as “errors,” and can result in teachers overlooking demonstrated content knowledge (Reference DixonDixon, 2013; Reference Wigglesworth, Simpson and LoakesWigglesworth, Simpson, & Loakes, 2011).
A meaningful response to the challenges and opportunities involved in engaging Aboriginal Australian school students will emerge when the current invisibility of Aboriginal English and creoles in Australian education systems is recognized. Reference MurtaghMurtagh (1982) assessed the single Kriol bilingual program and found that explicit teaching of, and in, both languages resulted in increased oral proficiency in both English and Kriol (Reference MurtaghMurtagh, 1982, cited in Reference SiegelSiegel, 1999, and see the collection of studies in Reference Rennie and HarperRennie & Harper, 2019). Similarly, various researchers have pointed out that the directions that will help the Australian schooling system address the disadvantage that Aboriginal students currently experience include: teaching that explicitly addresses the differences between Standard Australian English and the students’ own variety, be it a creole, Aboriginal English, or a traditional Aboriginal language; teaching that understands and reinforces the contextual appropriateness of each (e.g., Reference Shinkfield, Jennings, Rennie, Harper, Bianco and WileyShinkfield & Jennings, 2019); and teaching that supports students in learning Standard Australian English as an additional variety (e.g., Reference Sellwood and AngeloSellwood & Angelo, 2013; Reference SiegelSiegel, 1999; Reference Wigglesworth, Billington and LoakesWigglesworth et al., 2013).
To summarize, the subtractive focus of bilingual education, the overlooking of creoles and Aboriginal English as varieties to be used in school, and the unfounded suspicion that the teaching of traditional languages, creoles, and Aboriginal English is incompatible with English literacy acquisition, have together contributed to a large gap between the literacy outcomes of Aboriginal and non-Aboriginal Australians. An acknowledgment of the language and literacy resources and needs of Australia as a country calls for a much more nuanced reaction to the realities of European–Aboriginal history, rather than the apathy, tokenism, and capricious educational and social policies that have characterized much of Anglo-Australia’s reaction for generations.
10.3 Community Languages and Literacy
10.3.1 Historical Perspectives
Analogous patterns in practice and policy arise in any consideration of community and migrant education in literacy. British colonials arriving in Australia promoted the norm of English monolingualism and monoliteracy as both a gift and an instrument of empire (Reference Clyne, Jupp and ClyneClyne, 2011; Reference EllisEllis, 2008). The expectation that English would be the national language was such that the need has never been felt to declare an official language for Australia: English is the language of politics, law, education, and of everyday social life more broadly, and so the de facto national language.
The history of Australian migrant settlement, however, tells a different story. Apart from the original hundreds of Australian Aboriginal languages described above, significant numbers of the earliest migrant settlers spoke Irish, Gaelic, and Welsh as first languages, and during the nineteenth century settlers came from across Europe and Asia, attracted by discoveries of gold and readily available land. There were many urban and rural communities that used spoken and written languages other than English (Reference Clyne, Jupp and ClyneClyne, 2011). Multilingual and bilingual educational activities were more prevalent in the nineteenth century than at any other time in Australia’s history. Many migrant communities used their languages for everyday and business purposes, and to teach their children in schools (Reference Lo Bianco and SlaughterLo Bianco & Slaughter, 2009).
During the seven decades following the First World War, a period in which the population of Australia grew from about 5 to 14 million, the use of languages other than English was considered undesirable, and their active usage decreased. The dominant political and social paradigm was “integration,” a project to which the learning of English was seen as central. Over this period waves of large-scale immigration to Australia from nations across Europe, the Middle East, and Asia brought a wide range of languages and cultures, but these migrants were actively encouraged to learn English, and discouraged from using their own languages, even in their homes (Reference Clyne, Jupp and ClyneClyne, 2011; Reference Lo Bianco and SlaughterLo Bianco & Slaughter, 2009).
The large influx of migrants to Australia that followed the Second World War led to efforts to link migration with English literacy capability, and thereby to Australia’s most consequential language policy instruments, the Adult Migration Education Program and the subsequent 1969 Child Migrant Education Act. Via these, a national policy of teaching English to all children was systematically enacted (Reference Hajek and SlaughterHajek & Slaughter, 2014). Additional language education practices “favoured choices and methods of instruction dictated by attachment to the western canon of literary prestige, principally for reading and cultivation rather than active use” (Reference Lo Bianco and SlaughterLo Bianco & Slaughter, 2009, p. 15). So French and German, as well as Latin and Classical Greek, as languages of literature and academic prestige, were popular in elite schools and universities. There was little effort to promote or retain the use of active community languages (e.g., Modern Greek, Italian, German, Chinese, Polish, Turkish, Lithuanian), despite the substantial communities of migrants for whom these were first languages.
Since the late 1970s overseas military and political conflicts have led to a surge in immigration from southern Asian nations (e.g., Vietnam, Cambodia, East Timor, and China), and stimulated the emergence of a more pluralistic cultural policy. Australians developed an image of their nation as a “multicultural” nation, but nonetheless monolingual (Reference Clyne, Jupp and ClyneClyne, 2011), celebrating this image in the popular media and in policy (Reference Hajek and SlaughterHajek & Slaughter, 2014). It is a self-representation that has persisted to the present and is frequently announced to the global community as an example of the peaceful nature of such multicultural identity building. It ignores, however, the multilingual or plurilingual possibilities that arise from such diversity.
By the late 1980s increasing support for learning the languages of neighbors and new trade partners, the balance of which had shifted to Asia from Britain following Britain’s accession to the Common European Market, was beginning to take hold in schools and universities (Reference Hajek and SlaughterHajek & Slaughter, 2014; Reference Lo Bianco and SlaughterLo Bianco & Slaughter, 2009; Reference Morgan, Kohler and HarbonMorgan, Kohler, & Harbon, 2011). The Federal Government began to implement policies promoting and supporting Asian language studies. Japanese surpassed French as the most studied additional language, and Chinese, Indonesian, Japanese, and Korean were promoted as priority languages (Reference HarringtonHarrington, 2012).
The study of “community” languages (Reference ClyneClyne, 2005) was pushed out of mainstream schools into “community” or “ethnic” schools operating outside of school hours. Community groups tried to maintain heritage languages and cultures by running these schools. Despite pressures to reduce the use of heritage languages, by 2018 there were about eighty languages offered by the Ethnic Schools Association for students from Foundation to Year 10 and over forty languages at Years 11 and 12. These were offered across all states and territories, with almost 120,000 students participating in over 1,400 venues (Australian Federation of Ethnic Schools, 2016; Community Languages Australia, 2019; Migration Heritage Centre, NSW, Powerhouse Museum, n.d.; Reference Scrimgeour, Morgan, Cruikshank and HajekScrimgeour et al., 2019). Such practices remained politically and professionally marginalized, operating principally through “Saturday schools,” and attracting little political or media recognition. In 2019 an effort was made to formalize these community provisions and to begin a process of educationally credentialing the community members doing the teaching work, via the creation of the Sydney Institute for Community Language Education (SICLE, n. d.). The Institute’s initiatives include introducing community languages into mainstream primary schools, with programs in nine community languages – Arabic, Assyrian, Chinese, Greek, Hindi, Korean, Macedonian, Tamil, and Turkish – and the development of full syllabuses for New South Wales schools in Hindi, Macedonian, Persian/Dari, Punjabi, and Tamil. Over 400 languages are spoken in homes and communities across Australia (Australian Bureau of Statistics (ABS), 2016a; Reference Scrimgeour, Morgan, Cruikshank and HajekScrimgeour et al., 2019; Reference Slaughter, Hajek, Hajek and SlaughterSlaughter & Hajek, 2014). No current data exist on levels of written literacy for these languages, however, and children commencing school who are fluent in spoken community languages vary substantially in how well they read and write in those languages.
There has been a gradual acknowledgment of multilingualism and its value for literacy generally (see Reference Wilks-SmithWilks-Smith, 2017), and multicultural policies to promote cultural diversity exist at all levels of government. The prevalent message of the media, and of populist political comment in relation to literacy capability, however, remains firmly focused on English. The view is that English literacy, assessed through standardized testing programs, remains key to Australia’s economic success, and should therefore be the educational imperative. In some jurisdictions it occupies, by policy mandate, the prime teaching time in elementary schools, in so-called “literacy blocks” each morning. This is at the expense of learning areas such as additional languages, or other subjects taught through additional languages.
Australia’s history indicates that it is one of the world’s major immigrant nations, with over 7.5million settlers since 1945 in a national population of about 26 million (Reference Phillips and Simon-DaviesPhillips & Simon-Davies, 2016). The estimated overseas-born population in 2016 was 28.6 percent, with a further 21 percent having at least one overseas-born parent (in total, half the population), a rate considered high compared to those of other OECD nations (ABS, 2016a; Reference Phillips and Simon-DaviesPhillips & Simon-Davies, 2016). It is therefore a prime site for historical analyses of immigrant processes, and for educational research and development relating to the teaching and learning of language and literacy.
Historically, most migrants have come to Australia from Europe, but there are increasing numbers from Asia. Of the 189,700 migrants arriving in 2016–2017, around 21 percent were from India, 15 percent from China, 6.3 percent from the Philippines, 3.5 percent from Pakistan, and 3 percent each from Vietnam and Nepal. China and India, both at about 8 percent, now rank highest as Australians’ countries of birth after the UK and New Zealand (ABS, 2016b). Many of these immigrants are first-generation Chinese and Indians. Table 10.2 summarizes Australian ancestry data, showing high rates of first-generation Chinese (74.3 percent) and Indian (79.8 percent) citizens, who bring their first languages with them and who also have large existing communities of speakers.
Table 10.2 Selected characteristics of ancestor groups in Australia, 2011 census (ABS, 2016b). Note that tallies may exceed 100 percent, as respondents can indicate more than one category
| Ancestry | Generations in Australia | ||||
|---|---|---|---|---|---|
| Persons ‘000 | Of total population % | First generation % | Second generation % | Third-plus generation % | |
| English | 7,236 | 36 | 19 | 20 | 61 |
| Australian | 7,099 | 35 | 2 | 18 | 80 |
| Irish | 2,088 | 10 | 13 | 14 | 73 |
| Scottish | 1,793 | 9 | 17 | 19 | 64 |
| Italian | 916 | 5 | 24 | 41 | 35 |
| German | 899 | 5 | 17 | 20 | 63 |
| Chinese | 866 | 4 | 74 | 21 | 4 |
| Indian | 391 | 2 | 80 | 18 | 2 |
| Greek | 378 | 2 | 31 | 45 | 24 |
| Dutch | 336 | 2 | 36 | 43 | 24 |
Humanitarian migration for refugees and others who cannot return to their country of origin currently accounts for an average of around 14,000 people a year (out of 60,000–70,000 annual applications). These come from a range of countries, with an additional 12,000 from the ISIS conflict for the year 2015–2016 (Australian Government, Department of Immigration and Border Protection, 2016a, 2016b). While some of the 14,000 or so in the standard program were currently, controversially, housed offshore, their needs remained the responsibility of the Australian government. These needs entail the maintenance of education and health, and communication in their own languages. While these refugee numbers are low in terms of the overall Australian population, their linguistic and cultural diversity contributes significantly to the complexity of the educational challenges facing Australian language and literacy educators.
10.3.2 Mainstream Literacy, Multilingualism, and Schooling
Recent research from a variety of sources – magnetic resonance imaging, psychological and cognitive testing, literacy testing at national and international levels, and across a range of curriculum areas – together indicates that bilingual or multilingual capacity is a significant aid to improved literacy outcomes (see also Nakamura & Holla, Chapter 8 and Schwartz, Chapter 19 in this volume). As well as establishing the benefits in personal, cognitive, academic, and social domains, many studies have identified language use and general literacy benefits from bilingual education (e.g., ACARA, 2014; Reference AlbanAlban, 2016; Reference Bak, Nissan, Allerhand and DearyBak et al., 2014; Reference Baker and WrightBaker & Wright, 2017; Reference BialystokBialystok, 2014; Reference BialystokBialystok, 2016; Reference Bialystok, Poarch, Luo and CraikBialystok et al., 2014; Reference Clyne, Hunt and IsaakidisClyne, Hunt, & Isaakidis, 2004; Reference DelistratiDelistrati, 2014; Reference PinterPinter, 2015; Reference Rubio-Fernández and GlucksbergRubio-Fernández & Glucksberg, 2012). These benefits include increased communicative capacity, including alternate expression in both (or all) languages; increased engagement in moving across languages, and agility in lexical choice; increased literacy skills in first and additional languages; equivalent or better performance in standardized literacy and numeracy tests; enhanced understanding of symbolic representation of print; and enhanced sense of identity and self-esteem (Reference Morgan, Scrimgeour, Farmer, Dodd and SaundersMorgan et al., 2016).
Despite these identified benefits, policymakers’ remedy of choice for any apparent shortcomings in literacy standards has generally been to increase time allocations to English literacy instruction. This view compounds the challenges presented by such a linguistically and culturally diverse nation, where learners need to engage with a globalized, multilingual and “super diverse” world (Reference VertovecVertovec, 2010).
The challenges for educators, including literacy researchers, are to increase awareness of the benefits of a bilingual or multilingual approach to literacy in mainstream schooling, to address the needs of an increasingly diverse population, and to give recognition to Aboriginal and migrant populations and their language and literacy needs that go beyond English. As we have seen, assessment results for Aboriginal students in English literacy testing remain low and are compounded by social history and lack of access to learning in their first languages in the critical first few years of schooling. This situation, however, is not reflected in migrant communities: Results from the national assessment program, NAPLAN, regularly show a consistent advantage for students from non-English-speaking backgrounds (termed ‘Language background other than English’ [LBOTE] in these tests). These students or their parents are born overseas. Table 10.3 summarizes the 2019 results.
Table 10.3 Mean (rounded) literacy-related scores for Years 3, 5, 7, and 9 on the National Assessment Program in Literacy and Numeracy (NAPLAN) 2019 results
| Student group | Year 3 | Year 5 | Year 7 | Year 9 | ||||
|---|---|---|---|---|---|---|---|---|
| LBOTEFootnote * | AUSTFootnote ** | LBOTE | AUST | LBOTE | AUST | LBOTE | AUST | |
| Reading | 436 | 432 | 506 | 506 | 548 | 546 | 582 | 581 |
| Writing | 431 | 420 | 483 | 471 | 521 | 511 | 554 | 547 |
| Grammar | 447 | 439 | 507 | 497 | 548 | 540 | 580 | 572 |
* LBOTE= results for students with language backgrounds other than English
** AUST= results for all Australian students
The findings from the standardized national assessment are consistent and unequivocal: Students with an additional language, who are likely to speak that language at home, rather than “underperforming” in fact surpass (or, in one case match) non-LBOTE on all of these literacy measures. Left out of this program are assessments of the substantial cognitive, social, and cultural advantages, as we have seen, that LBOTE students enjoy.
10.4 A National Literacy Profile
10.4.1 International Test Results
Along with national processes for assessing literacy among school students, Australia has taken part in OECD’s international literacy assessments programs for both high-school students (PISA) and adults (PIAAC, the Programme for the International Assessment of Adult Competencies). The results of these are widely reported in the media and are often brought to bear in debates about teaching, policy, and research. The rankings of the OECD nations scoring significantly above the OECD mean for reading in PISA, round 2018, and for PIAAC, round 2012, along with some related national characteristics, are summarized in Table 10.4.
Table 10.4 OECD ranking of member nations scoring significantly above OECD mean for reading in PISA round 2018, and related national measures
| Country | Mean reading score | % variance reading associated with SES | Per student expenditure ‘000 Footnote ** Age 6L15 | InequalityL Adjusted Education index (HDR, 2019) | % GDP per cap on schools | Rank in OECD PIAAC literacy | PIAACFootnote *** literacy ranking for category “school teachers” |
|---|---|---|---|---|---|---|---|
| Estonia | 523 | 6 | 8 | .87 | 5 | 8 | 20 |
| Canada | 520 | 7 | 11 | .87 | 5 | 12 | 10 |
| Finland | 520 | 9 | 11 | .92 | 7 | 2 | 3 |
| Ireland | 518 | 11 | 6 | .92 | 4 | 21 | 11 |
| S Korea | 514 | 8 | 11 | .94 | 5 | 15 | 14 |
| Poland | 512 | 12 | 8 | .86 | 5 | 20 | 13 |
| SwedenFootnote * | 506 | 11 | 15 | .94 | 8 | 4 | 9 |
| New ZealandFootnote * | 506 | 13 | 9 | .86 | 6 | 5 | NA |
| USA* | 505 | 12 | 15 | .85 | 5 | 18 | 16 |
| UK* | 504 | 9 | 11 | .90 | 6 | 16 | 18 |
| JapanFootnote * | 504 | 8 | 10 | .96 | 3 | 1 | 1 |
| Australia | 503 | 10 | 11 | .89 | 5 | 5 | 2 |
| DenmarkFootnote * | 501 | 10 | 7 | .89 | 8 | 14 | 17 |
| NorwayFootnote * | 499 | 7 | 15 | .93 | 8 | 6 | 7 |
| GermanyFootnote * | 498 | 17 | 10 | .91 | 5 | 17 | 6 |
| Slovenia | 495 | 12 | 9 | .91 | 5 | 27 | 15 |
| Belgium | 493 | 17 | 12 | .82 | 7 | 11 | 8 |
| France | 493 | 17 | 10 | .93 | 5 | 24 | 19 |
| Mean, OECD | 487 | 12 | 9 | .78 | 3.4 |
* Mean reading score not significantly different from Australia’s.
** In $US adjusted for purchasing power parity.
*** As reported in Reference Freebody and FreebodyFreebody and Freebody (2017); the category covers early years, primary, and secondary schooling.
Comparing the Australian profile, we see Australia rating at about the midpoints on some measures (relationship between literacy score and socioeconomic status, and expenditure per student as percent of GDP spent on schooling), and above average on other measures (overall literacy, percentage of adults with tertiary education, and inequality-adjusted education index). In its PISA 2018 “Country Note: Australia,” the OECD highlighted these issues:
While Australia’s reading performance in PISA 2018 was similar to that observed in 2015, when considering a longer period, mean performance in reading has been steadily declining, from initially high levels, since the country first participated in PISA in 2000 … students’ performance in reading … was less strongly associated with socioeconomic status in Australia than on average across OECD countries.
The rightmost columns of Table 10.4 refer to the literacy rankings of Australian adults on the tests administered as part of OECD’s PIAAC program. Clearly, Australian adults rank highly on the PIAAC literacy test. In 2015 Australia’s national government announced the implementation of a program of literacy testing for initial teacher-education students, as a reaction to the declining performance of Australian school students in the immediately preceding PISA tests. The government claimed that students’ unsatisfactory performance was partly explained by inadequate literacy levels among Australian schoolteachers. Reference Freebody and FreebodyFreebody and Freebody (2017) examined this claim using OECD’s PIAAC literacy test, selecting the literacy scores of participants, from Australia and the twenty-three other participating OECD countries, who nominated “teaching” as their profession, or “teacher education” as their highest qualification. They also compared Australian teachers’ scores with the scores of those of Australian participants from five comparable professional groups. They drew two main conclusions: “first, that Australian teachers, as determined by their highest qualification or their current professional status, are in the highest performing group of countries on OECD’s literacy tests, and second, that Australian teachers have literacy test scores statistically comparable to other professional practitioners in Australia” (2017, p. 5). It is informative to examine OECD’s own interpretation of Australian students’ performance on PISA and on the national assessment program, NAPLAN. The OECD made these six recommendations concerning the teaching and assessment of literacy in Australia (OECD Country Report Australia, OECD 2011, pp. 152ff):
establish national strategies for strengthening the linkages to classroom practice within the overall evaluation and assessment framework;
promote greater national consistency while giving room for local diversity;
reinforce the assessment validity of the national testing program and establish safeguards against an overemphasis on it;
strengthen teachers’ capacity to assess student performance against the Australian curriculum and use student assessment data;
maintain the centrality of teacher-based assessment while ensuring the diversity of assessment formats;
clearly establish what the country takes to be the fundamental purpose of external school evaluation – either it can “bring about general improvement across all schools or, more narrowly, it can focus on ‘failing schools’” (p. 156).
Remarkable here is the notice taken of this set of recommendations by Australian governments responsible for literacy education over the intervening years: These authorities have, by acts of both omission and commission, continued to move in precisely the opposite direction on all six counts.Perhaps the most striking aspect of the findings from PISA and PIAAC is how deeply Australian literacy educators – classroom practitioners, school leaders, teacher educators, researchers, and policymakers – are divided on the validity of these metrics and comparisons, and on their usefulness in improving the quality of literacy efforts (e.g., Reference Freebody, Lian, Kell, Black and LieFreebody, 2017, Reference Freebody, Cox, Feez and Beveridge2019; Reference Lingard, Thompson and SellarLingard, Thompson, & Sellars, 2016). The degree of attention paid by policymakers, politicians, and the media to literacy has resulted in the spectacle of recurring crises and “literacy wars” in Australia (Reference Castles, Rastle and NationCastles, Rastle, & Nation, 2018; Reference Lo Bianco and FreebodyLo Bianco & Freebody, 2001; Reference SnyderSnyder, 2008). But there have also been collaborations, summarized in Subsection 10.4.2, that have resulted in attempts to “balance” various approaches in light of the varying needs of Australian students (e.g., Reference Cox, Feez and BeveridgeCox, Feez, & Beveridge, 2019; Reference Wyatt-Smith and GunnWyatt-Smith & Gunn, 2007).
10.4.2 A History of Opportunities, Challenges, and Dynamism
The history of Australia’s institutional efforts in education has presented distinctive challenges and opportunities to literacy educators. The inconsistent management of Aboriginal and migrant education figures prominently. More recent, abrupt institutional changes in education over the period of the late 1980s and early 1990s were also influential: The institutes responsible for teacher education in Australia were amalgamated into universities, or, in some cases, combined to form aggregations that were renamed as universities. These amalgamations meant that academics in faculties or schools of educational studies in most existing universities were joined by significant numbers of colleagues from teacher-education institutions. In this relatively sudden way, different kinds of professional expertise were conjoined under the one set of institutional expectations and incentives. While teacher education and research had gone on in both university schools and colleges, the institutional emphases had been generally different; so the amalgamations called for new kinds of - and new priorities for – undergraduate teaching for some staff, and research activity and supervision for others.
These new configurations, mixing school-based “guild” experience and disciplinary-based approaches to teaching and research, brought to the surface differences around basic questions such as the nature of good teaching, how best to prepare teachers for the practical work of schools (Reference ConnellConnell, 2009), and the research–practice relationship. New forms of debate and new opportunities for collaboration arose. Literacy education was center stage in many of these debates partly because long-standing research programs in reading and writing had developed in some university schools of psychology, linguistics, and English, as well as in some schools of education.
These amalgamations also led to ownership skirmishes across disciplinary boundaries. At worst, discipline- or site-based groups have tended to become aware of conceptual, practical, or policy developments in their professional neighborhoods. At best, more productive cross-discipline and cross-method approaches to literacy education have occurred than in some other comparably sized research settings (e.g., in the psychology of reading, Reference Byrne, Freebody and GatesByrne, Freebody, & Gates, 1992; in reviews of literacy education, e.g., Australian Department of Employment, Education and Training, 1991, and in extended research collaborations such as Reference Morgan, Comber, Freebody and NixonMorgan et al., 2014).
The competitive dynamism that has developed within and across the various scholarly disciplines that address literacy education is evident in the volume and range of published Australian empirical and theoretical work. A well-developed line focuses on the cracking of graphic codes as they map onto speech and the educational implications of those processes (e.g., phonics teaching, alphabetic knowledge, phonemic awareness). This area has been developed largely by educational psychologists (e.g., Reference Buckingham, Beaman and WheldallBuckingham, Beaman, & Wheldall, 2014; Reference ByrneByrne, 1998, Reference Byrne, Bates and Maack2010; Reference Castles, Rastle and NationCastles et al., 2018; Reference Coltheart, Snowling and HulmeColtheart, 2005; Commonwealth of Australia, 2005; Reference Cox, Feez and BeveridgeCox et al., 2019; Reference Fielding-Barnsley and HayFielding-Barnsley & Hay, 2012). There has also been a body of research in theory within the Australian setting based on constructivist or so-called whole language approaches to the teaching of reading and writing, emphasizing Piagetian and other growth and development approaches and arguing against the pervasive use of explicit teaching and segmented, atomized skills development (e.g., Reference CambourneCambourne, 1988; and see the summary in Reference Wyatt-Smith and GunnWyatt-Smith & Gunn, 2007).
A distinctive contribution to literacy education has arisen from the application of systemic functional linguistics (SFL), developed by Reference HallidayHalliday (1985) and his students and colleagues. This contribution includes documentations and analyses of the formal curriculum-based reading and writing demands on students across the school years (most prominently Reference Christie and DerewiankaChristie & Derewianka, 2008), and applications of approaches based on SFL to classroom work (Reference GibbonsGibbons, 2014; Reference GrayGray, 2007; Reference HammondHammond, 2016; Reference MartinMartin, 1985). One application of SFL to classroom teaching and teacher professional development, called Reading to Learn, is summarized in Reference Rose, Miller, McCardle and ConnellyRose (2017). He outlined these key elements of the program: (i) engagement of students in curriculum texts that may be beyond their independent reading levels, (ii) interrogation of passages from texts that models comprehension processes, (iii) recognition of language usages and their related purposes, (iv) recruiting these language resources into students’ writing, and (v) constructing effective, purposeful, and appropriately organized texts.
Reference Rose, Miller, McCardle and ConnellyRose (2017) summarized several research application phases demonstrating the efficacy of this program over five grade-level bands from kindergarten to Grade 8. Accuracy levels on five features of students’ writing were assessed: overall generic structure, appropriate use of register, discourse, grammar, and graphic features. Composite assessment over these phases showed not only major gains at all grade levels after six months of the program’s use, but also a reduction of the gaps between previously designated literacy achievement bands within each grade level (see MacRae et al., 2000; Rose & Martin, 2013). Systemic functional linguistics has also been applied to questions about how multiple modalities and media can be put to work in literacy learning settings (e.g., Reference Macken-Horarik, Love, Sandiford and UnsworthMacken-Horarik et al., 2017; Reference Painter, Martin and UnsworthPainter, Martin, & Unsworth, 2013). Reference Unsworth and Macken-HorarikUnsworth and Macken-Horarik (2015), for example, documented three progression points among school students’ understandings of picture–language relations in multimodal texts across the elementary and secondary years:
a “tactical orientation”: early-years students describe in a variety of nonrational ways how illustrators choose to represent the language (the tactic is simply finding something apparently relevant to say);
“diegetic orientation”: images are interpreted in terms of the apparent reality of the story’s world, where illustrators’ choices are tied to the thoughts or feelings of the characters; and
a “semiotic orientation”: students orient to the explicit crafting of the text, the deliberate construction of the multimodal to shape the responses of readers, and an awareness of the kinds of options the illustrator exercised to represent emotion and power relations.
These researchers concluded that teachers need to work with the learners’ “shifts from more idiosyncratic responses to images, on from those that attend primarily to the experiential world ‘inside’ the text, and toward those that respond to the shaping power of the text itself” (p. 75). Sociological approaches have also been evident in the Australian tradition of literacy research. These have included critical approaches to literacy materials used in schools (Reference Baker and LukeBaker & Luke, 1991; Reference GilbertGilbert, 1989; Reference Green and BeavisGreen & Beavis, 2012; Reference LukeLuke, 1988, Reference Luke2018) as well as approaches based on the rapidly changing social, technological, and vocational conditions in which schools operate, and in which increasingly diverse groups of students need to participate (Reference Cope, Kalantzis and HawkinsCope & Kalantzis, 2013; Reference Farrell, Baynham and PrinslooFarrell, 2009; Reference Kalantzis, Cope, Chan and Dalley-TrimKalantzis et al., 2016; Reference Lankshear, Knobel, Leung and StreetLankshear & Knobel, 2014; Reference Luke, Dooley and WoodsLuke, Dooley, & Woods, 2011).
As a large-scale example, a series of studies in this tradition was conducted by Reference Hill, Comber, Louden, Rivalland and ReidHill et al. (2002, and see Reference Hill, Comber, Louden, Rivalland and ReidHill, 2002). Through a compilation of detailed case studies, they documented the literacy learning experiences of 100 children from a range of cultural and socioeconomic backgrounds, including a remote Aboriginal community. They first followed the children from preschool into school, and followed up on the same children five years later. Among many other findings, some key conclusions were that:
most children increased their literacy capabilities substantially;
nonetheless the range of reading and writing achievement within age groups was extensive;
significantly lower levels of literacy were found overwhelmingly in schools serving poor communities;
findings overall indicated that, within those patterns, the teaching that has a substantial positive effect on children’s literacy learning, first, does not rely on a narrow set of teaching strategies or prepackaged curriculum content, and second, is dynamic and based on a detailed, “data-driven responsive” focus on individual students’ needs. (Reference Hill, Comber, Louden, Rivalland and ReidHill, 2002, p. 1)
In her 2002 summary, Hill concluded:
there is a need for a second safety net at 8–9 years of age for children who do not have automatic and independent literacy strategies and repertoires needed to reach their learning potential in primary school. Good first teaching, effective early intervention and a second safety net require teachers who are knowledgeable and energetic, and practise culturally responsive literacy teaching.
Collaborations across these fields have also included multidisciplinary focuses on the interactional details of classroom activity and learning (e.g., Reference Edwards-Groves and GrootenboerEdwards-Groves & Grootenboer, 2015; Reference Martin and MatonMartin & Maton, 2013), on new technologies, critical online analysis, and multimodal literacy activities in the middle years of schooling (e.g., Reference Morgan, Comber, Freebody and NixonMorgan et al., 2014), and on technology and diversity-oriented pedagogies (e.g., Reference Mills, Stornaiuolo, Smith and PandyaMills et al., 2018; New London Group, 1996; SICLE, n. d.). Rapidly growing is a research base aimed at capitalizing on students’ out-of-school activities in digital, online, and mobile contexts. This includes work on how classrooms can be constructed that capitalize on the new literacy affordances of these technologies (e.g., Reference Reimann, Bull, Kickmeier-Rust, Vatrapu and WassonReimann et al., & Wasson, 2016; Reference Wells, Auld, Doecke, Auld and WellsWells & Auld, 2014); how new media can reshape literate communications (e.g., Reference Green, Beavis, Hall, Cremin, Comber and MollGreen & Beavis, 2013); and how literacy learning can be reliably evaluated in online, “big data” settings (e.g., Reference MillsMills, 2019).
So-called C21 lines of work continue to develop along with “literacy education,” conventionally construed. The real conceptual, methodological, and professional advances on offer from an integration of print and digital literacy efforts, especially in Aboriginal, community, remote, and equity settings, are yet to fully emerge in Australian education. These topics present educators and researchers with challenges in learning from literacy education’s past and applying that knowledge to its future, in a unique combination of community, state, and national settings. Finally, how the various curriculum areas put literacy to work in gradually more specialized and divergent ways has assumed increasing prominence in Australian work (e.g., Reference Christie and MatonChristie & Maton, 2011; Reference Martin, Maton and DoranMartin, Maton, & Doran, 2019; Reference Muspratt, Freebody and KhineMuspratt & Freebody, 2013). This may be one outcome of increased collaboration among the various groups of scholars, policymakers, and classroom practitioners, in periods of national and state curricular reform.
The influential Alice Springs (Mparntwe) Declaration (Education Council, 2019), for instance, identifies languages, especially Asian and Aboriginal languages, as key learning, along with English. In the national languages curriculum, a strong case is made for the benefits of students’ literacy improvement in all languages through engagement in learning and using additional languages, as well as for the rights of Australian children to bilingual capabilities (ACARA, 2011, 2020). While programs managed at state and territory levels vary widely, there are positive signs: The increase of bilingual school programs is the biggest growth area in languages programs. This growth is most evident in programs that use a Content and Language Integrated Learning approach, in which specific, high-status curricular areas are taught in a second or additional language (Reference CrossCross, 2015; Reference Morgan, Scrimgeour, Farmer, Dodd and SaundersMorgan et al., 2016). In a recent initiative, the Australian government contracted the Australian Federation of Modern Language Teachers Associations (AFMLTA, lead investigators Morgan & Scrimgeour) to develop a national plan and strategy for languages education. These initiatives indicate emerging levels of understanding of the need for bilingual and multilingual programs to support literacy learning.
10.5 Conclusions and Discussion
Australian school students and adults have performed at moderate-to-strong levels in international assessments of literacy. Australian literacy researchers have contributed significantly over several decades to debates about the nature of literacy learning and the ways in which it can be enhanced both in and out of school settings. But, as our discussion shows, there remain enduring shortcomings in the capacity and willingness of Australian education systems to address some of the dramatic variations in the quality and efficacy of current literacy education efforts.
At the time of writing, the Australian population includes about 97 percent settler and migrant groups, and there is increasing immigration from geographically neighboring countries whose cultures are far removed from those of the linguistic and social settings of the still-dominant Anglo ethnos. So one possible explanation for the continued shortcomings in effective, wholehearted multilingual or bilingual literacy education efforts on the part of a succession of Australian administrations is that, by enveloping English-only literacy within the self-evidently innocent goal of national economic productivity, the generally muffled background of xenophobia that a small, but electorally consequential minority exhibits toward Aboriginal and non-European migrant communities is channeled. A visible and relatively sudden disjunction has appeared, however, between the long-standing Anglo-centric cultural identity of Australia and the new economic and cultural dealings of Australians with their thriving local, Asian neighbors. Combined with the growing body of research on the individual and community benefits beyond monolingualism, this reorientation, based partly as it is on pragmatism, may usher in a generational change in approaches to language and literacy education.
The Australian literacy education community also encompasses several drivers of caution and conservatism when it comes to innovating practices and assessments. One is the relatively recent commercialization of programs for use in schools and homes on phonics, phonemic awareness, and alphabetic knowledge. These programs have attained the status of commodities and compete in a growing marketplace, such that the research accompanying them runs the risk of becoming, or coming to be seen as, more resistant to independent critical scrutiny and adaptation than might otherwise be the case.
This commodification of literacy learning in turn interacts with a second feature of the current literacy research field in Australia – a gradual retreat from the pressure to collaborate across disciplines and toward an intensification of methodological and citation cadres, initially stimulated by the amalgamation of the colleges and universities, and a return to a more independent, foundational disciplinary control of the research topic. For example, research on the teaching and learning of reading was traditionally a prerogative of university departments of psychology or educators working with psychological concepts and methods in the domain of “special needs” (e.g., see the extensive review in Reference Castles, Rastle and NationCastles et al., 2018). Similar “repossessions” may apply to departments of English and linguistics and the teaching and learning of writing (such as, e.g., creativity, composition, text construction, and so on).
A final driver of caution and conservatism is the suspicion among some groups that Anglo-Australian values and cultural mores are weakening, and the ready allocation of blame to education, specifically to education in English literacy, as the cause of this vague sense of cultural deterioration. These essentially nostalgic motivations are often exploited by conservative sections of the media, and connected simplistically to a hankering for a lost, mythical era of internal social stability and external economic competitiveness. The attribution to literacy of an almost magical relation to the economic and cultural wellbeing of the country continues to result in a growing investment in literacy as an apparently effective short-term solution, at the expense of other more patient, more carefully and consensually developed, and potentially more relevant policy options. These material and psychological investments in literacy can present a challenge to communities’ and funding bodies’ support for the development of useful traditions of research in literacy education. If the signifier “literacy” continues to trigger, among researchers and policymakers alike, an apparently irresistible temptation to overpromise – in terms of quality, speed, durability, and scale – then that temptation can itself become an ongoing educational liability.
But against these cautionary urges, the field of Australian literacy education – its teachers, school leaders, policymakers, teacher educators, and researchers – displays at least three sources of dynamism and optimism, and it is these that have organized our discussion in this chapter. The first is the current urge to rewrite and reread the Australian “origin narrative” – and thereby to encourage broader rights of access to those retellings. Despite the retreats and partly filled aspirations that we have related here, there are more literate Aboriginal children in schools, and more Aboriginal parents involved in school and community educational activities than ever before. These gains have been hard earned by Aboriginal activists and educators, and, as happened to Aboriginal native land title aspirations through the 1998 “amendment act,” they can be eroded; but a third gain – more non-Aboriginal youngsters learning Aboriginal languages and culture than before – may make community interest in a more inclusive origin narrative harder to deflect.
A second source of dynamism and optimism in Australian literacy education arises from the reconstitution of settler culture via changing patterns of migration. The diversity and multiplicity of Australian society is continuously being renewed, and the cultural significance of migration is being made increasingly visible and, through language, audible. It offers literacy educators and researchers challenges and opportunities that potentially involve changing technologies for literate communication, increasingly complex patterns of mono-, bi-, and multilingualism, an ethic of productive inclusiveness, and a direct connection to cultural fluency and thereby to relations with geographic and trading neighbors.
These two sources of dynamism and optimism call into play a third: the need for more intensive within-and-across-discipline collaborations among researchers, using methodologies that build in deeper engagement with the teaching and educational policy professions, and with the diverse communities they serve. As with Australian culture at large, so in Australian research on language and literacy education: Fractiousness can sustain dynamism. In a weaponized commercial and sociopolitical environment, however, fractiousness can present the end users of research – educators and policymakers – with a troubling array of options. What remains abidingly clear is the need for researchers, educators, and policymakers to commit to incorporating the diversity of the users, uses, and purposes of literacy, acknowledging the complex language and culture communities that are Australia’s durable endowment, rather than its burden.


