

Part 2 Case studies
4 The Netherlands
4.1 Introduction
The dynamics of the broadband market in the Netherlands are a result of the interplay between private and public actors over a long period of time, which has led to a technological duopoly of operators exploiting the PSTN-telephony and the RTV-cable infrastructures. The infrastructure-based competition complemented by access-based competition has provided the country with a leading position in the broadband league tables, within Europe and globally1 – a position that is now being challenged by a slower adoption of mobile broadband and by the investment challenges associated with the next technological transition, the introduction of Fiber-to-the-Home.
Both the public switched telephone network (PSTN) and the radio and television cable distribution network (RTV-cable) have reached a very high level of penetration, reaching nearly 100 per cent and 95 per cent of households, respectively. While narrowband access to the Internet started with dial-up connections using the PSTN, it has been the RTV-cable network that has led the development towards broadband, exploiting the inherently higher bandwidth of the coax cable, compared to the twisted copper pairs used in the telephone network.
The techno-duopoly has led to the extended exploitation of the existing infrastructures by the incumbent operators. Although deployment of fibre has occurred in the backbone, in metropolitan networks as well as in business parks, it did not reach private residences. Hence, municipalities eager to provide high quality communication services to their citizens and businesses have declared ‘market failure’. Together with housing corporations, they have taken initiatives for FttH deployment. This has led a new actor to appear in the broadband market, Reggefiber – a construction company building open passive FttH infrastructure for service operators to exploit; fundamentally changing the market dynamics. This prompted a strategic response by KPN, the incumbent PSTN operator, to take a minority share in Reggefiber.
In this summary of broadband market developments we can already recognize the interplay between the most important actors: the telecommunication (telecom) entrepreneurs, both incumbents and entrants, local government and housing corporations. In our quest for a deep understanding of the dynamics of broadband markets and our desire to make forward-looking statements with respect to the development of these markets, an appreciation of the historical development of the ‘narrow band’ markets is considered highly relevant, as it provides the fundamental infrastructure for the development of broadband markets.2 Moreover, the historical account will provide us with an appreciation of the roles the various actors have played, insights into the development of market and industry dynamics and a deeper understanding of the social and political context of the industry, as well as any path dependencies. The periodization as introduced by Noam is applied (see Chapter 2 Research context and perspective, Section 2.4)
This case study3 is structured as follows: In Section 4.2 the development of the PSTN and the RTV-cable networks are captured, including the process of telecom reform, highlighting the role of entrepreneurs, municipalities and the central government in its development. In Section 4.3 the emergence of the Internet is covered. Section 4.4 follows with the development of broadband Internet access, including the role of ADSL and DOCSIS. In Section 4.5 the focus is on the first steps towards FttH, the early initiatives by the incumbent operator KPN and the role of the government. In Section 4.6 the role of municipalities in FttH development is discussed. In Section 4.7 follows a review of the implications of the transition to All-IP by KPN. Section 4.8 is dedicated to the emergence of Reggefiber. In Section 4.9 a review is provided of the broadband market today and the realization of the Digital Agenda targets. In Section 4.10 the salient items of this case study are identified as well as experiences that may be worth sharing.
Please note that, at various points in the case study, multiple perspectives are provided on developments in the same period: e.g., from the perspective of the entrepreneurs followed by the perspective of the government, or from the perspective of the telecommunications industry followed by the perspective of the radio and television sector. This means in the story line a return to the beginning of the particular period under review.
The interpretation of our case study findings in the broader context of European broadband market developments is the subject of Chapter 16 – the cross-case analysis.
4.2 Infrastructure developments as precursors to broadband
In this Section we capture those historical aspects of infrastructure developments that are relevant to explain the dynamics of broadband markets in the Netherlands. Of particular interest are the changing roles of the key actors: the private firms, the municipalities and the national government.
4.2.1 Telephone 1.0 and policy 1.0
In the development of the telephone network in the Netherlands, private entrepreneurship played a leading role. For instance, the City of Amsterdam selected the Nederlandsche Bell Telephoon Maatschappij (NBTM) to build a telephone network under license from US-based International Bell Telephone Corporation (IBTC).4 The network was placed into service in 1881. Private initiatives resulted in 43 local networks being created in the major cities. These private networks were operational for a significant period of time, between 10 and 34 years, for an average of 24.5 years. In 1896 upon the expiry of the NBTM license, the City of Amsterdam decided based on public interest considerations (quality and not-for profit objectives) to assume the exploitation of the local telephone network. The municipalities started to assume ownership and operational control with the transfer of the NBTM network in Amsterdam in 1896. This example was followed by seven transfers from private to municipal ownership and twenty new municipal network start-ups.5 The municipal ownership lasted from 3 to 44 years, on average 21 years. From 1906 the state began to build and exploit new networks and to take over the private and municipal networks, essentially starting in 1916 and completed in 1927, with the exception of the municipal networks in the three largest cities: Amsterdam, Rotterdam and the Hague which transitioned in 1940 under the Nazi occupation.
For the construction of the inter-local network only one licence was granted, to NBTM which subsequently operated the network as a monopoly. The inter-local network transitioned to the State in 1897 after just 10 years of operation. (Schuilenga, Tours, Visser and Bruggeman, Reference Schuilenga, Tours, Visser and Bruggeman1981; De Wit, Reference De Wit1998)
4.2.2 Radio 1.0 and policy 1.0
The first experimental radio broadcasting service in the Netherlands was provided by a radio-amateur à Steringa Idzerda in The Hague in 1919. (De Boer, Reference De Boer1969; Blanken, Reference Blanken1992) In 1923 the Nederlandsche Seintoestellenfabriek (NSF) also started broadcasting services in Hilversum, using a license for manufacturing and testing. The content of the broadcasts was provided by the ʻHollandse Draad-looze Omroepʼ, the precursor of the Dutch broadcasting membership-associations (AVRO, KRO, NCRV, VARA, VPRO, each inspired by a particular world view). Philips was a major sponsor of these broadcasts. In 1935 the Dutch government consolidated all broadcast transmitters under a new entity, NOZEMA, which undertook renewal of the transmitters in a new location – Lopik.6 (Vogt, Reference Vogt1958; De Boer, Reference De Boer1969; Vles, Reference Vles2008)
In 1924, the first wire-based radio transmission was started by Bauling on a commercial basis in the town of Koog aan de Zaan. For the subscribers the service was cheap compared to owning a radio set: only a headphone or loudspeaker was required, hence the service appealed to the working class. Radio distribution licenses were granted on a non-exclusive basis. The industry was led by entrepreneurs, essentially in a ‘competition for the market’. A total of 800 private and municipally owned radio-distribution networks were built, with 35 networks in The Hague and 200 in Amsterdam of which only 9 served more than 1,000 subscribers.7 Some radio-distribution organisations operated as cooperatives, whereby volunteering members enabled lower tariffs. In some cities (e.g., The Hague) the telephone network was used for the distribution of the radio signals. Also 20 municipalities became radio-distribution operators exploiting a local monopoly position.
From 1931, these networks were directly linked to the radio stations by cable, thereby facilitating ‘high quality’ transmission.8 Radio-distribution peaked with 51 per cent of total radio users by the end of 1932, a position unique in Europe. In 1940 under the Nazi regime, the radio-distribution systems were placed under the responsibility of the PTT. As upgrading towards TV distribution was not feasible, the decision to terminate radio-distribution service was taken in 1964, and the process was completed in 1975. (Schrijver, Reference Schrijver and Regeringsbeleid1983; Arnbak, Van Cuilenburg and Dommering, Reference Arnbak, Van Cuilenburg and Dommering1991; Bordewijk, Reference Bordewijk2004)
4.2.3 Television 1.0 and policy 1.0
Television broadcasting on a regular basis was introduced in the Netherlands in 1951. Shortly thereafter, the use of equipment for the central reception and distribution of the signal (CAI) was introduced, primarily by housing corporations in high-rise buildings. These systems improved signal quality and reduced the need for individual antennas. The use of these systems was legally the prerogative of the PTT, which had the monopoly on distribution of broadcasting signals. However, during the 1950s and 1960s the practice was condoned for practical reasons. In 1963 the government proposed a central antenna system (CAS) to be built by the PTT. Casema, subsidiary of Nozema, jointly owned by PTT and the broadcasting organizations, was set up to provide the service. Pilot projects were conducted in The Hague. However, this initiative was rejected in parliament in 1975. In the same year, the monopoly position of the PTT was replaced by a concession system, which allowed the legalization of the CAI-systems. Only one concession was made available per municipality and the municipality had a preferential position to exploit the concession or have the concession exploited by a third party.9 Hence, cable networks became predominantly owned by the local governments. The exploitation of the networks was often delegated to the local or regional energy company or to private firms; also Casema was positioned to exploit these networks.10 The future introduction of optical fibre to the home was recognized but considered largely incompatible with the cable systems and, based on a depreciation period of 10–15 years, it was not expected before the years 1990–2000. A research project DIVAC (digital subscriber access) was begun to explore the related challenges in 1982.11 (Jelgersma and Titulaer, Reference Jelgersma and Titulaer1981; Schrijver, Reference Schrijver and Regeringsbeleid1983; Davids, Reference Davids1999; NLKabel, 2009)
4.2.4 Reflection on period 1.0
The important role of the municipalities in the development of the telephone and cable networks as described above should not come as a surprise, as municipalities have had an important role in infrastructure development in general. Consider, for instance, the development of the road system, the drinking water supply and the sewage system, as well as the local distribution networks for electricity and city gas (see for instance: Milward, Reference Milward2005; Van der Woud, Reference Van der Woud2007; and also the Stadtwerke in Germany, Chapter 8). In their objective of creating an attractive economic and social climate for business and citizens, good quality infrastructures play an important role. Moreover, competition between municipalities is to a large extent based on infrastructure supply: hence, their continued interest in telecom infrastructure, resulting in their current involvement in the roll-out of fibre.
4.2.5 Telecom 2.0 and policy 2.0
Perspective on the incumbent
The privatization of the incumbent operator PTT ran in parallel with the European Reform debate and was triggered by concerns voiced by the business sector in 1981. The emerging ʻInformation Societyʼ was expected to require fundamental changes to allow the full benefits to be reaped. Subsequently, the Ministry of ‘Verkeer en Waterstaat’ (Public Works), responsible for the supervision of the PTT as one of its Departments, initiated the ‘Swarttouw Committee’ to investigate the (future) role of the PTT in the development of the ICTs and to identify the possible issues. The report was published in 1982. In the summer of 1984, the ‘Steenbergen Committee’ was installed to advise on the future position and structure of the PTT and on the required regulatory supervision. This Committee published its recommendations in 1985, which led to the decision to transform the PTT into a separate legal entity, initially with the state as the only shareholder, in 1986. The Committee also proposed the functional separation of the network and the licensed public service from those services being provided in competition; however, this suggestion was not adopted by the government. (Arnbak, Reference Arnbak1986; Davids, Reference Davids1999)
In June 1994, the privatisation process started with an initial public offering (IPO). The IPO covered 30 per cent of the shares. The company obtained the right to issue preferential shares as a way to fend off a potential hostile take-over.12 Also the state, as remaining majority shareholder, could issue preferential shares to prevent a take-over by a candidate considered undesirable by the state. The state retained a so-called ‘Golden Share’, allowing it the right of veto on tariff increases, investment plans and merger plans.13 These rights were deemed necessary to protect the public interest. Hence, in 1999 the state had to approve the acquisition by KPN of E-Plus, a mobile operator in Germany. This triggered discussion about the need to retain the ‘Golden Share’. Partial state ownership and control was also said to have frustrated the intended merger between KPN and Telefónica. In 2003 the ownership by the state of the ‘Golden Share’ in KPN was challenged by the European Commission. At that time the State retained a 19 per cent share in KPN. Late in 2005, as the state’s shares had fallen below 10 per cent, the Ministry of Finance announced its intention to relinquish the ‘Golden Share’. In the fall of 2006 the state sold its remaining shares, completing an institutional change process that was triggered 25 years earlier in 1981. (NRC, 1994, 1999; Van Wijnbergen, Reference Van Wijnbergen2000; Buddingh, Reference Buddingh2003; NRC, 2003, 2005b, 2005a)
Perspective on the entrants
With the liberalization, new entrants emerged as subsidiaries of utility companies starting to exploit their internal communications infrastructures for external users, such as Enertel (energy) and Telfort (railways).14 Operators of Dutch-origin as well as operators from abroad, such as Versatel and Tele2 respectively, entered the market based on carrier resale and later local loop unbundling. MFS, for example, entered the market to serve the business sector, in particular the financial sector.15 Also joint ventures were established, such as KPNQwest – KPN the Dutch incumbent with Qwest from the USA – in pan-European fibre networking. Other international and pan-European carriers that became active in the Netherlands targeting local operators and large multi-national corporations included AT&T, BT, COLT, Global Crossing, GTS, Interoute, Level3 and Worldcom/MCI. Moreover, KPN ventured abroad to invest in liberalizing incumbents (e.g., Eircom, Ireland, and SPT, Czech Republic), participated in new ventures (e.g., Utel in the Ukraine) and acquired new companies (e.g., E-Plus, the third largest mobile operator in Germany).
4.2.6 Cable 2.0 and policy 2.0
Already in 1981, the ‘Swarttouw Committee’ had recognized that the cable distribution networks could develop towards a broadband network by facilitating two-way communication. If these CATV networks were connected on a national scale, they could form a competitive threat for the PTT. As the telecom policy was based on a primary role for the PTT, the Committee suggested mitigating this threat by creating an integrated network (Davids, Reference Davids1999). This position by the Committee was subject to both support and critique. The Scientific Council for Government Policy (WRR) concluded that cable networks were not necessarily to be integrated with the telephone network. The Ministry of Economic Affairs strongly opposed a monopoly of the PTT on all infrastructural networks.16 The opposition resulted in the appointment of the ‘Zegveld Committee’ to investigate the issue. Their report, published in 1987, recommended that integration should take place as part of one future broadband fibre network for audio, image and data communication. In 1988, this option was included in an update of the Telecom Law. However, in 1992 it became clear that the cable operators, united in sector organisation VECAI, opposed the integration. In the same year the Parliament formally rejected the option. (Eenhoorn, Reference Eenhoorn1994; Davids, Reference Davids1999)
The EU-initiated Reform, which required the transposition of Directives into national legislation, changed the position of the cable operators vis-à-vis KPN. They were allowed to interconnect their networks, which was done mainly through optical fibre. The change in telecom policy brought an end to the concession system and, hence, municipally owned networks could be acquired by private entities.17 By 2001, the result was that 29 cable operators were operating 647 cable networks, in a total of 504 municipalities, serving 6,159,972 subscribers. The consolidation process continued during the following decade around three firms: (1) UPC – owned by US-based Liberty Global, which acquired the cable network in Amsterdam (A200018) in 1998; (2) Essent Kabelcom, a division of the energy company operating mainly in the north-eastern and south-eastern part of the country, combined with Multikabel (operating under the temporary name Zesko); and (3) Casema operating in the western and central part. The latter two merged to become Ziggo in 2008, leading to two major cable companies, Ziggo and UPC, essentially RTV monopolies in their own territories sharing the market, with at the second tier Caiway as the main player operating in the western and central part of the country. (Van Bockxmeer, Poel, Hulshof and Rutten, Reference Van Bockxmeer, Poel, Hulshof and Rutten2002; De Leeuw, Reference De Leeuw2009; NLKabel, 2009)
4.2.7 Reflections on the period 2.0
This period provides a nice illustration of the policy formation process in the Netherlands, with a strong emphasis on committees preparing policy advice based on broad stakeholder interactions, a pattern that we can observe again in the context of polices regarding broadband development.
The period has been relatively successful due to a central government advancing the liberalisation agenda: for example, market entry now requires only registration, not a license, and local governments facilitate entry by applying a ‘liberal’ application of the rights-of-way policy.
While the telecom reform resulted in new players entering the PSTN sector, thereby increasing competition, it led to consolidation of the local and regional RTV-cable monopolies into two major regional monopolies and a few smaller ones. This set the conditions for a techno-duopoly to emerge with the introduction of the Internet: on the one hand, between KPN, the dominant player in the PSTN, with access-based operators such as BBned and Tele2, and, on the other, the RTV-cable operators UPC and Ziggo.
4.3 Emergence of the internet in the Netherlands
As the Internet developed within the academic research institutes in the USA, the academic community in the Netherlands also played a leading role. But it was the (albeit closely related) Hack-tic community of self-declared ‘techno-anarchists’ that provided the first Internet access services outside the academic institutions.
In the following section, the leading role of SURFnet in the development of the Internet in the Netherlands is highlighted through an account of the institutional and technological developments.19
4.3.1 Leading networking role by academic community
Concerns regarding the impact of micro-electronic technologies on employment led to an investigation by the Rathenau Committee. This Committee emphasized the benefits of ICTs and advised the government to introduce a more aggressive policy on the use of ICTs in 1978. This led in 1984 to the publication of recommendations under the heading ʻInformatica Stimuleringsplanʼ, which included initiatives and funding to promote ICT usage in higher education. The academic community responded and obtained governmental support for the development of a multi-year project plan, released in 1985 by the Samenwerkende Universitaire Rekenfaciliteiten (SURF) coordinating committee. In 1986 the government allocated NLG 300 million (approx. EUR 140 million) for the initial period 1987–1990 of implementation by the SURF Foundation. The data networking services to the universities and academic research centres were to be provided in cooperation with the incumbent telecom operator PTT (now KPN), for which they created a new legal entity SURFnet BV, with 51 per cent of the shares owned by the SURF Foundation and 49 per cent by the PTT.20 The fourteen universities in the Netherlands agreed to obtain their data networking services from SURFnet for the next four years. (Verhoog, Reference Verhoog2008)
On 25 April 1986 the management of the.nl domain name registration was granted to CWI. Piet Beertema became the Dutch equivalent of John Postel, until SIDN (Stichting Internet Domeinregistratie Nederland) as a foundation assumed this role in 1997. On 17 November 1988, EUnet, with its central node at CWI, received ʻInternet connected statusʼ with the NSFnet and the first connection from the Netherlands to the Internet was established by the academic research community of CWI in Amsterdam, using the first ‘.nl’ country domain name: cwi.nl. Kees Neggers assumed chairmanship of RIPE-NCC, the Network Coordination Centre for European IP organisations.21
In 1987 SURFnet1 started to connect all fourteen universities using Datanet1, the packet-switched network based on the X.25 protocol operated by the PTT.22 However, the ultimate aim was to develop one common network based on OSI-protocols that would meet the requirements of the user community. Hence, the deployment of SURFnet2, based on OSI and X.25, as of 1989.23 In 1990 SURFnet2 was fully operational using 64 kbit/s links and also provided transport facilities based on the TCP/IP-protocol using a Cisco router, introduced following its popularity in the USA.24TCP/IP appeared to operate much better than expected and by the end of 1990 the decision was taken to focus on TCP/IP and to create a multi-protocol infrastructure SURFnet3, with 2 Mbit/s connections; the first step towards broadband access. By the time of its completion in 1992, TCP/IP had become the dominant protocol. In a parallel effort, SURFNet together with NORDUnet25 created ‘Ebone’, the first European IP-backbone to become operational, in 1992. In the same year Erik Huizer became a member of the IETF and Kees Neggers was one of the founders of ISOC. (Verhoog, Reference Verhoog2008)
As the Internet became more easily accessible (e.g., through the introduction of the Mosaic browser in 1993) SURFnet observed strong growing traffic volumes and decided to become the initial customer of KPN in the implementation of an ATM-based network under the name of SURFnet4 in 1994, initially providing up to 34 Mbit/s access connections and a 155 Mbit/s data rate in the backbone; to become an IP-based backbone network with data rates of 155 and 622 Mbit/s. (Verhoog, Reference Verhoog2008)
In 1994 the plans for the Amsterdam Internet Exchange were announced. Through the AMS-IX Internet service providers (ISPs) exchange Internet traffic, a service initially managed by SURFnet. In 1997 twenty participants created the AMS-IX Association to establish a Limited Liability Company (as a not-for-profit cooperative) to assume the exploitation and operational management of the exchange in 2002. In 2003, with 178 participants, AMS-IX became the largest Internet exchange worldwide. (Verhoog, Reference Verhoog2008)
In 2000 the pilot phase of SURFnet5 started with 80 Gbit/s DWDM on glass fibre in the backbone and access connections of up to 20 Gbit/s. The network was completed by early 2002, connecting 170 institutes with approximately 500,000 users as of 2008. Even higher capacity needs were foreseen; hence, a hybrid network was developed providing IP-services next to optical network services as part of SURFnet6.26 Following experiments started in 2002, a point-to-point network of optical light paths ([lambda] s) was implemented in 2004 with a node in the Netherlands called ‘NetherLight‘ connecting to ‘StarLight’ in Chicago. The first 10 Gbit/s lightpath was delivered between the University of Groningen and SARA27 in Amsterdam in support of the Lofar project in early 2006.28 By the end of 2007, lightpath #220 was realized, the demand being much higher than anticipated, in particular for the Optical Private Network (OPN) feature. ‘NetherLight’, the node located at SARA in Amsterdam, became the European node in the GLORIAD network, a research network initiative to connect the USA, Russia and China through a global optical ring. (Verhoog, Reference Verhoog2008; SURFnet, 2009)
In a parallel development, student housing complexes also were connected to SURFnet to provide students the same facilities as they enjoyed at the university campus. In 1990 ninety students of the University of Nijmegen were connected using the RTV-cable network and in Wageningen a pilot project was also set up. In 1998 the project ‘Student Online’ was aimed at connecting as many students and university staff as possible using the telephone network. In 1998–9 a thousand people were connected to SnelNet in Amsterdam, a collaboration between KPN, SURFnet and NOB Interactive Media providing 2 Mbit/s ADSL connections with a first trial of delay TV.29 In 2000 further implementation pilot projects started with ADSL in Amsterdam, Delft and Twente, as well as the ‘Fibre to the Dormitory’ project which connected 2,600 student apartments in Delft with data rates of 10–100 Mbit/s. This project was followed by similar projects in the university cities of Groningen, Nijmegen, Enschede, Utrecht and Wageningen. Also in 2002, in the ‘Freeband Impuls’ project commissioned by the Ministry of Economic Affairs, SURFnet started trials to provide wireless access across multiple university sites for students and staff, leading to the now globally available eduroam service supporting users worldwide. (Verhoog, Reference Verhoog2008) SURFnet continues to drive the technology agenda, for instance in cooperation with mobile providers in the integration of 4G and Wi-Fi as part of the GigaPort3 project.
4.3.2 Internet access for the business user
In the business community, data networking between IBM computers was facilitated by V-net, a host-to-host file transport network, using synchronous data link protocols (SDLC) developed from 1975 onward. By 1979 it included 285 nodes in Europe, Asia and North America serving some 1,400 computer systems. The early connections operated on dial-up telephone lines supporting data rates of 1200 to 2400 bit/s. (Van de Ven, Reference Van de Ven1984; Wikipedia, 2009d) In 1989, NLnet started to provide Internet access to enterprises, using dial-up connections. (Verhoog, Reference Verhoog2008) This evolved into dedicated Internet access and IP-networking services provided by specialized companies, such as BBned, Easynet, Eurofiber, Tele2, UNET and the local branches of global operators such as AT&T, BT Global Services, Colt and Verizon.
4.3.3 Internet access for the residential user
Anticipating growing demand for end-to-end digital services the PTTs under the auspices of the ITU agreed to create a new, fully digital, circuit-switched system called ISDN (Integrated Services Digital Network). The ISDN would build upon the already digital backbone network (IDN – Integrated Digital Network) and involve upgrading the access network to digital, providing narrowband access at 2×64 kbit/s (basic rate) to the residential user and 2 Mbit/s (primary rate) to the business user. The elaboration of the ISDN recommendations in the CCITT required three four-year study periods to be completed by1988. The development of the European standard by ETSI was completed in the early 1990s. Testing ISDN in practice started with a pilot project in Rotterdam in 1987.30 Making the telephone switching systems ISDN-ready and having ISDN compatible terminals available led to a general introduction of the service in 1993. (Kaasschieter, Reference Kaasschieter1985; Ekkelenkamp, Verstraaten and Wijbrands, Reference Ekkelenkamp, Verstraaten and Wijbrands1992; Tanenbaum, Reference Tanenbaum1996)
The same year the Mosaic browser was introduced to unlock the Internet for the wider public and the Hack-Tic31 community established XS4ALL, the first dial-up Internet access provider open to the general public. (Hack-Tic, 1993)32 In January 1994, in cooperation with De Balie33, followed the inauguration of FreeNet ʻDigital Stad Amsterdamʼ aimed at bringing together citizens and policy makers in an online community (Meerman, Reference Meerman2004). VuurWerk Internet34 started in 1996 as the first entity to provide web hosting and domain name registration services. (Wikipedia, 2010b)
While the notion of integrated services such as telephony, telefax, textfax, videotext, teletext, video and teleworking, based on circuit switching was not a huge success, ISDN did provide Internet access at 64 kbit/s at the price of a telephone call. By October 2000 17 per cent of internet access connections were using ISDN.35 (CBS, 2001)
In 1996 CAI Westland36, a cable network operator in the western part of the country, was the first cable operator to provide Internet access, using the DEMOS-1 system of DeltaKabel Telecom at a data rate of 115 kbit/s, using a flat rate. (Verbree, Reference Verbree1997; Wikipedia, 2010a)37 Shortly thereafter, the major cable network providers became Internet access providers: UPC using the Chello brand name, Casema under the French Wanadoo brand, and Essent Kabelcom using the @Home brand.
The uptake of the Internet was directly related to the diffusion of PC to homes and businesses. Hence, the tax-break provided for the purchase of a ‘home PC for business use’ (PC privé project) should be mentioned as a factor that positively contributed to the adoption of the Internet.
4.3.4 Industry development and dynamics
The emergence of Internet access and service providers in the early 1990s was followed by consolidation in the late 1990s and early 2000s, driven by competition on margin and increasing needs for investment capital. The incumbent telecom operators were the main buyers, extending their ISP footprints and services portfolios. In many cases brand names were retained after an acquisition, representing a different service positioning and different market segments being targeted, including residential users and business users. In 1997 NLnet sold its commercialized Internet provision activities to UUNET, a subsidiary of WorldCom. The XS4ALL foundation was transformed into a corporation, XS4ALL Internet Ltd, in 1996 which in 1998 became a subsidiary of KPN Telecom. In 2006 XS4ALL acquired hcc!net and in 2007 Demon NL. In 1997 Planet Internet, owned by KPN, merged with WorldAccess, the ISP established by Videotex. IPS acquired WorldOnline and was subsequently taken over by Tiscali in 2000. (Meerman, Reference Meerman2004; XS4ALL, 2007; NLnet, 2010) In 2004 the Top-10 ISPs by size was composed of: XS4ALL, Demon, Planet, Bbeyond, BabyXL, VuurWerk, Tiscali, Lycos, PSINet and Wanadoo. (Meerman, Reference Meerman2004)
Internet service provision is tightly coupled to the underlying Internet access provision. For instance, cable network operators provide access only to their own ISP, while KPN provides access to multiple ISPs, both wholly owned subsidiaries and, through unbundling of its infrastructure, to independent ISPs.
4.3.5 Reflections on the emergence of the Internet.
An important engine of Internet infrastructure development in the Netherlands has been the academic community through SURFnet. Supported by additional funding from the Ministry of Economic Affairs and the Ministry of Education, Culture and Science. SURFnet has pushed the operators, KPN and Telfort, and equipment providers, such as Cisco, Lucent Technologies and Nortel, into the deployment of leading-edge technologies; as well as opening up the market for dark fibre connections. SURFnet was instrumental in the set-up of the AMS-IX, thereby creating a highly attractive up-to-date communications environment in the Netherlands. Via its ADSL and fibre to the dormitory projects, SURFnet has been instrumental in developing a market demand for broadband access at home.
More generally, the tax-break provided for the purchase of a ‘PC at home for business use’ (PC privé project) has also contributed positively to the adoption of the Internet.
4.4 Broadband developments
The telecom reform process and the emergence of the Internet have been largely independent processes running in parallel but reinforcing each other. The reform has positioned the incumbent telecom operator KPN and the incumbent cable operators for competition on access to the Internet. Real broadband developments are considered to have started in 2000 with the introduction of DOCSIS modems on the RTV-cable network and ADSL (asymmetrical digital subscriber line) on the PSTN.
4.4.1 Competition in internet access
In 1996 through a change in the Media Law, cable network operators were allowed to engage in competition. In 1997 also the provision of telecommunications services over cable networks was permitted. (MinOC&W, 2000) This allowed the cable sector to diversify its service portfolio to include Internet access and to provide voice/telephony service. This required significant investments to upgrade the cable network from one-way analogue RTV-signal distribution to two-way digital communications services provisioning. Given the broadband nature of the coaxial cable-distribution network, the cable sector took the lead in providing end-users with high data rate Internet access, up to 30 Mbit/s.38 By the end of 1999 some 130,000 digital cable modems were in operation.39
In 2000 the first ADSL connections were provided by Demon using the network facilities of BabyXL Broadband (since 2002 part of Tiscali) and by XS4ALL, providing data rates of 512/64 kbit/s (downstream/upstream) and 1024/256 kbit/s. KPN started testing ADSL as part of the SnelNet project in 1998–9 and the roll-out started later in 2000. (MinV&W, 2000a; XS4ALL, 2001; Meerman, Reference Meerman2004)40 In the following years ADSL gained significant market share.
In the ‘competition for the market’, data rates were increased step by step, resulting in a tit-for-tat competition between KPN, the wholesale-base operators BBned and Tele2, and the RTV-cable operators; only Essent Kabelcom with @Home followed a strategy of providing the highest data rate possible. (Van den Berg, Reference Van den Berg2004; Albrecht and Achterberg, Reference Albrecht and Achterberg2008)
By March 2004 the cable operators collectively provided 1 million homes with Internet access, up from 250,000 in the year 2000. ADSL services were led by KPN with 913,000 subscribers, Wanadoo 350,000 (which includes cable access), Tiscali 140,000 and Zonnet 127,000. In 2004, 50 ISPs served a total of 4.5 million online households, approximately 65 per cent of total households. (Meerman, Reference Meerman2004)
By 2008, fixed broadband connections appeared to have reached a saturation level with approximately 5 million connections. The market share of ADSL was stabilizing, reaching 45 per cent (Kool, Arno, De Munck and Huveneers, Reference Kool, Arno, De Munck and Huveneers2008).
The competition in Internet access resulted in a top-two position in the penetration of broadband within Europe; whereby broadband was taken as downstream capacity equal to or higher than 144 kbit/s. (EC, 2008a) In terms of the broadband performance index, again, the Netherlands assumed a top-two position, measured as a composite index of socio-economic context including the uptake of advance services, data rates, price, competition and coverage. (EC, 2008b)
With the market reaching apparent saturation, the ‘competition in the market’ increased in importance, and the ‘race on speed’ continued, with, for instance, UPC increasing the download data rate to 120 Mbit/s for its premium subscription offer in Amsterdam (NRC, 2008), and Ziggo announcing the upgrade from DOCSIS 2.0 to 3.0. (De Vries, Reference De Vries2009)41
4.4.2 Competition in voice
Competition between the CATV and PSTN networks started with Internet access. However, following the end of the PTT monopoly on telephony, the cable companies were allowed to provide voice services. Initially various techniques and standards were used, with very limited success. From 2004 onward the standard technique became Voice over IP (VoIP), supported by DOCSIS 1.1. The flat-fee-based offering was most attractive. In 2005 KPN responded with the introduction of VoIP based on ADSL, also on a flat-fee basis.
In 2004 Caiway started offering telephone service over the cable network. (Wikipedia, 2010a) In 2005 XS4ALL introduced VoIP, including a Webphone application as of July of 2006. (XS4ALL, 2007)
4.4.3 Competition in RTV-distribution
While the Internet protocol supports the distribution of video signals, the Internet is not ideally positioned for broadcasting TV signals in real-time. To facilitate infrastructure-based competition on the basis of Triple-play42 offerings – television, telephony and internet combined – a consortium of KPN with broadcasting entities obtained a license for nationwide terrestrial distribution of digital radio and television signals (DVB-T). The number of channels was limited to 23 TV-channels, plus 19 radio channels. In 2003, the service was launched under the name ‘Digitenne’ with country-wide coverage becoming possible after the shut-down of analogue TV broadcasting, the so-called Digital Dividend.43 Meanwhile, KPN obtained 90 per cent of the shares and is now the sole provider of digital terrestrial TV broadcasting. The content is provided by the NPO (National Broadcasting Organisation) and by KPN. (KPN, 2009; Wikipedia, 2009b)
Also in 2003, KPN started to offer Video-on-Demand (VoD) via the Internet. From 2008, the company has added DVB services to handheld devices (DVB-H). Subsequently this services was terminated as TV-over-LTE is the more future-proof alternative.
From 2005, the major broadcasting stations also started to use the Internet as an alternative distribution channel, to offer delayed viewing of their programs (e.g., www.uitzendinggemist.nl).
OPTA, the Dutch National Regulatory Authority, concluded that, despite competition from Digitenne and satellite operators, the CATV operators in their respective service areas had significant market power, and, hence, regulation was deemed necessary (OPTA, 2009a). This new regulation replaced the 2006 ruling requiring access for RTV content providers to transfer programs using the RTV transmission service provided by the cable operators (OPTA, 2006a). By the end of 2009, the cable networks were scheduled to open-up for competition through wholesale access: that is, alternative service providers may access the CATV network for the transfer of RTV-signals. However, KPN was excluded from access to the cable networks, as cable operators are excluded from access to the network of KPN. (Hijink, Reference Hijink2008) This decision was challenged in court and was rejected in August 2010; the court did not support the market analysis on the regional level. During 2011, proposals were submitted in Parliament in a renewed attempt to open-up the cable market. The new (national) market analysis by OPTA concluded that the market for digital television was sufficiently competitive and analogue television was going to be replaced by digital so there was no need for further regulation of the cable market. The regulator has retained this position for the regulatory period 2012–2014. (ACM, 2013e)
4.4.4 Reflections on broadband competition
Starting with a multitude of municipal cable operators in the 1970s the sector has been consolidating until very recently. In 2007 a major merger took place as the owners of Casema, the private equity firms Cinven and Warburg Pincus acquired Multikabel and Essent Kabelcom, to be merged into a new entity called Ziggo. The Dutch cable market is now served by two major players UPC and Ziggo, plus a few niche players.
With Ziggo owned by private equity firms, the endgame started with an IPO in March 2012. Through Barclay’s Bank as issuing bank, Liberty Global, the parent company of UPC, acquired 12.7 per cent of the shares of Ziggo in March 2013. At that time rumours about a take-over of Ziggo by Liberty started to appear in the press. By July Liberty had extended its position to 28.5 per cent. In October 2013 Ziggo confirmed the receipt of a tentative take-over offer by Liberty, which they rejected as inadequate. Ziggo confirmed it was in discussion with Liberty Global in December 2013. Early in January 2014, Bloomberg reported that the take-over could be concluded shortly.44
KPN is the leading provider of ADSL under multiple brand names, in part acquired through consolidation (Het Net, Planet, XS4ALL). Moreover, through unbundling, other ADSL providers make use of the local loop owned by KPN (e.g., BBned/Tele2). The market is segmented as not all users require the highest possible data rates.
The market for broadband has become characterized by a techno-duopoly, consisting of KPN and its retail providers, providing broadband services on a national basis using the PSTN, and two major cable providers, Ziggo and UPC, each operating in a different part of the country, collectively providing close to national coverage, using the RTV network. There is strong competition in the market, based on price and data rates provided.
The question that can be raised is whether two competing firms are enough for a healthy development of the sector. (OPTA, 2006b) Clearly, the incumbent players are optimizing the utilization of their networks through an evolutionary approach. While fibre plays an important role in this evolution in the backbone and metropolitan networks, as well as in the feeder network to the street cabinets (FttC), the transition to FttH is apparently not (yet) attractive enough or considered not (yet) necessary from their business perspective. Third parties, in particular municipalities, were claiming ‘market failure’ and hence taking initiatives for the development of Fibre-to-the-Home – considered as the (more) future-proof trajectory.
This claim of ‘market failure’ has been investigated by the CPB, the Dutch bureau for economic policy analysis, following questions raised in Parliament. (Van Dijk et al., Reference Van Dijk, Minne, Mulder, Poort and Van der Wiel2005) The core question was whether the then-current developments would be sufficient to match the increasing demand for broadband.45 The investigation concluded that ʻmarket failures in the Netherlands are limited to market power and, to some extent, to an increase in spill-over effects of knowledge. Current regulation by OPTA (the national regulatory agency) adequately deals with the issue of market power.ʼ The investigation suggested that ʻthe markets for broadband in the Netherlands function well in terms of competition (static efficiency) and innovation (dynamic efficiency). Hence, the best policy is to rely on market forces.ʼ
The central government’s policy remained focused on facilitation of, rather than intervention in, the development of broadband markets in general and the deployment of FttH in particular. But it did not prevent or block local governments from becoming involved, to a degree.
4.5 Developments towards FttH – telecom 3.0 and policy 3.0
For the first FttH deployment in the Netherlands we have to go back in time to 1991. In that year the first Fibre-to-the-Home (FttH) trial was carried out by the PTT in Amsterdam. The objective was to obtain operational experience, the principle technologies having been tried as part of national (COSNET) and European (RACE 1010) research programs. (Tromp, Nijhuis, Boomsma and Bakker, Reference Tromp, Nijhuis, Boomsma, Bakker and Lemstra1991; Van Bochove et al., Reference Van Bochove, Van Deventer, Hooijmans, Tomesen, Mols, Khoe and Lemstra1991) The prevailing idea was to come to one national fibre infrastructure that would provide telephony, RTV-distribution and broadband-ISDN services. The roll-out was foreseen to start in 1993. The lack of willingness of the CATV operators to cooperate with KPN in one network roll-out, and the subsequent lack of support in Parliament brought this idea to an end.
However, in the new Telecom 2.0 – Policy 2.0 environment, the idea of a nationwide fibre network to the home re-appears. In 2003, KPN launched the ‘Deltaplan Glas’ initiative.46 The plan was aimed at creating a fibre network covering 80 per cent of the homes by 2010, based on collaboration between the government and the industry at large. The plan argued a case of proven technology, the fibre access network being a natural monopoly, and competition to take place on the services level. The investments, estimated at EUR 8 billion, would be based on private and public contributions; the investments were considered to be of strategic importance for the nation. (KPN, 2003) The response from the cable sector was very similar to the initiative in 1993: ʻWhy would a cable company assist the competition, as they are experiencing the limits of ADSL?ʼ (Crommelin, Reference Crommelin2004)
Meanwhile, the penetration of fibre in the CATV networks had reached the street cabinets. The extension to the home remained a matter of economics and competition. As a result no FttH deployments were pursued by the operators. The apparent status quo or competitive hold-up appears to result from a high degree of uncertainty surrounding the business case for FttH, related to high investment costs, uncertainty in demand, lack of visibility with regard to ‘killer applications’ associated with a high willingness to pay, and the uncertainty regarding the regulation of FttH infrastructure in the future.
Notwithstanding, the deployment of fibre in the backbone network has been explosive during the euphoric period in the late 1990s, leading to what has been called a ‘fibre glut’. During the same period many metropolitan fibre networks were rolled out, primarily connecting business users. (Lemstra, Reference Lemstra2006) In ʻgreen fieldʼ situations, the business case for FttH is much easier to make, so KPN has implemented Fibre-Only networks in two new city developments – in Amsterdam and in Utrecht. In a similar case Caiway, the cable operator, build an FttH network in the new housing area Woerdblok, in the city of Naaldwijk, providing HDTV, VoIP, and Internet access. (Wikipedia, 2010a)
4.5.1 Towards policy 3.0
In this section the role of the government in broadband development in general and FttH in particular is reviewed, starting with the Lisbon Agenda formulated in 2000. (EC, 2000).
In the translation of the Lisbon Agenda into national policy, the Dutch government emphasized access to a high quality broadband infrastructure, whereby it assumed a technology-neutral position, driven by the opportunities these networks provide, rather than the technology or data rates being deployed. In short, the market should do the job. (MinEZ, 2004)
Nonetheless, the market can be assisted by providing information and reduced uncertainty. A number of investigations and reports by the Ministry of Public Works or the Ministry of Economic Affairs47 were published around the year 2000, all aimed at broadband development: ʻDe Digitale Delta: e-Europa voorbijʼ (the translation of the eEurope Action Plan into national policy actions), ʻBouwstenennotitie breed-bandʼ (Building blocks for broadband), ʻSlim Graafwerkʼ (Clever trenching). Also in support of the municipalities wishing to contribute to the topic: ʻBreedband Internet voor/door Gemeenten – Stedenlinkʼ (Broadband Internet by and through municipalities) and the ʻGedogen mits…of een totaal andere wegʼ (Position paper on underground infrastructures and trenching rights) by the VNG (Cooperation platform of Dutch municipalities). (MinEZ, 1999; MinV&W, 2000b; Maclaine Pont and Van Till, Reference Maclaine Pont and Van Till2001)48
In the report De Digitale Delta the Dutch government outlined its ICT-related policy objectives as follows:
(1) the availability of a first class, affordable, accessible and reliable telecommunications infrastructure;
(2) highly developed knowledge base and knowledge infrastructure and high degree of innovation based on close interaction between suppliers and users of ICT applications;
(3) professionals and citizens that have access to the latest electronic media and are capable of exploiting its opportunities;
(4) laws and regulations that facilitate the development and application of ICT; and
(5) optimal use of ICTs in the governmental sector, which may serve as exemplar of ICT-usage. (MinEZ, 1999)
In 2000, the Ministry also took the initiative to create ʻKenniswijkʼ (Knowledge Quarter), a real-life environment to ‘test the consumer market of the future’, aimed at (1) breaking the perceived deadlock between infrastructure development and service development; (2) to improve the competitive position of the Netherlands; (3) to share the knowledge obtained through ʻStedenlinkʼ (City link); and (4) to provide input for government policy. The all-fibre pilot project in the city of Nuenen, involving 7,500 households in an area representative of the Dutch population, was part of the ʻKenniswijkʼ project. (Kools and Serail, Reference Kools, Serail, Onderzoeksreeks and Zaken2003)
By 2003–2004 the focus of the telecom policy was on assuring the proper functioning of markets and consumer protection, with an emphasis on continuity, safety, trust and quality. (MinEZ, 2003) Based on the ʻBreedbandnotaʼ , which recognized the various perspectives of market parties in relation to the roll-out of broadband, the policies can be summarized as shaping favourable preconditions for broadband development. (MinEZ, 2004)
4.6 Municipal FttH initiatives
As in the beginning of century the digital transmission capacity of copper lines was beefed-up through the use of modems, these were perceived as being limited in the data rates they could supply (ADSL up to 2 Mbit/s – and subject to the length of the copper line; cable modems up to 30 Mbit/s shared – 1.5 Mbit/s on average). The future-proof technology was considered to be optical fibre, of which the capacity runs into the Gigabit/s range. The transition towards such a future-proof infrastructure was readily recognized by municipalities, as it would facilitate the benefits they may be able to obtain from the ‘knowledge economy’ and ‘information society’.
4.6.1 The FttH case of Amsterdam
In 2001, the City Council of Amsterdam, observing ad-hoc plans being made for the deployment of fibre to the business and fibre to the home by private parties, placed the topic of fibre networking on the political agenda. The Council was concerned about a possible ‘digital divide’ emerging in the city, which was considered economically and socially undesirable. A second reason for involvement was the wish to channel the related digging activities to reduce the level of inconvenience to the public.
To address the issues properly, the City Council commissioned an investigation into: (1) the economic and social importance of FttH; (2) the expected capabilities of the existing infrastructure; (3) the expected demand for broadband by small firms and citizens; (4) whether the City should exert any influence on the developments; (5) if so, what goals should be pursued and what instruments should be used; and (6) what might be the financial implications. The resulting report Amsterdam the Big Cherry?, issued in 2002, concluded that the market will most probably not deliver an open infrastructure, nor fibre connections to every home and enterprise in Amsterdam, within the next 15 years. Hence, considering the economic and social importance, the local government may wish to take the initiative and guide the developments towards the creation of an open fibre infrastructure. (Weeder and Nijland, Reference Weeder and Nijland2002) Based on the report, the City Council decided to investigate a more active involvement in the roll-out of a dense open-access fibre network. The next steps were investigated by a committee chaired by former Minister of Economic Affairs Andriessen. Meanwhile, the City Council decided to pursue fibre deployment in a new-built city area called Zeeburg. In 2003, the Andriessen report provided the necessary guidelines for the implementation of a city-wide FttH project, as a public-private partnership (PPP): the implementation of an open-access, passive network infrastructure, supporting service level competition. (Weeder, Nijland and Hotho, Reference Weeder, Nijland and Hotho2003) The recommendations were turned into an implementation plan ʻAmsterdam: breedband in bewegingʼ which was ready in 2004. (Weeder, Nijland and Konijn, Reference Weeder, Nijland and Konijn2004; Citynet, 2009)
By 2004, out of the top-30 cities49 in the Netherlands 29 cities had (draft) plans for implementing fibre networks to connect governmental buildings, 23 had plans for Fibre-to-the-Business, and 15 had plans for Fibre-to-the-Home. (Linssen, Reference Linssen2005) One of the smaller but highly important initiatives was by the municipality of Appingedam. Early in 2004 it decided to commence the network roll-out, but had to interrupt the work within a few months, following a court decision in a case filed by the local CATV operator (Essent Kabelcom) against the city. The court decided that the initiative had to be presented to the European Commission for approval of (alleged) state support. The decision by the European Commission, issued in 2006, concluded that in this case financial support by the state was not allowed, given that the newly built network would represent unfair competition with the broadband networks of KPN and Essent. (Weeder, Nijland and Konijn, Reference Weeder, Nijland and Konijn2004; Schouten, Reference Schouten2006) Subsequently, Amsterdam and other municipalities filed their applications for EC approval, making sure their financial involvement was provided on the basis of the so-called ʻmarket economy investor principleʼ.
In 2004, the municipality of Amsterdam started the European tendering process for construction of the network, resulting in the award to the combination of contractors BAM/DRAKA in 2005. In a negotiated arrangement, the exploitation of the fibre network on a wholesale basis was awarded to BBned to provide open, non-discriminatory access to retail operators. Subsequently, for the implementation of the fibre network, the city established a limited liability company Glasvezelnet Amsterdam (GNA) in 2006, in which the municipality participates for 1/3, the four housing corporations for 1/3, and investors for another 1/3; each party contributing EUR 6 million. (Citynet, 2009) This enabled the first phase of implementation, 40,000 connections, to start in 2006, subject to approval by the European Commission which was granted in December 2007. (NRC, 2007) It should be noted that UPC, the regional cable operator, has contested the fibre network plans of the municipality in the courts, at national and European level, albeit in vain.
Nonetheless, the debate on the involvement of municipalities in telecom infrastructure development in the Parliament resulted in tighter rules for participation of municipalities (and housing corporations) in telecommunication projects, becoming part of the 2006 revision of the Telecom Law. (Doorn, Reference Doorn2006; NU.nl, 2006) However, most of these restrictions were removed in the 2010 revision of the law, as part of an overall revision of laws and regulations to stimulate the growth of the economy following the crisis.50
4.6.2 The FttH case of Almere
Another municipality placing fibre high on the political agenda was Almere – near Amsterdam – a young and fast-growing city in the reclaimed Flevopolder. As a city with the ambition to leverage ICTs in all fields under its responsibility, including housing, employment, leisure and care, and inspired by the Stokab model in the City of Stockholm51 and information from a fact-finding mission in the USA by the Ministry of Economic Affairs, it commissioned a study ʻAlmere op glasʼ in 2001. (Stratix, 2001) This study suggested an active role for the local government to implement an open-access ʻFirst Mileʼ infrastructure in a new city development, Almere Poort. It proposed a demand-driven community-based network, whereby the municipality leverages its role given by the Telecom Law to coordinate infrastructure developments. The city would take the lead in creating the civil infrastructure as a public domain activity. A separate entity (net-co) acting on behalf of the users would be responsible for the implementation and exploitation of the network, subject to a tender. The end-user services were to be provided in competition. As such a maximum degree of unbundling would be achieved. By the city taking the lead in the realization of this network, the need for operators to create another fibre network in parallel would be pre-empted, but not excluded. By leveraging the use of the network by government institutions, including city offices and schools, effective demand aggregation and efficient roll-out of the network would allow prices for fibre to be similar to those of ADSL.
In the next phase three parallel developments became important. The City Council preferred as a first project connecting an existing city area that required an economic boost as it was suffering from a relatively high degree of unemployment. At the same time the City wanted to attract high-tech industry and institutions, such as the Institute for Information Engineering (linked to the Technical College in Amsterdam) and a division of SARA. These institutes require high data rate connectivity and thus connections with AMS-IX were established in 2001. This in turn made it attractive for BT and later Global Crossing, KPN and COLT also to set up facilities in Almere. Interactions with the existing operators showed that they were reluctant to participate in the pilot project due to conflicts of interest and a lack of willingness to assume risk. This combined result provided the momentum for the pilot phase of the project to be directed by the City, ultimately targeting 1,700 homes and 450 businesses in business parks, to be connected in 2003.52 The project was subsidized with EUR 1 million by the Ministry of Economic Affairs. A special entity, the Almere Fibre Company Ltd (AFCo), was established for the implementation and maintenance of the civil works, with the City as the owner. In the subsequent tender process the newly established First Mile Venture (later to acquire the ISP Unet and to assume this name) was selected as the infrastructure operator. (GemAlmere, 2004; Jansen, Reference Jansen2004; Halsema, Reference Halsema2012)53
The FttH part of the project was not successful because the willingness to pay was too low, resulting in a too low uptake but the FttB was successful and that became the focus of Unet’s business. In 2006 the City followed up with a demand-aggregation project among local institutions, administrative buildings, schools, health centres, etc., leading to an FttInstitute project to connect 200 locations with fibre. The tender was won by Unet. This was followed by an FttB-project expanding the backbone to connect all business parks by fibre. The FttH initiative was rejuvenated by the idea of modelling it on the Amsterdam arrangements with 1/3 participation by the City, 1/3 by housing corporations and 1/3 by private investors. Initially KPN decided not to participate in the venture, but at the end of 2007 it joined the project with Reggefiber. Based on the evaluation of the pilot, the City made internal rearrangements such that implementation approvals could be obtained in 1–2 weeks rather than 13 weeks. This facilitated the connection of 60,000 homes within two years. XMS and Lybrand became new service providers, in addition to KPN and XS4ALL. By taking a leading role and being prepared to kick-start the project with pilot funding, the City of Almere assured that the private sector is actively deploying Fibre-to-the-Home in new and existing parts of the city. (GemAlmere, 2004; Jansen, Reference Jansen2004; Halsema, Reference Halsema2012)
4.6.3 Reflections on municipal initiatives
The involvement of so many municipalities in fibre initiatives, large and small, suggests that infrastructure supply is considered very important for economic development; the case of Almere is a clear example. The awareness of limited bandwidth available on copper and perception of fibre as future-proof explains their early involvement. While there were many initiatives, not too many have ultimately led to the actual deployment of municipally-led fibre. Issues around alleged state-aid, requiring upfront clearance, and the issues of funding and managing have been too cumbersome in many cases. Nonetheless, the push by municipalities has forced earlier deployments although in the end it have been commercial parties which became involved in the implementation and operations of municipal fibre networks, in part or in whole. See also Section 4.8 on Reggefiber and Chapter 7 for the municipal fibre deployments in Sweden.
4.7 The transition to All-IP
Another important development worth discussing is the transition of the PSTN from a circuit-switched network to a packet-switched network, becoming All-IP.
At the end of 2005, KPN announced plans to migrate its network to All-IP. The transition was considered necessary to remain competitive in broadband, to achieve cost reductions and to replace the network considered to have reached its end of life. Along with the upgrade of the core network to IP, the plan implied an upgrade of the feeder network to Fibre-to-the-Cabinet. With a shorter copper loop, broadband services using VDSL with data rates of up to 50 Mbit/s would become feasible.54
This plan was welcomed by the telecom regulator, OPTA, as a clear sign of investment in infrastructure; however, it impacted Policy 2.0, in particular with respect to unbundling, which hinges on access to the copper loop at the MDF in the central office. The KPN plan implied abolishing the MDFs in 1,361 exchange locations, to be replaced by approximately 200 ‘Metro Core’ locations. The access to the copper loop remained possible at 28,000 street cabinets. Although sub-loop unbundling is part of Policy 2.0, the service was not taken up, as access at the exchange level is financially much more attractive. The matter to be resolved is whether sufficiently attractive alternatives to MDF access were available to the alternative operators. (OPTA, 2006c)55 Early in 2007, OPTA called upon all parties to come to an agreement on the phasing out of MDF-based access. This led to memorandums of understanding (MoUs) with the main parties: KPN and BBned, Orange and Tele2. However, reaching a final agreement was difficult. By February 2008, KPN submited an ʻMDF migration agreementʼ. Recognizing that the All-IP project impacted many regulated market segments, OPTA decided to incorporate the impacts of All-IP in a general review of the markets, to be issued by the end of 2008. (OPTA, 2008a) After consultation with market parties, OPTA issued this new regulation with respect to the unbundling of the KPN access network to include sub-loop unbundling and an associated backhaul service (OPTA, 2008c).
4.8 The emergence of a new actor – Reggefiber
A new trajectory in broadband development started from an unexpected source, the civil engineering and construction industry.
The competition played out between KPN, UPC/Ziggo and BBNed/Tele2 had led to high broadband penetration and to increasing data rates. The competition led to FttC, but not to FttH deployment. And while KPN prepared its All-IP strategy in 2005, private equity firm Reggeborgh formed the optical fibre company Reggefiber, creating a new actor that reshaped the telecom scene.
Reggeborgh is the investment vehicle of Dick Wessels. Wessels had created the Wessels Group, active in building construction activities in the Netherlands and abroad. In 1990, the family-owned firm merged with the publicly listed IBB Kondor. In 1997 they in turn merged with Koninklijke Volker Stevin, which was the result of earlier mergers in the infrastructure construction industry. The expertise of the Group in telecommunication obtained a boost when KPN transfered its infrastructure design, engineering and implementation subsidiary KPN Netwerkbouw which became the subsidiary VolkerWessels Telecom in 2002. (NMa, 2002; VolkerWessels, 2009)
The creation of Reggefiber resulted from an initiative by housing corporation Portaal, which planned to install fibre to the houses owned by Portaal. VolkerWessel Telecom had already been selected for the implementation. The need for investment capital led to Reggeborgh. From investment partner, Wessels became entrepreneur in fibre networking through the founding of Reggefiber. (Dekker, Reference Dekker2007)
In its business approach, Reggefiber took a long-term perspective on fibre deployment, applying a real estate model.56 The objective was to reach a level of 2 million households by 2013, based on the principle of a passive infrastructure with open access. (Reggefiber, 2009)57 Early projects included the cities of Deventer, Nuenen, and Hillegom. In 2006, Reggefiber became one of the investors in the Citynet project in Amsterdam. To link the various FttH projects, Reggeborgh acquired fibre backbone provider Eurofiber in 2006. (Dekker, Reference Dekker2007)58 In 2007 KPN and Reggefiber announced their cooperation in providing FttH to 70,000 households in the city of Almere. (Almere Kennisstad, 2007)
The emergence of Reggefiber as a new player in the infrastructure arena changed the competition dynamics, as the initiatives by municipalities and housing corporations were not isolated any more but became linked. It appeared that Reggefiber was taking the ‘first mover advantage’, and was changing the rules of the game forcing the incumbent infrastructure players into services competition. Hence, the strategic move by KPN, to create a joint venture with Reggefiber to provide FttH on a nationwide basis and to take a 41 per cent share (with an option to increase to a majority position) in the venture in May 2008, did not come as a surprise.
The participation of KPN in the joint venture with Reggefiber required approval by the competition authority NMa. Following an analysis in collaboration with OPTA, this approval was granted in December 2008. (NMa, 2008; OPTA, 2009c) A condition of the approval was that the fibre networks being deployed by the joint venture were to be open to other providers on a non-discriminatory basis.
Through the joint venture, KPN obtained influence on the exploitation of fibre networks in Amsterdam, Amersfoort, Deventer, Eindhoven, Nijmegen and a number of smaller towns, a total of 180,000 connections. (Olsthoorn, Reference Olsthoorn2008) The appointment of Davids, former Senior Consultant,Corporate Strategy at KPN who had been involved in the development of KPN’s vision of fibre networking, to become Director, Wholesale and Business Development at Reggefiber in February 2009 was a logical next step. (Reggefiber, 2009; Van Gool, Reference Van Gool2009) Also in February 2009, Reggefiber increased its share in the Amsterdam fibre project to 70 per cent, while the municipality and the housing corporations reduced their share to a combined 30 per cent. (Dongen, Reference Dongen2009)
Influenced by these developments, OPTA issued a new wholesale regulation, including the unbundling of fibre at the Optical Distribution Frame. It based its analysis on the real-life case presented by Reggefiber. In the network architecture of Reggefiber the Area-PoPs serving approximately 2,500 homes are linked through a backhaul to a City-PoP serving approx. 20,000 homes (OPTA, 2008d, 2009b). Simultaneously and based on market consultation, OPTA issued a tariff regulation, based on a long-term horizon and aimed at large-scale build-out of FttH, using tariff caps at EUR 14.50 to EUR 17.50, depending on the capex level required (EUR 775-825 and EUR 975–1025 respectively). (OPTA, 2008b, 2009b).
Another ‘third actor’ on a separate trajectory in FttH deployment, the Amsterdam-based communications infrastructure fund CIF, started with the acquisition of cable assets owned by CaiWestland (Caiway) to upgrade these to FttH and has since expanded through further acquisitions of smaller cable operators, mainly in the western and eastern parts of the country. Caiway is the service provider on these networks. Through CIF, FttH projects are being implemented in about 20 municipalities.59 As of September 2012, FttH projects were being implemented in 210 municipalities, an increase of 70 municipalities since 2011. (Stratix, 2013)
To complete the landscape of FttH deployments, the end-user as ‘third actor’ should also be mentioned. A salient example are the residents in Hazenkamp, a suburb of the city Nijmegen, who established the Glazenkamp foundation to serve approximately 2,900 homes with FttH, with an uptake rate of 66 per cent.60
4.8.1 Policy 2.0 applied to telecom 3.0
As to be expected, the decisions by the NMa/OPTA were challenged in court, by cable providers UPC and Ziggo, alternative network providers BBned and Tele2, as well as ISPs Scarlet and Online, a subsidiary of T-Mobile (Emerce, 2009). Notwithstanding, the adaptation of the regulation by OPTA to accommodate the deployment of fibre to the cabinet and fibre to the home remained. The principle of open-access fibre networks, initiated by Reggefiber, became part of the regulation, as KPN became a shareholder in Reggefiber. The use of an actual fibre business case as starting point for setting the wholesale tariffs was novel. Therefore, we may conclude that so far Telecom 3.0 did not require a new policy but, rather, an extension of the existing Policy 2.0 to Policy 2.5.
4.9 The broadband market today
In this section the current outcome of these broadband developments is described and the prospect of achieving the Digital Agenda targets is assessed. For a comparison with the outcome of the other country case studies please see Table 1.2 and 1.3 in Chapter 1 Introduction. The data is derived from reporting by the NRA – OPTA (now ACM)61 – and from reports commissioned by the NRA. (OPTA, 2010; ACM, 2013a, 2013b, 2013c, 2013d; Telecompaper, 2013b) The number of households is derived from the National Statistics Office. (CBS, 2014)
4.9.1 Fixed broadband
Following a stabilization in broadband uptake around 2005, the increasing use of video on the Internet has driven the competition for higher data rates. ADSL2+ is being replaced by VDSL and the capacity of VDSL is boosted through vectoring and bonding. While the maximum data rate on the copper twisted pair was 8/0.5 Mbit/s (download/upload) for ADSL and 24/1 Mbit/s for ADSL2, with the combination of FttC and VDSL data rates of 50/5 Mbit/s can be provided and with vectoring 80/8 Mbit/s becomes feasible. KPN started deployment of vectoring in September 2013. On the CATV network with the combination of FttC and DOCSIS-3 data rates in excess of 100 Mbit/s can be provided by reducing the number of users sharing the capacity, with further upgrades possible. (TNO, 2012)
By mid-2013 the total broadband connections stood at 6.7 million or 88% of households (total: 7.6 million).62 DSL connections stood at 3.2 million or 48% and CATV connections at 3.0 million or 45%, while fibre accounted for 0.46 million or 7%. This implies a decrease 6.2 percentage points for DSL compared to 3Q2011 and an increase of 3 percentage points for CATV connections. The growth is small: over the last eight quarters the percentage of additions was 4.23% and exceeds the percentage of disconnects of 3.37% by only 0.9%.
Unbundling plays an important role with 3.2 million unbundled lines (44% of total) of which 78% is fully unbundled and 22% shared.
Broadband is increasingly subscribed to as part of a triple-play bundle, up from 39% to 56% over the period from mid-2011 to mid-2013. Broadband-only subscriptions dropped from 28% to 18%. The total number of bundled subscriptions reached 5.5 million by mid-2013, or approximately 75% of households.63
By mid-2013 broadband by download data rate provides the following picture:

Relative to the Digital Agenda targets for 2020, the target 100% of households having access to up to 30 Mbit/s is largely accomplished, with 7.4 million or 98% of homes connected to the cable network. With 2.5 million homes (33%) subscribed to up to 30 Mbit/s and 0.4 million (5%) over 30 up to 100 Mbit/s, achieving the subscription target of above 100 Mbit/s is still further away. Nonetheless, progress around 10% over the last two years in the category ≥ 30 Mbit/s – < 100 Mbit/s is promising. See Figure 4.1.

Figure 4.1 Broadband connections by data download rate as percentage of total, the Netherlands, 2011–2013
Moreover, the FttH deployment by Reggefiber is picking up pace. See Figure 4.2.64 According to Stratix Consulting, the deployment of FttH in the Netherlands had reached the level of 1.9 million homes passed (25.1% of the total) and 626,000 homes subscribed (8.3%) by September 2013. This represents a conversion rate of around 30%. (Stratix, 2013).

Figure 4.2 FttH deployment in the Netherlands, 2006–2013
Voice-over-Broadband reached 4.9 million connections, or 68% of total retail fixed telephony connections, with 9% ISDN and 23% PSTN (grand total: 7.2 million – 95% of households) by mid-2013. The average disconnect rate of 3.31% over the last eight quarters is slightly lower than the connect rate of 3.56%. Between end-2006 and the end-of 2012, fixed telephony revenues dropped by 30%.
RTV subscription revenues amounted to EUR 1.62 billion for 2012, this represents 7.4 million subscriptions. The share in revenue of non-cable operators has grown from 5% in 2006 to 24% in 2012 and, in terms of subscriptions, to 35%.
The importance of bundles increased to reach 50% for TV as part of triple-play and 9% for TV as part of dual-play with broadband by mid-2013. TV-only dropped from 57% to 40% between mid-2011 and mid-2013. Telephony as part of triple-play increased from 34% to 52% over the same period. Telephony-only dropped from 46% to 33%.
TV services are increasingly delivered as IPTV and hence the number of active connections on the cable network has dropped to 4.8 million or to 64% of the 7.4 million homes connected (98% of homes)65 by mid-2013. Digital TV by technology stands at: 55% CATV; 16% DSL; 9% FttH/B; 9% terrestrial; and 11% satellite. (Telecompaper, 2013a)66
4.9.2 Mobile broadband
Although the main body of this case study has been dedicated to the development of fixed broadband, the current status of the mobile broadband market is included in this section to provide a complete market overview, in the light of the realization of the Digital Agenda for Europe. A short summary is provided on the development of the mobile market, with a focus on the number of players as an important parameter in determining mobile broadband dynamics. (MinEZ, 2010; Anker, Reference Anker2013; TNO, 2013)
Following the introduction of GSM by the PTT – now KPN – in 1994, the wireless cellular market became competitive in 1995, when Libertel – now Vodafone – won the beauty contest for a second GSM license.
In 1998, the auction of GSM-1800 MHz (called PCS at the time) introduced three more mobile players: Telfort – as a joint venture between the Dutch railways and BT; Dutchtone – backed by France Télécom and Deutsche Telekom (DT) and two major Dutch banks, Rabobank and ABNAMRO; and Ben – a collaboration between Belgacom and Tele Danmark. Shortly thereafter DT sold its interest in Dutchtone and BT acquired a 100 per cent interest in Telfort.
In 2000, the mobile broadband era started with the auction of five licenses for UMTS frequencies. All five operators plus Versatel participated. All existing operators managed to acquire UMTS licenses. Vodafone provided the first commercial service in 2004, with a data rate of 384 kbit/s. KPN followed in the same year. In 2006, T-Mobile launched its service including HSDPA, providing initial data rates of 1.8 Mbit/s, to be increased over time to 3.6 Mbit/s, 7.2 Mbit/s and later to 28.8 Mbit/s.
From 2000, a number of ownership changes followed but the number of operators stayed at five, each operating a network with (almost 100%) national coverage. In 2000, France Télécom acquired the UK-based Orange and rebranded its mobile telecommunications as Orange, hence Dutchtone became Orange. In 2001, BT divested its mobile activities to become mmO2 PLC with O2 as its brand name. Thus Telfort became O2. In 2002, O2 sold its Dutch interests to Greenfield Capital Partners, which re-introduced the Telfort brand. In 2003, T-Mobile had acquired all shares in Ben and the brand disappeared, to resurface again as a T‑Mobile brand for SIM-only subscriptions in 2008.
From 2005 a consolidation wave started: Telfort was acquired by KPN, which retained the brand and returned the second license to the government. In 2007, Orange NL was acquired by T‑Mobile and the Orange brand disappeared. Three main players resulted: KPN, Vodafone and T-Mobile.
In 2010 followed the auction of the 2.6 GHz band to expand mobile broadband capacity, with new entrants Tele2 and Ziggo4 – the consortium of the cable operators Ziggo and UPC. In 2012 followed the so-called multiband auction enabling 4G/LTE roll-out. It included the re-auctioning of GSM900 and GSM1800 spectrum, the new ‘digital dividend’ in the 800 MHz band and new, smaller blocks of spectrum in the 2.1 and 2.6 GHz bands; including the spectrum that Telfort had occupied. KPN, Vodafone, T-Mobile and Tele2 obtained licenses and thereby assured the continuation of their operations, while Ziggo4 did not obtain additional spectrum. KPN announced national coverage of LTE by the end of 1Q2014, T-Mobile aims at an 80+ per cent coverage by the end of 2014, while Vodafone has launched 4G in a few major cities, but did not communicate any further targets. Tele2 and Ziggo4 combine the use of their new spectrum with existing MVNO arrangements with T-Mobile and Vodafone, respectively, to provide national coverage. Tele2 also entered into a passive network-sharing arrangement with T-Mobile. Ziggo and UPC also push Wi-Fi as part of their mobile broadband strategy. In January 2013, KPN announced its collaboration with FON, to extend its Wi-Fi strategy based on hotspots.67
The three main MNOs plus 52 MVNOs serve the Dutch market through 70 brands, generating EUR 5.8 billion in revenues in 2012. Data revenues (excluding SMS) have grown from just under 25%, reaching 35% by mid-2013. SIM-cards in the market reached 22.1 million in 3Q2012, with KPN (including its MVNOs) as the market leader with 47% of SIMs; Vodafone followed with 29% and T-Mobile with 24%. MVNOs accounted for 20.3% of total SIMs and 15% of revenues. ARPUs per operator ranged from EUR 21.70 to EUR 25.50. Broadband connections (combined and broadband-only) reached 52% and M2M an additional 5%. On 6 January 2014, the LTE coverage by KPN was 71% by population and 45.6% by area; Vodafone 30% and 12.5% respectively; and T-Mobile 21.7% and 6.5%, respectively, while Ziggo/UPC and Tele2 had established only the minimums required by their coverage obligations.68
Since 2Q 2010, more calls are made on the mobile network than on the fixed network. The number of mobile calls over the period 2010–13 remained flat. As of 2H 2010 the number of SMSs started to fall, to stabilize at 50% in 2013, while the revenues dropped by close to 30%. The data volume doubled over the period 3Q 2011–2Q 2013 and the retail revenues by a factor of 2.3.
4.10 Case analysis
The case summary is provided with reference to the research questions formulated in Chapter 2 Research context and perspective.
Starting conditions
Fixed broadband developments in the Netherlands have benefitted from favourable starting conditions, which include almost 100 per cent connection of households to the PSTN and almost 95 per cent to the CATV network, allowing intense infrastructure-based competition to develop. The country enjoys a relatively high level of GDP per capita. Relatively favourable conditions for the deployment of fibre exist: the country has a high population density and is flat. However, little use can be made of ducts as most of the cables are buried directly.
Joining the European Union and the application of the regulatory framework
The Netherlands has been a founding member of the European Coal and Steel Community, the precursor of the EEC and the EU. Transposition of the EC Regulatory Framework has in general been timely. Nonetheless, the Dutch are not necessarily followers: municipal activities have pushed the clarification of state aid and provision of guidelines; more recently their net neutrality legislation was a first in Europe.
Role of the central government
In broadband development, the central government has been a facilitator: formulating a broadband agenda, sharing goals and information, attending to both demand and supply conditions. By creating a strong regulatory function a fairly level playing field was created. Market entry was facilitated, as no licenses were required, only registration. While the decisions of the NRA are challenged in court almost by default, there appears to be progress and no enduring contentious issues. With reference to the perception of government’s role in Chapter 2 Research context and perspective, the Dutch government can be characterized as more regulatory than developmental, with the exception of stimulating innovation through the support of SURFnet. Policies have been fairly constant under changing cabinets, although the role of municipalities in fibre developments has been appreciated differently at different times.
Role of the academic community
While in most countries the academic community has played an important role at the time of the emergence of the Internet, with SURFnet its leading role has continued until today. The academic community, with financial support of the government, has been instrumental in pushing the technological frontier, resulting in the leading position of AMS-IX and the favourable infrastructural conditions for Internet firms to operate in and from the Netherlands.
Role of the local and regional government
Municipalities have played an important role in pushing the broadband agenda. First of all, they were instrumental in the development of the cable networks, which allowed infrastructure-based competition in broadband to develop. Subsequently, they enabled competition through the implementation of a ‘liberal’ right-of-way policy. More recently, they were important actors in driving the FttH agenda. This applies to the very large cities and to the smaller communities. Their influence was strongest in the early part of the decade as copper was perceived to be very limited and fibre as future-proof. It has resulted in much higher broadband awareness and an accelerated deployment by private parties. Also, provincial governments are increasingly active in stimulating or orchestrating broadband developments, in particular fibre deployments in so-called ʻwhite areasʼ.
Recurring theme
The notion that high-quality broadband infrastructure is important to the country has led to recurring initiatives to invest in a ‘national broadband network’. In the early days it was rejected by Parliament wishing to avoid too much power in the hands of the incumbent; more recently private actors preferred competition over collaboration.
Intensity and type of competition
In the early days of liberalisation and enabled by the Internet/telecom boom, many new entrants fuelled the competition: utility corporations turning into telecom operators, start-ups and entries from abroad. Consolidation followed the collapse of the telecom bubble and has become a constant factor: only a few alternative operators have survived serving the consumer market; a few more (mainly local operations of large telecom operators abroad) serve the business market. Competition is intense, infrastructure-based and access-based.69 The nature of competition has evolved from price-based to become driven by providing higher data rates against relatively constant prices, with (waves of) special discounts to attract new customers.
Other actors
It has been ‘third actors’ – actors not directly involved in telecommunications provision, such as municipalities and housing corporations – that have stimulated broadband developments. A special and highly influential ‘third actor’ has been Reggefiber. Through the deployment of open-access fibre networks it has effectively broken the strategic ‘waiting game’ of PSTN and CATV incumbents with respect to fibre to the home deployments. And then there is another third actor: CIF (originally Rabo Bouwfonds – Communications Infrastructure Fund), the investment vehicle which has taken over several small CATV companies to convert their networks to FttH.
Achieving the Digital Agenda targets
The target of 100% of households having access to ≥ 30 Mbit/s is largely accomplished, with 95% of homes connected to the cable network which enables data rate of 100+ Mbit/s. With 33% of homes subscribed to data rates of ≥ 30 Mbit/s and 5% to data rates of 100 Mbit/s or above, achievement of the 50% subscription target of above 100 Mbit/s is still further off. Nonetheless, progress around 10% in the category ≥ 30 Mbit/s – < 100 Mbit/s over the last two years is promising. Moreover, the roll-out of vectoring and bonding by KPN is planned to reach 70% of households by the end of 2014, facilitating data rates at or above 40 Mbit/s. Furthermore, FttH deployment is picking up pace. The deployment of FttH has reached the level of 25% of homes covered and 8% of homes subscribed by 2Q 2013. This represents a conversion ratio of around 30%. At the beginning of January 2014, the LTE coverage by KPN was 71% by population and 45.6% by area; Vodafone 30% and 12.5%; and T-Mobile 21.7% and 6.5%, respectively. Mobile broadband connections reached 10.2 million or 63% of the population.
Salient items in this country case
– The role of the academic community in pushing the technology frontier;
– The role of municipalities in FttH deployment;
– The role of housing corporations in providing demand bundling to kick-start fibre deployments;
– The emergence of a third actor ‘breaking the waiting game’ in terms of fibre to the home deployments;
– Early removal of regulatory uncertainty regarding fibre to the home, with open-access and wholesale price based on a real-life business case;
– Effective demand aggregation in towns and cities with a high degree of social cohesion.
Experiences that might benefit other member states in realizing the DAE targets
– The role of the academic community in pushing the technology frontier;
– The role of third parties in ‘breaking the strategic waiting game’.
References
1 See Chapter 1, Introduction providing the quantitative data at the beginning of the case study period and at the end of the case study period.
2 Narrowband is defined in the context of this book as data rates below or equal to 144 kbit/s and broadband as data rates higher than 144 kbit/s; in other words narrowband includes dial-up Internet access using 56k modems and ISDN, broadband starts with the application of ADSL and DOCSIS 1.0. This definition is based on the 13th Implementation Report of the European Commission, Volume 2, p92: http://ec.europa.eu/information_society/policy/ecomm/library/communications_reports/annualreports/13th/index_en.htm.
3 The critical review and suggestions for improvement of an earlier version of this chapter by Peter Anker, Paul Brand, Rob van Esch, Nico Van Eijk, Nicolai van Gorp, Frank van Iersel and Kees Neggers are highly appreciated.
4 IBTC (International Bell Telephone Company, set up to exploit the Bell patents outside the USA) was selected based on having the lowest end-user tariffs (Hfl 118 per year), the highest revenues for the municipality (21.5% of gross proceeds) and the installation and exploitation of the network granted to a Dutch organisation, NBTM. (Hogesteeger, Reference Hogesteeger1976; De Wit, Reference De Wit1998)
5 Many of the local networks were small, outdated and suffering from underinvestment. This was an outcome of the license condition, which stated that the municipality would obtain the network at taxation value at the end of the licensing period or, alternatively, the licensee would have to dismantle the network.
6 To avoid each broadcasting company having to install its own radio transmitter and for cost-saving reasons.
7 By 1940, 800 radio-distribution networks, of which 20 were owned by the municipality, were serving 411,232 subscribers. (Arnbak, Van Cuilenburg and Dommering, Reference Arnbak, Van Cuilenburg and Dommering1991)
8 During the evenings Radio Hilversum II, operating in the MW band, would be subject to interference from a radio station in Hungary.
9 The municipalities discouraged the use of individual antennas and thereby stimulated the use of the CAI systems. The use of CAI systems was also financially attractive, as it generated income from the granting of rights-of-way. As the CAI systems were used for RTV only, there was no use for the business sector.
10 In 1994, 56% of the licenses were still owned by the local government, 16% by a privatized local energy company and 6% by a regionally operating private company. The exploitation was handled in 34% of the cases by the privatized energy company, in 15% by the municipality, 15% by a regionally operating private company, and in 14% by a nationally operating private company. (VNG, 1994)
11 The DIVAC project was aimed at obtaining technological experience and was carried out jointly by Philips, the PTT, and the Universities of Technology Delft and Eindhoven. (Arnbak, Reference Arnbak1986)
12 This instrument was used in 2013 to fend off the take-over attempt by Carlos Slim of América Móvil.
13 Additional protection was provided through the corporate structure as a ʻstructuurvennootschapʼ. (Wessels, Reference Wessels1994)
14 Based on an interim law enacted in 1996 and ahead of the EU regulations, the government granted two licenses for fixed telecommunications service provision on the basis of a beauty contest.
16 Note that at that time PTT was still a department of the Ministry of Public Works.
17 As a consequence KPN had to relinquish its shares in cable operator CASEMA.
18 The municipal cable network of Amsterdam (KTA) was first acquired by United Philips Communications (UPC), a joint activity of Philips and US West, and the network was named A2000. The consortium became listed on the stock exchange and during the euphoric period in the late 1990s it was acquired by Liberty Global.
19 Further information on the role of SURFnet can be found in ʻICT innovation as practiced by SURFnetʼ (Van Iersel and Neggers, Reference Van Iersel and Neggers2010) and in the evaluation report of the government funding (Boekholt, Deuten, Nagle and Zuijdam, Reference Boekholt, Deuten, Nagle and Zuijdam2008).
20 Note that at the time the PTT still had the monopoly on telecommunications infrastructure.
21 Source: Kees Neggers and interview with Piet Beerta documented at www.netkwesties.nl/636/aartsvaders-nederlandse-internet.htm.
22 Following a decision in 1976, Datanet 1 was officially inaugurated using ITT DPS 1500 equipment in 1982. The access data rates were 2400, 4800 and 9600 bit/s via the PSTN access lines and 48 kbit/s using leased lines. For a 2400 bit/s connection the monthly subscription fee was Hfl 400, plus 2.5 ct per call and per minute and 0.25 ct per data segment of 512 bits. Datanet 1 provided for international connectivity, including Telenet and Tymnet in the USA. (Hamelberg, Reference Hamelberg1984)
23 From the start of SURFnet the project funding by the government has been used to implement the new (innovative) network facilities, the institutes being connected have provided for the costs of operation. The use of open tendering in procurement of the network components and services became a matter of principle. (SURFnet, 2009)
24 In 1999 SURFnet terminated the X.25 based services.
25 NORDUnet combines the networks of the universities in Norway, Sweden, Finland, Denmark and Iceland since 1985.
26 Funding of SURFnet6 has been obtained under the BSIK program, which involved a competition among contending projects and required a research dimension, which was at large provided by the University of Amsterdam. (SURFnet, 2009)
27 SARA was founded in 1971 under the name Stichting Academisch Rekencentrum Amsterdam by the University of Amsterdam (UvA), Vrije Universiteit Amsterdam (VU) and the Stichting Mathematisch Centrum (now Centrum Wiskunde & Informatica). Initially SARA’s work focused on data processing activities for the three founders.
28 Lofar: Low Frequency Array, a novel software-based radio telescope. Using a large array of small omni-directional antennas the signals are combined in software to create the image. (Astron, 2006)
29 Source: www.computerwoorden.nl/direct–14656–Snelnet.htm.
30 As ETSI-based equipment was not yet available, use was made of the German version of ISDN, which differed mainly in the modulation method applied on the copper loop.
31 Hack-Tic was a magazine advertised as being aimed at ‘techno-anarchists’ that started to appear in 1989. (Hack-Tic, 2003)
32 XS4ALL became a foundation to be transformed to a corporation XS4ALL Internet BV in 1996. In 1998 XS4ALL became a subsidiary of KPN Telecom (XS4ALL, 2010). Other early internet access providers include: EuroNet (acquired by Wanadoo), Demon, and WorldAccess (now Planet Internet, owned by KPN). Later ISPs included WorldOnline (acquired by Tiscali in 2000), and Zonnet (Meerman, Reference Meerman2004).
33 ʻDe Balieʼ is a platform being advertised as ʻPlayground for cultural progressivesʼ.
34 VuurWerk Internet was acquired by Versatel in 1999 (Wikipedia, 2010b).
35 ISDN was attractive as it provided two communication channels, such that telephony and Internet access could be used simultaneously.
36 CAI-Westland (CAIW) provides the services through a for-profit subsidiary, Kabelfoon. (Verbree, Reference Verbree1997)
37 DeltaKabel had entered the cable networking market with a cable system product based on a license of the Dial-A-Program system of the British firm Rediffusion in 1974. (Schrijver, Reference Schrijver and Regeringsbeleid1983; Dake and Boers, Reference Dake and Boers1999)
38 It should be noted that, depending on the network topology, the capacity is shared among a number of users.
39 In 2000 there was a debate as to whether the cable modems should be based on the DVB/RC (Euromodem) standard or the European version of the US DOCSIS (Data Over Cable Service Interface Specification) standard.
40 The role of satellites in RTV-distribution remained small, estimated at some 325,000 receivers by the end of 1999, or approx. 5% of the RTV-access market. (MinOC&W, 2000; MinV&W, 2000a)
41 The four-channel version of EuroDOCSIS 3.0 allows for a maximum data rate of 200 Mbit/s downstream and 108 Mbit/s upstream. (Wikipedia, 2009c)
42 By mid 2008 the number of triple-play customers (RTV+Telephony+Internet) is approx 1.5 million. (OPTA, 2008e)
43 In 2006, a large part of the Digital Dividend has been assigned for the use by broadcasters, including Digitenne. To be able to assign the 800 MHz band for mobile communications in compliance with the EC rules, alternative frequencies have been assigned to Digitenne in the UHF band below 790 MHz. Source: www.frequentieland.nl/breedband/digitaal-dividend.htm.
44 Sources: www.emerce.nl; www.netkwesties.nl; www.nieuws.nl; www.nu.nl; www.nrc.nl; www.telecompaper.com; www.z24.nl.
45 These types of investigations and the interactions of member states with the European Commission led to guidelines by the EC on the use of state aid (EC, 2013).
46 With an implied reference to the Deltawerken, a major initiative to improve the protection against the sea following the flooding in 1953.
47 Until July 2002 the Ministry of Public Works was responsible for the post and telecommunications sector, when it was transferred to the Ministry of Economic Affairs.
48 Along with these policy documents addressing infrastructure developments, complementary policy documents have been published on the use of these infrastructures, such as ʻDe digital economieʼ and ʻDigitale implementatie Agenda.nlʼ. (CBS, 2001; MinEZ, 2011)
49 In 2009, the Netherlands had 441 municipalities.
50 Source: Wet van 18 maart 2010, houdende regels met betrekking tot versnelde ontwikkeling en verwezenlijking van ruimtelijke en infrastructurele projecten (Crisis- en herstelwet). https://zoek.officielebekendmakingen.nl/stb-2010-135.html.
51 See Chapter 7 for a detailed discussion of the Stokab model.
52 The initial idea of co-ownership by the users was abandoned given that no party was willing to make the necessary arrangements. The targeted pilot service area was extended to be more representative of the population of Almere and to cover two business parks. (GemAlmere, 2004)
53 Unet would link-up with Fastweb in Italy to share deployment experience. (GemAlmere, 2004)
54 VDSL will replace ADSL, ADSL2, and ADSL2+, the latter providing a maximum download data rate of 24 Mbit/s which, depending on the length of the copper loop, will drop to a few Mbit/s. (Wikipedia, 2009a)
55 In 4Q2007, out of the 3.5 million lines of KPN, approx. 650,000 are used by third parties. (OPTA, 2007)
56 Its business model was to provide only the passive layer but, due to the absence of interested active operators at that time, it established its own active operator as a temporary measure.
57 The number of households in the Netherlands is 7.2 million on a population of 16.5 million (CBS, 2009).
58 In 2008 Eurofibre, Fastfibre and iConnext merge into Eurofibre. (Eurofiber, 2009)
59 Source: www.cifinfrastructure.com and www.cif-glasvezel.nl/. CIR is managed by Bouwfonds REIM, as part of the Rabo Real Estate Group which is part of the Rabobank Group.
60 Source: www.glazenkamp.nl.
61 As of 1 January 2013 the consumer authority (CA), the sector specific authorities (OPTA and former DTe) and the competition authority (NMa) have been merged into one Authority Consumer and Market (ACM).
62 Note that some of the broadband connections serve small and medium size enterprises, hence, the real penetration per household is lower than 90%.
63 The ACM reporting is based on company data provided by Atlantic, BBNed, BT, CAIW, COLT, Delta, Easynet, Esprit, KPN, Online, Pretium, Reggefiber, Scarlet, Tele2, T-Mobile, UPC, UPC business, Verizon, Vodafone and Ziggo.
64 Figure from the report ʻFTTH Monitor – 2013/Q3 Glasvezelontwikkelingen in Nederlandʼ, courtesy of Stratix Consulting.
65 This includes connections to holiday homes, etc., which inflates the penetration level per home.
66 Information from the report ʻDutch television market Q3 2013ʼ, courtesy of Telecompaper.
67 Source: http://forum.kpn.com/t5/News-stream. For the FON approach to Wi-Fi see Chapter 5 in ʻThe Innovation Journey of Wi-Fi – The Road to Global Successʼ (Lemstra, Hayes and Groenewegen, Reference Lemstra, Hayes and Groenewegen2010).
68 Based on company information collected by www.4Gdekking.nl and personal information from P. Brand, Stratix Consulting.
69 In a parallel research effort, the quantitative analysis of broadband markets in the EU reveals that:
Whilst access-based competition tends to take a smaller market share in the presence of cable, our analysis shows that the combination of infrastructure-based and access-based competition provides the best possible level of broadband performance. Drawing the conclusion that ‘two is enough’ for reaching optimal performance, i.e., infrastructure-based competition without access-based competition, is incorrect. This is indicated by the important role that the LLU wholesale price level has on broadband performance.
5 Belgium: Flanders
Preamble: Flanders in Belgium
Belgium is a small but complex country, bounded by several states and for a small part by the North Sea. Its surface, only 30,500 km2, covers a variety of landscapes, a coastal plain in the north-west, a plateau in the centre and the forested Ardennes uplands in the southern part of the country. Although small, the country is split into three different communities based on language and culture: the Dutch-speaking community in the north (about 60% of the population), the French-speaking (40%) in the south and a small area of German-speaking people (about 74,000 people) in the east of Belgium. Apart from this division, Belgium consists out of three regions: Flanders, Wallonia and the Brussels Capital Region located geographically between the former two (Belgium, 2011).
This complex geographical and cultural partition clearly has its political consequences. There are many different levels of political authority in Belgium. Next to the federal government, every community and region has its own council (legislative body) and government (executive body). Belgium is a monarchy with a King who is the Head of State, but who does not exercise any personal authority. The ministers of the federal government, communities and regions are fully responsible for signing new laws in their own field. For the telecommunications sector, the National Regulatory Authority, BIPT, is a federal institute, and responsible for all that concerns the telecommunications networks. On the other hand, the legal institutes for media (media regulator) fall under the responsibility of the communities, since these bodies regulate content and are therefore language-driven. Thirdly, there is the competition authority, which is federal but separate, a part of the Ministry of Economic Affairs.
With a total population of 10,951,665 (at 1 January 2011), Belgium is a densely populated state. The population density is considerably higher in the region of Flanders (about 460 people/km2 in 2010) than in Wallonia (about 205 people/km2 in 2010) (Eurostat, 2011).
The Belgian economy is mainly based on services, transport and trade (73% of the working population) (CIA, 2011). The share of industry (25% of the working population) keeps decreasing. The main industrial zones are currently located near the harbour cities of Antwerp, Bruges and Ghent. In Wallonia, the most important industrial sites are located along the two largest rivers: the Sambre and the Meuse. Agriculture is limited in Belgium (only 2% of the working population). Because of its central position in Europe, Belgium (especially its capital Brussels) is a very attractive location for central offices of international companies. This central position also requires Belgium to own a well-developed transportation infrastructure. There is an extensive network of highways, railways and waterways. Belgium has five international airports, among them the two large airports in Zaventem and Charleroi, and a number of international harbours, among which is the harbour of Antwerp, the second largest in Europe.
By the end of the 1980s, badly planned economic policies resulted in a public debt of 120% of the Gross Domestic Product (GDP). In the following period, the Belgian government made sure that every major decision fitted in the overall goal of reducing this major debt. By the end of 2006, the public debt was reduced to 100% and to 90% in 2008. Due to the financial crisis in recent years, this public debt has risen again to 99.7% in 2011 (CIA, 2011). All three major banks in Belgium suffered heavily from this crisis and the government was forced to intervene financially to prevent severe damage.
It is important to note that this paper focuses only on Flanders. As can be derived from this short introduction, the differences between Flanders and Wallonia are significant, both in the development of the telecom sector and in the emergence of different actors. The authors therefore chose to devote the remainder of this chapter to the development of telecommunications in the region of Flanders only. The focus will be on the development of fixed broadband, in particular infrastructure-based competition between the PSTN operator and the CATV-cable operator.
5.1 Introduction: the dual road of telephone and analogue television network development
Telecommunications started a long time ago but developed faster and faster as time went by, from communicating by means of carrier pigeons in the Middle Ages, over telegraph systems at the beginning of the 19th century to telephone networks deployed at the end of the 19th century, while cable networks for broadcast services emerged in the 1950s. This section provides a brief overview of the development of copper and coaxial cable networks, since, in Flanders, they are now both used to offer broadband connectivity.
5.1.1 The development of the copper network
Introduction to communication services in Belgium (1879–1930)
The first telephone line was installed by the Belgian telegraph service at the Parliament in 1879. The first telephone call between two cities (Brussels and Antwerp) took place in 1884 and the first international conversation (with France) in 1886. The first commercial exploitation was set up by a subsidiary of the International Bell Telephone Company (IBTC) (Dienst Pers en Informatie, 1982). This subsidiary, the N.V. Bell Telephone Manufacturing Company, was founded in 1882 with the aim of introducing public telephony in Europe (Vanden Berghen, Reference Vanden Berghen2012). In 1886, the Belgian state granted Bell the installation of the first local telephone network in Ostend.
The networks owned by Bell worked fine in the densely populated cities, but did not succeed in connecting people in the rural areas. Additionally, the private ownership of the various local networks made it difficult to interconnect them. In 1893, the Belgian state bought back the concessions and thereby regained control of the various local networks. In 1896, the Belgian state decided to establish a public company that received total control of the telephone sector. The company started by taking over the remaining private networks; the final goal was to provide telephone service throughout the entire country. By 1913, the major part of Belgium had access to telephones, principally through public booths installed in most railway stations and post offices (Wikipedia, 2011).
Monopolistic situation: RTT (1930–1991)
With the outbreak of the First World War, the Belgian authorities had to deal with great financial trouble and could no longer support the public telephone company. This led to an abrupt suspension of telecommunication services in Belgium. In order to avoid losing facilities due to lack of financial means in the future, a new company was founded under the name of RTT (Regie Telegraaf en Telefonie) in 1930, which inherited a subscriber base of about 225,000 customers. This public company still owned the monopoly over the whole telephone network, but was set up as an autonomous institution, no longer depending on the funding provided by the authorities. Competition was out of the question, as all threats of entry and substitute products were locked out by law, which determined that the RTT not only had the monopoly of owning and exploiting the copper network but also the sole rights to offering services and equipment. Its independence soon appeared to be primarily theoretical, as the economic crisis of the 1930s caused the RTT to become involved in the industrial and employment policy of the state. To reduce the high unemployment rate, the RTT was forced to create jobs through the expansion and total automation of the Belgian telephone network. In the period from 1930 to the beginning of the Second World War, the RTT succeeded in increasing its customer base by almost one third, reaching a subscriber base of more than 300,000 customers.
During World War II, the Belgian telephone network experienced serious damage and parts of its lines were destroyed. The RTT lost more than 70,000 subscribers. To support the fast developing economy, that characterized the period after the Second World War, the state decided to intervene financially to give a boost to the telecommunication sector. The growing number of subscribers (from 350,000 in 1946 to 522,000 in 1951 and 1,049,000 in 1965) stimulated the RTT to invest heavily in its network. As a consequence, the Belgian telephone network became one of the most developed and most progressive at the time1.
But this boom had its negative side. At the end of the 1960s, the saturation of the market put a stop to the increasing revenue trend, and losses started to accumulate. Then, in 1973, the civil engineer Paul Demaegt, an RTT employee, revealed that Germain Baudrain, the administrative director of RTT at the time, no longer put up the construction and decoration of RTT-buildings out to public tender, but awarded it to private enterprises in which the director himself owned shares. This led to an augmentation of the RTT’s losses. Although the telecom network remained well maintained, questions about the RTT’s efficiency arose. Customers (especially business subscribers) started to realize that the prices they were paying were too high for the quality of service they received. This awareness also arose in other countries, was a major cause for regulatory intervention and provided the justification for serious restructuring of the sector during the 1980s and 1990s.
Towards the liberalization of the Belgian market (1991–1998)
The first legislation concerning the use of the telephone was published in 1896, with the monopolization of the network and the foundation of the first public company. The first real Telecommunications Law appeared in 1930, together with the formation of the RTT. This law remained relatively unchanged for about sixty years, as nothing fundamentally changed concerning the monopolistic situation of the RTT.
The major cause of change resulted from the publishing of the Green Paper on the development of the common market for telecommunication services and equipment (European Commission, 1987). This paper aimed at initiating discussions in Europe concerning the development of a common market for telecommunications. Also, the decreasing satisfaction of Belgian customers made the authorities realize that change was needed. On 21 March 1991, the proposals from the Green Paper were incorporated in Belgian law (Belgium, 1991), which led to the foundation of two institutions: Belgacom, an autonomous telecommunications operator with a monopoly in the copper telephone network and the BIPT (Belgian Institute for Postal Services & Telecommunications), a regulatory authority.
Belgian Institute for Postal services and Telecommunications (BIPT)
The BIPT is the Belgian National Regulatory Authority, positioned as an independent institution. The role of the Ministry of Telecommunications is limited to selecting and assigning (by means of a Royal Decree) the executive board members every six years. BIPT funds itself using revenues from the management of licenses and numbering. Its main responsibilities include (BIPT, 2011):
– correct application of the laws concerning telecommunications (radio, television, telephone and Internet services) and postal services;
– oversight of the transition of the necessary European directives into Belgian law (although this obligation is to be shifted to the Directorate-General (DG) Telecom of the Ministry of Economic Affairs);
– management of scarce resources, i.e., the radio frequency spectrum and the numbering space;
– mediation when differences between telecom operators occur;
– granting of licenses to new entrants.
To prevent conflicts of interest between the telecom operators and the BIPT, the latter is forbidden to practise commercial activities.
At the same time, another institution was founded next to the BIPT: the Office of the Ombudsman for Telecommunications (Ombudsdienst Telecommunicatie, 2011). This organization serves as a mediator between customers and telecom operators. It is a completely different institution, independent of the operators, authorities and regulators. Whenever a customer has a complaint concerning an operator, if this customer cannot come to an agreement with the operator, he or she can turn to the Ombudsman for intervention.
Every year, the organization submits a report on the major complaints. This report can be seen as a representation of the Belgian customer’s demands and complaints, which can be used to further improve the existing infrastructures and services.
Belgacom
The Law of 1991 aimed to transform the Belgian market in order to make it more receptive to competition. Belgacom was created as a successor of the RTT and still owned the entire Belgian telephone network. The main difference between the RTT and Belgacom concerned the degree of monopoly. The RTT had the monopoly of exploiting the whole telephone network, while Belgacom only inherited the monopoly on ʻpublic telecommunicationsʼ. The Law of 1991 defined public telecommunications as (Belgium, 1991):
– construction, maintenance, modernization and operation of public telecommunications infrastructure;
– exploitation of the reserved services (including telephone and telegraph service, provisioning of fixed links) for third parties;
– construction, maintenance and operation of the publicly accessible establishments located on the public domain and intended for telecommunications.
In 1994, the Bangemann Report from the European Commission provided the official recognition for the complete liberalization of the European telecommunications market. As a response to this report, the government decided to privatize Belgacom in that same year by selling 50% -1 of its shares to the ADSB Consortium, consisting of Ameritech, Tele Danmark and Singapore Telecom, plus three Belgian financial institutions: Sofina, Dexia and KBC. The other 50% + 1 share stayed in the possession of the Belgian authorities, the state thus remaining the major shareholder. The state believed this privatization to be necessary to counter competition from international rivals, because of the attractive position of Belgacom as the only telecom operator in a country in the centre of Europe, but also to be able to face the competition to emerge from the domestic CATV operators, as the European directives authorized the ‘commercial exploitation of non-reserved services on alternative infrastructures’. Next to reducing the threat of entry, the Belgian state used the proceeds from this privatization to reduce the huge public debt the country had to deal with at that time.
1994 was also the year of the foundation of the first Belgian mobile network: Proximus. This network and the old analogue Mob2 system were transferred later that year to a separate subsidiary, Belgacom Mobile. Belgacom owned 75% of shares; the other 25% was in the hands of US-based Air Touch which was acquired by Vodafone in 1999. Today, Belgacom again owns 100% of the shares. As mentioned in the introduction to this chapter, we will not explore the development of the mobile market in further detail. Only the facts that are important in relation to the actors in the fixed broadband market and the services offered will be addressed.
Belgacom entered the Internet market in 1996 with the acquisition of 25% of the shares of Skynet, a company providing Internet services that was founded in 1995. Before 1995, it was principally the academic world that made use of the Internet through the research network, BELNET, that could be used free of charge by the Belgian universities thanks to funding from the federal government. Belgacom acquired the remaining 75% of Skynet shares two years later. The subsidiary Belgacom Skynet was officially born, and customers could gain access to narrowband Internet using dial-up.
5.1.2 The development of the cable network
Introduction to cable services in Belgium
The distribution of television channels by cable networks originated in the United States of America in 1947. Belgium was the first country on the European mainland that established cable distribution networks in the early 1950s. The first cable lines were installed in large apartment buildings where the residents invested jointly in one antenna and distributed the signals using cable. Soon, some of those networks were combined into inter-municipal networks, sometimes with the participation of a private firm. The initiator was NV Coditel, which set up a cable network in Saint-Servais (close to Namur, in the Walloon region) in 1960. Liège, Verviers and Visé were connected to the network in the following years. The regions of Brussels and Flanders followed the lead of Coditel with the foundation of similar companies in their regions. The number of subscribers grew rapidly: more than 50% of Belgian viewers had subscribed by 1976 and about 88% in 1985 (De Bens, Reference De Bens1986). There are several reasons for this boost. First of all, cabling was promising in both densely populated and rural areas. Urban areas with lots of inhabitants gave the cable companies the advantages of economies of scale, while the poor antenna-reception in the rural areas formed a good incentive for the roll-out of a more reliable cable network. Another important motive included the linguistic duality in Belgium. The Dutch-speaking part was interested in receiving foreign TV-channels from the Netherlands and, analogously, the French-speaking part wanted to watch French TV-shows and movies. Last but not least, cable networks also served an aesthetic purpose: once homes were connected to the cable network, the jungle of antennas could be removed.
Because of the large difference in content between the Flemish and Walloon television services, the authorities decided to put the regulations and legislations for cable networks – and television in general – under the responsibility of the communities (media regulators). It is important to note that although the cable operators were autonomous companies, a formal approval from the RTT was necessary for the establishment and exploitation of any cable network, irrespective of size. By 1996, thirty-eight cable companies with a total subscription base of 95% of households made Belgium the world’s leading country for cable coverage. Despite the large number of cable companies, competition wasn’t present at the time, as every cable company operated only in its own geographical region.
The demand for more programs and channels caused serious expansion campaigns during the 1980s and 1990s, each time increasing the available bandwidth per user and thereby enhancing the quantity and quality of the services offered. Starting in the 1990s, local companies merged in order to be able to keep up with the required investments and to improve the services. Only a couple of big companies remained, mainly based on geographical coverage. After a series of important mergers, driven by both public and private actors, only one cable company remained in Flanders: Telenet. The interactions leading to the current shape and status of the cable company were important for the market structure and development of broadband in Flanders; hence, they are the case’s focus in the next section.
5.1.3 Case focus: the Flemish initiatives leading to the founding and survival of Telenet
In Flanders, the project ʻMultimedia in Vlaanderenʼ (Van Batselaer et al., Reference Van Batselaer, Lobet-Maris and Pierson1997) was aimed at developing an information society in Flanders2. This project was presented by the Flemish government in April 1996 and based on domestic studies as well as conclusions from European and international studies. The objectives of this project were multi-fold (Van den Brande, Reference Van den Brande1996), see also Figure 5.1:
– conversion of the Flemish cable infrastructure into an interactive broadband network offering broadcast, telecommunication and multimedia services;
– creation of a stable regulatory institution and legislation based on competition;
– promotion of research and development in the sector of information technology;
– assignment of an exemplary role to the Flemish government in the set-up of pilot projects;
– creation of additional jobs.
The objective of this project was to create new applications and to lay the foundation of an information society in Flanders, as well as to create a united cable company as a competitor to Belgacom in Flanders. The policy plan of 1996 gave some examples of future applications, some of which are now commonly used: e-learning, e-working, e-shopping, e-administration, video-on-demand, e-health and many more.
The major consequence of the project was the foundation of Telenet Vlaanderen, set up to interconnect and potentially unite the independent Flemish cable companies to achieve an interactive broadband network offering broadcast and telecommunications, as well as multimedia services to all citizens. This foundation provided a good fit within the project ʻTelenet in Vlaanderenʼ, the major sub-project of ʻMultimedia in Vlaanderenʼ.
The reasons for this project were twofold. On the one hand, the infrastructure was insufficiently used, although Flanders possessed one of the densest cable networks in the world. The legal restrictions imposed upon the cable networks (every action in the cable sector must be approved by the RTT) limited the application possibilities. At the time, there were many small cable companies, each covering their own region with their own infrastructure but lacking interconnection between the different regions and infrastructures. On the other hand, with the liberalization of the telecom market of January 1998 (authorized by the European Commission) on the horizon, a need arose for competition with the incumbent Belgacom and other possible international entrants.
A thorough feasibility study performed by the GIMV (Gewestelijke InvesteringsMaatschappij voor Vlaanderen, a European venture capitalist with public funds and experience in private equity (GIMV, 1998)), estimated the investment costs at BEF50 billion (about EUR 1.25 billion). A starting capital of BEF17 billion (about EUR 420,000) was provided by a consortium of four large partners in the Telenet Holding: MediaOne (25%), the Flemish inter-municipal corporations (35%), GIMV (20%) and a financial consortium with representatives of the Flemish media and several financial groups (20%). A major part of this total investment was invested in rolling out an extensive fibre backbone of about 635 km in order to connect the individual networks of the various cable companies, which was completed in July 1997. Through the use of switching centres and by making the amplifiers in the coaxial network bi-directional, two-way traffic became possible, thereby enabling many additional applications, as such creating a playing field for innovation.
As a consequence of the ʻMultimedia in Vlaanderenʼ project, a set of new enterprises arose from the merger of the former local cable companies. Apart from the foundation of Telenet itself, 1996 was characterized by the creation of UPC Belgium (United Pan-Europe Communications Belgium), founded as a joint venture of Philips and UIH (United International Holding), with US-based Liberty Global and UPC Broadband as major stakeholders. Its network took over the existing networks in seven communes of Brussels (Etterbeek, Ganshoren, Jette, Koekelberg, Schaerbeek, Berchem-Holy-Agathe and Forest) and three communes of Flanders (Heverlee, Kessel-Lo and Leeuwen). Another cable company, Interkabel Vlaanderen, resulted from the merger of three local ʻintercommunalesʼ: Interelectra (province of Limburg and the Antwerp city of Laakdal), PBE (region of Hageland in the province of Vlaams-Brabant), WVEM (regions of Diskmuide en Wevelgem in the province of West-Vlaanderen, region Halle-Vilvoorde in the province of Vlaams-Brabant and the cities of Beerse and Vosselaar in the province of Antwerp) and Integan (region of Antwerp and city of Essen). Interkabel Vlaanderen offered broadband services, cable television and INDI, a digital television platform.
Although the business plan for Telenet was ambitious, the first Internet access offer, branded Pandora (launched in August 1997), was too expensive (about EUR 50 per month), leading to a delay of the expected boom in uptake and very high debts. Furthermore, Telenet (Pandora) only received revenues from offering additional services; the network revenues stayed with the network owners (privately owned and geographically divided ‘intercommunales’). In 2002, the newly appointed CEO, Duco Sickinghe, changed the strategy of the company. By buying into the intercommunales (UPC Belgium in 20063, Interkabel Vlaanderen in 20084) in return for a share in the larger Telenet, he could refinance the entire operation, using the ensured revenues from the network (cable TV revenues previously destined for the intercommunales) as collateral. Through the takeover of about 850,000 customers of UPC and Interkabel, Telenet acquired the fourth and final important part of the Flemish cable network. This strategic move prevented Belgacom from entering the cable infrastructure business, and therefore made Telenet a full competitor on the infrastructure level using its HFC (Hybrid Fibre Coaxial) architecture.
Apart from the strategy change, the Belgian NRA, BIPT, had an important influence on the business case for Telenet: that is, an interconnection agreement signed with Belgacom on the application of asymmetric regulation on termination fees to the advantage of Telenet meant a large extra income for Telenet, and saved the company to some extent (as without this measure, Telenet might have gone bankrupt). Some even considered this asymmetric regulation as an indirect subsidy from Belgacom to Telenet, justified in the context of creating a level playing field in telecoms in Flanders. Although this justification may be subject to discussion, it led to the current duopoly situation where Belgacom and Telenet compete for broadband customers.
5.2 Case description: From narrowband to broadband in Flanders – a duopoly market
Although the European telecom reform aimed at introducing more competition by allowing new entrants to compete on the copper network of the incumbent, it largely resulted in a competitive duopoly between the incumbent operator Belgacom and the cable operator Telenet. This section will describe the evolution and the most important events in the development of broadband (Internet), while focusing on the tit-for-tat competition between copper and cable. A summary of the most important events for both operators is given in Figure 5.2 and Figure 5.4, respectively. Although this paper focuses on the development of fixed broadband markets, we also include a timeline for mobile communications because all operators offer quadruple play services (including television, Internet and fixed and mobile telephony).

Figure 5.2 Timeline presenting the most important events in the history of Belgacom
5.2.1 Belgacom in a competitive setting
Starting 1 January 1998, the Belgian telecom market was completely liberalized, whereby Belgacom was obliged to open up its network to new entrants. Local Loop Unbundling (LLU) was legislated in October 2000, allowing access to the network of the incumbent from 1 January 2001 onwards. Belgacom first issued a Reference Unbundling Offer (RUO) in December 2000, which was reviewed and rejected by the BIPT several times. The publication of the documents was found inadequate and the standard contracts contained a number of clauses that formed a serious obstruction to new entrants (as stated in the review of Belgacom’s Reference LLU Offer, 12-03-2001 (BIPT, 12/03/2001; 14/03/2001). The final BRUO-proposal (Belgacom’s RUO) was approved by the BIPT in March 2001 and included rental possibilities on three levels: full LLU, line sharing and sub-loop unbundling. Bitstream access was granted a few months later through a separate reference offer. The Belgian market became not only officially but also practically open to OLOs (Other Licensed Operators).
Because of this newly introduced competition, Belgacom had to improve its applications and services in order to maintain its strong position on the telecom market. Figure 5.2 provides an overview of the most important events that characterized Belgacom’s history. In the following paragraphs we will discuss these events.
Broadband Internet: network upgrades
In order to stay competitive, a prime requirement is to have a competitive network. After emergence of the public Internet and dial-up use in 1995, the real story of commercial broadband Internet using the PSTN network of Belgacom begins in 1998, with the execution of a pilot project for the testing of ADSL (asymmetric digital subscriber line), ʻthe high-data rate access roads to the information highwayʼ. The project included 1,000 customers in several large Belgian cities (Antwerp, Brussels, Leuven, Liège, Mechelen, Ghent and Charleroi). Belgacom predicted that, by using this new technology, transferring information at data rates up to 8 Mbit/s (download) and 600 kbit/s (upload) per user would become everyday reality in the near future.
Because of the success of the pilot project (80% of the test public approved of the possibilities of the service and agreed to recommend it), Belgacom Skynet was one of the first operators (world-wide) to introduce ADSL commercially in April 1999. Soon, ADSL covered 30 to 35% of Belgacom’s telephone customers. The intention was to achieve coverage of 70% by the end of 2000. This objective was exceeded when in November 2000, ADSL services were available to 75% of Belgian population. By the end of 2002, the coverage was almost complete when 98% of the inhabitants had access to ADSL services (Belgacom, 15/01/2003), making Belgium the leader in Europe. In 2010, DSL coverage had reached 99.85% of the Belgian population. In terms of uptake, Belgacom had 517,000 subscribers by the end of 2002, an increase of 290,000 since the end of 2001. This number doubled again in the next two years, reaching the milestone of 1 million in 2004 (Belgacom, 25/02/2004). By June 2011, Belgacom had 1,835,000 subscribers.
Not only did technical measures give rise to network upgrades and expansion of uptake; at the end of 2008, the acquisition of Scarlet, a Dutch telecom company specialized in low-cost Internet offers, increased the market share of Belgacom by 5%. Both the BIPT and the OLOs reacted quite negatively to this acquisition; however, IBPT approved the acquisition on the condition that Scarlet’s backbone was sold. Not only did this take-over increase Belgacom’s market share but it also allowed Belgacom to offer a low-cost brand (although Scarlet is fully owned by Belgacom, the name is retained) (De Tijd, 09/09/Reference Tijd2008).
In 2002, Belgacom launched SDSL (Symmetric DSL), which provides a fast Internet connection with the same maximum available data rates in both directions (up and down). SDSL was primarily developed for business customers. The need for higher data rates made Belgacom explore the opportunities of fibre deployment within the scope of the Broadway project that was launched in 2004. This project aimed at upgrading the network to a combined copper and fibre network. The goal was to connect the central offices to the street cabinets using optical fibre (the so-called Fibre-to-the-Cabinet, FttC) and to roll out a VDSL platform between the street cabinets and the end users. The VDSL technology was introduced commercially on 2 November 2004 and by investing EUR 103 million in 2006, VDSL coverage of 45% was reached by the end of that year. This VDSL technology offered data rates up to 8 Mbit/s download and 400 kbit/s upload by the beginning of 2005. Because the equipment vendor Alcatel Lucent no longer supported the particular VDSL technology (incompatible with ADSL and too much spectral noise) and because the need for higher data rates was urgent due to the introduction of digital television, Belgacom implemented ADSL2+ in 2005 as a temporary solution until the new VDSL2 standard would be ready at the end of 2007. By 2009, a total investment of about EUR 500 million had led to the deployment of 14,000 km of fibre, connecting 17,000 ROPs (Remote Optical Platforms) representing a FttC coverage of about 70%. Thanks to the early investments in the Broadway project and the high ranking of the VDSL2-coverage (second place in Europe in 2009), Belgacom received the 2009 Innovations Award from Global Telecommunications Business (Belgacom, 29/10/2004; 09/09/2009).
Because of the increasing demand for higher bandwidths and in order to stay competitive vis-à-vis the cable operator Telenet, Belgacom decided to invest further in applications using optical fibre. The first tests concerning Fibre-to-the-Home (FttH), bringing the optical fibre into the living room of the customer, were executed in Rochefort in 2008 and extended to Sint-Truiden and La Louvière in 2009 (Belgacom, 09/09/2009) but no commercial deployment was envisaged yet.
On the one hand, Belgacom was deploying VDSL2 to all its customers, having reached a national coverage of 78.9% at the end of 2011, aiming for 85% by the end of 2013. On the other hand, Belgacom recognized the limitations of VDSL2, and therefore already communicated their ʻGet to fast, fasterʼ strategy (Belgacom, 27/09/2011). In a partnership with Alcatel-Lucent, Belgacom aims at maximizing the VDSL2 throughput by using the new state-of-the-art vectoring technology. VDSL2 vectoring is a noise-cancelling technology that will allow the use of VDSL2 at its theoretical data rates, which will allow rates of 100 Mbit/s and beyond to be transmitted on copper cables. Belgacom opted for this upgrade because it will bring high data rate broadband to the end-consumer in a fast and cost effective way. Tests of VDSL2 vectoring started at the end of 2012.
Apart from vectoring, other technological upgrades on VDSL are possible to boost bandwidth capabilities. In VDSL bonding, two physical twisted pairs to each customer are used instead of one, which almost doubles the data rate. However, as there are few spare copper pairs in Belgium, it is unlikely that this upgrade can be implemented for every customer. Phantoming adds a third – virtual – twisted pair, which would bring data rates up to 200 Mbit/s to each individual household5. Combining all options (bonding, phantoming and vectoring) would allow the DSL network to offer data rates of about 300 Mbit/s (Alcatel-Lucent, 2010, 2011).
The graph in Figure 5.3 provides an overview of the most important changes concerning the available data rates for residential users.

Broadband Internet: applications and services
Next to the gradual upgrading of its network and the extensions towards mobile services and digital television offerings, Belgacom also extended its services over the years into different fields. In 1998, for example, Belgacom launched its own website www.belgacom.be. The main purpose of this site was to clearly communicate (new) applications and services and their prices to (potential) customers. The faster ADSL connections provided a passage to the development of new applications. In 2003, Skynet’s Internet access activities were transferred to Belgacom to optimize service provisioning. Since then, Skynet is appointed to develop the new activities of the Belgacom Group, such as the further expansion of the portal site Skynet.be, broadband video, 50 years of television, vrtnieuws.net and Big Brother, legal downloading of music with the Skynet Music Club, the publishing of personal blogs, etc.
Within the concept of providing ʻICT for everyoneʼ, Belgacom participated in a number of governmental projects. In 2003, for instance, Belgacom was one of the partners in the Private PC initiative. The objective of this project was to boost PC penetration through new legislation that provided tax benefits for companies that equip their employees with a home computer and Internet connection, (Belgacom, 16/05/2003). At the beginning of 2004, Belgacom launched ʻTeleworking Plug and Workʼ. The application is a hardware solution that can be plugged into the ADSL Ethernet modem, making it possible for the teleworker to access corporate data over the Internet in a secure manner (Belgacom, 09/01/2004).
Another important acquisition involved Telindus, a company founded in 1969 which offered ICT services and solutions to the corporate and public sector. Its headquarters were located in Heverlee (close to Leuven). By taking over several foreign companies, it had grown into an international company with establishments in Thailand and China. Telindus was taken over by Belgacom at the beginning of 2006, after a hostile bidding war with France Télécom, among others. Telindus became a subsidiary of Belgacom and kept operating under its own name. After reviewing Telindus’s position in each country where it operated, Belgacom decided to retain only the operations in six countries: Belgium, the Netherlands, France, Luxembourg, Great Britain and Spain (Broens, 30/09/Reference Broens2008).
In 2011, Belgacom signed an agreement with the Spanish company FON, which represents the world’s largest Wi‑Fi community: over 4 million customers share their wireless access points with other users, and this on a worldwide scale (Belgacom, 14/11/2011). The principle of this sharing lies in setting up two access points using the client’s Wi-Fi modem: one (main) access point for private use, one (lower-capacity) access point for other customers of the FON community. The service is free for all customers of Belgacom; they only have to subscribe online to give ‘visitors’ access to their own modems, and to receive the username and password with which to use the connectivity provided by other FON users. In this way, Belgacom’s customers have free access to all FON enabled Wi-Fi connection points, both inside Belgium and abroad.
In 2011, by concluding a contract with Deezer, a music streaming company, Belgacom was the first operator in Belgium able to offer free and unlimited access to over 13 million songs. The service is offered for free to anyone owning a Generation Pack subscription, or for EUR 4.99 per month for other Belgacom customers (Belgacom, 08/12/2011).
Finally, Belgacom introduced ʻInternet Everywhereʼ in 2012, allowing its customers to opt for a single subscription to be connected everywhere, through the fixed network or using Wi‑Fi at home, through the Wi-Fi FON spots or the 3G Proximus network (Belgacom, 28/03/2012).
Mobile communications and digital television
Along with exploiting the network for the use of fixed telephony and Internet, Belgacom started conducting trials for the offering of digital television in November 2004. Belgacom TV was introduced commercially in June of 2005. Using both the earlier VDSL and the ADSL2+ technology deployed thereafter, Belgacom TV was accessible to 79.5% of Belgian households at the end of that year. In June 2009, Belgacom TV had 589,000 subscribers, around 12% of households.
In May 2005, Belgacom acquired the rights to broadcast the Belgian Jupiler Football League (Belgacom, 09/05/2005) thereby setting a hard deadline for the launch of their new digital television services. Only some important matches would be broadcast using the public broadcast channels (VRT and RTBF); all additional material would be distributed exclusively on Belgacom’s digital television platform. The monopoly rights gave Belgacom an important strategic advantage over Telenet. Because those rights are not exclusive anymore, Belgacom launched ʻBelgacom 11+ʼ, a new channel exclusive to Belgacom subscribers, broadcasting UEFA, Spanish and Portuguese soccer league matches (Belgacom, 02/07/2012).
Belgacom entered the mobile market in 1994 under the Proximus brand (see also Section 5.1.1). Although Belgacom had offered 3G services under the same Proximus brand for some time, the acquisition of a license for operation in the 1.8 GHz and the 2.6 GHz bands (acquired for EUR 20.22 million in November 2011) allowed Belgacom to be the first Belgian operator to offer 4G services. 4G was introduced commercially in 8 Belgian cities in November 2012, and extended to 17 cities by March 2013. Nowadays, Belgacom is a quadruple-play operator offering broadband Internet fixed telephony, mobile telephony, digital television and Internet access through 3G and 4G.
This multi-medium platform comprising fixed broadband, worldwide Wi-Fi access through FON and the mobile network of Proximus is used by Belgacom not only in its packaged offers (see ʻInternet everywhereʼ as described above) but also in its services. In July 2011, Belgacom launched its field test of ʻTV everywhereʼ, allowing its clients to watch TV on all their devices using the nearest available Internet source (fixed, Wi-Fi, 3G/4G) (Belgacom, 20/08/2013). After a trial period of about one year, Belgacom officially launched the service in September 2008. It is now offered for free to customers subscribed to a ʻmaxi packʼ, and for EUR 4.95 per month to other customers.
5.2.2 Telenet: an infrastructure-based competitor with similar offers
Starting in 1998, a duopoly of Belgacom and Telenet now dominates the telecommunications market in Flanders. Both companies upgraded their networks and services gradually, in order to counter the competitive pressure. This paragraph focuses on the evolution of Telenet, the Flemish cable operator. Comparison to the corresponding services offered by Belgacom is made where possible. An overview of the applications and services offered by Telenet, as well as a summary of the most important upgrades is shown in Figure 5.4.
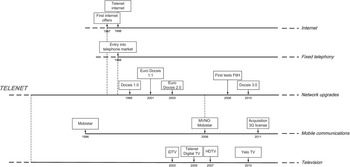
Figure 5.4 Timeline showing the most important events in the history of Telenet
Broadband Internet: network upgrades
Figure 5.5 shows the evolution of the data rates offered by Telenet. To provide its services, Telenet uses a HFC network, which consists of fibre backbones and coaxial access in the areas served. To provide broadband access, Telenet uses the DOCSIS (Data over Cable Service Interface Specification) technology. The first version of this technology (DOCSIS 1.0) was developed in 1997 by CableLabs for the US market. To match the European cable frequency spectrum, the standard was adapted and the Euro-DOCSIS technology was born. The first upgrade (DOCSIS 1.1) was launched in 2001. Now, Telenet uses the European version of DOCSIS 3.0, which allows them to offer a download data rate of 100 Mbit/s and more (Boonefaes, Reference Boonefaes2005–2006; CableLabs, 2011).
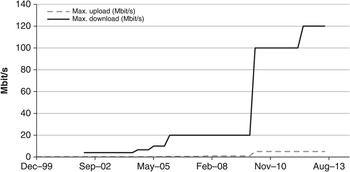
Over the years, Telenet launched various new products, each time increasing the data rates. The first telecom product was launched in 1998 under its ‘Home’, ‘Do’ and ‘Young’ packages. Telenet Internet XL came to the market in September 2000, providing a downstream rate of 1 Mbit/s and an upstream rate of 256 kbit/s, thereby doubling their previous offer. In 2002, Telenet Internet XL offered download data rates up to 4 Mbit/s, while Euro-DOCSIS 2.0, introduced in 2003 as part of Telenet ExpressNet, enabled an upgrade to 10 Mbit/s. Download data rates increased to 20 Mbit/s in the fall of 2005. In 2010 followed the introduction of DOCSIS 3.0 with a download rate of 100 Mbit/s and an upload of 4 Mbit/s.
In March 2010, Telenet launched ‘Digital Wave 2015’, a project aimed at improving the existing network over the next five years, with an investment of about EUR 30 million every year. Through the roll-out of an extensive fibre network, Telenet wants to promote the transformation of Flanders into a digital and networked economy. Along with the transformation of the network itself, Telenet aims to develop a number of new applications, such as remote medical services, call centre video assistance over the Internet, 3D television, video on demand, mobile television, new file-sharing and synchronization and e-government (Telenet, 3/03/2010). Telenet keeps upgrading its network by gradually reducing the size of the service areas (SAs). An SA is the part of the network that connects the end-customers to the first local collection point through the use of coaxial cables. From the collection point onward only fibre cables are used.
Since the available data rates offered by Telenet nowadays are much higher than those of Belgacom, the motivation to upgrade towards FttH is weaker. Telenet, however, did intend to keep up the current level of investment in their network, within the scope of the Digital Wave 2015 project. They are currently expanding their DOCSIS 3.0 technology (using channel bonding to increase data rates to over 100 Mbit/s) to all customers, and keep on increasing the available bandwidth by reducing the size of their service areas. These projects allowed Telenet to increase the data rates again in June 2012, to a maximum download rate of 120 Mbit/s and upload of 5 Mbit/s for residential customers (Telenet, 7/06/2012). Plans for deploying FttH have not been announced so far.
Broadband Internet: Applications and public service
In March 2003, Telenet launched XboxLive, an online-gaming service from Microsoft, for its high-speed cable Internet customers. Telenet also took over the activities of Hypertrust in February 2006. Hypertrust, founded in May 2000, was the first European organization that offered secure communication and storage services on the Internet under the slogan ʻYour content in actionʼ (Finance.nl, 22/07/2003). Telenet also entered the advertising business in July 2008, with the founding of a new Media Sales House, in cooperation with ‘Concentra en Var’ – the advertising department of the VRT (the Flemish public broadcast channel). The objective of this new independent entity was the acquisition of advertising and the development of a centralized advertising platform with extended segmentation possibilities (Telenet, 2/07/2008).
Telenet also offers mobile Internet to its customers through Wi-Fi hotspots. The first 120 hotspots were set up in 2003. In May 2006, Telenet reached an agreement with Signpost to launch ʻStudent Hotspotʼ (Telenet, 31/05/2006). The objective of this product is to provide all students and academics with access to all Telenet hotspots (in public locations like airports, restaurants, railway stations etc.) in Belgium and Luxembourg for rather low tariffs (EUR 7.95 per month). Telenet further adopted the principle of Wi-Fi–sharing under their Wi-Free brand (Telenet, 14/12/2011). They have several services using this principle. Their hotspot network allows Telenet subscribers to freely access these hotspots, which are Wi-Fi access points in public locations. In Belgium and Luxembourg, 1200 of those locations already exist. In 2011, Telenet extended the offer to ʻHome spotsʼ, in which customers share part of their own bandwidth with other customers (the principle is basically the same as used by Belgacom). When finished (if all customers’ modems are updated), this gives Telenet subscribers access to over 0.5 million extra Wi-Fi access points by the end of summer 2012 (Telenet, 27/02/2012). A recent article confirms the realization of this target: in January 2013, Telenet customers had access to about 700,000 Wi-Fi homespots and about 1200 hotspots (Vief, 29/01/2013).
Mobile communications and digital television
A first test project for interactive digital television (iDTV) was started by Telenet in 2003, in cooperation with Interkabel (which in the meantime has been acquired by Telenet) and some Flemish broadcasters. In 2005, hardly three months after Belgacom’s TV launch, Telenet introduced Telenet Digital TV, including extra services such as an electronic programme guide, request for missed shows and Prime, a set of movie channels. Prime is the former Canal+ Vlaanderen which Telenet took over in 2003. In December 2007, Telenet was the first to introduce digital TV in high definition (HD). To lower entry barriers, customers of Telenet can obtain the HD digicorder on a rental basis.
Following the launch of the Yelo app in 2010 (making it possible to watch TV on your smartphone or tablet), Telenet launched ʻYelo TVʼ in the fall of 2012 and commercialized it beginning 2013. Yelo TV allows Telenet’s customers to watch their favourite content (live or recorded) on any screen in the house (TV screen, tablet, smartphone, laptop, etc.).
Telenet didn’t limit its services to the fixed market for long. On 13 February 2006, Telenet signed a partnership agreement with Mobistar, one of the most important Belgian providers of mobile telephony. Telenet thus became an MVNO (Mobile Virtual Network Operator) and created the possibility of quadruple play (broadband Internet fixed telephone line, digital television and mobile phone). The first bundled offers (one bill for all requested services) were sold in August of that same year. With the contracting of Alcatel-Lucent for the deployment of mobile network elements on 16 July 2009, Telenet became the first European cable operator that is also a full MVNO6. On 27 June 2011, Telenet, together with Tecteo (the Walloon cable operator), acquired a license to operate in the 3G-spectrum band (Telenet, 27/06/2011). This acquisition of the radio spectrum license improved Telenet’s position on the mobile market, as well as on the telecommunications market in general, as this ‘mobile extension’ gave Telenet the opportunity to offer more competitive services and prices. Although Telenet ran tests for 4G (Telenet, 17/06/2010), they did not participate in the 4G auction. Instead Telenet concluded a contract renewal with Mobistar as full MVNO; the agreement between Telenet and Mobistar was prolonged until 2017, which also implies that the 3G license was never used. In May 2012 BIPT argued that the 3G-license should be used within a term of seven months to avoid losing the license (Blyaert, 15/05/Reference Blyaert2012). In June 2013 BIPT imposed an administrative penalty of EUR 5000 on Telenet (and the Walloon cable operator Tecteo) for not using the 3G-license. They were given a 6-month period to comply (BIPT, 2013b).
5.3 Case analysis: Does the duopoly setting with tit-for-tat competition suffice to realize the Digital Agenda targets?
For a very long period, telephone service provision in Belgium has been characterized by a monopoly regime and it was the imminent threat of competition, supported by the pressure from Europe, that prompted the Flemish government to start a project through which the telecom market structure in Flanders would radically change. Telenet was founded and became the key competitor for the incumbent Belgacom in the Flemish fixed broadband market (Figure 5.6) and, as such, stimulated competition, innovation and price reduction. By describing concrete examples and events, this section will analyse the dynamics of the Flemish broadband market and provide insights into the road to reach Europe’s Digital Agenda targets.
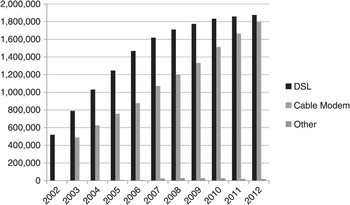
Figure 5.6 Broadband subscriptions, Belgium, 2002–2012
5.3.1 Marketing strategies: focus on own strengths
From the previous section it is clear that, although there are some smaller niche players present, the fixed broadband market in Flanders is dominated by Belgacom and Telenet, each having a close-to-100% coverage with their networks (DSL and DOCSIS, respectively). However, since the available data rates on those networks differ significantly (maximum download data rates for residential users are 30 Mbit/s for Belgacom versus 120 Mbit/s for Telenet), both players market their offers using different key services and promotions.
Since mid-2012 Telenet focuses its marketing strategy on data rates and simplicity, for both the fixed and mobile markets. In July 2012, Telenet launched King and Kong, two straightforward tariff schemes for its mobile customers. Both are bundles including voice, SMS and mobile data for a fixed amount per month. To attract or convince fixed Telenet customers, discounts are given. In June 2013 Telenet launched a similar offer for its fixed services: Whop and Whoppa bundles including digital television, VoIP telephony and fixed and Wi-Fi Internet through their Wi-Free hotspots. Their advertising emphasizes the high data rates reached (Whoppa: ʻfor whom fast isn’t fast enoughʼ) and the inclusion of all services into one simple and transparent bundle.
Belgacom, as a quadruple-play operator, goes one step further in bundling its services. Because Proximus is a subsidiary of Belgacom, they are able to offer both mobile and fixed Internet in one package: the ʻGeneration packʼ. Various options exist, for different download limits, voice and SMS usages, etc. Telenet could follow the same strategy by making use of its full MVNO contract but has not taken this path so far.
Another field of competition is the broadcasting of football matches. Although Belgacom long had the monopoly on the Jupiler Pro League Football (the main football competition in Belgium), this right is not exclusive anymore. Both Telenet and Belgacom now try to attract customers with their football channels, Telenet even promising 2,222 live goals on its Sporting Telenet channel for the upcoming season, or a refund of all subscription fees.
5.3.2 Regulatory setting: unbundling obligation and the new telecom law
Unbundling obligation
1998 was the year of the liberalization of the European telecom market. The incumbent Belgacom was obliged to open up its network to new entrants. Belgacom remained owner of the network but had to provide network access to other operators. The consequence of this liberalization was the rise of many new OLOs (Other Licensed Operators) in the following years (e.g., British Telecom, MCI, Colt, Versatel, Coditel, Tele2, Dommel, EDPnet, Mobistar, Eleven, Scarlet). This fragmentation of the market in the field of the copper network stood in great contrast to the intense concentration of the market in the cable network. This is an important observation: while Belgacom was obliged to open up its network, the cable companies were asked to form a united cable network.
However, the fragmentation of the market remained limited, as the new entrants had to combine the significant investments attached to the start-up of a new company with the need to offer low prices to attract customers. New entrants had to offer cheaper and/or better products than the incumbent, because they had to overcome customer loyalty for the existing brands. More firms in the market made the competitors play each other off by using aggressive pricing to attract more customers. This on-going price pressure made it hard for the new entrants to survive, forcing some to end their activities (e.g., Eleven) or to sell their activities to another operator (e.g., Versatel, Tele2, Scarlet).
Other operators managed to develop a customer base of significant size. An excellent example here is the operator Schedom, which provides a cheap Internet connection for urban subscribers under the brand name Dommel. Its success is implicit in the selection of the market segment. By focusing only on urban, densely populated areas (including many students and gamers), Schedom can keep its line prices low (Dommel, 2011). Other operators, like Scarlet, were taken over by Belgacom, although Scarlet remains an autonomous subsidiary (Scarlet, 2011).
The impact of the unbundling obligation remained marginal until the BIPT lowered LLU prices in 2006.7 The scale of the alternative operators was by then large enough to climb further on the ladder of investment and to invest in unbundling. These investments were stopped in 2008 when the economic crisis hit and when Belgacom announced that it intended to close down 10% of its MDFs (Main Distribution Frames) as a consequence of the move to an all-IP infrastructure and VDSL deployments in the sub-loop. Because the planned closure impacted 40% of the unbundled lines, the BIPT intervened with additional obligations8 to guarantee a fair return on investments for the alternative operators, but the investments in unbundling never recovered. See also Figure 5.7. Carrier resale has gained in volume due to take-overs (Scarlet by Belgacom, LLU network Base by Mobistar) and to the move from ADSL2+ to VDSL2 (no subloop unbundling).
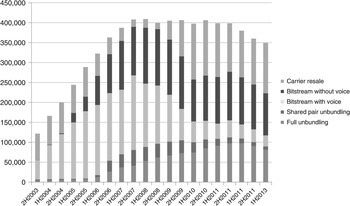
Figure 5.7 The use of wholesale access, Belgium, 2H 2003 – 1H 2013
Although Telenet long enjoyed a monopoly on the cable network and services, the CRC (Conference of Media Regulators) and the Belgian NRA (BIPT) published a proposal for opening up the cable network in 2010. This proposal was transformed into a formal decision on 1 July 2011, in which the authorities regulated Telenet and the other cable operators and created an obligation to provide wholesale access to analogue television and broadband Internet services, as well as opening up the digital television platform. Telenet responded stating that regulating analogue TV is not useful because of the declining number of subscribers and that regulating digital TV is not necessary, as in that market there is enough competition from different platforms (cable, IPTV, satellite, DTT and Internet TV). They furthermore argued that regulating the most important competitor to the SMP incumbent would definitely not enhance the infrastructure-based competition the European Commission favours (Telenet, 18/07/2011, 21/06/2011, 21/12/2010, 26/05/2011). Notwithstanding the arguments Telenet put forward, they were all rejected by the regulators. The regulators and operators are now defining the implementation of the decisions; a final decision from the Court is expected for end 2013 (Belgacom, 2013a). The CRC has already approved the qualitative elements of the decision, calling for Telenet to provide the access within a six-month period after the official request (either through impress payment or signed letter of intent) of the alternative operator (CRC, 2013). However, a final outcome of the court case is not expected before mid-2014 (Telenet, 2013).
Concerning the current LLU and bitstream access regulation of Belgacom’s network, the BIPT is also re-evaluating its models for calculating the price caps, following the European guideline to stabilize the prices for copper lines between EUR 8 and EUR 10 per month, as such increasing the flexibility for the deployment of fibre-based networks. As mentioned above, these caps were set in 2010, and remained unchanged until 2012.
The new telecom law (2012)
In July 2012, a new telecom law was voted in Parliament, focusing on transparency, competition promotion and (universal) service obligation. The law requires customer protection by obliging the operator to be transparent in their communication with their clients and by allowing customers to change operators for free. Every contract can be modified or terminated by the client after a period of six months, without needing to specify a (legal) reason. Finally, the law includes a quality of service obligation, whereby the BIPT can enforce a minimum quality level when certain requirements are not being met. With this law, the Belgian telecom market should comply with, if not exceed, the requirements set by the European Commission.
The effect of the telecom law became visible quickly after it was put into force at the beginning of October 2012. The number of ported mobile numbers rose from 71,000 in September to 160,000 in October of that same year (see Figure 5.8). Although the effect slowed down later in the year (136,000 in November, 151,000 in December), it remains significant and demonstrates the impact of telecom regulation in Belgium. This strong increase in ported mobile numbers can be fully attributed to the new telecom law, but certainly also finds a cause in the launch of the competitive King and Kong subscriptions by Telenet, strategically positioned two months before the implementation of the telecom law.
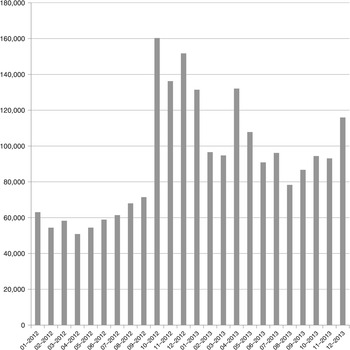
Figure 5.8 Ported mobile numbers per month, Belgium, 2012–2013
The effect on the fixed market was lower, but still significant, with a net increase of about 9,000 ported numbers (an average of 29,038 ported numbers per month before versus an average of 38,131 after the implementation date).
VDSL vectoring or VDSL unbundling?
A final regulatory intervention worth mentioning is the recent withdrawal of the VDSL sub-loop unbundling requirement by the BIPT (CRC, 2011). For VDSL vectoring to function properly (i.e., to effectively cancel out cross-talk) the copper lines connected to the DSLAMs should be handled as one bundle, which would imply the bundle is controlled by the same operator.9 Moreover, the business case for sub-loop unbundling is less attractive as the aggregation point moves lower into the network; hence, it does not attract many OLOs, BIPT has decided to withdraw this obligation in order to stimulate the commercial deployment of VDSL vectoring, thereby ensuring the competitiveness of Belgacom’s DSL with Telenet’s DOCSIS network. Because of the withdrawal of sub-loop unbundling, in the same decision the BIPT enhanced the obligation to provide bitstream by adding multicast functionality and allowing more differentiation possibilities for active access at local and regional level.10
5.3.3 External influences: blocking of 4G by Apple
Besides the regulatory influences, there are some other external influences affecting the telecom market in Flanders and Belgium, including the competitive interplay between the market parties. One salient example of this kind of influence is the impact of Apple blocking 4G access on iPhones. Although the recently launched iPhone 5 supports 4G functionality, it has not been activated in Belgium. Belgacom communicated the following: ʻ4G functionality is currently not activated on these devices making it impossible to use the Proximus 4G network. Apple will decide when 4G will be available for their devices on our network. This also applies to the 4G network of other operators.ʼ (Belgacom, 2013b).
In January 2013 Apple updated the iOS operating system, allowing iPads to surf on the 4G-network but ignored the iPhone. Proximus, the mobile brand of Belgacom, was not aware, nor notified of Apple’s plan and believes it to be a pure commercial decision (Stevens, Reference Stevens2013). Mobistar, on the other hand, is listed as a provider allowed to offer 4G on the iPhone, but they have no 4G network operational yet.
5.4 Realizing the Digital Agenda targets
Concerning the 100% coverage goal of 30 Mbit/s or more, set out by the Digital Agenda for Europe, 98% was reached by the end of 2011: 85% of households via VDSL, 95.5% via the DOCSIS 3.0 technology. Belgium is the leader when it comes to the uptake of high data rate broadband. At the end of 2012, the penetration of fixed broadband amounted to 17.5% of households (Figure 5.9), The second goal, reaching 50% uptake of high-data rate broadband (>=100 Mbit/s) by 2020 is, however, further away: an uptake of 3.4% was reached by the end of 2012.

Figure 5.9 Penetration of fixed broadband ≥30 Mbit/s in Europe, 2012 (in percentage of households)
Forecasts, however, are optimistic for Belgium. According to Akama, Belgium ranks tenth globally with observed average data rates of 6.1 Mbit/s and ranks sixth on observed peak data rates of 26.7 Mbit/s (Akamai, 2012). Analysys Mason communicated that Belgium is one of six countries that should reach the 50% uptake goal of high-data rate broadband by 2020 (Figure 5.10). Furthermore, although total revenues in the telecom market decreased in 2012, the percentage of revenues re-invested increased to 17.4%.
Figure 5.10 Forecast likelihood of reaching 100 Mbit/s by 2020, EU
However, the road to reach these targets differs strongly from other countries sharing the same goals. Belgacom communicated its VDSL vectoring strategy to achieve the goals set out in the Digital Agenda to the European Commission (European Commission, 2011), while FttH is more common in other countries. In Belgium, FttH coverage remains small: 0.2% at the end of 2011. Therefore, Belgacom commented that the Commission should assure ʻtechnological neutrality when considering investments in broadband infrastructure in view of reaching the Digital Agendaʼ. They stated that there is too much focus on FttH, while the developments by Alcatel-Lucent clearly indicate that the targets can also be reached with gradual upgrades of VDSL.
Whereas Belgacom reaches data rates of 30 Mbit/s and more, Telenet is far ahead, offering data rates up to 120 Mbit/s using their DOCSIS 3.0 technology, which is available to 95.5% of households.
Although neither operator opts for a revolutionary FttH deployment, the opportunities and possibilities for such a rollout are still being examined by the NRA (Laroy, Reference Laroy2009). This examination includes thorough cost analyses, assessing the relative weight of the trenching costs versus the service provisioning and operational costs, investigating opportunities of synergetic rollout with other utility network owners, as well as assessing the impact of public-private partnerships involving the local municipalities following examples such as the Netherlands. The Belgian NRA proposes to harmonize and standardize the right of way, to stimulate sharing of infrastructure (e.g. empty ducts), to investigate the opportunities of decreasing the price for the last mile (e.g. by allowing aerial deployment or micro-trenching), etc.
5.5 Conclusions and reflections
The status of broadband coverage and uptake in Belgium is at the top of the league in Europe. The country has reached the 2013 goals of the Digital Agenda already. Six of the fifteen ICT goals set in the Digital Agenda for Europe for 2015 were already met in mid-2013 (FOD Economie, 25/06/2013). Positive points are the percentage of broadband connections (58% of the fixed connections have data rates over 30 Mbit/s, 12% are ultrafast broadband with data rates greater than 100 Mbit/s), and widespread computer (98%) and Internet (97%) use. However, there is still room for improvement: the prices for multiple-play offers, as well as for smartphone use (voice, SMS and data), were significantly higher than the European average in 2012 and, although enterprises want to hire ICT experts, they experience difficulties in filling the vacancies.
Although the duopoly between incumbent DSL and DOCSIS operators has brought relatively fast broadband to Flemish consumers, the dominant market position of both players and the lack of more competition keep prices high for end-users. These dominant players rule the price settings and pace of network upgrades, as the barrier to market entry appears to be too high. This phenomenon is especially visible in the fixed market, where the infrastructure assets are important. In the mobile market, competition is fiercer; entry is largely controlled by radio spectrum regulation and through license auctions. Supported by the new telecom law of 2012 (see Section 5.3.2), competition has increased and prices have been significantly reduced over the last year.
Considering the Digital Agenda goals set out by Europe, Belgium is well on the way to reaching them, as multiple sources confirm. However, these goals will most probably be reached without much FttH deployment. Although Belgium holds a leading position in Europe, it is still far behind in comparison to Asian countries such as Korea and Japan. The question then rises as to how important FttH deployment is in the realization of the Digital Agenda for 2020. While its deployment may not be as urgent, will it be inevitable at some point in the future?
Another concern lies with the uptake: although both prominent market players are at the forefront, each with its own technology, the uptake of the high-end subscriptions remains rather low. Should the NRA intervene more to reduce consumer prices, or focus more on raising awareness about the opportunities and possible new applications high-data rate broadband will entail?
References
1 In 1965, Belgium counted 9,428,100 inhabitants. Assuming three people per household, almost one-third of all Belgian households were directly connected to the network.
2 Such a government-driven project cannot be identified in the Walloon region of Belgium.
3 In November 2006 UPC Belgium was taken over by Telenet with, as major advantage for Telenet, the expansion of its geographical region to Brussels and an increase of its subscribers by about 42,000. Starting from 9 July 2007, Telenet offered all its services to the former customers of UPC Belgium.
4 In November 2007 the press reported that Interkabel Vlaanderen and Telenet had concluded a policy agreement on the takeover of distribution of analogue and digital television (INDI) from Interkabel by Telenet. The other large telecom operator in Belgium, Belgacom, reacted by instituting legal proceedings, stating that the auction should be a public one. On 10 June 2008 Belgacom made an offer of EUR 420 million, but this wasn’t sufficient to persuade Interkabel, which decided to accept a final offer of EUR 427 million from Telenet on 28 June 2008 (Van Leemputten, 28/06/Reference Van Leemputten2008; Telenet, 1/10/2008). It is important to note here the role of the competition authority, which watched the development closely: given the complementarity of the coverage of Telenet and Interkabel, there was no problem about the takeover, but this would have been a concern if Belgacom had won the bid.
5 However, there is a lot of skepticism around the phantoming concept, as there are no successful field test results available yet.
6 A full MVNO (Mobile Virtual Network Operator) owns all necessary end-equipment to provide mobile connectivity, and only leases the use of antennas and spectrum from a ‘real’ mobile operator. This allows more flexibility in terms of product offerings and ranges than the light MVNO.
7 BIPT decision of 29 November 2006 on blocks and tie cable tariffs.
8 Decision of 12 November 2008 concerning the addendum NGN/NGA complementing the market analysis of 10 January 2008.
9 In recent publications it is argued that vectoring could work effectively in an unbundled environment.
10 This enhanced form of bitstream is also called Virtual Unbundled Local Access (VULA).
6 Denmark
6.1 Introduction to the case study
Inspired, on the one hand, by what is often termed old or traditional institutional economics with Thorstein Veblen (1973, first published in Reference Veblen1899) and John R. Commons (Reference Commons1934) as important early contributors and, on the other hand, by a political economy framework putting emphasis on the interplay and interdependence between political, economic, and technological developments (Melody, Reference Melody and Mansell2007), this contribution examines the actors and factors that influence broadband developments in Denmark – with an emphasis on the telecom operators and the political-administrative institutions.
As not all important aspects of the developments can be included in the analysis, the focus is on the critical incidents and the major actors and factors affecting developments. Such an approach presupposes that the development of broadband is not always a continuous trajectory but includes turning points, where new actors and factors affecting developments enter the ‘game’ or where important changes in the relationships between technology, market, and policy take place.
At some moments, technology factors may be the most important in driving broadband developments. At others, it will be political and regulatory or economic and market actors and factors that are the primary drivers. In the 1980s and the first part of the 1990s, broadband was, first and foremost, a technology issue with research and development initiatives of technology providers and public institutions in connection with, for instance, the European RACE research program.1 It was also a policy issue in the sense that national states attempted to promote broadband developments by pushing and funding initiatives like the Danish hybrid network or in France the large Plan Cable2. When telecoms were fully liberalized in Denmark in 1996, it was a rather ‘academic’ issue, at first, in the new regulatory structure whether broadband should be included in the universal service provision. It was only when ADSL reached the European markets that broadband regulation became a hot issue. From then on, the drivers of fixed broadband developments were primarily market initiatives of the operators and regulations enacted by policy-makers and implemented by regulators. In the present situation, policy initiatives such as the broadband goals of the EU and Danish national goals are important drivers of broadband developments. And, in the mobile area, 3G and LTE have allowed for the development of mobile broadband connectivity.
An ongoing issue in the policy debates on broadband developments is concerned with infrastructure and service competition (Henten and Skouby, Reference Henten and Skouby2005). Although infrastructure competition became an element in Danish broadband policies with the strategy of ‘many pipes to the home’ being promoted from 1999, emphasis in the Danish broadband policies has been on service competition. ‘Many pipes to the home’ has, to a large extent, been an advocacy for deploying many different broadband technologies more than an advocacy for promoting infrastructure competition. The PSTN incumbent TDC has, for instance, been allowed to maintain its cable operation in contrast to many other countries, where incumbents had to divest their cable interests or have been prevented from entering the cable market.
The ladder of investment theory expounded by Martin Cave (Reference Cave2006) has been an important guide in Danish telecom policy and regulation. When ADSL reached the market in Denmark, the Danish authorities were quick to implement a relatively strict policy for interconnection and infrastructure access. Interconnection and access prices were regulated to become among the lowest in Europe. However, in accordance with the ladder of investment theory, LRAIC (Long Run Average Incremental Cost) prices were later set in such a manner that interconnection and access prices would increase, which presumably would lead telecom operators to consider competing on the basis of investments in new infrastructures instead of using the network of the incumbent.
Against this background we will explore the development of the telecommunications market and aim to explain its performance.
6.1.1 Historical framing and overview of developments
In contrast to most other monopoly telecom markets, prior to liberalization there was not one national operator in Denmark. The Danish telecom market was indeed a monopoly market, but the monopolies were regional. In the late phase of the monopoly era, there were four regional operators, and it could be claimed that there was a kind of yardstick competition between these operators. In combination with a relatively high GDP per capita, this contributed to a well-developed penetration of fixed-line telephony in Denmark compared to most other countries.
In 1990, a holding company named Tele Danmark was formed in order to unite the regional operators and in 1995 the regional structure was entirely abandoned. Before the establishment of Tele Danmark, the fixed-line penetration rate had reached approximately 57 per 100 inhabitants, and when fixed-line telecommunications was liberalized in Denmark in 1996, the penetration rate had increased to approximately 62 per 100. Up until 2001, the penetration rate of fixed-line telephony kept on increasing, reaching its peak at approx. 72 per 100 – and has decreased ever since, being no more than around 25 per 100 in 2012; these figures include ISDN. PSTN-based telephony actually started decreasing even before 2000. Regarding broadband, the point is that the fixed-line telephony access infrastructure in Denmark is very well developed, which is important for the strength of DSL.
Tele Danmark (to be renamed TDC in 2000) was established with the explicit purpose of strengthening the Danish position in what was seen as a soon-to-be international telecom market. The liberalization trends, developing in the early to mid-1980s and receiving a strong platform at the European level with the 1987 Green Paper (CEC, 1987), were to a large extent seen – maybe not as a threat but at least as a serious challenge by the majority of politicians and the telecom administrations in Denmark. It was thus not the liberalization of the Danish telecom market which was the primary goal of Danish telecom policies at the beginning of the 1990s but, rather, the defense and strengthening of a Danish ‘national champion’. Hence, in the European context, Denmark was not among the front runners with respect to telecom liberalization at the beginning of the 1990s. However, this changed in the mid-1990s, as it became clear to the Danish government that liberalization would eventually be the result of international developments. In 1995, the Danish government issued a policy strategy document entitled Bedst og billigst hennem reel konkurrence (‘Best and cheapest by way of real competition’) (Forskningsministeriet, 1995), which inaugurated a swift change in Danish telecom policies. First, value-added fixed-line services were liberalized, and in 1996, eighteen months before the EU’s 1998 deadline, the provision of fixed-line infrastructure and fixed-line telephony services were also liberalized.
Ahead of this development, customer premises equipment (CPE) had been liberalized in 1990, and two companies had been licensed in 1991 to operate 2G mobile networks in the 900 MHz band. One of these was the Danish incumbent Tele Danmark and the other was a new Danish company called Sonofon, which was later taken over by the Norwegian incumbent Telenor. In 1997 licenses for GSM 1800 were awarded, which resulted in four mobile network providers operating GSM networks (900 and 1800 MHz): Tele Danmark, Sonofon, Telia (the Swedish incumbent), and Mobilix (later Orange). Further in the process, in 2001, a new mobile infrastructure provider, 3 (Hutchison Whampoa), entered Denmark in connection with the 3G licenses. Upon Telia taking over Orange in 2004, there are four mobile infrastructure providers (TDC, Telia, Telenor, and 3) in Denmark at present, of which two of them (Telia and Telenor) have started sharing their mobile infrastructures. All four operators offer 3G as well as LTE (‘4G’), allowing for mobile broadband.
In 1997, the Danish state sold its shares in Tele Danmark, resulting in the American operator Ameritech (later SBC, following the merger between Ameritech and SBC) becoming the dominant shareholder in Tele Danmark. This came as a real surprise to the Danish public, as hitherto the main thrust in the international liberalization of telecommunications had been the creation of a strong Danish operator; and what would then be the result of a US company taking over? In reality, it did not result in any major changes and was, to a large extent, an expression of different confluent developments:
(1) the Danish telecom market had quickly become one of the most liberal markets in Europe;
(2) the Danish market was one of the most advanced telecom markets, technologically;
(3) the Danish market being advanced with respect to penetration, it was seen as a kind of test market; and
(4) last but not least, Ameritech paid a vast sum of money for the Tele Danmark shares, which alleviated the financial situation of the Danish state.
The Ministry of Finance was the main driver behind this development.
With the Danish state selling its shares in Tele Danmark, the incumbent operator became totally privatized. The state did not even maintain a ‘golden share’ or any other special right of intervention. And further down the trajectory, the vast majority of shares in the company were sold to a group of private equity funds. This also created a degree of unrest: it was one thing to sell the company to another telecom company with strategic interests in the telecom field but quite another to sell the company to equity funds without any special interest in telecom and whose primary raison d’être is to extract as much money as possible from their acquisitions.
As in most other European countries, until the mid-1990s the Internet was used almost only in universities – and only by a small minority at those universities. Tele Danmark gave priority to trials and marketing of videotex solutions, and it was not until 1995 that the final attempt with videotex was given up in Denmark and Tele Danmark started focusing on the Internet. ADSL was introduced in Denmark in 1999. The first to offer ADSL was a small Danish company, Cybercity (later to be bought by Telenor), and Tele Danmark followed quickly thereafter. Cable modems were also introduced in Denmark in 1999, first by Stofa (which at that time had been taken over by Telia) and shortly thereafter by Tele Danmark. The uptake especially of ADSL but also of cable modems grew very quickly, and broadband penetration in Denmark has for many years been among the highest in the OECD countries. DSL and cable modem solutions constitute the mainstay of fixed broadband access in Denmark.
In addition to DSL and cable modem solutions, fibre in the access networks also started to develop. However, fibre penetration is not near the level attained in either Japan or Korea, and also Sweden and Norway are somewhat ahead of Denmark. But fibre has started growing, mainly promoted by energy companies. In the past few years, TDC has also given more attention to the fibre access market by acquiring the fibre operation of DONG, the largest energy provider in Denmark, in 2009 and the broadband access company ComX in 2013. The energy companies have been the promoters of fibre in the access networks. One of the energy companies also offered a WiMAX solution for a number of years but had to close it down in 2012 because of lack of profit and future development possibilities. In 2012, another energy company, Syd Energi (SE), made a bold move and bought Stofa, making SE the second largest cable modem access provider in Denmark after TDC.
The result is that the broadband access market in Denmark is based on DSL and cable solutions as well as fibre access – in addition to the very fast-growing mobile access market. TDC is the dominant player in the DSL market. The cable access market has two main players, TDC and Stofa, with TDC being the dominant one. In the fibre area, the energy companies with their cooperation in the company Waoo! are the largest players, followed by TDC. And in the mobile market, the dominant players are the four mobile infrastructure providers: TDC, Telia, Telenor, and 3, with TDC being the largest one. In addition to these players, there are a large number of service providers of various kinds. In Denmark, companies do not need a license to operate in the telecom field, except for mobile infrastructure providers. New service-based companies are being established constantly and can grow to a considerable size in terms of subscriptions, especially in the mobile area. However, almost as quickly as these companies grow in the market, they are taken over by the main infrastructure providers. The business models of some of the newcomers actually aim at being taken over by the larger players.
As can be seen from this brief overview of operators, the Danish incumbent TDC is present on all platforms. In most other European countries with cable TV networks, the incumbent telecom operators can have no cable operations – in the interests of promoting infrastructure competition. In Denmark, however, this has not happened, and the result is that TDC is the all-dominant player in the Danish broadband market.
In this contribution, this issue is further discussed, as are the possible implications of equity funds having owned the incumbent operator TDC. Furthermore, the implications of the use of different kinds of infrastructures are examined. Moreover, the paper aims to shed light on the importance of the interplay between service development and infrastructure development. For the period leading up to the introduction of broadband via ADSL in Denmark in 1999, the most important developments seem to be the establishment of a national incumbent in 1991, the full and relatively early liberalization of all telecommunications in 1996, and the great emphasis that has been put on service developments from the policy side.
6.1.2 Structure of the chapter
First, development in the policy framework is described in Section 6.2. This is followed by an introduction to the key actors in the telecom area in Section 6.3. In Section 6.4, investments are examined. In Section 6.5, the coverage issue is addressed. Section 6.6 analyses how competition has evolved, and Sections 6.7 and 6.8 look at how the market has performed from a demand side perspective. Section 6.7 thereby looks at the uptake of broadband, while Section 6.8 goes into other aspects of the EU Digital Agenda targets regarding the use of services by private citizens as well as private companies. Finally, the main actors in the development of broadband – operators, political and administrative institutions – are discussed in Section 6.9, and conclusions and reflections are put forward in Sections 6.10 and 6.11.
6.2 Telecommunications policy and regulation
Traditionally there has been a broad political consensus around the general information and communication technology policies and the more specific telecom-related policies in Denmark. There have been no major differences in these policy areas between the liberal and right-wing parties, on the one hand, and the social-democratic or left-wing parties, on the other. Lately, however, policy discussions regarding the financing of future investments in broadband infrastructures have erupted.
Hitherto, the general policy trend has been not to intervene on the supply side by way of public investments but to focus on policy initiatives on the demand side in terms of public use of communication infrastructures and public services requiring Internet access. This implies public support for the development of service and application areas related to public sector functions and institutions. The policy is thus demand and service oriented, and very little public money has been going into building or extending broadband infrastructures. Two of the more recent exceptions have been the public research and education network and a few municipalities using public money for local broadband initiatives. Generally, following the liberalization in the mid-1990s, broadband infrastructure construction has, been left to private enterprises, and political influence has been exercised through the setting of a regulatory framework and through policy initiatives mainly on the demand side.
The phases of telecom policy and regulation in Denmark are clearly related to the phases of the telecom policies of the EU – but now and then Denmark has been a laggard and now and then it has been ahead. The first phase of the liberalization process started in the mid-1980s and ended in the mid-1990s with the introduction of a fully liberalized telecom market in 1996. This can be seen as the phase with a gradual, and at times reluctant, adaptation to the new competitive market situation. The second phase was inaugurated by the policy decision to fully liberalize the Danish telecom market in 1996 and ended in 1999 with a political agreement in Parliament constituting the undisputed policy foundation for Danish telecom policies for many years. This can be seen as the phase where the policy foundation was consolidated and where the focus was almost entirely on promoting service based competition in the fixed broadband area. This was followed by a third phase with continuous adjustments to market developments on the basis of a policy platform promoting competition and with a greater emphasis on infrastructure competition. This third phase, however, seems to be reaching its end at present. At a broader international scale and in Denmark, too, there is an increasing focus on building new infrastructures and less focus on creating competition. This signals a new turn in telecom policies, which has only begun to materialize in the Danish context.
In addition to an elaboration on these different phases, with a focus on telecom regulatory policies, a sub-section on ICT demand-side policies is included. While there are clearly separate phases in the regulatory policies, the broader ICT policies are very consistent over the whole period, starting with the ‘Informationssamfundet år 2000’ (The information society year 2000) (Forskningsministeriet, 1994) from 1994. The emphasis always has been on stimulating demand for services and applications and on developing public services and applications, whereas public economic support for the development of the infrastructure has not received any priority.
6.2.1 The first phase – reluctant liberalization and focus on industrial policy
The first phase began in the 1980s resulting in the liberalization of customer premises equipment (CPE) in 1990 and the licensing of two competing mobile operators in 1991. Telephone subscribers had already begun to buy their own phones in super markets and attach them to the network in the 1980s, and at that time mobile telephony was not seen as a central revenue generator for telecom operators. In this early phase, and in the beginning of the 1990s, the Danish government was reluctant to infringe upon the powers and privileges of the incumbent (formed by merging the former regional monopoly operators and a state-owned international operator in 1990), and the liberalization process was mainly driven by the requirements from the European Commission.
In addition to the reluctant adaptation to the new upcoming liberalization, there was also a recognition that other types of communications were on their way, requiring more bandwidth than existing kinds of communications. An initiative to invest in broadband facilities was taken in this phase – in 1985, when it was decided to build a so-called hybrid network. This network had a dual purpose: (1) to provide private households, connected to a cable TV network, with TV and radio channels; and (2) to provide private companies and public institutions with high-speed data channels (mainly for the purpose of two-way video-transmission). Four out of twelve fibres in the system were dedicated to radio and TV broadcast. Another four fibres were allocated for the high-speed network, and the remaining four fibres were reserved for future use. The project was initiated as a public investment but was foreseen to be self-financing within six to seven years. In the first planning phase, an estimate by the Ministry of Public Works was that the total investment would be approximately DKK 4 billion (equalling approx. DKK 8.5 billion in 2013) including telecom company investments and investments by cable antenna communities (Østergaard, Reference Østergaard1986). The real investments were only a fragment of this, so the ‘grand’ project was never realized to the originally anticipated extent.
The idea with this shared infrastructure was to pave the way for a fully integrated broadband network by sharing the costs with cable TV subscribers. In addition, the project was seen as a support for Danish industry. In the initial phase, the network was based on the Danish DOCAT (Digital Optical Community Antenna Trunk) standard, and the large Danish producer of cables, NKT, lobbied strongly for the project. Thus, the hybrid network would create more demand for Danish-produced telecom equipment and, at the same time, provide Danish industry with access to new advanced communication services.
However, the number of companies using the hybrid network as a communication facility remained extremely low and in reality the network became a cable-TV network. In 1995, the network was closed down as a separate network and integrated into the Tele Danmark (later TDC) networks. Today, the most important remaining impact of this hybrid network is that it allowed Tele Danmark to engage in the provision of cable TV services – a market they were denied by regulation until then.
Another important initiative in this period was the formation of Tele Danmark. Up to 1990, the Danish telecom market was served by four regional operators, all with dominant public ownership. Long distance and international communication was under the auspices of the department for Post and Telecom. The reason for this merger was to prevent the emerging competition among the regional operators and to create one strong Danish player in the international telecom market.
While the hybrid network and the creation of Tele Danmark both strengthened the government-controlled monopoly, a more liberal approach was taken in the area of mobile communications. Two operators were licensed to operate mobile networks in Denmark in 1991. The incumbent received a license, and the other was assigned to a new company named Sonofon, which was later taken over by Telenor. Sonofon was established as a joint venture between the Danish telecom company Great Northern Telegraph Company and the American Bell South. The reason for the mobile exception to the rule was that mobile, at that point of time, was not considered an essential part of the telecom area, as fixed line telephony constituted the cornerstone of the telecom business. Furthermore, the initiative could strengthen the Danish position before the expected liberalization of the telecom markets.
6.2.2 Second phase – promotion of real competition
While Denmark in the late 1980s and the first part of the 1990s ‘dragged its feet’ with respect to reforming its telecom market, the government, led by the social democrats at that time, saw ‘the writing on the wall’ with information society plans and suggestions for reforming the telecom area coming out of the US and from the European Commission. The decision was made to take a proactive stance on the potential of information and communication technologies and to reform the telecom market. This was in a sense an innovation of the Danish policies in the area – a radical innovation – which was subsequently followed by a continuous stream of incremental additions.
This fundamental change started with the creation of new ministry of Research and Telecommunication and the publication of ‘Informationssamfundet år 2000’ (Forskningsministeriet, 1994). The report aimed at presenting a vision/project for how ‘modern information technology will bind together public institutions and businesses and constitute a proposition to the citizens’ (Forskningsministeriet, 1994). One year later, the Ministry of Research issued a report entitled ‘Bedst og billigst gennem reel konkurrence’ (‘Best and cheapest by way of real competition’) (Forskningsministeriet, 1995), which came to function as a kind of blueprint for the process of liberalizing the Danish telecom market.
In spite of various qualifications made since then, this overall policy strategy is still valid. Competition on the Danish market was to be promoted through an early liberalization combined with a rather strict competition regulation. The idea was that Denmark should be among the first countries in Europe to liberalize its telecom market and, thereby, attract foreign telecom investments.
Therefore, the Danish parliament made a decision aiming to complete the liberalization process for services and infrastructure eighteen months ahead of the 1998 target set for liberalization of the European telecom markets. Since then and until recently, it has been a priority to stimulate competition and Danish telecom legislation has been ahead of the requirements set by European framework regulations in most areas.
In this period, France Telecom chose Denmark as the destination for their first major foreign investment in Europe. They established a new mobile operator, Mobilix, and contributed to making the Danish mobile market one of the most innovative and competitive in the world.
Whereas there was infrastructure competition in the mobile area, the emphasis was on service based competition in the fixed network market, and a key issue was to ensure open access and low interconnection charges in order to enable new entrants to compete with the incumbent operator, Tele Danmark. The Interconnection Act was passed, stipulating inter alia that operators with a significant share of the market (that is to say more than 25%) were to grant interconnection to other operators at cost-based prices and on terms that were objective, transparent, and non-discriminatory.
Another initiative taken in order to promote competition was the unbundling of the local loop. This was introduced in 1998, when Mobilix wanted to introduce ADSL before this service was available from Tele Danmark.
The pricing principles for unbundling introduced in 1996 were based on historical costs. The principle was to allow the inclusion of the total extra costs related to the provision of the service plus a reasonable margin. However, if the dominant operator (the incumbent carrier) had a market share of more than 80%, only 30% of the operating costs should be included. This implied that the incumbent operator should bear a part of the costs until the new entrants had obtained a reasonable market share. In this way, the incumbent was required to subsidize its competitors until some of them had established themselves on the Danish market. This approach was compatible with the investment ladder strategy later described by Martin Cave (Reference Cave2006).
To ensure low interconnection rates, the historical cost approach was supplemented by a best-practice clause in 1998, enabling the national telecom regulator to reduce interconnection charges to the international level for best practice even if Tele Danmark was able to document that the actual costs were higher. The definition of best practice was subsequently changed after several debates between the telecom agency, Tele Danmark and the new entrants. ʻBest practiceʼ came to be defined as the average of the interconnection rates in the three countries with the lowest interconnection rates. It was also possible for the regulatory agency to reduce rates if they were lower in just one country. However, in this case, corrections for country-specific conditions should be made in advance. By definition, the best practice clause kept the Danish interconnection rates among the lowest in Europe and the charges were reduced to one-third within five years (Falch, Reference Falch2002).
Stimulating competition was not the only policy created to facilitate infrastructure development. In order to ensure coverage in rural as well urban areas, a universal service obligation was adopted in 1996 and Tele Danmark, as the incumbent operator, was appointed as the universal operator in all markets. However, Denmark went further than demanded by the EU legislation, as Tele Danmark had an obligation to provide ISDN and leased lines in addition to provision of ordinary phone services.
6.2.3 The third phase – technology-neutral regulation
In 1997 the EU issued a Green Paper on the convergence of communication technologies (CEC, 1997). The markets were increasingly developing from vertical to horizontal structures, and different infrastructures were starting to deliver essentially the same services. One of the implications was a greater emphasis on promoting different infrastructures in order to create ‘real’ – meaning infrastructure-based – competition instead of just service competition. In Denmark, this found an expression in the political aim of ‘several pipes to the home’ announced in a political framework agreement signed in September 1999. The government added to the ‘best and cheapest’ policy the goal of promoting public access to the network society. Fostering competition was seen as the principal means to achieve this goal, through initiatives aimed at stimulating the creation of competing access routes for consumers.
This policy has been termed by the government as technology-neutral and market-oriented. Such a characterization is obviously self-congratulatory to some extent, as the overall policy and regulatory framework favors some kinds of infrastructure developments over others and specifically favours certain technology developments in the wireless broadband area. However, the characterization is correct in the sense that public money is not allocated for the development of specific types of network infrastructures.
Following the political agreement of September 1999, much of the existing legislation for the telecom sector was consolidated into the Act on Competitive Conditions and Consumer Interests in the Telecommunications Market in July 2000. By the adoption of the new legislation, it was decided that interconnection rates in the future should be based on LRAIC (long run average incremental costs). The regulatory agency, Telestyrelsen, therefore initiated the construction of a cost model for the Danish telecom networks, building on the LRAIC concept. Interconnection charges, set on basis of the LRAIC model, took effect from 1 January 2003. Ordinary interconnect charges were reduced by 17–36%, but the LRAIC price calculated for raw copper was 24% above the current price at the time (Falch, Reference Falch2002). Therefore, it was decided to implement this price increase on raw copper over a period of seven years. As a result, interconnection charges have increased from among the lowest in Europe to a little above the EU average. See Table 6.1.
Table 6.1 Average total cost per fully unbundled loop (€ per month), Denmark and EU, 2002, 2009 and 2011

It can be argued that the LRAIC approach for calculating the interconnection rates is objective and scientific. Still, there is plenty of room for discretion in the price-setting. In Denmark, the LRAIC model was elaborated in collaboration with TDC as well as a group of new entrants. The new-entrant group was dominated by mobile operators and their primary interest was to ensure low rates for fixed termination of mobile calls. Furthermore, an increase in prices for raw copper was in accordance with the ‘several pipes to the home’ strategy, as it would presumably promote infrastructure investments by alternative operators. It would, therefore, be in line with an investment ladder strategy, as increasing interconnection charges were supposed to incentivize new operators to invest in new infrastructure instead of relying on old infrastructure owned by the incumbent.
At present, the price regulation of wholesale broadband services has become less strict than at the turn of the century. However, the regulation in other areas regarding open access is broader in its scope than in most other European countries. The telecom legislation does not distinguish between different types of fixed communication networks. This implies that the same regulation applies to copper wire, coaxial cable, and optical fibre networks and an SMP operator can be required to open any network regardless of the technical platform used.
The inclusion of cable and optical networks is relatively new. In December 2009 the regulatory agency required TDC to open their cable network, enabling other operators to use this infrastructure for the provision of broadband services. The implementation of this, however, has caused problems. An LRAIC model has been developed, but no competing service providers are currently able to offer broadband on TDC’s cable network because of the technical frequency allocation of the network.
Since June 2011 TDC has also been required by the regulator to open its fibre-based broadband access network to other operators and service providers. This applies not only to the current subscribers of TDC, but also to homes passed. Potential broadband subscribers can demand to be connected to TDCs optical network if the network passes their home in a distance of less than 30 m. The costs of connection, which are estimated to be around EUR 2,000, must be paid by TDC – even if the customer wants to subscribe to a competing operator.
One can argue that the Danish telecom regulation is in line with the technology-neutral principle recommended by the European Commission. However, the Commission does not recommend including fibre and cable networks in the definition of the market for broadband access (market 5). Denmark is, indeed, not the only country that applies a definition that deviates from the EU recommendation on this point. Cable access is included in market 5 in eleven other EU countries (Valcke et al., Reference Valcke, Hou and Stevens2011). However, Denmark is the only country, where this has been followed by a request to an operator to provide open access to cable as well as to fibre networks. The best explanation for this state of affairs is that TDC has a stake in, if not dominates, all fixed infrastructures.
6.2.4 A fourth phase of regulation?
Lately, the contours of a new phase seem to be appearing internationally. This phase puts less emphasis on stimulating competition and more emphasis on infrastructure construction. The reason is that it has turned out to be difficult to stimulate infrastructure competition if it did not already exists on the basis of a legacy cable network, and that the companies investing in new infrastructures (fully or partly optical networks) complain that there is no incentive to invest if competitors can obtain access to the new networks on equal terms. TDC has also argued along these lines.
In 2010, a new policy initiative was presented in Denmark. This initiative was launched against the background of the general international surge of broadband plans in connection with the financial and economic crisis starting in 2008. In Denmark, a High Speed Committee was established to examine whether initiatives were needed to support broadband development. The results of the deliberations of the committee illustrate the general political priorities in Danish ICT and broadband policies with a focus on the demand side. There were no suggestions for using public money for broadband development.
However, the irony of the matter was that, even though this was fully in line with longstanding Danish ICT and broadband policies, the minister responsible for the ICT area at that point apparently felt that something more had to be done. Therefore, a policy statement was issued saying that by 2020 ‘100 Mbit/s or more for all households and enterprises’ would need to be available. There was no economic backing for this goal. It was merely an expression of intent for the market players to realize. The only tangible political measure to implement broadband was concerned with requirements regarding coverage by operators in connection with license auctions for mobile broadband frequencies. In addition, the minister announced a constant ‘political attention’ to broadband development – which is rather intangible but nevertheless puts pressure on operators to make available higher broadband data rates to everyone.
In 2011 a new government came into office. One of their first initiatives was to dissolve the national IT and telecom regulator, the IT and Telecom Agency. This move might not be as drastic as it seems at first glance, as most of the activities have been continued in other departments, but public attention on ICT as a specific policy area was reduced. In their recently published plan for broadband and mobile infrastructures (Erhvervsstyrelsen, 2013), the policy initiatives are in line with the initiatives suggested by the High Speed Committee but with slightly more active participation by the public sector. For the first time, the government will be engaged in direct economic support to public infrastructure developments. It granted EUR 6 million to a specific region (Bornholm), and encouraged public-private partnerships in other regions. Even though the amount is very small, it marks a change from the former policy. And more initiatives are demanded by various actors, including fibre operators, Telia and Telenor, organizations of business and residential users, and municipalities. In an address in October 2013 to the minister of Business and Growth, these organizations asked for re-opening of the political agreement from 1999. Their precise aims were not clear but appear to demand a new approach to Danish ICT policies.
6.2.5 Demand-stimulating policies
While regulatory policies have undergone continuous incremental changes since the early liberalization, the policy on the demand side has remained basically unchanged since ‘The information society year 2000’ report of 1994. It is based on the understanding that infrastructure and service development initiatives are mutually interdependent. However, the Danish policy has, until now, been to intervene in this interdependent relationship by way of promoting the service side.
This includes the promotion of G2G e-government: i.e., the use of ICTs internally in public administrations and between public administrations in different areas and at different levels. But, more importantly for broadband development, it also includes the promotion of electronic communications between public administrations and citizens and businesses. An example of such initiatives is that public administrations no longer accept paper based invoices from companies with which they do business. Also, all-electronic tax reporting between the tax authorities and citizens and companies has become the norm as of 2012, although other means of communicating with the authorities remain possible for people who do not use the Internet, such as the elderly. Also from 2012, all students applying to higher educational institutions must do this electronically. Another example is the cooperation of a public-private-partnership between the state and financial institutions regarding identity management in electronic communications: the same identity management system is used in electronic communications between citizens and public administrations and for electronic banking. The implications of such initiatives are that there is increased pressure on citizens and companies to communicate electronically and, therefore, to use broadband connections.
A characteristic example in this context was the broadband policy initiative presented by the High Speed Committee in 2010 (Højhastighedskomiteen, 2010). Seven areas of policy initiatives were given priority. The first two were digitalization of the public sector, and using the public sector as a platform for innovation. This was followed by suggestions regarding the development of cloud computing and information and IT competency and by initiatives regarding the environment, climate and green IT, as well as research and development in the IT area. This policy input is perfectly in line with policy initiatives since the mid-1990s.
6.3 Operators on the Danish market
6.3.1 TDC – the incumbent operator
The incumbent operator – first named Tele Danmark and later TDC – was created by a political initiative in 1990 as a holding company owning the four regional monopolies and one international operator that existed at that time. A large share of the total stock, resulting in a controlling interest, was later sold to a foreign company, Ameritech, which later merged with another American operator, SBC. In 2006, a group of private equity (PE) companies took over 87.9% of the TDC stock – a share that has been reduced gradually, with a final PE exit in September 2013.
As the incumbent operator, TDC is by far the largest supplier of physical broadband infrastructure. TDC is the only provider of a copper based infrastructure covering close to 100 per cent of all households. TDC also possesses the largest cable network, covering more than half of all households (homes passed). And, since 2003 they have laid down fibre tubes whenever a new building has been constructed, and they now own an extensive fibre network of 45,000 km.
TDC follows a strategy where gradually copper-based facilities are replaced by optical fibre and the DSLAMs are moved closer to the customer. In this way, it becomes possible to provide DSL services at higher data rates without providing a full FttH solution. Through the use of vectoring technology, TDC will be able to provide 100 Mbit/s and eventually up to 250 Mbit/s using the existing copper cables. TDC expects that the market share of copper-based solutions will decrease, although copper will still have a role to play in 2020.
TDC provides FttH as well. In 2009, TDC acquired DONG Energy’s 7,000 km fibre network with 15,000 end users in the capital region. In 2013 TDC bought the broadband provider ComX, also in the capital region. With these networks, TDC now has a fibre network, which covers more than 200,000 households (homes passed), and this number is expected to increase to 500,000 in 2020, or approximately 20 per cent of total households.
The role and impact of PE ownership has been subject to extensive discussion (Nyrup, 2007). While the data rates offered to consumers have not developed as fast as predicted (ITST, 2011), it is not obvious that the PE take-over changed the course of development significantly. For telecom users in Denmark, the most significant implication is that TDC has continued the course which was laid in the Ameritech/SBC period: i.e., to be a second mover with respect to new network solutions on the Danish market and not to use the Danish market as a test bed for wider international initiatives.
On the other hand, PE ownership has had severe consequences for the international presence of TDC, as the PE owners sold off most of the international operations and turned TDC into a company operating primarily in the Danish market. During the past decade, the two other large incumbent Nordic operators, TeliaSonera and Telenor, have become sizeable international players, while TDC has shrunk to become basically a national player.
6.3.2 The largest competitors
Next to TDC, the three largest competitors on the Danish market are the two other Nordic incumbents, TeliaSonera (under the brand name of Telia in the Danish market), Telenor, and the operator 3. Telia and Telenor are operating in fixed as well as mobile markets. However, both companies focus on mobile communications, as it has been difficult to penetrate the fixed market, while 3 is a mobile-only company.
Telenor Denmark, with a turnover of EUR 765 million in 2012, is the second largest provider of broadband and telephony in Denmark. Telenor entered the Danish market in 2000 through the acquisition of a majority share of Sonofon. In the Danish market, Telenor is first of all a mobile operator, but has also achieved a position as major provider of broadband services through the acquisition of Cybercity in 2005. Cybercity was established in 1995 and had for a short while, up to 2000, a higher DSL market share than TDC, on the then relatively small DSL market using unbundling of TDC’s network. In 2012, Telenor had around 175,000 DSL customers and a market share of approximately 15 per cent. However, the company does not own a copper infrastructure and depends on TDC’s access network for the provision of DSL services.
Telia Denmark is part of the Swedish/Finnish incumbent telecom operator TeliaSonera and the third largest telecom operator on the Danish market with a turnover of around EUR 683 million in 2012 when they had approximately 75,000 DSL customers (6.3% market share). Until 2010, they had their own cable infrastructure, as they owned the Danish cable operator Stofa. Telia was the first operator to introduce LTE services on the Danish market in late 2010 and their strategy is to market mobile broadband as an alternative to fixed broadband. The selling of their cable business in 2010 can be seen as part of this strategy.
In 2013, Telia and Telenor started offering mobile broadband jointly, using infrastructure sharing. The purpose is obviously cost savings, but it also indicates the severe competitive pressure for competitors to TDC in any technology area on the Danish market.
The operator 3 (Hutchison-Whampoa) entered the Danish market in 2003 in connection with the launch of 3G in Denmark. 3 was the first on the Danish market with 3G and the company was the largest 3G provider and promoter for a long time, while the other providers held back their 3G operation because of lack of services requiring 3G capacity. 3, however, was forced to enter the 3G market as soon as possible as they, unlike their MNO competitors, did not hold a 2G license as a fallback. The market share of 3 fell when the other MNOs started launching 3G, and 3 held approximately 10 per cent of the mobile market in 2012.
6.3.3 Syd Energi and other energy companies
In addition to DONG Energy, which sold its network facilities to TDC, other energy companies have invested in fibre networks since 2000, and their networks pass around 700,000 households (approx. 25 per cent of total households). Approximately 200,000 customers are connected or are about to be connected. Since the economic downturn started in 2008, the energy companies have scaled down their investment activities and are focusing instead on obtaining more customers to be connected to the existing infrastructure.
The most important player among the energy companies is SE (Syd Energi). SE is the energy provider in South Jutland. This region is one of the least densely populated regions in Denmark but, due to SE, it is also the region with the best coverage of optical fibre.
In February 2013, the Competition Authority approved the acquisition of Stofa by SE. In the cable access market, Stofa is the second-largest provider of broadband via cable after TDC. In 2011, 414,000 customers were connected to the Stofa network, approximately 20 per cent of the CATV market. Out of these, 151,000 were supplied with broadband. Stofa was formerly owned by Telia but was acquired by the Swedish private equity firm Ratos in 2010. Their infrastructure covers major cities especially in Jutland and Funen. There is little overlap with TDCs cable network and hence the direct competition between the two is limited.
In September 2010, the energy companies formed Waoo! in order to promote broadband services via their fibre infrastructure. With 155,000 customers (4.5 per cent of households), Waoo! is the most important provider of broadband via fibre.
6.3.4 Other infrastructure providers
Another player in the Danish market is COLT Telecom. They operate their own fibre network in Copenhagen and provide wholesale and retail services to business customers. GlobalConnect is yet another company and has been on the market since 1998. They provide dark fibre on a wholesale basis.
Fixed wireless infrastructures do not play a significant role in the Danish broadband market. Two licenses have been issued, one to TDC and another to Skyline which provided approximately 40,000 fixed wireless connections in 2010, but went bankrupt in June 2012.
In the early phase of broadband development, an interesting phenomenon that contributed to market expansion was the emergence of a few local community-based alternative network providers. These operators were established in order to serve a market need in primarily rural areas, where services provided by the major operators were either inadequate or very expensive. By far the largest example of such a network provider is Djursland.net. Djursland.net took off in year 2000, when the development of a wireless broadband network covering a population of 82,000 began.
This network was once one of the largest alternative broadband operators in Europe. The organization was dissolved in 2009, but the network facilities are still in operation. At present, this type of alternative networks is less important, as coverage by competing solutions has improved. Moreover, some of these networks have been taken over by Dansk Bredbånd, which later was bought by Waoo!, the broadband company owned by a cooperation of local energy companies. However, the alternative networks have played a role in establishing early coverage in rural areas.
6.3.5 Other service providers
There are many providers of retail broadband service on the Danish market – in the DSL field as well as the mobile area (as MVNOs). The development pattern, which has been seen repeatedly, is that service providers open with cheaper and more attractive pricing for users than the existing operators. They grow to a considerable size, running with an increasing deficit, but with a quickly developing number of subscribers. Finally, they are bought up by one of the large network operators, interested in both acquiring the subscriber base and preventing these operators from being taken over by one of their competitors.
6.4 Telecommunications investments
The level of public telecom investments in Denmark is high compared to other OECD countries, both with regard to telecom investments per capita and telecom investments per access line. Within the EU, considering the average over the period 2009–2011, Denmark ranked as number one in investment per access path and number two, after Luxembourg, in investment per capita (OECD, 2013).
The investments have followed the same trend as in other OECD countries with a rapid growth in telecom investments in the 1990s and a peak just before the burst of the telecom bubble in 2001. The growth in this period can be attributed mainly to two related factors. First, that the rapid growth in mobile communications necessitated major expansions of mobile network facilities. Second, the liberalization implied investment in alternative networks by the new entrants.
Another peak in telecom investments can be observed in 2008 before the start of the current financial crisis. Denmark has experienced more fluctuations in investment levels than other OECD countries have. In 2002–2008 the growth was higher and the subsequent decline was also steeper. Danish telecom investments continued to fall in 2010 and 2011, while telecom investments within the EU experienced a growth of 3 per cent from 2009 to 2010. In spite of this recent decline, the Danish investment rate is still well above average.
While the investments made by TDC have remained fairly stable, the investments made by new entrants have fluctuated strongly. See Figure 6.1. As TDC was taken over by a private equity group in February 2006, there was a concern that this would have a negative impact on telecom investments. However, this is not confirmed by the investment figures. Up to 2008, there was a high growth in investments made by other operators, while the investments made by TDC remained stable. On the other hand, TDC’s investments have been stable also after 2008, while the other operators reduced their investments.

Figure 6.1 Public telecom investments, Denmark, 1992–2012
This could indicate a higher dependence on economic downturns and upturns by the other operators. Another reason may be the entry of energy companies into the telecom market. Energy companies have invested heavily in fibre since 2000. However, until now, these investments have not been very successful in terms of generating new revenue, and the energy companies have lost DKK 5,300 million (EUR 700 million) on these activities (Ingeniøren, 11 May 2012).
6.5 Broadband developments and coverage
From the beginning, DSL has been the most important technology applied to offer widespread access to broadband services. ADSL was introduced as a service in mid-1999. Coverage developed rapidly to include the majority of the population and already by 2003 reached 90 per cent. Cable as an infrastructure for broadband services was introduced later in 1999. Also in this case, coverage developed rapidly. In 2003, most of the cable infrastructure was upgraded to provide broadband services. Cable coverage, however, is limited by the fact that the cable networks only cover parts of the population: 63 per cent of the households are covered by broadband via cable. Coverage of wireless services has developed even faster due to lower investment costs and a higher level of competition.
As a result, at least two different access technologies (DSL and mobile) are available for the vast majority of the population. DSL covers 99 per cent of the population; 3G has a similar level of coverage, but the data rates are much lower; LTE was introduced in the Danish market in December 2010 and is available in all urban areas. Cable is also widely available, while fibre coverage is much lower.
It follows that, with the exception of fibre, all access technologies have succeeded in gaining a high level of coverage within a few years of their introduction. This is partly a result of competition in the different segments of the broadband market and partly an outcome of a deliberate policy, with universal coverage of broadband services having been a policy goal for more than a decade. Furthermore, it is partly due to the socio-economic environment.
In contrast to Sweden and Finland, the Danish telecom regulation does not provide for a universal service obligation for broadband, but the mere formulation of universal coverage of broadband services as a policy goal has put pressure, especially on TDC, to provide extensive coverage of broadband services.
In addition, Denmark is a high-income country, where households rapidly take up new technologies. Furthermore, the Danish geography implies that the investments needed for coverage of the majority of the population are affordable for most network technologies – at least in comparison with those required in other Scandinavian countries.
The coverage of fibre connections has developed at a slower pace than the coverage of any other access technology. This is primarily due to the high costs related to the implementation of FttH, but it is also a result of the expansion strategy chosen by TDC. TDC replaces their copper based network with fibre based network facilities in a way that the optical part of the network and the DSLAMs move gradually closer to the end customer. It is, therefore, the alternative providers, mainly energy companies, that provide the major share of the full fibre access connections.
6.6 Intensity of competition
Despite the good coverage of several infrastructures, there is still a long way to go before one can conclude that the broadband market is a market with real facility-based competition. TDC has high market shares in all available platforms and it has a dominating position in almost all geographical areas. However, as LTE becomes a real alternative to fixed broadband access, this will challenge TDC’s dominant position, as all of the four mobile network operators are able to provide a fully integrated broadband infrastructure using this technology, although Telia and Telenor are cooperating in the joint TT platform.
The retail market for broadband is dominated by the same operators as the market for physical broadband infrastructures, notwithstanding the efforts made to separate the two markets through the requirements for open access. Table 6.2 shows that wholesale broadband access – excluding bitstream access – constitutes only a small share of the total. This indicates that bitstream-based competition has only to a small extent developed into competition on the higher rungs of the ‘ladder of investment’. See also Figure 6.2.
Table 6.2 Wholesale broadband access, excluding bitstream, Denmark, 2008–2010


Figure 6.2 Unbundling by type, Denmark 2006–2012 and EU 2010–2012
Early developments in the Danish broadband market clearly illustrate the strategic advantage related to ownership of physical infrastructure. DSL was in Denmark first introduced by Cybercity. TDC was not very eager to introduce this service, as they wanted to protect their market for services charged per minute, such as ISDN. At the turn of the century, the DSL market was shared among three operators, each having a 30–40% market share. In 2000, TDC initiated an aggressive promotion of their services with substantial reductions in prices and, in two years’ time, TDC’s market share increased from 30% to 79%. TDC was accused of predatory pricing but when the case was resolved in 2003 it was too late for the two new entrants to regain their former position.
From 2006 to 2009, new entrants on the DSL market climbed up the investment ladder, increasing their use of full unbundling compared to the use of bitstream access. Thus full unbundling of the local loop increased from 62% to 68%, while bitstream access decreased from 31% to 23% of total wholesale. However, this development was reversed in 2009–2012. The share of bitstream access has increased to 30%. This development deviates from the general trend within the EU. In the EU, the number for full unbundling tripled from 2007–2010 and increased to more than 70% in 2012. See Figure 6.2.
It is likely that the share of full unbundling will decrease further as a result of future upgrades of the infrastructure. As TDC moves the DSLAMs closer to the customers in order to be able to provide more capacity to each subscriber, the business case for new entrants to use raw copper becomes less attractive. New entrants will need to make substantial investments in additional equipment and, when the number of potential customers decreases to 100–150 customers per DSLAM in total for all operators, the payback time will be ten years or more. New entrants may, therefore, either climb down the ladder again or make use of other technologies for provision of last-mile connectivity.
By 2012 TDC had a market share of 74% for DSL and 66% of the market for broadband via cable, compared to the European average for cable of 3.1%. TDC has been able to maintain a high market share partly because they have acquired some of the most successful of the new independent actors on the broadband market. This includes Fullrate and A+. Both companies provided DSL services using the TDC infrastructures and both were acquired by TDC in 2010. The only providers with a significant market share in DSL at present are Telia and Telenor.
As a result of these developments, for all fixed platforms combined, the level of competition in Denmark is well below the European average. TDC’s market share in fixed broadband connections was 61% in 2012, while the average market share for incumbent operators was 42.6%. See also Table 6.3. Only the incumbents in Cyprus and Luxembourg had a higher market share than TDC. Moreover, the TDC market share has remained fairly constant since 2005. The main reason is that TDC is the dominant provider on two out of three fixed broadband platforms. The Danish market thus differs from the rest of Europe, as Denmark is the only country where the incumbent dominates cable as well as DSL services.
Table 6.3 Incumbent market shares – DSL and fixed broadband total, Denmark and EU, 2003–2012

6.7 Demand for broadband services
In 2012 the penetration of fixed broadband was 39.6 per 100 inhabitants. This is a slight increase compared to 2010, when the penetration was 38.2. In 2012, 85% of private households had access to fixed broadband compared to 44% in 2005. This makes Denmark one of the countries with the highest broadband penetration in the world. On the other hand, it seems that the market for fixed broadband has reached saturation, partly due to substitution of mobile solutions. See Table 6.4.
Table 6.4: Broadband penetration by technology, Denmark, 2002–2012

The penetration is, to a large extent, uniform across regions, but the uptake is slightly above average in the capital region and slightly below average in Southern Jutland. These minor differences seem to be due to differences in demography (age profile) rather than differences in availability of broadband access.
The increase in demand for higher bandwidth is primarily driven by download and streaming of video and music, and the data rate has increased rapidly within the past two years. In 2008, less than 20% of the connections had download rates of 10 Mbit/s or more. In 2012 more than half of the connections were at that level.
The demand for dual-play (telephony and Internet access) and especially triple-play (telephony, Internet access, and television) has also increased rapidly within the last few years. The number of triple-play connections grew from 23,000 in 2008 to more than 353,000 in mid-2013.
For the Danish business users, 99% of companies with at least 10 employees had Internet access in 2013; 63% had access via DSL; 57% had mobile broadband access; 54% had another (than DSL) fixed access connection. Note that the uptake figures add up to more than 100%, as companies use different broadband connections at the same time.
6.8 Realizing the Digital Agenda targets
In 2006, Denmark had a broadband household coverage of 40% with at least 2 Mbit/s. This had grown to close to 100% by 2010 (IT & Telestyrelsen 2010a). See Table 6.5. By 2012, 97% of the population had access to broadband at 10 Mbit/s. The Danish policy ambition is that all citizens should have access to 100 Mbit/s downstream by 2020. In 2012, 65% of the population had that opportunity. See Table 6.6.
Table 6.6 Estimated coverage by downstream and upstream data rate (% of households), Denmark, 2009–2012

In addition to the coverage and penetration of broadband, information on the use of services and applications is also important to assess broadband developments. There is an interrelationship between the coverage and penetration of broadband and the supply and demand for electronic services. This case study argues that public policy in Denmark was intended to stimulate both supply and demand for electronic services, thus also stimulating broadband development. It is therefore relevant to look at public uses of electronic services.
In an overview for 2012 on electronic interaction by citizens with public authorities, provided by Eurostat for the Digital Agenda Scoreboard 2013, Denmark was the leading country among EU countries with 92% of citizens interacting electronically with public authorities, while the EU average stood at 62%.
A comparison with other Nordic countries and with the EU27 average indicates that Denmark is in the forefront with respect to information retrieval, as well as with sending information to public institutions. In terms of download of forms, Denmark is at the same level as other Nordic countries, while the level is twice as high as the EU27 average. See Table 6.7.
Table 6.7 Electronic contacts with public institutions, percentage of population (age 16–74), Nordic countries and EU, 2012

When looking at the electronic interaction between businesses and public authorities, Denmark also scores higher than the EU average. In this context, however, Finland is in the lead on all accounts among Nordic countries (information retrieval, download of forms, sending forms, etc.).
Electronic invoicing is a case in point. The Danish government decided that by 2008, public institutions would accept only electronic invoices. This would increase efficiency in the handling of invoices between private and public institutions, but would presumably also be an incentive for private companies to take up electronic invoicing between one another. As it turns out, the use of electronic invoicing among Danish companies clearly has been subject to a considerable growth. However, the increase in Finland has been even higher. See Table 6.8.
Table 6.8: Share of companies using electronic invoices, Denmark, 2007–2011

This illustrates the importance of electronic communications with public authorities for theuptake of broadband in Denmark. In general terms, there is a mutual correlation between broadband extension and the use of electronic services. Increased uptake of broadband will lead to growing use of electronic applications and services and vice versa. The high penetration of broadband in Denmark is closely correlated with the pervasive use of electronic services. This provides policy intervention with different handles on development of broadband – either via supporting broadband development directly or via support for electronic services, or both. In Denmark, support for electronic services has hitherto been chosen.
6.9 Case analysis
The most important actors in the development of broadband, since the introduction of ADSL in Denmark in 1999, have been the operators in the different access technology fields and the national political-administrative institutions, including the telecom regulator. Potentially there could have been other actors such as large content providers, equipment providers, or local political-administrative entities. However, there are no large national content providers, nor any large equipment manufacturers, in Denmark and the municipalities have not played a significant role in the development of broadband. In specific cases, local authorities have taken initiatives to promote broadband in their local areas but they have not been major institutions in broadband development.
6.9.1 Operators
In the DSL field, the national incumbent, TDC and its affiliates, is by far the largest provider. TDC owns the copper access infrastructure in Denmark and has almost three-quarters of the DSL market. In the cable area, TDC is also the largest broadband provider with approximately two-thirds of that market. The other major cable provider is Stofa, which is now owned by Syd Energi (SE), one of the energy companies that hitherto have concentrated mainly on fibre access. The mobile broadband market is more evenly distributed between the four mobile infrastructure providers (TDC, Telia, Telenor, and 3) and their affiliates. The fibre access market is dominated by the energy companies, with TDC trailing behind, seeking to follow the fibre market in order to expand its fibre activities when needed.
With respect to broadband, in none of the four access technology areas (DSL, cable modem, mobile, fibre) has the incumbent TDC been the first-mover. Cybercity (later taken over by Telenor) was the first-mover in the DSL area; Stofa was the first cable modem provider; 3 was first in 3G-based mobile broadband; and the energy companies are the leaders in the fibre market. All the while, TDC has, maintained a strategy of being a follower and moving quickly into the dominant role in a particular market segment when challenged by the first-mover – with fibre being an exception at present. In contrast to other European countries, the incumbent operator has been permitted to be present in all four broadband market segments.
In addition to the four main technology areas, there have been two interesting broadband initiatives involving other technology solutions. One is a self-organized grass-roots initiative in Djursland (the ‘nose’ of the Jutland peninsula) where activists built a local broadband access network based on Wi-Fi to serve the rural areas of Djursland.3 This initiative was started in 2000, when the broadband offers of the traditional Internet Service Providers were lacking or considered insufficient. The Wi-Fi network still exists (in 2013) and serves approximately one third of broadband connections in Djursland, which has a population of approximately 80,000 inhabitants. But it has remained a relatively isolated initiative and has not had any broader influence on Danish broadband developments.
The other initiative is concerned with WiMAX technology. In 2005, two licenses for providing WiMAX were awarded – one of the licenses to TDC. However, TDC announced right away that they did not intend to use the license but had acquired it in order to prepared: i.e., to see whether this market would develop. The other license led to actual deployment of WiMAX by a succession of companies with Skyline, owned by an energy company, as the last one. Skyline went broke in 2012 and had to abandon approx. 40,000 customers in rural and semi-rural areas in Jutland. Some of them have complained that they subsequently lacked sufficient broadband connectivity.
An important dynamic regarding broadband pricing relates to retail providers having entered the market offering a better deal to customers and acquiring a sizeable market share. After a while, when a sufficiently large number of subscribers have shifted to the new service provider, the company is taken over by one of the large market players, primarily TDC, Telia, or Telenor. These players actually have a mutual understanding that this is an untenable situation, undermining the profitability of the markets, but it has been difficult to act accordingly when new service providers have attracted a large number of customers and are up for sale. The business model for such service providers is to attract as many customers as possible, running with a deficit, and then to be bought up by one of the large network operators. This business model is especially prevalent in the mobile area (entrant MVNOs).
In the fixed network area, the incumbent TDC is very dominant. The affiliates of other Nordic incumbent operators, Telia and Telenor, have tried to break into the Danish fixed broadband market. This applies especially to Telia with its former ownership of the cable company Stofa. However, they have not really succeeded and have lately retreated to prioritize the mobile area, where they have joined forces with Telenor in the joint operation named TT. By mid-2013, TT offered the best LTE network in Denmark, and Telia and Telenor put all their strengths and ambitions in Denmark into mobile broadband.
In public debates on the fixed network markets, the main dividing line in Danish telecommunications has been between the Danish incumbent TDC on one side and all the other operators on the other. This includes the incumbents from other Nordic countries that have generally required better conditions for service providers on the Danish market – conditions they would often not grant to competing service providers in their home markets.
The only fixed network area where TDC is really being challenged is in fibre access. In the energy industry, Denmark has a number of local and regional companies. As these companies have rights of way and often dig up the ground in order to reach energy customers, they also started to offer fibre access a decade ago.
Hitherto TDC has not given much priority to fibre access. Their strategy has been to deploy fibre ever closer to the end-users but to use copper for the last stretch as part of their VDSL strategy. One result is that the energy companies dominate the fibre access market, and another is that the highest bandwidths offered in Denmark are generally in the provincial regions in Southern and Mid-Jutland (on the peninsula), where the energy companies have been most active in fibre deployment. In most other European countries, fibre is mainly offered in densely populated urban areas.
In order to contain this situation, TDC in 2009 bought the largest fibre operation in Denmark. This fibre operation had been running with huge deficits and DONG Energy had, therefore, tried for some time to sell it. Eventually, TDC bought it, but has not used this acquisition to boost their fibre operation or sought to attract new end-users to their fibre acquisition. Apparently their strategy is to wait with fibre-to-the-home and push fibre ever closer to the end-users as part of their VDSL roll-out.
The energy companies offering fibre joined forces in 2010, creating the joint marketing company Waoo!. In 2012, a new development took place when one of the energy companies, SE, acquired the cable company Stofa and thereafter left Waoo!. This suddenly made SE a far larger broadband provider than the other energy companies. How this will influence the strategic actions of the energy companies in the coming years is difficult to say. During the past few years, there has been a virtual political and market struggle between TDC, on the one hand, and the energy companies on the other. The energy companies have been seeking to present themselves as the companies that will deliver ‘true’ high-speed broadband to households and companies, while TDC argues that they upgrade their broadband networks when the actual demand is there.
In 2006, private equity funds took over ownership of TDC. The equity funds acquired 87.9% of the TDC shares but could not get hold of another 2.1% to reach 90%, which according to Danish law would permit them to force the remaining shareholders to sell their shares. Nevertheless, the equity funds totally dominated TDC, which raised some concern although not from the political authorities, nor the regulator. The concern was that equity funds are focused on short-term profitability rather than on long-term investments in the business they are entering. What has happened was that the international operations of TDC have been sold off.4 While TDC as well as Telia and Telenor had started internationalizing when the telecom markets were liberalized around the world, TDC has become a company focusing primarily on the Danish market and to some extent the Nordic market, while Telia and especially Telenor are international players.
The question is then whether the ownership of TDC by the equity funds has undermined the development of telecommunications in Denmark, by causing a lack of investments in infrastructure and new services. This, however, does not seem to be the case – although the counter-factual development cannot be produced. The overall result has been that TDC has focused primarily on the Danish market, but not that the Danish market has been starved of investments. Through the periods of different kinds of ownership, TDC has maintained a relatively conservative and reactive market strategy – following other market players and responding once they have gained momentum and become a possible threat.
6.9.2 Political-administrative institutions
In all countries, the national political-administrative institutions including the telecom regulator play an important role for the development of broadband. In the case of Denmark, there are at least two issues which are important to address.
One is the great emphasis that the policy system has put on the development of services and applications to be delivered on broadband, including the role of state institutions in promoting the uptake of broadband-based services and applications. Until very recently there has been a general agreement in the political system that no national public money should go into general telecom infrastructure investments. The focus has been on how to push and develop the use of the infrastructural resources, while the infrastructural investments have been left entirely in the hands of the operators.
The other issue is the development of the regulatory institutions. Because of the historical structure with regional operators in Denmark partly privately owned, there were actually separate telecommunication regulatory institutions in Denmark through major parts of the 20th century. However, with the then-upcoming liberalization in mind, a new independent regulator was created in 1990. This regulator was very active in the 1990s, especially in the period following the full liberalization in 1996 and in the first years following the year 2000. Nevertheless, the regulatory institution lost momentum thereafter in connection with the lack of political attention and initiatives from the policy side. With the coming to power of a new center-left government in 2011, the regulator was split up into different parts, and the traditional telecommunication regulatory assignments were transferred to the Danish Business Authority under the Ministry of Business and Growth.
There has been an overall agreement in the Danish political system concerning telecom and ICT policies, and there have been no significant policy shifts with changing governments. This applies to the whole period since the liberalization in the mid-1990s. However, lately there have been some disturbances in the Danish telecom policy arena. These disturbances relate to the expansion of broadband networks.
A political goal was set that all households and companies in Denmark must have access to at least 100 Mbit/s downstream by 2020. By the end of 2012, 65% of households and companies already had access to 100 Mbit/s or more. However, the difficulty is reaching the remaining households.
What the results of the political process will be is difficult to predict, but there are signs of unrest in the policy environment that have not been observed since the policy agreement regarding telecommunications in the parliament in 1999. And it is the broadband issue which is causing this unrest. In 2009, the government established a High Speed Committee, which in 2010 presented its deliberations and suggestions. The suggestions by the committee centred on the promotion of services and applications but, shortly after the presentation of the High Speed Committee report, the government issued its policy goal of 100 Mbit/s for all. At first, this did not create much alarm but as the implementation deadline comes closer, the political debate has started to focus on how this policy goal will be met.
So far, the policy focus has been on advancing services and applications. The various governments and their administrations have time and again issued reports and taken steps to promote the use of broadband-based services. This has entailed initiatives, such as promoting the internal use of broadband-based services in governmental institutions and also requiring those who wish to communicate with public institutions to use electronic means. In 2012, a small number of public services (central and municipal) started the transition to full digital provision. For the coming years, a wide range of public services will be transitioned to digital provision. These administrative goals are well in line with the original Danish policy approach in the area.
6.9.3 Expectations based on theory
In the introduction we addressed the ‘ladder of investment’ concept (Cave, Reference Cave2006) and posed the question whether the market has responded as intended to the application of LRAIC-based access pricing. The crude answer is ‘no’ or ‘maybe to some extent’. If climbing the ‘ladder’ from resale to full unbundling is considered, there has been no such development in Denmark since 2008. If new infrastructures are considered, the answer is ‘maybe’. New operators obviously have not built alternative PSTN infrastructures, as TDC has such a network with full national coverage. Telia tried with the cable operation of Stofa to become an alternative infrastructure provider but it sold Stofa to a private equity firm, later to be bought by the electricity company SE. Today, the strategic focus of Telia as well as Telenor in the Danish market is on mobile broadband. As for the electricity companies, which have become the primary drivers of fibre in the access networks, they never considered offering broadband with service provision via the PSTN of TDC. The overall conclusion, therefore, must be that actual infrastructure and service competition is driven much more by strategic moves by operators than by a theory of gradual growth towards infrastructure provision. The increasing interconnection and access prices must be inputs to the strategic considerations by alternative operators. However, it is not clear that this has been the main driver.
In the Danish market, there is a more even distribution of the different access technologies than in most other European broadband markets. Nevertheless, DSL plays the central role. An important reason is the national coverage of the PSTN for many years. DSL is, therefore, a natural technology trajectory. This indicates that path dependency (David, Reference David2007) is an important element in broadband developments.
Another central issue is the relationship between competition and innovation (Aghion et al., Reference Aghion, Bloom, Blundell, Griffith and Howitt2002). The Danish case clearly illustrates a positive correlation between competition and innovation in infrastructure developments. The Danish incumbent has been a ‘second mover’ regarding new infrastructures. TDC was neither the first on the Danish market to launch ADSL nor the first to offer cable access. The same applies to fibre and mobile broadband. How these access technologies would have developed without competition is impossible to say, but it is clear that alternative access offers have put pressure on TDC to advance their operations in the different technology areas.
Last but not least, the question regarding the interrelationships between service and application provision and infrastructure provision deserves mentioning. The question is what comes first: the demand and provision for services and applications or the demand and provision for infrastructure. This is, of course, a chicken and egg discussion. However, the important point is that Danish broadband policies have given priority to stimulating service and application developments. The extent to which this differs from other countries can be discussed. However, the political priorities in Denmark have been clear since the new policy direction was announced in 1994–1995 – with one interesting exception being the sudden policy priority of reaching 100 Mbit/s downstream coverage by 2020, which was clearly inspired by broadband initiatives taken in a number of other countries following the financial and economic crisis starting in 2008.
6.10 Conclusions
The major conclusions to be drawn from the Danish case study are the following:
Denmark was for a number of years the leader among OECD countries with respect to broadband penetration – however not in terms of low prices or data rates. At present, Denmark is not number one anymore, but remains among the leading countries. Fixed broadband penetration has found a saturation level close to 40% in relation to the number of inhabitants. The reason is that households will have only one fixed broadband connection, while the number of mobile broadband connections has grown to more than one per person and will grow further with the use of mobile machine-to-machine connections.
When discussing the reasons for the relatively high broadband penetration in Denmark, one should consider the relatively high level of GDP per capita. However, this is not the only reason. One also needs to pay attention to the full national coverage and high quality of the PSTN in Denmark, which facilitated the development of ADSL and now VDSL. Moreover, the proactive role of the regulator in the first years after the introduction of DSL has been an important contributing factor. Furthermore, there has been pressure on businesses and residential users from the political-administrative institutions to adopt broadband by way of promoting electronic communications with citizens and businesses.
The fast uptake of broadband, resulting in a high level of penetration, to a large extent has been driven by service-level competition. Unlike in other countries, the Danish incumbent operator TDC has been allowed to deploy all kinds of broadband infrastructures, including cable. This means that infrastructure-based competition has been constrained for many years. However, in recent years infrastructure competition has become stronger with the development, first and foremost, of mobile broadband, but also due to fibre access provided by the telecom operations of the energy companies.
The fact that TDC has permission to deliver broadband on all infrastructure platforms has implied that competition on the Danish broadband market is weaker than in the EU on average. While the market share of TDC has been relatively constant during the past decade at around 60% of the fixed broadband market, the average market share of incumbents in the EU has fallen from approximately 60% to approximately 40%.
While many different companies have competed with TDC in the broadband market, among them the other Nordic incumbents, these operators are focusing on alternative infrastructures, primarily mobile and fibre. Telia and Telenor are concentrating their effort on mobile broadband, while the energy companies are concentrating on fibre. Mobile broadband is developing very fast, whereas fibre is developing at a much slower pace.
An important question concerning Danish telecom development has been whether the takeover of TDC by private equity has slowed down progress of the Danish telecom market, as private equity firms do not necessarily have a keen interest in extending and improving the telecom system, given their short-term money-making mission. However, in the Danish case this is not clear. In the period of private-equity dominance of TDC, the company followed basically the same ‘second mover’ strategy as it did before private equity stepped in. The consequences in the international markets have been much clearer, TDC has almost disappeared, in contrast to an ongoing presence of its Nordic ‘sister’ companies Telia and Telenor.
6.11 Reflections on possible future developments
While Danish telecom policies have been very constant since the political agreement in 1999, there is a certain degree of political uncertainty at the moment. For the first time in years, disagreement with the 1999 political foundation has been voiced by industry representatives and political decision-makers. Taken together with the international shift from the promotion of competition to the promotion of infrastructure investments this seems to signal a change in telecom policies.
A more fundamental change will come with the further development of mobile broadband. While fibre has been seen as the ‘future proof’ broadband technology, mobile broadband is developing quickly in terms of higher data rates. This can change the broadband market in a fundamental way, as infrastructure competition is much stronger in the mobile field than in the fixed field.
Additional factors of change are related to the development of Over-The-Top (OTT) applications. This development reflects the increasing influence of the IT sector in converging ICT fields and will lead to changing business models and changing investment patterns in telecommunications. Moreover, content-oriented networking seems to complement transport-oriented networking.
Taken together, these new developments will strongly influence broadband developments in the coming years. Even though TDC seems to sit in a stable position, with strong market dominance in the Danish fixed broadband market, the reality very well may be that it is sitting on a volcano in terms of the policy framework, mobile and fibre developments, and increasing role of the IT sector in the convergence of information technologies, telecommunications and media.
References
1 RACE: Research and Development in Advanced Communications Technologies for Europe. The program was active in the mid-1980s, aimed at the introduction of broadband telecommunications systems and services.
2 Plan Cable: See, for instance, Raymond Kuhn: The media in France. London: Routledge (Reference Kuhn1995).
3 See for the deployment of Wi-Fi in under-served areas the chapter contributed by Melody in Lemstra, Hayes and Groenewegen The Innovation Journey of Wi-Fi – The Road to Global Success (Reference Lemstra, Hayes and Groenewegen2010).
4 For an analysis of private equity in telecommunications see Lemstra and Groenewegen (Reference Lemstra and Groenewegen2009). Markets and public values – The potential effects of Private Equity Leveraged Buyouts on the safeguarding of public values in the telecommunications sector. Delft, The Netherlands: TUDelft.
7 Sweden
7.1 Introduction to the case study
Swedish broadband development is based on a long tradition of advancements in telecommunications. At the beginning of 1900 Stockholm was already one of the most telephone-dense cities in the world. Ericsson, in cooperation with the Swedish national telephone operator Televerket (today Telia), drove the development of Swedish telecom during much of the twentieth century.
Today the city of Stockholm, the home of Kista Science City and Stokab, is the pre-eminent example of advancements in the ICTs. Kista Science City is a high-tech suburb with more than 1,000 ICT enterprises with 24,000 employees, 6,800 university students and 1,100 researchers. Stokab is an operator-neutral fibre network that today is used by 100 operators and 700 enterprises. With its 1.25 million kilometres of fibre, Stokab’s network makes Stockholm the most densely fibred city in Europe, and facilitated the deployment of the first LTE/4G mobile network in the world. The socio-economic benefits of Stokab’s open fibre network have recently been analysed in a study by Forzati and Mattsson, showing that the socio-economic return is almost three times the investment in 2013. See Figure 7.1.

Figure 7.1 Investment and socio-economic return of Stokab, Sweden, 1994–2012
In this country case study we first provide background information on the historical developments in Section 7.2. This is followed in Section 7.3 by a discussion of broadband policy and regulation. In Section 7.4 we discuss the development of municipal and regional FttH networks, which is the focus of this case study. In Section 7.5 we go one level deeper and discus four rural FttH network developments. In Section 7.6 we capture the Stokab developments and discuss the socio-economic benefits. In Section 7.7 we conclude with the state-of-affairs of broadband developments in Sweden as of 2013 and reflect on the realization of the Digital Agenda for Europe.
7.2 History of telephone and narrowband networks in Sweden
The history of modern telecommunications in Sweden can be formally traced back to the founding of the Kongliga Elektriska Telegraf-Werket in 1853 when the first electric telegraph line was established between Stockholm and Uppsala. This was the government agency for telegraph and postal services. From 1871 the company was known as Kongliga Telegrafverket. The first telephone network in Sweden opened in 1880, as a result of an initiative by former Telegrafverket employees. As telecommunication technology changed, Telegrafverket expanded to include telephone services but entered the early telephone industry in Sweden as a latecomer. The first telephone services in Sweden were provided by small local organizations. Through securing a national monopoly on long distance telephone lines, Telegrafverket was able over time to control and take over the local networks. The national network, branded Rikstelefon, was supplied with telephones produced by LM Ericsson.
Telegrafverket effectively monopolised the market with its purchase of the telephone company Stockholms Allmänna in 1918. When it was renamed Televerket in 1953, the parent company and its subsidiaries had a de facto national monopoly.
Until 1980 only Televerket/Ericsson telephones were allowed on the Swedish telephone network. In 1993 the telecom market was deregulated. Televerket was transformed into a corporation, Telia AB. Telia has since merged with the Finnish Sonera, and is now known as TeliaSonera.
7.3 Swedish broadband policy and regulation
7.3.1 Swedish broadband policy
The current broadband evolution started in 1999–2000 with a government bill that was aimed to support national and local initiatives and investments. The headline was ‘Trust to IT, Access to IT and IT competence’. The trust included security and technology. Access implied broadband provision with national, regional and local network support, including SMEs and schools. The financial support included SEK 2.5 billion (or roughly EUR 280 million) to a national operator-neutral backbone, SEK 3.2 billion (in the form of tax breaks) to municipalities to develop access and SEK 2.6 billion to regional networks and to create local infrastructure plans.
This was an important political declaration that ICT and broadband are important for society, and all local politicians and authorities started to discuss and plan broadband deployments. However, after the so-called IT bubble burst, these activities cooled down somewhat.
The current Minister for Information Technology and Energy has restarted a program to speed up broadband development: she launched a Swedish Digital Agenda and formed a broadband commission (Bredbandsforum) together with the regulator (PTS) and the industry to promote broadband development. Bredbandsforum has started several programmes; for example, fibre to the farms, which is a broadband cooperative model.
The Swedish Government’s broadband policy is documented in an official publication, Regeringskansliet (2009). There one can read that the overall objective is for Sweden to have world-class broadband. A high use of IT and the Internet is good for Sweden in terms of growth, competitiveness and innovation. It contributes to the development of a sustainable society, and also helps to meet the challenges of increased globalization, climate change and an ageing population in a sparsely populated country. A prerequisite for meeting the challenges set out in the Digital Agenda is access to high-speed broadband across the country. Swedish targets are: 40% of households and businesses should have access to at least 100 Mbit/s by 2015 and 90% in 2020. It is important that Swedish businesses and households in all parts of the country can take advantage of the opportunities offered by powerful broadband access. Then traditional work practices can change, new services and business models can evolve and new behaviours can emerge.
The central tenet is that electronic communications and broadband access should be provided by the market. The government should not control the market, nor the development of technology. Their task is to create good conditions for the market and remove barriers in the development of broadband by ensuring there is relevant regulation in place.
7.3.2 Regulation
Municipal planning responsibilities are clarified in the Planning and Building Act as reinforcing the connection to the infrastructure for electronic communications. The government has also initiated a so-called Broadband Council for collaboration and dialogue on the deployment of broadband. Furthermore, the Swedish NRA – the Post and Telecom Authority (PTS) – is assigned the task of investigating how radio-frequency bands for electronic communications can be used to improve accessibility in areas which lack broadband access, or with low-capacity and low-quality broadband. The universal service obligation is revised to reflect a minimum level of functional Internet access.
While FttB/FttH networks have been deployed massively in Sweden for over a decade, regulation impacting fibre access networks (be it directly or indirectly) has started to appear only recently.
In May 2010 the PTS passed decisions regulating the wholesale market for (physical) network infrastructure access (including LLU and shared access) as well as the wholesale market for broadband access. The Decision on the market for physical network infrastructure access (LLU) includes both copper and fibre lines. In addition to the provisioning of fibre access, it also requires the incumbent to deploy new fibre infrastructure in existing ducts if requested by an operator who is willing to pay the cost of the investment. However, this decision has been appealed in some parts and a court ruling on this issue is still pending. Concerns have been expressed that the reference offer of the incumbent does not correspond to the Decision of the NRA, as it does not allow the purchase of access to fibre between the incumbent’s Metropolitan Point of Presence and the network termination points connecting buildings, so-called ʻFibre to the Buildingʼ, FttB1.
In August 2009, the government introduced an amendment to the competition law (which came into force on 1 January 2010) aimed at preventing the state, municipalities or regional governments from engaging in commercial activities in a way that is harmful to competition. The new legal provisions came as a response to the numerous complaints received by the national competition authority (NCA) regarding the problems encountered by private operators when competing with public ones. Certain operators still consider that some housing companies owned by the municipalities are trying to eliminate competition by allowing only one electronic communications provider to offer services in their blocks of flats.
In 2009 the PTS was assigned the task of studying open networks and services, and reached the following conclusions:
1. Openness creates the prerequisites for innovation and competitiveness but must be balanced against other interests worthy of protection, such as incentives to invest and network security.
2. Openness is promoted by securing non-discrimination and effective competition.
3. Openness is of great significance and it is therefore important that suppliers in their marketing activities and in applicable terms and conditions provide clear and specific information with respect to lock-in periods and restrictions relating to Internet access and access to services.
The report that concluded the study states that one essential challenge to openness today is restrictions in access to passive infrastructure (e.g., dark fibre). A second major challenge can be traced back to insufficient consumer mobility due to long lock-in periods, high transition costs and other lock-in effects2. One challenge which affects several levels in the value chain relates to openness when managing electronic communications over the Internet, network neutrality. The report suggests several measures aimed at securing openness, measures which take all interests worthy of protection into consideration – especially incentives to invest and network security. PTS suggests stronger principles for equal treatment when building new infrastructure, increased access to existing infrastructure, mandated information to consumers regarding possible pitfalls, the importance of openness and, finally, increased transparency regarding the existence of potential limitations of Internet traffic such as prioritization of traffic and blocking of services.
Somewhat controversially, PTS has recently decided to introduce price regulation for TeliaSonera, recognizing its position of significant market power (SMP). The price regulation is based on four broad and complex models. These models calculate the cost (or would-be cost) for Telia to install fibre throughout the entire country to every household and business. A price per connection is then calculated and, because Telia currently only has x% of the broadband market, the price that Telia can charge is x% (currently roughly 50%) of the calculated price per connection. While this regulation only applies to TeliaSonera, this puts a de facto price regulation on the whole market that is below the actual price of dark fibre. If another actor – a municipality network, for instance – charges the actual deployment cost, it risks losing customers to TeliaSonera. If it tries to compete with TeliaSonera to retain customers and applies TeliaSonera’s regulated price, it risks be taken to court for illegal state aid for setting a price below production costs (which the PTS model effectively requires). This in turn leads to a re-evaluation of municipal networks, which can affect municipal finances and thus provide fewer opportunities for fibre investment.
It is interesting that, against a certain widespread understanding in Sweden, the position of the Swedish regulator (PTS) is that staying on the passive level is no guarantee that the market is not distorted. For instance, if a service is currently provided by other actors on commercial terms and on a competitive basis, installing a fibre infrastructure which allows others to come onto the market at potentially lower prices is per se distorting the market. Naturally, that would not apply if the fibre network is responding to a need which the market (with the current infrastructure) cannot provide. This can be seen as an academic question. In any case, PTS’s mantra is that the market should take care of NGA deployment.
7.3.3 Regulatory trends
The price regulation of TeliaSonera’s fibre access introduced by PTS has generated a lively and somewhat bitter debate. It is believed that the price regulation represents a de-facto price standard which is going to make any fibre investment uneconomical and even politically unattractive (due to the risk of incurring state aid allegations). This position is widely held in the market and there is a significant degree of uncertainty on the future of this contested regulation, especially after a report commissioned by the Swedish Association of Local Authorities and Regions (SKL) (Deloitte, 2011). The report’s goal was to examine the impact of the price regulation and its results pointed to several risks; it concludes that there is no justification for claims a regulated charge for dark fibre will benefit end-users through lower prices and better choices.
SKL points out that many municipalities have invested heavily in fibre networks to assure access to modern broadband for their inhabitants. Municipalities have built up those networks because private investors were not taking such initiatives. Now those public investments are at risk of being frozen completely. SKL is discussing a scenario in which the market will develop towards a single, dominant player: i.e., a return to the monopoly of twenty years ago. TeliaSonera is backing the requests that this regulation be phased out, or the calculation model modified, claiming that claim this regulation and the specific model used are based on past circumstances no longer present and that, as the market has changed dramatically, so should the regulatory agenda.
Given this controversy, it can be expected that these rules are going to be amended, if not repealed altogether.
7.3.4 Government support and state-aid issues
The government bill ʻ99/00ʼ identified those areas where the market was too weak for a commercial roll-out. Hence, any such region or municipality could apply for financial support to deploy broadband networks. All municipalities received money to develop a local ICT infrastructure plan. This plan, which must include the connection of public buildings, such as schools, hospitals, etc., is the basis on which to apply for additional government funding for the actual network deployment. A crucial prerequisite to qualify for funding is that the network must be operator-neutral. This was widely viewed as being compliant with EU state aid rules in the sense that intervention was made in situations of market failure and acted upon to support the telecom market with a fibre infrastructure for all, rather than to compete with market actors. This was confirmed, as no claims of illegal state-aid were filed against the municipal initiatives.
7.4 Swedish municipal and regional FttH networks
Because much of the broadband development in Sweden has taken place on the initiative of municipalities and at the regional level, we dedicate this chapter to these developments and provide the background to and an overview of the municipal development. Moreover, we present four different FttH-case studies.
Sweden has 290 municipalities (kommuner). The population size of these municipalities varies from 2,500 (Bjurholms kommun, in Västerbotten in the North) to around 800,000 (Stockholms kommun, covering the city centre and some suburbs of Stockholm)3. Around 175 municipalities in Sweden (out of 290) have deployed fibre networks in the past ten to fifteen years. Some of these municipal networks have recently formed regional associations to interconnect the various networks and to facilitate access to the providers of end-user services, as well as to provide access to wholesale market actors. To date, all 175 networks are still active and most of them are turning a positive (65%) or a balanced (10%) result. Some of them were started as private investments while some others have been sold to private businesses; currently 7 per cent of the municipal networks are privately owned.
7.4.1 Drivers for FttH deployments and broadband strategies
As is the case elsewhere, there is an underlying belief accompanying these fibre access network projects in Sweden: a political conviction that increased broadband penetration leads to social, environmental and economic benefits. Broadband infrastructure, primarily fibre, is increasingly seen as the fourth utility, and it is considered the task of the public administration to make sure that this utility is put in place one way or another. This, combined with the lack of commercial operators willing to invest in broadband, provides the major driver for the regional and municipal deployments described in this study. All the cases analysed concern predominantly rural areas, meaning that the population density is very low. This implies on the one hand that the investment costs are high and, on the other hand and more importantly, the potential revenues per deployment are significantly lower. This breaks not only the traditional FttH business case on the basis of traditional triple-play, already not a very strong case in very dense areas, but also the upgrading of central offices with DSLto connect only a few end-users. This is typically the case in the areas analysed in this study.
This is also a familiar situation in other European regions in which, due to the topography of the area, the access to broadband services was scarce and many areas were not being equipped with ADSL, which prompted the local governments to intervene4
However, once the infrastructure is deployed and activated, it is important to get the end-users on-board to use the network. According to the experiences from the projects analysed here, an important driver for service uptake has been the availability of high-speed Internet service. However, a second wave of subscriptions is now anticipated to be driven by TV-services (especially HD) which can be provided cheaper, with higher quality and flexibility of use and with broader choice.
A very important driver to generate interest and support in the deployment phase and high uptake in the operations phase is the presence of local fibre champions and a positive ICT culture. This is of course linked to historic factors (e.g., Hudiksvall had LM Ericsson and the Fiber Optic Valley, which helps to explain why it was so much ahead of the neighbouring municipality, Nordanstig), but the lack of such a catalyst can be compensated to a great extent by visionary politicians and by running extensive and continuous information campaigns among the population.
7.4.2 The open access business models
The dominant business model among Swedish municipal fibre network operations is an open access network model. The four cases described in this chapter reflect different flavours of such a model; therefore this section describes the model and reviews experiences obtained in Sweden.
The open network model, in which services are provided on a fair and non-discriminatory basis to the network users based on a shared infrastructure, is enabled by conceptually separating the roles of service provision and network provision. See Figure 7.2. Due to the different technical and economic characteristics of the different layers of the network, different roles and actors can be identified. A fibre access network broadly consists of a passive infrastructure (including right-of-way acquisition, trenching, cable duct construction, fibre cable installation and connections to home and office premises), and active equipment (transponders, routers and switches, control and management servers). The passive infrastructure is typically characterized by high CAPEX, low OPEX, low economies of scale (individual connections to homes and offices), and is highly local, hard to duplicate and hence subject to regulation. The active equipment is characterized by lower CAPEX, higher OPEX, higher economies of scale, and is subject to less regulation if provided in competition. These factors allow a further role separation between a physical infrastructure provider (PIP), which owns and maintains the passive infrastructure (typically real estate companies, municipalities or utilities), and the network provider (NP) which operates (and typically owns) the active equipment (incumbent operators, new independent operators or specialized broadband companies).

Figure 7.2 The open network model and typical open access value chain
Depending on which roles different market actors assume, the network will be open at different levels and different business models will arise, as illustrated in Figure 7.3. A single actor may act both as PIP and NP (7.3, a), in which case the network is open at the service level. If the roles of NP and PIP are separate (b, c and d), then openness at the passive infrastructure level is achieved. Generally, one PIP operates the passive infrastructure, while one or several NPs can be allowed to operate the active infrastructure, typically over a fixed period of time, at the end of which the contract may or may not be renewed (in which case a new NP is designated and active equipment may need to be replaced). Most often, economies of scale make it impractical to have a truly multi-NP network (although larger networks may assign the operation of different geographical parts of the network to a different NP). Independently of the specific model, however, the NP should offer different service providers (SPs) access to the network on non-discriminatory conditions. The end users typically purchase services directly from the service providers. The NP receives revenue from the SP and pays a (one-time) connection fee to the PIP for network access.

Figure 7.3 Access network business models
If the NP also acts as SP (b) the network cannot be described as really open according to the definitions applied, but it is still more open than the conventional vertically integrated FttH model in (g), which most incumbent operators follow today. In case of local loop unbundling (LLU, Figure 7.3e), a vertically integrated operator is still present, but there can be multiple actors working as combined NP and SP. In case of bitstream access the vertically integrated operator assumes the role of NP, but there can be multiple SPs offering their services using wholesale bitstream access.
Note that some of the roles shown in Figure 7.3 can be divided into several others and that the delineation between the various roles is not always as clear as the figure suggests. However, the figure provides a fair idea of which types of business models with respect to open access are used in Sweden today. Although the degree of ‘openness’ will vary depending on the type of actor and the layer in the network that is considered.
The first optical access networks in Sweden were built around the turn of the twenty-first century by Bredbandsbolaget, TeliaSonera and a number of municipalities. While Bredbandsbolaget and TeliaSonera are vertically integrated operators, owning the whole value chain from fibre infrastructure to services, for the municipality networks the situation was different. In most cases a municipal company both owned and operated the network (PIP + NP). Although situations with only external SPs existed, in many cases, the municipalities also acted as SPs, sometimes in competition with other SPs. This became a default as it had been difficult to attract external SPs for several reasons:
(1) limited number of subscribers;
(2) connection procedures (both technical and administrative) varying from network to network, thereby hindering economies of scale for the SPs;
(3) a small number of SPs, much fewer than today;
(4) lack of business actors taking the role of NP and handling the contacts with the SPs, etc.
The market has matured considerably during the past ten years. The process of connecting SPs is now much simpler, technology has improved, there are network providers handling SPs as wholesale clients, the number of SP is now much higher, etc. Also, many municipalities have come to the conclusion that they should focus more on providing infrastructure to their citizens, rather than competing with commercial companies in the services market.
Although the market is not yet fully mature, in general municipal network operations have moved downwards in the value chain – increasingly closer to just owning the fibre infrastructure (pure PIP role) – while network operation (NP role) and service delivery (SP role) are left to other players (other municipal utilities, independent operators, or even large telcos such as TeliaSonera). Despite the clearer roles, many smaller municipal networks struggle economically, due to a reduced revenue share in a marketplace with many competing players. This has led to a consolidation process where municipal networks either have been acquired by competitors or have started to collaborate closely. This consolidation process is still ongoing.
7.4.3 Services and uptake rate
Services present on Swedish FttH networks are predominantly voice (both stand-alone IP and over-the-top), Internet and TV, which make up the classic triple-play. Different data rates for Internet service are generally offered, from 1 Mbit/s to 1 Gbit/s. The most commonly offered and commonly subscribed services are 10 Mbit/s and 100 Mbit/s, for which the retail prices range between EUR 10 and EUR 305. Telephony is generally quite cheap but it is not a driver of uptake. Internet service is provided almost exclusively over an Ethernet point-to-point solution; thus, there are two alternative configurations regarding the customer-premise equipment (CPE):
For FttH, a CPE consisting of an O/E (optical/electrical) converter and an integrated switch (sometimes a router) which functions as a service separator using VLAN (virtual local area network) tags;
For an FttP + in-building LAN, if only Internet-based services are provided, a simple O/E converter and a switch are placed in the basement of a multi-dwelling unit: CAT 5 or CAT 6 copper cables are then drawn to each apartment; hence, end-users do not need any special CPE and can connect the Ethernet CAT 5/6 cable to their computer or home Wi-Fi router; otherwise, a solution similar to the FttH case is followed.
TV over the FttH connections are usually provided using a VLAN, and the service is then separated at the CPE. TV packages usually include must-carry channels (around eight national and regional channels), plus bundles of four to six channels for a cost of EUR 5 to EUR 10 per bundle. Both traditional proprietary TV platforms are present (with a cost of roughly EUR 15 for the basic package) and now there is also the so-called open-TVplatform, using a Sweden-wide standard open platform, which allows the end-user to change TV-provider without having to change the set-top box. Prices for basic packages with the latter are as low as EUR 3.50 per month.
Other services such as video-on-demand, home-security (video-surveillance), cloud services (back-up, remote hard drive, antivirus, etc.) are starting to appear, although these are for the moment few in number and the added value compared to equivalent over-the-top services (e.g., running over the Internet connection) is not always clear. Several e-health pilot projects have been run but, for the time being, the big breakthrough is still to come (although SMEs like Open Care are very active). When it comes to e-government services, these are for the time being limited to over-the-top, web-based basic services also available elsewhere, but arguably of better quality through FttH.
A service that is potentially of interest is teleworking, including teleworking centres. While teleworking is an increasingly popular phenomenon in Sweden, and one which is greatly encouraged by fibre networks, teleworking centres never really picked up. One reason for this may be the generally very good home connections, enabling distance working without the extra cost for office space.
The uptake of services in the Swedish municipal networks varies. As an indication, the average uptake on the networks operated by Zitius (currently active in ten municipalities) is roughly 35 per cent. The trend appears to be similar to the uptake of cable-TV, and that is generally gradual. As further reference, the Deutsche Telekom led research project OASE6 works on different scenarios: a ʻconservativeʼ one in which a 60% uptake is reached in 20 years (in areas with high ADSL density and relying on a traditional triple-play-driven, vertically integrated business model) and an ʻaggressiveʼ scenario in which the same uptake is reached in 8.5 years. Interestingly, even this is conservative in some cases: some rural, single-dwelling-unit areas in Hudiksvall and Säffle have uptake rates of 80% or more only a few years after deployment. Queues of households wishing to be connected to fibre (for an entry fee of EUR 1500) are now the case in Hudiksvall.
7.4.4 Observed socio-economic benefits
One of the first effects that was observed in FttH municipal networks in Sweden is a saving of 30% to 50% of the total municipal data and telecommunication costs (see also Forzati et al. Reference Forzati2012). This is partly due to increased efficiency (reduced equipment, energy consumption, and footprint per unit of transmitted information) and partly due to the fact that the high-capacity fibre network allows for more competition between service providers and thus lower prices.
In 1996, the city of Stockholm started purchasing telephony services from the open market, which was unique for public organizations in Europe at that time. The city had recently connected its operational sites and offices with its own fibre network. This allowed it to procure its telephony in full competition and to drive down costs. The city’s external telephony cost was between EUR 15 and EUR 20 million. The competition made available on its fibre-optic network resulted in a savings of 30%. However, this is a conservative estimate, and savings have probably grown larger over time, says Per-Olof Gustavsson, who at that time was active in the City of Stockholm’s city council office. In Jönköping, where the fibre connection has been less extensive, the savings figure was around 10 to 15 per cent.
Similar savings have been observed at regional administrations as well. The Stockholm Regional Council (Stockholms läns landsting) reduced its data and telecommunications costs by 50%, equivalent to roughly EUR 8 million, thanks to the fibre network. In Norrbotten, a fibre network has been installed linking 5 hospitals, 33 clinics and 34 dental clinics, which reduced communication costs also by 50% while providing fifty times faster communication. Service providers have been able to create solutions for digitized medical records, transmission of digital radiography, digital recipes, video-conferencing and IP telephony.
Another interesting fact is that the Swedish tenants’ association (Hyresgästföreningen) has agreed with property owners’ associations and housing companies to an increase in the rent of around EUR 5 per month. This can be considered a conservative evaluation of the perceived added value of fibre connection for the end-user because it makes available high-quality services at lower prices, especially entertainment and communications, the ability to work remotely and more free choice of work and housing, improved individual health, reduced need for hospitalization, simpler and more transparent interaction with public services, etc.
Indirect effects that were observed included the reduction in migration to larger cities (a problem among rural municipalities in Sweden) and improved employment, due to the availability of an ICT infrastructure that prevents businesses from moving to the cities, creates new business opportunities and allows people to stay in or move to rural areas with higher quality of life, thanks to a healthy local business environment and the possibilities offered by distance working. See for details the four cases described in Section 7.5.
7.4.5 Successes, challenges and future directions
Fibre deployments in Sweden have been successful in general when it comes to public support and end-user uptake. In some cases, requests for fibre connections exceed the roll-out capacity and queues have been forming. This success has been visible especially in rural areas where alternatives for Internet connections are lacking, and where bottom-up approaches (e.g., in terms of co-operatives to build village networks) are often used to gather support for centrally driven initiatives. Sometimes the municipality only needs to connect the existing village networks and build out the metropolitan section of the network.
In the urban areas it is often more challenging to gather significant uptake, especially among privately-owned multi-dwelling units (MDUs). Publicly owned MDUs are usually inclined to sign up, thanks to the involvement of the housing organizations, which see fibre not only as an infrastructure upgrade but also as a tool to simplify the provision of traditional services (the fibre network they connect to is usually an open network, therefore leaving the choice of Internet and TV providers to the tenants, which is seen as highly desirable) and more advanced services, such as estate management tools (remote surveillance, etc.).
Among the challenges being faced by municipal fibre network owners is that of attracting service providers, especially in the smaller and more remote municipalities. This has been to some degree solved by forming regional networks, which are a type of federation of small municipality networks7. These regional networks provide the scale, visibility and ‘single-interface’ towards the service-provider market, and have proven to be very successful in bringing service providers to all member municipalities. Another positive effect is that they have made it possible for small networks to rent out dark fibre to the wholesale market (this currently accounts for 30% to 70% of municipal network revenues).
The financial situation is generally quite positive, with municipal network companies showing positive results after ten years (with less than 25% of them currently showing negative results)8, although different business models and different situations have led to different outcomes, also depending on how depreciation and one-time connection fees are accounted. In general, companies that only invest in passive infrastructure (PIP role), and contract out the network management (NP role) tend to have a leaner organization, an easier business case (similar to a municipal utility), and a better medium- to long-term financial situation. For these fully functionally-separated networks, negotiation on price in the NP contract is a delicate balancing act, although market prices are now starting to appear. Some companies, still vertically integrated, tend to be in a relatively good financial situation, although in most cases their fibre deployment is limited to the nodes for xDSL backhauling (FttN). Extending fibre to the premises (FttH/FttB) will require extensive investments, which will significantly affect the cost-revenue balance. Another delicate factor is the accounting, in particular the choice of the depreciation period for the investment and the distribution of the revenue from the one-off connection fees: fine tuning these parameters can in some cases make or break the business case.
A practical and important limitation of FttH in general is its reliance on power at the end-users’ premises, which makes it challenging to deploy critical services on fibre connections (such as nurse alarms for elderly and reduced mobility citizens). There are several solutions being investigated and tested but none is sufficiently reliable yet, so the issue remains for the time being.
Turning to future directions and trends, the most important one is probably a general move down the value chain. Encouraged by the SSNf (Swedish Association of Urban Networks) and SKL (Swedish Association of Municipalities and Regions), many municipal networks are migrating from vertical integration towards a layered model, in which the municipal network company only owns and operates the passive infrastructure. The rationale for this is that passive infrastructure is a familiar business for municipalities and their utilities9, while active equipment is better left to the market10. While in general this is seen as the right way to go, and there are no more municipalities choosing to build a new fibre network and operate the active layer themselves, some challenges remain with this layered model, which should be mentioned:
Some municipalities have moved away from the integrated PIP/NP model but are currently stuck in a hybrid model (whereby some connectivity services are still offered), which risks removing traditional revenue streams while leaving important residual overhead and running costs (see the Hudiksvall case).
The contracting-out of the NP role implies that specialized local technical staff is not needed anymore: while this reduces the costs significantly and brings about more specialized competence overall, it has the drawback of increasing the potential response time in fault-management (see also the Säffle case).
The open access business model has been a success in bringing freedom of choice and low prices, but also poses some challenges in the management of the responsibility areas (fault management and first-line support) between the service providers and the network provider (running the actual network connectivity). A standard for open network interfaces would probably help make things run smoother11.
Among other trends and future directions, we note that redundancy (generally in the form of rings) is recognised more and more as a critical feature of the network, in order to attract businesses and public sector actors. Also, a progressive defragmentation of the municipal networks is taking place, partly thanks to the emergence and success of regional federations mentioned above and partly to a consolidation process whereby some municipal networks are either acquired or effectively merged into larger neighbouring networks, thanks to contracting out the NP role. Among the effects seen are a reduction of resource duplication, increased professionalism and general synergetic effects. However, to do that on a regional basis (e.g., by centralizing the tens or hundreds of technicians scattered in various municipal networks) would provide a great resource for all, although that is seen as too big a challenge at present.
7.5 Four rural FttH cases
There are 175 municipalities in Sweden that have deployed fibre networks in the past ten to fifteen years. In this section we analyse two such examples:
Hudiksvall, a municipality covering a large but sparsely populated area in northern Sweden, with a long history of investment in FttH and ICT in general; and with a hybrid open-access business model;
Säffle, a municipality in central Sweden which deployed an FttH network relatively recently, following a strictly open-access business model, and with the involvement of a major telecom operator (the incumbent TeliaSonera) with the exclusive role of network provider (and, at the start of the project, excluded from selling services).
The two deployments tell different stories and can therefore be useful in providing a more complete picture of local government-backed FttH deployments in rural regions. Säffle’s deployment stems from necessity (the lack of broadband alternatives), whereas Hudiksvall’s experience is born out of opportunity (the presence of Ericsson and the leveraging of competence and resources).
We also review two regional networks12, which are in effect federations of municipal networks at a regional (or super-regional) level:
Skånet, a regional passive network deployed through a public-private partnership (PPP) between the Skåne Regional Council in southern Sweden, sixteen municipalities and a major telecom operator, Tele2;
Norrsken, a layer 2 network owned by municipalities, municipal networks and the region of Gävleborg in central-northern Sweden. The network allows the provision of services to/from any municipality in the consortium, as well as Stockholm.
In the following, we present an analysis of the four cases in detail.
7.5.1 Hudiksvall
The Hudiksvall municipality (Hudiksvalls kommun) is situated in Gävleborg County, on the coast of central northern Sweden, some 300 km north of Stockholm, 130 km north of Gävle (population: roughly 100,000) and 84 km south of Sundsvall (population: roughly 50,000), to which it is connected by the E4 highway and the East Coast Railway (Ostkustbanan). The municipal seat is in the town of Hudiksvall.
The town of Hudiksvall is located on the coast, and the municipal territory extends along the coast as well as for several tens of kilometres inland. The territory is largely rural but includes several towns and villages. Roughly 40% of the population lives in the main town, so the fibre deployment is of several very different characters: urban in town, ‘sub-urban’ in the villages, and sparsely rural in the largest part of the territory.
The largest employers are the municipality and the county council, with around 38% of the workforce. Although in decline during the twentieth century, the forest industry represents half of the industrial activity; the largest private employer is the Holmen paper product company, with about 10% of the workforce. The electronics industry has become an important sector (19% of the workforce) and is dominated by Ericsson Network Technologies, making optical and copper cables for telecommunication systems. This, together with efforts by the municipality and the leveraging of European structural funds, has led in more recent times to the development of fibre research and speciality production13.
Broadband strategy, Fiberstaden and the fibre initiative
Hudiksvall started installing fibre in 2002. Since 2006 the fibre initiative has been managed by Fiberstaden, founded by the municipality of Hudiksvall, whose vision is ʻto build tomorrow’s infrastructure, based on fibre connectionsʼ. Fiberstaden runs fibre network operations and manages the IT operations for Hudiksvall as well as its neighbouring municipality to the north, Nordanstig (population 10,000).
The project started in 2006 to connect central offices in Hudiksvall (Nordastig joined the initiative in 2008) to provide the backhaul for the ADSL lines. In the Hudiksvall and Nordasting area, a typical local central office connects around 100 to 150 customers, up to 700 in the largest central office. Today, in some villages (30 km from town) 25% to 50% of households are connected to fibre. Among those connected, uptake of Internet service is almost 100%.
Fiberstaden’s mission looks a little different in the two municipalities: in both it does the operation and support of the IT environment for the public administration. However, in Nordanstig Fiberstaden has responsibility for the operation and expansion of the network and they are also one of the five Internet service providers available on the network, whereas in Hudiksvall, after having contracted out the NP role, they are only responsible for the development of the passive network.
Business model
Fiberstaden operates a hybrid between a vertical integration and an open access business model. (See also Figure 7.4.) The role of the NP is currently given to Zitius in Hudiksvall, but Fiberstaden still sells wholesale connectivity services. In Nordanstig, Fiberstaden acts as an integrated PIP+NP. In both cases, the networks are owned by municipalities directly, not by Fiberstaden. In Hudiksvall, Zitius offers a broad range of services, through a portal called bredbandsväljaren.se (ʻthe broadband chooserʼ), where all services carried over the network (currently offered by twenty SPs) can be ordered in one place. However, once a service is purchased, the end-user pays directly to the service providers and all communication takes place directly between SP and end-user. The service providers are attracted to this model thanks to the nationwide presence of Zitius (so an SP only needs a point of presence in Stockholm to serve a large number of end-users across the whole country).

Figure 7.4 The business model for the Fiberstaden fibre network, Sweden
Ten service providers have switches in Hudiksvall and five SPs have switches in Nordansting. Fiberstaden also offers point-to-point transmission capacity to companies and, increasingly, dark fibre (e.g., to Tele2 to connect 4G masts; TTC; Norrsken; and Telia). Currently, 30% of Fiberstaden’s revenue comes from dark fibre and wholesale connectivity services.
As part of the retail business model, the media converter at the customer’s premises is owned by Fiberstaden. Fiberstaden receives EUR 4.50 per month per active customer from the NP Zitius. Troubleshooting is taken care of by Fiberstaden; Zitius has no local staff.
In theory, the end-user has no need to know about the existence of the NP and indeed the bredbandsväljaren.se portal is accessible directly from the municipality’s website and from the websites of the individual SPs. At the municipal website the PIP is presented as a municipal service, just like water, electricity or sewage. Zitius is not even mentioned in bredbandsväljaren.se, despite its being managed by the company. However, challenges remain, notably in fault management, as a clear demarcation of responsibilities is missing, leading to end-users being sent back and forth between SP, NP, and PIP when faults occur.
The price to connect a single home to the property border is EUR 1,500 (the actual cost is estimated to be roughly double), while property owners take responsibility for the digging across the property.
Public and commercial services present on the network
Wholesale capacity services, both dark fibre, and bitstream point-to-point (10 Mbit/s, 100 Mbit/s, or other data rates as required) are offered over the network by the municipality PIP, Fiberstaden. These are typically services targeted to companies.
Several end-user services are offered at the moment by different SPs over the network operated by the NP Zitius. Typical services are traditional triple-play: telephony, TV and Internet access. There are also other IT services being offered like cloud and web hosting for small companies.
When it comes to public services, Hudiksvall kommun (the municipality) has an information-rich and well organized website, www.hudiksvall.se, which represents the major information interface with the citizens. The website is also an important tool for communication with and feedback from the citizens. Inköp Gävleborg, the public procurement and contracting authority for Hudiskvall and eight other municipalities in the region, has a website (www.inkopgavleborg.se/) which is the major information, application and transparency tool for public procurement in the region. All public procurement is announced there and all current and past contracts are easily available. The library service is also regional, and it has an online search and reservation system (www.helgebiblioteken.se/). A reservation can be made online for any book in any of the forty-seven libraries, to be collected at any library. An e-lending service (e-books, audio, music, and database search) is also available.
Examples of the socio-economic impact of fibre
Hudiksvall started installing fibre in 2002. Since then, the number of firms in the Hudiksvall municipality has increased by 6% to 14% per year between 2004 and 2009. Representatives of Hudiksvall’s municipality say that fibre has a positive impact on the municipality’s overall business climate. Moreover, there are examples of companies moving from Hudiksvall town towards more rural areas of the municipality thanks to cheaper rent.
Hudiksvall previously had, like many rural northern municipalities, a negative population growth, but since the installation of its fibre-optic network, the municipality stopped losing residents. In December 2002 its population had fallen to 37,048 (down 4% since 1994). The decline halted in 2002 when a significant number of households were connected by fibre. See Figure 7.5. This suggests that the effect of fibre investment may have a fairly rapid impact on population trends, although other factors may also have contributed. Similarly, thanks to fibre, in Nordanstig one can now see people returning to the municipality after having left years ago.

Figure 7.5 Population evolution in Hudiksvall, Sweden, 1995–2012
There are many examples of the effects of fibre on individuals in the local communities: for instance, in the village of Lindefallet, between Hudiksvall and Söderhamn, where 98% of the residents are connected to fibre. Several people decided not to move, thanks to fibre. Peter Engstrom, 34 years old, and Linn Sjoberg, 30 years old, chose to build a house in Lindefallet because of fibre, which is seen as a prerequisite for living close to the forests and nature without feeling completely isolated. Peter and Heather Nilsson moved from California to raise their four children in a safe environment, and journalist Marie Sandberg and author Georg Johansson moved there from Brussels. Several local companies have managed to assert themselves in an increasingly competitive environment thanks to fibre, and even farms are connected to fibre.
Since fibre was deployed in 2004, the population increased by 7.5% in a village that has neither a school, nor a health clinic, nor an industrial area. The investment in fibre, in combination with active associations, makes Lindefallet a lively village and thus a village that people want move to and to invest in.
Successes, challenges and future directions
On the bright side, many people want to have fibre and are queuing up to be connected. Moreover fibre is offering a broader range of TV channels at lower prices than cable-TV, where this exists. TV services over fibre have just started to be offered but Fiberstaden’s CEO Bia Larsson is convinced it will be the driving force for people to migrate to fibre. IP telephony and Skype are also very popular drivers. Moreover, service packaging is also very important.
The present operational difficulties seem to be caused by the hybrid business model currently in place. Originally, Fiberstaden also assumed the NP role, which led the company into trouble with unsatisfied customers (due to lack of proper competence and an adequate organization to support it). Following the recommendation by the National association of Municipalities and regions (SKL) to the municipalities to give up the NP role, Fiberstaden decided to outsource the active network management to network provider Zitius (at the time owned by Ericsson). However, it retained this role in the less mature network of Nordanstig. According to the CEO, this did not really make things better. A possible explanation may be that this process was only executed in part: Fiberstaden still sells connectivity services (they only gave up the retail sector) so they still have active equipment to take care of, with all the work and competence needs involved. This should be compared to the experiences of Säffle, where the municipal company only takes care of the passive infrastructure and is very satisfied with that set-up.
The loss of direct revenues from end-users, and a badly negotiated price with Zitius, led to a deteriorated financial situation. Fiberstaden began in 2006 with EUR 100,000 gross profit, last year they had a EUR 300,000 loss.
The fact that Zitius has no local staff is seen as problematic. Hudiksvall now plans to negotiate the new NP contract together with the municipality of Söderhamn to strengthen their negotiation position. Another point of difference raised by Mrs. Larsson is that in Soderhamn the municipality does not own the network directly but through the equivalent of Fiberstaden, which is considered a better model.
Finally, Mrs. Larsson strongly believes that redundancy needs to be implemented (rings, but not the last node) as it will be required by businesses and the public sector.
7.5.2 Säffle
The Säffle municipality (Säffle kommun) is in Värmland County in west central Sweden. Its seat is located in the town of Säffle. The municipality covers a peninsula in Lake Vänern (Värmlandsnäs), and includes a large freshwater archipelago.
In the town of Säffle, the economy is largely based on industry. Säffle has continued to grow as the wood pulp industry has expanded in Sweden. The pulp mill in Säffle has been a major driver of the local economy. In the remainder of the municipality farming is important. The Värmlandsnäs peninsula is very significant to the economy through pork production. The area supplies more than 200,000 people with pork. The archipelago off the peninsula (which also has old rune stones and other ancient monuments) is a tourist attraction.
The territory is largely rural with smaller localities of few hundred inhabitants each. Two-thirds of the population are concentrated in the main town, so fibre deployment is of three very different types: urban in town, covering the largest portion of the population, ‘sub-urban’ in the villages, and rural in the largest part of the territory.
In its broadband strategy, the Säffle municipality declared that every household should have access to a high-speed network. Due to the lack of commercial operators ready to invest in broadband in the municipality, it decided to start a fibre deployment project through a municipality-owned company called Säkom. All investments have been made on commercial terms and have received financing partly by EU structural funds and partly through commercial loans.
Broadband strategy, Säkom and the fibre initiative
The work started in rural areas because that was where broadband was lagging. Säkom has built a 930 km long fibre-optic network that connects 92% of households and businesses in rural Säffle, connecting from 30 to 50 more households each year. The project in rural areas is now complete14 and Säkom began implementation to the urban areas of Säffle with 1,227 apartments which will shortly replace cable-TV with TV-over-fibre. All types of property (apartment buildings, villas and other properties) are offered a connection to the Säffle fibre network.
Business model
Säkom operates a ‘pure’ open access business model (variant (c) in Figure 7.3; see also Figure 7.6). The NP role was taken by Telia by agreement in autumn 2009. This was later amended and Telia is now allowed to offer services. Säkom is a small organization, which the CEO likes to define as a group of ʻqualified purchasersʼ. Säkom needs to be financially independent in the long term, but does not need to generate profits.

Figure 7.6 The business model for the Säffle fibre network, Sweden
The separation of the PIP and NP role makes it viable for operators to join and provide connectivity and service provision, because long-term investment for the infrastructure deployment, which typically has a horizon of five to ten years, is no longer part of their business case. On the other hand, the municipality is in a position to accept a longer-term return on investment and assume the capital investment in infrastructure, while avoiding responsibility for technical issues in which it does not have enough competence. Moreover, the NP contract was awarded to a national operator which can rely on significant economies of scale, bringing down the operating cost of the network.
At the same time, the business case for service providers is enhanced by the existence of infrastructure and connectivity, so they can focus on efficient service provisioning (with cost reduction coming from know-how and economies of scale due to their national or sometimes international scale), customer care, marketing and product development. Efficient service provisioning is especially important for Internet service (increasingly seen as a commodity), where price and reliability are the major selling points, whereas the TV product offering is an important differentiating factor.
Telia was awarded the NP contract with the obligation to provide and connect at least three ISPs, two TV providers, and two providers of prioritized IP telephony (today there are five ISPs, three TV and two priority IP-telephony providers). Telia was not allowed to sell services initially. It was argued that if Telia had been allowed to sell services in the beginning, other SPs would have found it hard to establish a viable position. However, this decision was not very popular with the citizens. Once other SPs had the time to become established and Telia was not considered dominant anymore, this ban was removed.
As part of the business model, the media converter is provided and maintained free of charge by the NP (Telia) and, when buying services other than just Internet, the service separator is also provided and maintained by Telia. First-line support is taken care of by the service providers, although end-users frequently call Säkom (PIP), which nonetheless thinks that this first-line burden is manageable. With time, communication between PIP and NP has improved considerably. Telia as NP has concluded service contracts with outside firms for installation and maintenance (in Säffle and nearby Karlstad).
There are two types of service-level agreements (SLAs) in place: restoring services within twenty-four hours, if fewer than twenty-four users are affected, and restoring services within six hours, if twenty-four users or more are affected. The SLA was invoked when the TV service started to have problems last autumn; these then escalated, and on New Year’s Eve one TV service (from SP Serverado) was down until 3 January. The NP Telia offered three months of free TV as compensation.
The digging cost is EUR 4.50/m on average (varying between EUR 2/m to EUR 11/m in the rural area, and around EUR 35/m in town), which increases to around EUR 8/m to EUR 10/m if connection costs are included. Housing cooperatives and housing companies have to pay EUR 2,200 to connect to the fibre network, while the in-building network is their own responsibility. An agreement was reached whereby housing companies pay EUR 11 per month per apartment and the tenant pays EUR 2 per month to Säkom for 15 years.
In addition to the retail sector, Säkom is offering dark fibre rental to business users and large organizations. Among the current clients are ʻNet for Mobilityʼ (dark fibre rental for ten years), the municipality and the Swedish Church. Businesses that have expressed an interest in dark fibre include the ICA food chain, TDC, and others. Capacity is not really limited, as ninety-six fibres are installed in the backbone network and twenty-four fibres to the nodes.
Currently a price per-kilometre is charged, but other models like price per connection, and prices for specific fibre spans are being considered; some are more popular than others. Large firms are currently connected to the copper network and they are generally bound by long-term contracts. When these run out, they are likely to migrate to fibre.
Public and commercial services present over the network
The services currently offered over the network are the following:
Internet service (five providers present), at price of EUR 20–30 for symmetrical 10 Mbit/s, and EUR 25–35 for 100 Mbit/s downstream and 10 Mbit/s upstream. Symmetrical 100 Mbit/s is also offered, but at rather high price (above EUR 50).
TV is provided by three SPs: Alltele, Telia and the open platform Severado: the base package is offered free of charge (the national broadcaster’s four must-carry channels, plus three other channels); other channel packages can be bought on the Telia or Severado portals. A service separator is needed and provided free of charge by the NP. In the case of Telia, a set-top box is available on loan, while for Severado the open set-top box must be purchased at EUR 150. A degree of complexity (service separator, set-top box, Internet, NP, SP, etc.) means the solution can sometimes be perceived as challenging by end-users.
Priority IP-telephony is offered by two providers (Alltele and Telia): the cheaper one is EUR 4 per month for a basic plan, or EUR 15 for a flat plan.
Examples of socio-economic impact of fibre
One positive effect that can be observed already is the creation of a new industry segment related to the fibre network installation in the municipality: fibre installers (now building other networks) and maintenance activities which are local, on contract from the NP and SPs.
An effect of the housing companies having provided fibre to their dwelling units is that more young people are moving in and that there are no empty apartments anymore.
Another welcome effect is that businesses can now expand within the municipality and do not threaten to move. Interestingly, also, some companies were able to move from central Säffle to the more rural area in order to save on rents.
Successes, challenges and future directions
Säkom was started in 2007 and is still in the red but the ambition is to reach break-even in 2016. Information provision to the population is seen as very important to generate support for the deployment and for increased uptake.
While housing companies are now 100% connected via FttH (and of these, after six months, 100% have subscribed to IP-TV and around 15% to Internet), private property owners often do not see a real motivation to connect. They see the cost of around EUR 400 to EUR 500 per apartment but they do not really see the concrete benefits.
A problem that is not resolved yet is that power goes down every now and then in the countryside, which results in service problems because the nurse alarms for elderly and reduced-mobility citizens (trigghetslarm) need to be active at all times. Providing e-health services over fibre has to take these practical problems into account.
Säkom is satisfied with Telia as network provider. However, there is an issue with interworking with other SPs using different equipment, and it is indeed the case that the network equipment works better with Telia’s services. (This shows in a neat way why NP and SP roles should be taken up by independent entities in order to guarantee fair and non-discriminatory conditions for all SPs.) According to Säkom’s CEO, Sabine Zimmerl-Berg, it would be good to have a standard for open networks but she thinks it is going to be hard to achieve.
7.5.3 Norrsken (central-northern Sweden)
The central-northern regions (län in Swedish) of Dalarna, Gävleborg, Västernorrland, Jämtland and Västerbotten represent mostly rural regions with middle incomes and a low population density (generally below ten per square kiometre on average).
The territory is largely rural, generally characterized by medium-size towns along the coast (from 10,000 to 80,000 inhabitants) in which by far the larger portion of the population is concentrated, as well as a large number of smaller localities of a few hundred to a few thousand inhabitants each, inland, at very large distances from each other and generally surrounded by farmland.
About Norrsken and the fibre initiative
There are several municipal networks in the region, which are similar to Säffle in terms of deployment. The Norrsken initiative was originally started to satisfy an interest in renting a dark fibre between Gävle and Stockholm to provide access to service providers from the capital up to the Gävleborg region. Therefore discussion began with other regions and municipalities. Some municipal networks had the same problem: e.g., Härnosand missed a great opportunity for a large business to be established in 2001 because there was no good broadband access (the speed requested was 155 Mbit/s). So they pooled fibre connections and started a company called Norrsken.
Today the Norrsken network, which federates several municipal networks into a regional network, comprises 15,000 km of fibre cable, and covers thirty-four municipalities in nine counties and provides more than 120,000 households and 8,000 businesses with the same opportunities for telecommunications as provided in major cities. The network is also directly connected by fibre with Stokab (the city of Stockholm’s extensive fibre network), which represents a great advantage because pretty much all service providers operating in Sweden can use the connectivity offered by Norrsken to seamlessly transport their services to any municipal network in the Norrsken ‘federation’.
Norrsken is a seven-employee holding company owned by the local governments and the utilities15. This centralized activity is intended to optimize resources, streamline operations and ensure quality in order to develop and provide competitiveness for customers in the regions in which they operate. The municipalities are responsible for deploying their own local fibre networks. Norrsken also offers connectivity services over those fibres on a rental basis. In the beginning SDH-based transmission was deployed, which in retrospect was an error. And indeed, when Norrsken transferred to wavelength division multiplexing (WDM), the business deals started to be signed.
Business model
Norrsken AB is a healthy operating company (150 employees, over EUR 60 million turnover, showing positive net income since 2004, rated AAA by Scandinavian rating agency Soliditet) and offering connectivity solutions at fibre, wavelength and Layer 2 levels (with standard Ethernet interfaces) to transport Internet, TV/video, voice/audio, as well as internal corporate communications. Besides public administrations and service providers, the 8,000-strong customer base includes real estate, private businesses, retail chains, hotels, etc.
A big role for Norrsken is to act as a common business interface for service providers. This facilitates creating the critical mass of services offered over the network, which makes it attractive for end-users to connect. Interestingly, the same type of role separation seen in the single-municipality networks has now been adopted by this regional backbone provider. Norrsken AB is responsible for the product offerings and customer relations, while the actual network operation is contracted out to an external network provider, currently Fiberdata AB.
Different municipalities connected to the Norrsken network apply different business models, even in different areas within a municipality. For instance, in the city of Gävle, Gavlenet the fibre network owned by the municipal utility company, uses a vertically integrated model with bitstream access for services other than Internet (type f in Figure 7.3), while Gavlegårdarna, which connects municipal housing units, follows a model of type c, with Zitius as NP.
According to Norrsken’s CEO, Björn Jonsson, municipal infrastructure operators that also work as network providers find it hard to attract service providers. The few remaining vertically integrated networks generally offer good retail Internet prices, but they are often limited to fibre to the node (with DSL on the last mile). More investment will therefore be needed in the future, which may put pressure on their financial situation in the medium term.
Public and commercial services present on the network
The regional network supports the public and commercial services to the extent they are provided across the municipal boundaries.
Examples of socio-economic impact of regional fibre networking
Norrsken’s most important success is probably that it enables the presence of competitive service providers in northern municipal networks, especially in remote regions. This facilitates the creation of a critical mass of services offered on the network, which makes it attractive for end-users to connect.
This has important implications for the provision of public administration (PA) services as well: unless there is a large base (high uptake rate) of connected and digitally competent citizens (regular users of commercial services over FttH connections), the launch and adoption of advanced PA services (from e-health to e-government) will be very challenging. This applies within a municipality but also for services provided on a regional basis.
Another effect is that it is creating a market for dark fibre and connectivity services in central and northern Sweden, increasing competition and thus lowering prices.
Successes, challenges and future directions
While in the beginning it was not easy to assert and properly communicate the role of Norrsken (which some municipalities tended to see as a competitor), today Norrsken is seen as a great success, appreciated by all consortium members. There was even a discussion about forming a big common open network but that never happened, mainly due to the different business models in different municipalities. According to the CEO of Norrsken, one challenge is to obtain more contracts from the public sector (in which politics is often a barrier).
The presence of Norrsken as a federation also provides the potential opportunity to pool the more than one hundred technicians scattered through various municipal networks. This would avoid duplications, create specialized competences and generate synergies in general. This remains a big challenge, especially considering the political-level agreement needed to enable this.
7.5.4 Skånet
Skåne is the southermost region (län) in Sweden, and includes thirty-three municipalities (kommuner), the largest being Malmö (301,000 inhabitants), Helsingborg (130,000), Lund (111,000 inhabitants) and Kristianstad (80,000 inhabitants).
Around 130 km long from north to south, Scania covers less than 3% of Sweden’s total area, but the population of approximately 1,230,000 represents 13% of Sweden’s total. Skåne is mainly a hilly territory; with moderate population density (110 inhabitants/km2), it is among the most densely populated regions in Sweden. Skåne is a relatively wealthy region, with intensive farming as well as a thriving high-tech and academic metropole.
Historically, Skåne has had a good penetration of broadband connections provided by DSL. A higher regional goal now applies: 100 Mbit/s to almost everyone in Skåne by 2020, meaning fibre to the home.
SkåNet and the BAS fibre initiative
The fibre project in Skåne was started in 2002 when the thirty-three municipalities in the region received EUR 22 million in state funds for broadband development. It was decided to put the money in a common fund and use the money to complete fibre deployment in the seventeen municipalities that did not have municipal fibre networks, as well as to expand the networks in the sixteen municipalities that already did have fibre.
SkåNet was then set up in 2003 by Region Skåne and the Skåne Association of Municipalities to coordinate the planning, implementation and development of an open IT infrastructure in Skåne. SkåNet also has an important role in the development of Skåne’s broadband strategy, to generate statistics and to support documentation on the developments. Skånet, which is a neutral player without commercial interests, is responsible for ensuring that contracts and their terms are respected. SkåNet monitors that the network is open and competitively neutral, and therefore plays an important role as guarantor that everyone operates under equal conditions.
The network, which today goes under the name BAS (Broadband for all in Skåne), consists of 2,000 kilometres of fibre cable and connects more than 300 switching centres in towns and villages where customers can always choose from at least two service providers.
The BAS network has been implemented through a PPP agreement (public-private partnership) with Tele2, as a result of a public tender, and is based on a combination of new construction and the existing routes within the Tele2 and municipal networks. About 70 per cent of the network is owned by Tele2 and 30 per cent by the sixteen municipal networks. The idea is that every municipal network, as well as the Tele2 network, should function as ingress for the entire BAS network, which increases the number of connections on the market.
Business model
In order to finance the cost of the deployment of the network (close to EUR 100 million) a PPP approach was followed. Under such a scheme, the municipalities and the municipal networks would provide the government grants (EUR 22 million), while a private contractor would provide a direct investment to top up the capital required. To make the deal worthwhile for the private investor, the agreement included a substantial eight-year contract to deliver services to the public sector in the region (roughly EUR 8 million per year for the public health care system and roughly EUR 2 million per year for regional administration). Moreover, having a unified network would increase the revenue prospects from dark fibre leases. Today, there are about thirty-five customers who rent dark fiber, mostly operators but also banks and large companies. Dark fibre leasing to mobile operators for LTE backhaul generates approx. EUR 10 million annually.
The winning bidder for the network deployment and management was Tele2. The contract mandates open access and regulates the price: dark fibre access must be granted to any other operator, and the lease price for dark fibre is set to EUR 0.50 per metre per year (about five times lower than the market price at the time the contract was signed), which has become the de-facto price in Skåne and in line with prices in Stockholm, for example. Tele2’s operation contract has just been extended by another five years.
In order to achieve price transparency and predictability, the price is published openly on SkåNet’s website and the pricing model is well known by market actors. An operator who wants to lease dark fibre on a particular route can calculate what the cost will be. Volume discounts are available, but these also are equal for all on pre-defined volumes and are published. There is now a discussion of introducing more specific pricing for different links in order to reflect the differences in commercial value of different sections of the network.
Regarding the specific municipal networks in Skåne, most of them follow the business model variation (c) in Figure 7.3, and OpenNet (which was recently purchased by Telenor’s Open Universe) is a successful NP in the region (with NP contracts throughout the whole of Sweden).
Public and commercial services present over the network
It is mainly traditional triple-play services which are offered in the municipalities of Skåne, like the ones described in the other cases. Similar types of web-based PA services present elsewhere are offered by most Skåne municipalities.
All the communications between health care centres in the region today run over the BAS network. There are plans to start pilot projects, together with the University of Lund, to offer e-health services to the households as well.
Unlike Norrsken, on the BAS network no wavelength or bitstream access services are provided to businesses and operators: only dark fibre leases. Nationwide connectivity is provided through collaboration with four other regional and national network operators, both public and private. via the consortium called Easy Fibre.
Examples of socio-economic impact of fibre
As for Norrsken, the main benefit of Skånet, according to its CEO, Christer Lannestam, is the availability of an infrastructure for the future. But another important factor is the political dialogue it has generated. It is crucial to create interest, awareness and engagement regarding the question of broadband as a social infrastructure.
Successes, challenges and future directions
Skånet has been a great success: today more citizens in the region are connected with fibre than would have been the case without BAS, and all municipalities have been included.
There are now pilot projects running to accelerate deployment and uptake: for instance, one in Helsingborg (with 20,000 single-unit houses), whereby areas with 100 houses are offered 1 Gbit/s for EUR 75 and free connection as long as 50% of households sign up. The first area has just passed 54% and will start deployment soon; meanwhile more end-users are signing up.
Skånet has also initiated collaboration with Lund University on the development and testing of new e-health services.
In the two rural FttH projects and the two regional fibre networking projects the benefits of FttH by municipalities have been focused mainly on direct benefits to the municipalities and anecdotal accounts of benefits experienced by end-users. For one longstanding example of municipal deployment of fibre, Stokab, a first study has been deployed to assess the wider socio-economic benefits. The following section is dedicated to this study.
7.6 Stokab: Stockholm’s fibre network and its socio-economic benefits
For almost twenty years, the City of Stockholm, via the fully owned company Stokab, has invested strategically in the development of an open, operator-neutral fibre network for everyone. A recent study (Forzati and Mattsson, 2013) shows that these investments have achieved the desired effects on the city’s ICT development and the establishment of ICT-related activities, but also that they have generated significant economic benefits for society, enterprises and citizens.
The socio-economic return on Stokab’s investment in fibre infrastructure to date is estimated in this study to be over SEK 16 billion, or EUR 1.8 billion. This result is based on a few effects that are quantifiable. It is expected that the actual return on investments is much larger.
7.6.1 The Stokab model
Stokab owns and is responsible for the passive fibre network, while market players operate and deliver services over the network. Stockholm’s basic idea is that IT infrastructure should be available to the whole society – public sector, telecom operators, and other businesses alike. Therefore Stokab’s network is designed to facilitate competition: the fibre network is open to everyone on equal terms.
The aim of the network’s deployment is to create an ICT infrastructure that allows competition by giving telecom operators and other companies and organizations access to the infrastructure. This vision differs from the prevailing opinion in the rest of Europe, where fibre and broadband networks are often considered as networks for telecom operators. Stokab, however, has inspired several municipal and regional fibre networks throughout Europe and beyond, whereby the open access network model is becoming increasingly better appreciated. Stockholm is often cited as a world-class ICT city.
Aside from passive fibre lines, Stokab provides physical space in nodes equipped with power, cooling, etc. Stokab’s fibre network connects almost all multi-dwelling units and commercial properties in the Stockholm municipality: about 90 per cent of households and almost 100 per cent of enterprises have the possibility of signing up for a fibre-based connection.
An extensive backbone network connects industrial areas, all major healthcare facilities and urban centres in the region. The fibre network is available in all parts of the municipality and as an extensive interconnecting network throughout the region. With its 1.25 million kilometres of fibre (in 5,000 km of cables), Stockholm is one of the world’s most developed cities in terms of fibre.
Since the company’s inception in 1994, the passive network structure and the business model have been designed to enable all stakeholders to define their own network structures. The lease of the network can expand as well as shrink based on a player’s need.
In 2012, Stokab had over 100 telecom operators and more than 700 companies and organizations as customers. These can lease fibre directly from Stokab to deliver services in competition. Virtually all telecom operators in Sweden have facilities in Stokab network nodes. National and international fibre connections reach Stokab nodes so that all operators can gain access to links throughout Sweden and the rest of the world, through virtually any operator.
7.6.2 Socio-economic return on investment
Stokab had great importance for Stockholm’s businesses and IT-development. Without Stokab’s fibre network, science parks like Kista, north of town, would probably not have developed into what is today’s success: Kista Science City, for instance, has more than 1,000 ICT companies and around 24,000 employees, as well as 6,800 university students and 1,100 researchers within the field of ICT. It is an attractive environment for ICT companies and developers so it is not surprising that all major IT and telecom companies, as well as universities and research institutes like Swedish ICT, have offices in Kista.
The fibre network has also facilitated innovations and new enterprises such as Spotify and Skype. Media companies have also been able to produce television in a whole new way.
For the past twenty years, Stokab has invested an average of more than SEK 250 million per year, to total of SEK5.4 billion up to 2012. This investment has been possible thanks to the profits generated by Stokab. Break-even was reached in 2001 and the accumulated profit has now passed 1 billion SEK. Until now the profit level has been low compared with the investment level due to the heavy upfront investments required in the initial phase. From the year 2005, the returns have increased steadily, enabling further major investments. It is worth mentioning that the fibre network was built without public funding and was instead financed through loans and revenues.
Through this extensive open fibre network provided by a neutral player, telecom operators can lease and design their own fibre networks without having to make costly investments or having to pay expensive leasing fees to a competitor. Today, to lease fibre in Stockholm costs less (sometimes much less) than half as much as in other capitals around the world. This translates into lower costs, not only for operators but also for all enterprises that have a need for fast and reliable communications. Lower lease prices propagate down the value chain and stimulate entrepreneurship and new service developments.
The fibre network also delivers a wide range of indirect effects to society. It enables, for example, the more effective use of cloud services, videoconferencing, healthcare, distance education, and other bandwidth-hungry services like HD-TV, video on demand and other streaming media. Moreover, innovation power is unleashed when both small businesses and households have access to the same broadband connectivity that previously was only available to large companies.
As the telecom operators compete on equal terms, competition is fierce in Stockholm, which leads to lower prices for broadband compared to cities where competition is weaker. Savings due to lower broadband costs for companies are estimated at approximately SEK 75 million per year if compared to the capital city of Denmark, Copenhagen. The difference becomes even more significant when other, more expensive, European cities are used as the benchmark.
Stockholm’s city housing companies have had a major role in the development of broadband. Early on they adopted a broadband policy to connect their properties to Stokab’s network and to install fibre all the way to each apartment. They are also installing home networks inside the apartments with outlets in every room. Through collaboration models, they have inspired other property owners of multi-dwelling units to join Stokab’s network. The housing companies’ accumulated investment now amounts to nearly SEK 2 billion.
Building a property network also has other merits beyond the mere delivery of broadband services to the tenants. Since the property owners connect all parts of the property, the communications network can also be used for managing, monitoring and measuring the facilities. By connecting multi-dwelling units with fibre, property owners have been able to use control and automation services more effectively (electronic locks, surveillance, etc.), while at the same time being able to raise the rent as the fibre connection has given tenants an added value. Until now, fibre connectivity has led to an increase in use value for the tenants and a higher property value for municipal housing companies in Stockholm (nearly 100,000 apartments) of SEK 1.85 billion, as well as increased rental revenues of over SEK 30 million per year. These effects cover the housing companies’ investments almost in full and are expected to grow in the coming years.
Generally, when building a 4G/LTE network, 70–80% of the total cost derives from deployment of fibre infrastructure. In principle, each base station needs to be connected to fibre to sustain the high 4G/LTE capacity. Leasing the required fibre connections, instead of investing in a private backhaul network, can significantly reduce the deployment cost for 4G/LTE. The world’s first 4G/LTE network was installed in Stockholm. Net4Mobility (jointly owned by operators Telenor and Tele2) states that 4G/LTE would not have been launched in Stockholm if the necessary fibre had not been available to lease from Stokab. Today, four 4G/LTE-networks with extensive coverage are operating in Stockholm.
As Stockholm City and Stockholm County have been able to connect their premises with fibre, it has become possible to purchase data and telecommunications services on an open market. This has generated a cost saving for the municipality and for the county of about SEK 2 billion over the years 1996–2012.
Stokab procures its deployment, operations, materials, planning, etc., from the private market. The procurement process and the large investments made over the years have generated a direct economic activity that is estimated to be over SEK 5 billion in revenues for the supplier industry.
Several studies show that high-capacity broadband leads to growth and the creation of jobs beyond the direct economic activity generated in the supplier industry: e.g., through the development and use of advanced services and products, as well as higher ICT competence, which in turn leads to increased productivity and entrepreneurship. According to Acreo’s econometric model, the ‘job value’ which the fibre network has created in Stockholm is estimated at about SEK 7.7 billion.
7.7 State of the telecommunications market in Sweden at the end of 2012
Returning from a focus on FttH to broadband developments in general, this final section provides an overview of the state of affairs for Sweden based on the most recent reporting by the national regulator PTS.
According to PTS (2013), the total revenue of the electronic communications retail market in 2012 amounted to SEK 53 billion, or EUR 6 billion. Compared to 2011, this is a small decrease, mainly due to the revenue from fixed-line telephony services decreasing by 12 per cent. The revenue from mobile telephony and data services continues to increase overall, but not as fast as in previous years. The revenue from mobile voice and data increased by 21 per cent in 2012, amounting to SEK 7 billion.
The number of subscribers who have used services on the 4G network (LTE) was approximately 240,000 at the end of 2012, an increase by 210,000 subscribers over the previous year.
Mobile networks were used to send and receive 176,000 terabytes of data in 2012, which is an increase of 75 per cent compared to 2011. The number of text messages (SMS) decreased by approximately 6 per cent in 2012, while the number of multimedia messages (MMS) increased by 15 per cent. The number of outgoing call minutes from the mobile network increased by 5 per cent in 2012 and amounted to 24 million minutes. At the same time, outgoing traffic minutes from the fixed-line network decreased by 14 per cent in 2012, meaning that the number of outgoing traffic minutes decreased by a total of 3 per cent.
The number of fibre-optic broadband subscriptions increased by 16 per cent, or by 143,000 subscriptions, in 2012, and at the end of the year there were over a million such subscriptions. The number of subscriptions to both xDSL broadband and cable-TV decreased in 2012. Nonetheless, the total number of fixed broadband subscriptions increased by 1 per cent.
The demand for high data rates continues to increase, and the number of subscriptions to broadband services with data transfer rates of 100 Mbit/s or higher was 755,000 at the end of 2012. This corresponds to a quarter of all fixed-line broadband subscriptions. PTS has asked, for the first time, for data regarding subscriptions with a data transfer rate of over 1 Gbit/s, and at the end of 2012 there were approximately 1,000 of these connections.
TV subscriptions via fibre-optic and fibre-optic LAN were the distribution channels for traditional TV services which continued to increase the most. The number of TV subscriptions via fibre-optic and fibre-optic LAN increased by 103,000, or 41 per cent, thus amounting to 354,000 on the final day of December 2012.
The Digital Agenda targets set for 2020 are well within reach. Approximately 70% of all broadband lines have data rates of 30 Mbit/s or more at the end of 2012. Coverage of 100 Mbit/s is provided through cable network connections at approximately 600,000 at the end of 2012 and fibre connections at approximately 1 million, covering around 37% of households. By the end of 2013, the uptake of broadband of 100 Mbit/s or more stood at 975,000 connections or approximately 22% of households, while LTE stood at 1.5 million (PTS, 2014).
References
1 On 10 February 2011, PTS issued an injunction ordering the incumbent to provide access to FttB, in accordance with the decisions and to adjust the reference offer accordingly. On 25 February 2011 the incumbent appealed the injunction at the administrative court.
2 A third challenge – less immediately relevant to FttX – is based on an increasing demand for mobility leading to a shortage of spectrum enabling wireless communications with high area coverage, which limits the ability to access the Internet from any location.
3 The municipalities have municipal governments, and are further divided into parishes. The parish division is traditionally used by the Church of Sweden but also serves as a measure for Swedish censuses and elections.
4 See also the case studies on Spain, Poland and France in this book.
5 For the reader’s convenience, all monetary values are expressed in euros (€), at a nominal long-term exchange rate of EUR 1=SEK 9. Temporary fluctuations of up to 10% may occur.
6 Source: www.ict-oase.eu.
7 Some examples are Skånet, Norrsken (both analysed in this chapter), Norrlänk, Västlänk, AC-Net and IT Norrbotten; in some cases (e.g., Norrsken) there have also been discussions of forming a big common and open net, although for the time being all member networks remain independent and sometimes apply different business models.
8 Source: Svenska Stadsnätsföreningens, Marknadsrapport 2012, Stockholm, 2012.
9 Installing and operating the passive fibre plant is a typical infrastructure management activity involving right-of-way, trenching, cable-duct-laying and local-office premises; it is typically characterized by high CAPEX, low OPEX and low economies of scale; it is highly local, hard to duplicate and inherently subject to regulation.
10 In contrast, active equipment (transponders, routers and switches, control and management servers) is characterized by high OPEX and economies of scale; it needs to be upgraded more frequently, and requires extensive and up-to-date technical competence.
11 The recently initiated Open Network Forum (www.opennetworkforum.org) is looking at the possibility of starting to standardize and currently is generating interest in the Swedish FttH business.
12 See Section 7.4.5 for more considerations in the formation of regional networks.
13 The forest industry has for centuries played an important role in the Hudiksvall economy. Wood production activity at the beginning of the century prompted technology innovations and generated manufacturing competence and know-how: e.g., in hydraulics and mechanics. Ericsson Network Technologies was established here to take advantage of such an ecosystem for its production of cables and network elements. Cable production was initially copper-based; when Ericsson started producing optical fibres, it was natural to locate production here. In the late 1990s the Fibre Optic Valley hub was established to encourage manufacturing, research, development and education in fibre optics. Many of Ericsson’s production activities have since moved to lower-cost locations but several local companies have been started by former Ericsson employees.
14 Only 200 out of 2,500 rural households are not connected because they decided not to participate in the project; however, they have the opportunity to be connected whenever they wish in the future.
15 Besides the Gävleborg region, all the twenty-one Norrsken members are municipal networks or entities running them (municipalities and public utility companies), with the exception of Dalarenergi, which is now privately owned (by power utility Fortum) but still works pretty much like a public utility, and the Kramfors network which was sold to operator Alltele.
8 Germany
8.1 Introduction to the case study
The deployment of broadband infrastructure in Germany is perceived by members of the private and public sectors as an important element that will help Germany to strengthen its leading economic position in Europe and in the world. In this chapter we describe the evolution of the broadband market in Germany and analyse the role played by the public and private sectors in the expansion of fixed and mobile penetration in the country. We study the broadband developments from 1996 up to and including 2013, consider the achievement of the European Commission Digital Agenda targets for 2020 and assess the effectiveness of the policy measures applied in recent years.
This chapter is divided into the following sections: The public policies related to broadband deployment are described in Section 8.2. Section 8.3 describes the evolution of the broadband market. In Section 8.4 the level of achievement of the Digital Agenda targets is presented, whereas Section 8.5 discusses the lessons that can be learnt from the dynamics of the broadband market in Germany. Finally, the conclusions are presented in Section 8.6.
8.2 Public policies
8.2.1 Public policies related to broadband deployment
According to German constitutional law (Grundgesetz (GG), 2012), exclusive legislative competence in the field of telecommunications lies with the federal level (Art. 73 (1) Nr. 7 GG). Telecommunications are thereby understood as a technical process of signal transmission with the possibility of reproduction at the place of destination, including the provisioning of technical infrastructure and equipment at the beginning and the end of the transmission line (Nettesheim, Reference Nettesheim and Säcker2009).
Moreover, the federal level has an obligation to provide for blanket coverage of the state territory with basic telecommunications services of adequate quality (Art. 87f (1) GG) – universal service. In doing so, the state assumes responsibility as a guarantor of subsistence and will provide for a legal and regulatory framework allowing for a market supply of necessary infrastructure and services (Nettesheim, Reference Nettesheim and Säcker2009).
Content-related issues of transmitted signals, broadcasting and media law remain the domain of the sixteen German federal states (Bundesländer or Länder for short). This does not mean, however, that the Länder are prohibited from any activity that contributes to telecommunications infrastructure development. On the contrary, as long as they comply with competition law and state aid rules, the Länder and municipalities may take measures that complement and enhance telecommunications provision above the minimum level (Kühling and Neumann, Reference Kühling, Neumann, Inderst, Kühling, Neumann und and Peitz2012).
8.2.2 Definition of broadband in Germany
There is no legal definition of broadband in the German telecommunications law (Telekommunikationsgesetz, TKG). The analysis of various policy documents of the German government leads to the conclusion that broadband is a connection whose transmission rate clearly exceeds that of the Integrated Services Digital Network (ISDN): i.e., 144 kbit/s. Until 2009, for statistical purposes, the minimum transmission rate of 384 kbit/s downstream was used (Breitbandatlas 2009-02), but the current broadband strategy of the federal government introduced a more appropriate and up-to-date notion of ʻ1 Mbit/s broadbandʼ, defined as a minimum of 1 Mbit/s downstream and 128 kbit/s upstream, which is considered a basic level provision (Breitbandatlas 2009–02; BMWi, 2009).
8.2.3 The first phase: market liberalization framework and the beginning of broadband promotion
The German telecommunications law adopted in 1996 did not contain provisions directly dealing with the development of the broadband infrastructure nor mentioned the promotion and support for application of innovative and new technologies (TKG, 1996). Its objective was to promote competition and universal coverage with telecommunications services through sector-specific regulation (Art. 1). The only provisions of relevance for the development of infrastructure as an alternative to the copper lines of the Public Switched Telephone Network (PSTN) of the incumbent were those implementing the European Directive 90/387/EEC of 28 June 1990 (European Communities, 1990), on the establishment of the internal market for telecommunications services through the implementation of Open Network Provision (ONP). According to these provisions, a dominant provider of public telecommunications services and infrastructure had to ensure access to and interconnection with its network for its competitors and users under non-discriminatory conditions (TKG, 1996, Art. 33 and 35). Also, sharing of public conduits or ducts was foreseen in the case where the laying of new telecommunications cables was impossible or required disproportionally high expenses (Art. 51).
The initial roll-out of the broadband networks was complicated by the heterogeneity of ownership of various parts of the public telecommunications network. While the backbone telecommunications network belonged to the incumbent Deutsche Telekom, the ownership of the local loop was not uniform. The local access networks were owned (named in the order of diminishing ownership) by Deutsche Telekom, Deutsche Bank, Bosch Telecom and a number of small and very small network operators (Möschel, Reference Möschel2001). Due to this particularity, coordination of investments was necessary both for the backbone infrastructure and the local loop.
Following the European Commission Directive 96/19/EEC, amending Directive 90/388/EEC with regard to the implementation of full competition in telecommunications markets, the German telecommunications market was fully liberalized on 01.01.1998. Subsequently, Germany unbundled the copper local loop, in compliance with Regulation (EC) No 2887/2000 of the European Parliament and of the Council on Unbundled Access to the Local Loop (European Communities, 2000) and Commission’s Recommendation on Unbundled Access to the Local Loop (European Commission, 2000), thus enabling the competitive provision of a full range of electronic communications services, which includes broadband multimedia and high-speed internet.
Similarly to the European Union (EU) broadband policy (Cava-Ferreruela and Alabau-Muñoz, Reference Cava-Ferreruela and Alabau-Muñoz2005), the development of broadband infrastructure in Germany has been considered a policy measure aimed at the realization of the information society and, therefore, was promoted in subordination to the respective initiatives. This approach of ‘embedded broadband promotion’ was adopted in one of the first, but still relevant, policy measures of the federal government: the ʻInitiative D21ʼ. Initiative D21 is a partnership between the political actors at the federal, regional (Länder) and local levels on the one hand, and interested economic partners from all industry sectors on the other. Projects supported through Initiative D21 should be non-profit and practice oriented and contribute to overall societal development and economic growth.
Simultaneously, the German government led the adoption of broadband technologies creating (additional) demand and applying innovative applications and services. In 1999 an eGovernment initiative for local governance – MEDIA@KOMM – started with the aim to develop and apply multimedia in towns and communities (DIW, 2004). Within the initiative BundOnline 2005, launched in 2000, a modernization of the federal administration was carried out, whereby all governmental services suitable for such provision were transformed into online services (BMI, 2006). The measures appeared to be a success such that follow-up projects were launched. MEDIA@KOMM-Transfer was carried out in 2004–2007 for the promotion of regional and local eGovernment and relevant international cooperation. The ongoing MEDIA@KOMM-Innovation project aims to support the development of regional and local eGovernment networks and provides for the exchange of experience and best practices, as well as for harmonization and standardization of eGovernment solutions.
In March 2002, the Federal Government and the members of the Initiative D21 founded the Deutsche Breitbandinitiative, which is an open platform for dialogue amongst industry, science institutes and the government in order to enable networking and experience and knowledge transfer and to strengthen contacts between the decisive actors. It does not have its own budget, but serves as a cross-sectional project active in all the fields where broadband solutions are possible but not yet implemented (DIW, 2004). In June 2003, the Deutsche Breitbandinitiative adopted an action plan which was to complement the infrastructure development by supporting the creation of broadband services, applications and content, stimulating demand, enhancing security and raising users’ awareness (BMWi & BMBF, 2003). The promotion of an investment-friendly climate was intended to attract private investors, who were to assume the main financial burden of the broadband roll-out.
8.2.4 The second phase: greater consideration of information society requirements
The eEurope 2005 Action Plan for the development of the information society (European Commission, 2002), which focused in part on broadband as a necessary infrastructure to provide high-speed connectivity – and thus stimulate and enable use of advanced applications and services by public and private parties – required all member states to adopt national broadband plans. The German action programme Informationsgesellschaft Deutschland 2006 was adopted in December 2003 and continued the line of embedded broadband promotion (BMWi and BMBF, 2003). To realize the information society, the development of an appropriate infrastructure was deemed indispensable and telecommunications and broadband were identified as the very first spheres of activity of the German ICT policy. The action programme had the objective of making broadband the dominant access technology by 2005 and of reaching a broadband penetration level of over 50% by 2010 (BMWi and BMBF, 2003).
The responsibility for implementation was divided between the Federal Ministry of Education and Research, which deals with technological development, and the Federal Ministry of Economics and Technology, which is in charge of promoting the application of technologies (DIW, 2004). The federal action programme largely embraced the key steps proposed by the Deutsche Breitbandinitiative, notably the central role of private investments in broadband development. It renounced subsidies as distorting competition, making an exception only for financing from the EU structural funds – the European Regional Development Fund and the European Agricultural Fund for Rural Development. Furthermore, the action programme followed the strategy of stimulating the supply by promoting the demand. Internet usage and eGovernment initiatives were to be promoted as part of this programme. In this context, the programme DeutschlandOnline of 2003 became an umbrella project for federal, regional and local levels of governance (Thome, Reference Thome2006).
The new version of the German telecommunications law of 2004, implementing the revised EU framework, aimed at improving the general investment climate for infrastructure projects. Yet, the promotion of broadband and next-generation networks was not singled out as a priority. Rather, the promotion of efficient investments in infrastructure and the support of innovations were listed among the objectives of the law (TKG, 2004, Art. 2). Accordingly, a number of provisions were designed to secure the planning and investments for the undertakings. Article 21 of the TKG, which deals with the imposition of access obligations on dominant infrastructure providers, stated explicitly that, when considering this regulatory measure, the Bundesnetzagentur (BNetzA), the German telecommunications regulator, had to take into account the initial investments of the infrastructure’s owner as well as the necessity to create incentives for further investments in infrastructure in order to promote competition in the infrastructure market. Where access obligations were imposed on a dominant provider, the Bundesnetzagentur had also to regulate its interconnection prices (TKG, 2004, Art. 30(1)). When fixing the price, the regulator had to take into account infrastructure- or service-specific risks connected to the capital invested (Art. 31(4)). All adopted regulatory measures were part of the ex-ante sector-specific regulation, meaning that the intensity of the regulation depended on the existence of effective competition within the market at hand and of significant market power of the network provider in question (Christmann, Ensslin and Wachs, Reference Christmann, Enßlin and Wachs2005).
The subsequent action programme of the federal government iD2010 – Informationsgesellschaft Deutschland 2010, was adopted in 2006 in line with the EU i2010 strategy ʻA European Information Society for growth and developmentʼ (European Commission, 2005) and continued the promotion of information-society-oriented broadband development (BMWi, 2006) applying the two-prong strategy: the supply should be improved and the demand created. By that time, the supply had increased rapidly and the federal government announced that a new realistic objective was household penetration of 98 per cent by 2008, irrespective of the type of network. The creation of an interactive broadband atlas would permit a better assessment of broadband coverage and demonstrate broadband access potential for the users, industry and policy-makers. Further studies of broadband development and dialogue within the Deutsche Breitbandinitiative were to pursue the same objective. On the demand side of the market, a steady growth was predicted, such that a 50% level of uptake by German households was expected well before 2010. It could be enhanced by further innovation related to services and content and be supported by creating the appropriate conditions for it: the digitalization of information channels and the convergence of the media.
In 2007, the so-called ʻregulatory holiday’ provision was introduced as Article 9a of the TKG, intended to directly promote broadband development. Accordingly, new markets were not to be regulated unless there were sufficient grounds to assume that lack of regulation would hinder development of sustainable competition in the market in question in the long term. The regulatory holiday provision exempted Deutsche Telekom from having to grant competitors access to its new VDSL network. The new market definition encompassed those markets for services or products that differed substantially from services and products already available and did not merely replace them (TKG, 2004, Art. 3 Nr. 12a), thus embracing both various broadband and new generation technologies and services (BMWi, 2009).
The European Commission raised objections against this provision, claiming violations of Articles 6 to 8(1) and (2), 15(3) and 16 of Directive 2002/21/EC of the European Parliament and of the Council of 7 March 2002 on a common regulatory framework for electronic communications networks and services (European Communities, 2002b) and violation of Article 8(4) of Directive 2002/19/EC of the European Parliament and of the Council of 7 March 2002 on access to, and interconnection of, electronic communications networks and associated facilities (European Communities, 2002a), as well as a violation of Article 17(2) of Directive 2002/22/EC of the European Parliament and of the Council of 7 March 2002 on universal service and users’ rights relating to electronic communications networks and services (European Communities, 2002c). The Court of Justice of the European Union upheld the Commission’s claim, finding that the amendment to the TKG meant an undue legislative interference into regulatory competences of the national regulatory authority that seriously restricted regulatory discretion of the Bundesnetzagentur regarding the market definition and market analysis (CJEU, 2009). As a consequence, Art. 9a had to be removed in the new version of TKG in 2012.
8.2.5 The third phase: intensified and targeted policy of broadband promotion
After almost ten years of subordination of broadband development to the needs of the information society, the so-called broadband strategy of the federal government adopted in 2009 ‘broke ranks’ in terms of its approach: it deals exclusively with broadband development, leaving other information society topics outside its scope (BMWi, 2009). Another novelty is the differentiation between the broadband data rates (1 Mbit/s, 2 Mbit/s and 50 Mbit/s). The federal government set two objectives, which correspond to the measures to strengthen the German economy declared in the second recovery package approved in January 2009 (Pakt für Beschäftigung und Stabilität in Deutschland zur Sicherheit der Arbeitsplätze, Stärkung der Wachstumskräfte und Modernisierung des Landes, – Bundestag, 2009):
1. to close the gaps (‘white areas’) in broadband coverage and to ensure an ubiquitous availability of 1 Mbit/s broadband by the end of 2010 and
2. to provide a 50 Mbit/s broadband access to 75 per cent of all households by 2014. This will constitute a basis for further fast deployment of high-data rate connections for the whole territory.
To realize the objectives of the German broadband strategy, several measures were proposed, to be kept updated and adjusted depending on the progress of the strategy’s implementation:
For example, the existing infrastructure and facilities will be shared in order to avoid duplication of infrastructure.
A broadband atlas and a database on all relevant building sites and projects will be developed.
Furthermore, demand-oriented empty ducts will be laid and construction of telecommunications infrastructure will be undertaken in cooperation and coordination with other utility sectors (for instance, water supply).
The described measures will be carried out in close cooperation with the Länder and the local authorities and this teamwork will be strengthened through the establishment of working groups within the Federal Ministry for Economics and Technology, consisting of representatives of the Länder and the federal government.
In this context, financing through the so-called ʻjoint tasksʼ has been improved. Already in 2008, the financing of broadband infrastructure roll-out became possible for rural areas, where broadband development was not commercially profitable, within the Joint Task for the Improvement of Agrarian Structures and Coast Protection (GAK) of the Federal Ministry for Food, Agriculture and Consumer Protection. The Länder can propose their own measures to be included in the GAK framework at the federal level, containing principles and general requirements for integrated rural development. When approved, the framework plan is to be implemented at the Länder level (GAK-Gesetz, Art. 7-9). This plan expired at the end of 2013 and foresaw in Part B financial support for rural areas that lack or are short of sufficient broadband provision and can prove business and household demand (GAK-Rahmenplan, 2011). The respective local authorities or associations could apply for financing through subsidies, grants or loans from the federal government. With these means they can complement private and communal investments in projects for infrastructure roll-out and accompanying activities (planning, consulting, informational events, etc). In the new framework the laying of empty ducts has been rendered eligible for financing and the federal subsidy ceiling has been increased from 60% to 90% with the remainder provided by the Land. The limit of the subsidy per project was also raised up to EUR 500,000.
The laying of empty ducts is perceived to be a decisive measure for the development of high-speed communications networks. For its promotion, a special umbrella framework has been created at the federal level that provides general conditions for subsidies at the local level and eliminates the necessity to notify the Commission (Bundesrahmenregelung Leerrohre, 2011) of every single community measure. It was approved by the Commission in July 2010 and provides EUR 600 million over the period of five years (until 2015) for development of passive infrastructure in ʻwhiteʼ and ʻgreyʼ areas.
Additionally, since mid-2009 structurally weak areas, especially in eastern Germany, can rely on financing through the Joint Task for the Improvement of Regional Economic Structure (GRW) of the Federal Ministry of Economics and Technology for the development of a high-quality broadband network that provides a minimum service of 2 Mbit/s. Similar to GAK, a coordination framework defining eligibility for financing areas and measures was adopted to be implemented by the Länder (GRW-Gesetz, Art. 4-6). The conditions for a subsidy require a higher data rate (at least 2 Mbit/s) and evidence of an inadequate cost-performance ratio in comparison to adjacent urban areas (GRW-Koordinationsrahmen, Attachment 4, Number 3.2.4.).
It appears that the available funds have been actively used. The EUR 10 million provided annually by the federal state under the GAK was overdrawn in 2011 and 2012 (EUR 19.2 million and EUR 14.7 million, respectively) which became possible due to the remaining sums from the early years of the fund and thanks to excess payments from the Länder. Due to this success, the fund, originally to end in 2013, will continue its operation until 2018 (Goldmedia, 2013). Funding via GRW has had a more modest success (2012 with EUR 2.9 Million was the peak year) because GRW financial means are committed not to broadband development but to development of structurally weak regions in general and are used for various projects (Goldmedia, 2013).
Under the second recovery package, which expired at the end of 2010, additional financing was available for the cases not falling under the Joint Tasks (Börnsen, Reference Börnsen2009). The attractive features of this mechanism were the absence of the subsidy limit per project and the possibility to apply for regional projects not being carried out by local authorities.
One more source of financing has been established directly for undertakings: according to the Law on Future Investments (Zukunftsinvestitionsgesetz – ZuInvPG, 2009) the Länder can provide local authorities with finances which they in their turn can make available to undertakings developing or operating broadband networks. The Länder have the competence to decide whether and under what conditions financing provided by the Law on Future Investments will be used. For instance, undertakings may apply for guarantees by the federal government and/or Länder that assume a default risk of up to 90 per cent.
Besides the joint financing, some Länder (Bavaria, North Rhine-Westphalia, Rhineland-Palatinate, Schleswig-Holstein and Thuringia) have their own financing programmes that offer cheap long-term loans allowing 10 to 20 years return on investment (Goldmedia, 2013). It will also be noted that the aforementioned EU structural funds – European Regional Development Fund (founded in 1999) and European Agricultural Fund for Rural Development (founded in 2005) – present an additional funding possibility which is, yet, of a secondary character in relation to the national financing opportunities (BMWi and BMELV, 2009).
The latest amendments to the German telecommunications law of 2012 follow the line of the governmental strategy to strengthen the promotion of broadband development and declare the ʻacceleration of development of heavy-duty public telecommunications networks of next generationʼ as one of the major objectives of telecommunications regulation (TKG, 2012, Art. 2(2) Nr. 5). Having dropped the ʻregulatory holidayʼ provision, TKG 2012 relies strongly on enhancing security of planning and investment for undertakings, thus further developing the approach launched in TKG 2004, as well as on facilitating risk sharing and cooperation among investors (Körber, Reference Körber2011).
Over time, the regulatory framework has stabilized and become more precise, thus enhancing the security of planning and investment. The law aims at objective, transparent, non-discriminatory and proportional regulatory principles underpinning the work of the Bundesnetzagentur, which will be substantiated by maintaining the same regulatory concept over longer appropriate periods of time, to increase predictability of regulation, and by considering investors’ risks in case of access obligations, by allowing for risk-sharing agreements between undertakings, by prohibiting discrimination and promoting competition, as well as by recognizing the complementary and transitional character of regulatory measures in relation to competition (TKG, 2012, Art. 2(3)).
A more straightforward measure to improve the investment climate is the possible adoption by the Bundesnetzagentur of periodic administrative rulings (Verwaltungsvorschrift) describing the general regulatory requirements. To assess efficient investments and innovation regarding new and enhanced infrastructure, a methodology for risk determination, criteria for establishment of access conditions and prices for risk-sharing models, and examples of risk-sharing models will be considered by the regulator (TKG, 2012, Art. 15a(2)). On the basis of such administrative rulings and upon request of any provider of a public telecommunications network contemplating development of new-generation networks, the Bundesnetzagentur is to provide region-specific information about expected changes in the regulatory framework or measures (TKG, 2012, Art. 15a(4)). To further improve consistency and predictability of regulation, as well as the security of planning and investment for undertakings, the Bundesnetzagentur has the potential to expand market regulation periods from three to a maximum of six years, provided the European Commission has no objections to such prolongation (TKG, 2012, Art. 14(2)).
Next to the already mentioned provisions of Article 15a(2) facilitating risks sharing, the regulatory measures on the basis of Articles 30 and 32 of the TKG create additional incentives for this practice. When regulating the prices charged by dominant network providers for access (both services and facilities), the Bundesnetzagentur will consider initial investments and allow for an appropriate return (risk premium) upon the invested capital, as well as take in utmost account special risks and risk-sharing agreements between undertakings regarding next-generation networks (TKG, 2012, Art. 30(3) and 32(3) Nr. 3).
In addition to sharing investment risks, TKG 2012 seeks to promote actual infrastructure sharing between undertakings. Previous legislation dealt with only one aspect of these issues, namely with cooperation when laying ducts and wires. According to Art. 21(2), the Bundesnetzagentur, acting upon a request or ex officio, may impose on a dominant provider of public telecommunications networks, among other obligations, the requirement to ensure open access to certain network elements or facilities, including unbundled broadband access. At the same time, a number of obligations are to be imposed on a dominant provider under Art. 21(3), including access to passive network elements and open access to technical interfaces, protocols and other key technologies necessary for services or interoperability of services, as well as collocation and other types of sharing of buildings, ducts, poles and other facilities.
In order to achieve the targeted data rate of 50 Mbit/s and more, and to prevent signal degradation, it is necessary to at least partially upgrade the copper wire between the distribution frame in the local exchange and the subscriber terminal with fibre. To do this, the new Art. 77a (TKG 2012) guarantees access to the relevant network infrastructure on the premises in two ways: either by collocation of wires of competing providers in the same conduits or by sharing the existing wires if duplication of the infrastructure is economically inefficient or technologically impossible (Kind and Schramm, Reference Kind and Schramm2012). The Bundesnetzagentur’s order to co-locate or share the wires and conduits in question can be addressed not only to network providers but also to other owners of (passive) infrastructure who do not operate the networks. Moreover, the imposition of the obligation does not depend on the market power of the addressee but has the objective of achieving synergy effects in relation to the network infrastructure (TKG, 2012, Art. 77a(1); Kind and Schramm, Reference Kind and Schramm2012). The Bundesnetzagentur can create an inventory of all facilities that can be used for telecommunications purposes (for instance, ducts, poles, antennas, etc.) and can request the relevant information from telecommunications providers and other legal entities in possession of such facilities (TKG, 2012, Art. 77a(3)).
In order to further minimize the costs of the development of new broadband networks, TKG 2012 allows the collocation of telecommunications infrastructure with other facilities (water, gas pipes, power lines). Upon a written request from an interested provider of public telecommunications networks, undertakings and legal persons in possession of facilities that can be used for the development and laying of next-generation networks are obliged to make an offer to share such facilities (TKG, 2012, Art. 77b(1)). Additionally, Art. 77c-77e provide for sharing of roads, waterways and railway infrastructure belonging to the federal government.
The investment climate for broadband development is further improved by initial regulation of the deployment of innovative laying techniques. Commonly, telecommunications infrastructure will be laid in compliance with the standards set by the German Institute for Standardization (Deutsches Institut für Normung, DIN) in the General Technical Instruction for the usage of roads for cables and telecommunications lines (Allgemeine Technische Bestimmungen für die Benutzung von Straßen durch Leitungen und Telekommunikationslinien, ATB-BeStra) which prescribes, for instance, a certain depth and width of trenches for the wires. Art. 68(2) of TKG 2012 provides for an exhaustive list of requirements to be fulfilled for a request to be approved by the carrier of public easement allowing the requesting provider to lay fibre infrastructure with the help of micro- or mini-trenching techniques in deviation from the aforementioned DIN standards.
An important measure to promote innovative broadband technologies is the decision of the Bundesnetzagentur of Summer 2013 to slightly ease the incumbent’s obligation to provide access to the sub-loop segment of the network. Now Deutsche Telekom may refuse access to the sub-loop if it is necessary to enable implementation of vectoring at the street cabinet (by Deutsche Telekom itself or another company). All competitors will still be able to interconnect at the cabinet using optical fibre and implement vectoring if they offer an appropriate bitstream product under open access arrangements.
8.2.6 Broadband-related radio frequency spectrum measures
Like other national policies in the radio spectrum field, German policy is subject to the limitations imposed by decisions about radio frequency allocation and uses adopted at the international (International Telecommunications Union, ITU) and regional (European Conference of Postal and Telecommunications Administrations (CEPT)) and EU institution levels (Bundesnetzagentur, 2013a; TKG-Kommentar, 2013). Implementing the international allocation of spectrum frequencies, the federal government adopted a national frequencies regulation that allocates certain frequency bands for certain uses. On its basis, the Bundesnetzagentur draws up a detailed spectrum frequency plan which is then used to assign frequencies to individual operators (TKG 2012, Art. 52 ff.). Furthermore, physical characteristics of spectrum frequencies impose further constraints on their use for broadband provision. Due to this, measures in the field of spectrum frequencies are dubbed ʻsupporting policyʼ (ʻUnterstützende Frequenzpolitikʼ), meaning that they will be used in order to close the gaps in the provision of broadband in rural areas and in order to improve mobile use of ICT (BMWi, 2012).
Arguably, the relevance of radio spectrum for high data rate transmission has become apparent with the development of the Universal Mobile Telecommunications System (UMTS) standard and its commercial deployment. In contrast to the second-generation standard (Global System for Mobile Telecommunications, GSM), in addition to voice UMTS would allow transmission of data and video at a much higher rate of up to 2 Mbit/s, with all participants constantly sending data packets on the same frequency band. This led both operators and policy-makers to believe that in the near future UMTS would replace not only GSM but also parts of the landlines used for Internet provision (Petzel, Reference Petzel2006). These and other factors played a decisive role in the auction for UMTS licences in summer 2000, total proceeds of which were an exceptionally high sum of about EUR 50 billion paid by six winners. The licences included an obligation to deploy an own UMTS network by 2003 and to reach a theoretical supply rate of 25% of population by the end of 2003 and 50% by the end of 2005 (Petzel, Reference Petzel2006). The auction was strongly criticized by its participants, scholars and other observers and the ʻUMTS euphoriaʼ soon died away as the winners struggled – and ultimately failed – to fulfil their licence obligations (Virnich, Reference Virnich2003; Petzel, Reference Petzel2006).
Radio frequency spectrum policy has come to play an increasingly important role again during the third phase of broadband policy development due to the launch of the commercial use of the Long-Term Evolution (LTE) standard. It has been recognised that mobile and wireless solutions in general are instrumental in closing the gaps in the provision of basic broadband to rural and remote areas. Their effective application depends, however, on the availability of spectrum and its efficient use.
In May 2010, promptly following the requirements of the EU law (European Commission, 2010a) and in compliance with the broadband strategy, Germany auctioned the 800 MHz frequencies for mobile operators. Herewith, Germany was the first EU member state to make use of the Digital Dividend. As a result of the auction, in autumn 2010 new licences were issued for more than 11,000 locations to use LTE base stations. The licence conditions obliged the operators to provide mobile broadband in a particular priority order, starting with towns and communities short of infrastructure of less than 5,000 residents (Bundesnetzagentur, 2013a; Goldmedia, 2013).
Germany intends to stay at the forefront of the exploitation of the radio spectrum for broadband development. Thus, in the context of the discussions in the ITU about reallocation of frequencies of 700 MHz spectrum (Digital Dividend II), the federal government launched a discussion process, established a Mobile Media 2020 Forum and developed an ICT strategy in order to identify the demand for frequencies and their possible use (BMWi, 2010; 2012). In this context, in 2013 the Bundesnetzagentur launched public consultations on the basis of the discussion paper on the process of assignment of 700 MHz and 1.5 GHz frequencies as well as the 900 MHz- and 1800 MHz frequencies, of which the rights of use expire in 2016 (Bundesnetzagentur, 2013b). Besides, the regulatory authority drafted scenarios of possible future allocation of these frequencies and started a formal procedure for demand assessment for the time after 2017 (Bundesnetzagentur, 2011; 2012).
8.3. Progress in the broadband market
The broadband market in Germany was initially driven by the existing fixed-network infrastructure. This infrastructure was essentially based on copper and cable access networks. At a later stage the deployment of high-capacity transmission wireless networks enabled the provisioning of ubiquitous wireless access to the Internet. As is explained in this section, the incumbent and alternative operators played a key role in the development of the broadband market.
8.3.1 Background about the incumbent operator
The incumbent operator, Deutsche Telekom, belonged originally to the Deutsche Bundespost, a public institution created in 1947 which was in charge of postal and telecommunications services in the later Federal Republic of Germany. Before that time, the Deutsche Bundespost was called the Reichspost. In 1989 the Deutsche Bundespost was divided into three public companies: Deutsche Bundespost Postdienst for the postal service, Deutsche Bundespost Postbank for the postal banks and Deutsche Bundespost Telekom for the communications service. The Deutsche Bundespost Telekom became the Deutsche Telekom AG in 1995 and was subsequently privatized in 1996. Currently, the German federal government has a direct ownership of 15% of the shares of Deutsche Telekom and owns further 17% indirectly through the Kreditanstalt für Wiederaufbau (KfW) bank.
Traditionally Deutsche Telekom has been the company that invested in telecommunications assets. But, when comparing the investment made in fixed, mobile and cable networks which provide broadband, telephony and video services, the alternative operators combined have invested more than Deutsche Telekom in every year of the period 2002–2013. For the period considered, the alternative operators have contributed 53.7% of the total investment, whereas Deutsche Telekom has provided 46.3% (Dialog Consult-VATM, 2013).
8.3.2 Differences between the new and old Bundesländer
After the reunification of Germany in 1990, the government made important efforts such that the PSTN infrastructure in the new Bundesländer and in the old Bundesländer would become similar. But there are still differences between the regions as regards broadband infrastructure. For low-capacity broadband services, which have a data rate up to 1 Mbit/s and which are available through fixed and wireless networks such as Digital Subscriber Line (xDSL), Wireless Local Area Network (WLAN), LTE, UMTS, cable, Fibre to the X (FttX) and Worldwide Interoperability for Microwave Access (WiMAX), all the Bundesländer had a broadband household coverage of more than 98.5% in 2013 (Breitbandatlas, 2013).
However, for broadband services of more than 50 Mbit/s which can be provided through xDSL, Fttx, cable and WLAN networks, there are differences. In 2013, ten of the old Bundesländer had a household broadband coverage of 50 to 95%, whereas only one old Bundesland had a coverage of 10 to 50%. The five new Bundesländer had a broadband availability of 10 to 50% (Breitbandatlas, 2013).
8.3.3 Fixed broadband market
Fixed broadband penetration
In 2012, the fixed broadband penetration of Germany was 34.2% (see Table 1.3 in Chapter 1 Introduction). In terms of fixed broadband penetration the situation in Germany, as compared to other OECD countries, has changed over time. Until 2006 Germany was behind the average of OECD countries in terms of fixed broadband penetration, but since 2006 the fixed broadband penetration of Germany is better than that of the average of OECD countries (OECD, 2013).
Competition in the fixed broadband market
The predominant network in the fixed broadband market in Germany is the copper wire-based access network. Figure 8.1 depicts the different types of fixed access used for the period 2002–2013. The figure reflects the xDSL, coaxial cable and fibre-based networks. Other types of access networks, such as power-line- and satellite-based networks, were not included due to the limited number of broadband lines deployed.

In 2002 the only type of fixed broadband deployed was through copper lines. In 2013, 80% of broadband lines were based on xDSL. The average annual increase between 2002 and 2009 was 38%. The incumbent operator is the provider of the majority of xDSL lines, including the wholesale lines used by the alternative operators.
In recent years the cable networks have been playing an increasingly important role. For the period 2007–2013 the average annual increase of cable access lines was 35%. With only 0.3 million homes connected with Fibre to the Home/Building (FttH/B) networks, the fibre-based access networks represented only 1% of the broadband lines in 2013.
At the beginning of 2007, the xDSL lines amounted to around 95% of the fixed broadband access lines. There were six major DSL providers in Germany: Deutsche Telekom with 48.2%, United Internet with 14.9%; HanseNet (which later became Telefonica) with 13.3%; Arcor (which later became Vodafone) with 13.1%; Freenet (later 1&1) with 7.4%; and Versatel with 3.2% market share (DSLWEB, 2007).
In 2013, the total number of all types of fixed broadband lines was 28.3 million. Deutsche Telekom had still the majority of broadband access lines with a 43.8% market share, followed by 1&1 with 12.0%, Vodafone with 10.6%, UnityMedia Kabel BW with 8.5%, Telefonica with 8.1% and Kabel Deutschland with 7.1%. EWE Gruppe, Versatel, NetCologne and M-Net had less than 3% market share each (Dialog Consult-VATM, 2013).
Cable operators play an increasingly important role in broadband provisioning: in 2006 only 3.4% of the broadband lines were provided by cable operators, whereas in 2013 this has increased to 18.9% of the lines.
The reuse of the copper lines
Deutsche Telekom owns and operates the majority of xDSL lines. In 2013, Deutsche Telekom provided 54.1% of the DSL lines in retail mode, whereas 7.9% of the lines were sold in resale mode. Another 38% of the xDSL lines were provided on a wholesale basis to be managed by alternative operators. It has to be taken into account that the majority of the lines managed by alternative operators use the unbundled copper lines of Deutsche Telekom.
The transmission capacity of the copper-based access lines has improved over time. The ADSL lines employed in 1999 provided a downlink data rate of 0.7 Mbit/s. The downlink data rate of the xDSL lines in 2002 and 2004 were 1.5 and 3 Mbit/s, respectively. ADSL2+ lines provided a data rate of 16 Mbit/s at the beginning of 2006. Between 2006 and 2012 over 22 million lines were switched to ADSL2+ in more than a thousand cities in Germany. VDSL2 lines deployed since 2006 provide a download speed of up to 50 Mbit/s. As of 2012, 11.6 million households in fifty cities were covered with VDSL2.
Operators in Germany have been considering the possibility of improving the capacity of access lines by using techniques such as vectoring and bonding, which can enable a data rate of 100 Mbit/s for certain segment lengths. To achieve these rates, fibre to the street cabinet (Fibre to the Cabinet, FttC) or to the distribution point (Fibre to the Distribution Point, FttDP) is to be deployed. With these broadband capacities it is possible for xDSL lines to compete on data rates with fibre and cable networks. If operators deploy vectoring and G.fast, which provides up to 1 Gbit/s over 100 m, then the lifespan of copper lines will be extended further. In 2012 Deutsche Telekom announced that it was going to use xDSL lines with vectoring to provide downstream transmission rates of up to 100 Mbit/s, and in the summer of 2013 a regulatory basis was established for this deployment.
The importance of cable networks
The German Bundespost constructed the RTV-cable network at the beginning of the 1980s. This cable network was separated from Deutsche Telekom in 1998 and transferred to Kabel Deutschland GmbH (KDG), which was fully owned by Deutsche Telekom. The network managed by KDG was divided into nine regions in order to prepare it for sale to potential investors. The operator Ish, which was owned by Liberty Global, acquired the cable network in Nordrhein-Westfalen in 2002, whereas iesy, also owned by Liberty Global, acquired the network in Hessen. Kabel BW bought the network in Baden-Württemberg. The other six networks were sold to Kabel Deutschland Gruppe in 2003. The operators ish and iesy merged in 2007 and created the cable operator UnityMedia. Kabel Deutschland operates networks in the other Bundesländer, with the exception of Nordrhein-Westfalen, Hessen and Baden-Württemberg. In 2011 Liberty Global, which owns Unity Media, bought Kabel BW.
Figure 8.1 shows than since 2007 the growth of CATV-based broadband lines exceeds that of PSTN-based access lines. By deploying the Data Over Cable Service Interface Specification (DOCSIS) 3.0, the transmission capacity of cable networks has increased significantly, achieving 100 Mbit/s and more.
In comparison with fibre-based operators, cable network operators are in a better position in terms of coverage. In 2011, around 48% of the households were passed by cable and only 2% by FttH/B networks. In 2013 cable operators had 5.4 million broadband subscribers. The most important cable operators in 2011 were Kabel Deutschland, UnityMedia, Kabel BW, TeleColumbus and Primacom (WIK, 2012). Cable operators provide video, broadband and telephony services. As of 2011, 13.7% of the customers base of the cable operators had a broadband subscription, whereas 72.6% had only a TV subscription (Dialog Consult-VATM, 2011).
Limited FttH/B roll-out
In Germany, there is little deployment of FttH/B networks. As of 2012 there were 0.8 million households passed and 0.3 million households connected to FttH/B networks (Dialog Consult-VATM, 2012). Plausible reasons for this lack of massive FttH/B deployment are: the competition from cable operators, the volume of investment needed to deploy the passive infrastructure of fibre-based networks, the current massive use of copper-based xDSL lines and the possibility of upgrading them for continued use into the future.
So far Deutsche Telekom has not made a massive investment in FttH/B networks. Deutsche Telekom makes investments in FttH/B networks where it sees a clear positive business case. For example, it has deployed fibre-based networks to connect apartment buildings or in urban areas where there is a significant number of potential subscribers that are likely to sign a contract with the incumbent operator. Many of the current FttH/B networks deployed in Germany have been built by city carriers and municipal public utilities companies (Stadtwerke). In several cases, these companies already owned the passive infrastructure and they needed only to deploy the fibre, which meant a strong reduction of the total cost.
8.3.4 Mobile broadband market
Mobile operators
In January 2013 there were 33.6 million subscribers, which had access to mobile broadband networks. This represents a penetration of 41.1%. Since 2008 the number of mobile broadband subscribers – initially only through UMTS and later through LTE networks – has grown steadily over the years: in 2008 it was 13.6 million; in 2009 it was 19.0; in 2010 it was 21.2; in 2011 it was 28.6; and by January 2013 it had reached 33.6 million (Bundesnetzagentur, 2013c).
The operators that own physical infrastructure to provide wireless services in Germany are Telekom Deutschland (which belongs to the Deutsche Telekom group), Vodafone, E-Plus and Telefónica O2. As of 2013, the total number of SIM cards activated, which are used to provide telephony and broadband services, was 114.1 million. Telekom Deutschland, Vodafone, E-Plus and Telefónica O2 had market shares of 32.9%, 28.0%, 22.0% and 17.1%, respectively, measured on the basis of the SIM cards provided (Dialog Consult-VATM, 2013).
Evolution of wireless networks
A succession of wireless broadband networks has been introduced in the German market over the last years. The first wireless broadband networks were based on GPRS (General Packet Radio Service) and HSCSD (High Speed Circuit Switched Data), which were denoted as 2.5G (Generation) networks. In theory it was possible to achieve 115 kbit/s with GPRS and 57.6 kbit/s using HSCSD.
It took some time to deploy 3G UMTS networks after the auction of the licenses for the spectrum was concluded. The auction took place in 2000, while Vodafone was the first mobile operator to start using this network in 2004. One of the reasons for this delay was the lack of appropriate mobile handsets. With UMTS it became possible, in theory, to achieve 384 kbit/s for downstream transmission.
In 2006 the UMTS-based system High Speed Packet Access (HSPA) was able to provide, in theory, downstream and upstream data rate of 1.8 Mbit/s and 384 kbit/s, respectively. In 2007 the High Speed Downlink Packet Access (HSDPA) and High Speed Uplink Packet Access (HSUPA) networks were able to provide downlink rates of up to 7.2 Mbit/s and 3.6 Mbit/s, respectively. HSPA+ networks, denoted as HSPA Evolution, are able to provide up to 28 Mbit/s on the downlink and 11 Mbit/s on the uplink. HSPA+ networks are also called 3.5G networks.
The first broadband services based on the 4G LTE network were announced by Vodafone and Telekom Deutschland for a few villages and communities in Germany at the end of 2010. Telekom Deutschland, Vodafone and Telefonica O2 started providing services using the LTE networks in rural areas first, as was agreed in the conditions for the auction of the spectrum. In theory, the downstream transmission capacity could be up to 100 Mbit/s. In practice, with very good transmission conditions and a very reduced number of users generating traffic in the same cell, it is possible to reach around 50 Mbit/s. An improvement of LTE is LTE-Advanced which, again in theory and under optimal conditions, could provide up to 1 Gbit/s on the downlink; in practice carrier aggregation could provide up to 225 Mbit/s. First small-scale tests were reported by Vodafone and Telefonica in November 2013.
8.3.5 Fixed versus mobile broadband
As a result of the deployment of the 3G and 4G LTE wireless networks, and the increasing use of smartphones, the usage of mobile broadband services has grown. As an illustration, Table 8.1 shows the development of the monthly volume of data on fixed and mobile access lines and the corresponding percentage of increase. While the volume of data transmitted through the fixed networks is much higher than that transmitted using the mobile network (15 GB vs. 261 MB in 2013), the growth in mobile data use is much higher.
Table 8.1: Monthly volume of data per user and annual increase, Germany, 2008–2013

It remains to be seen to what degree the deployment of LTE networks, which provide higher data rates, will continue motivating users to replace their fixed broadband access lines with mobile broadband access.
8.4 Realizing the Digital Agenda targets
The objectives of the German broadband strategy were set in anticipation of the European strategy for smart, sustainable and inclusive growth, known as Europe 2020, and at first glance appear to be far more ambitious. However, they do not correspond fully with the benchmarks of the Digital Agenda as they address the supply side exclusively. The EU Flagship Initiative ʻA Digital Agenda for Europeʼ aims at broadband access for all citizens by 2013, access for all to 30 Mbit/s or above by 2020, with 50% or more of European households subscribing to Internet connections above 100 Mbit/s (European Commission, 2010b). By contrast, the German broadband strategy envisages ubiquitous coverage with 1 Mbit/s broadband by the end of 2010 and 50 Mbit/s broadband access to 75% of all households by 2014. In 2012, due to the progress of implementation, these objectives were adjusted to include a universal availability of 50 Mbit/s by 2018.
As of mid-2013, 58.4% of all the households in Germany had the possibility of gaining access to a fixed or wireless broadband network with a minimum capacity of 50 Mbit/s, 77.2% to a capacity of 16 Mbit/s and 99.8% to 1 Mbit/s. Regarding access through fixed broadband networks, 58.2%, 85.7% and 95.5% of households were passed by networks with a minimum capacity of 50 Mbit/s, 16 Mbit/s and 1 Mbit/s, respectively (Breitbandatlas, 2013). In 2012 Next Generation Access networks that support a downstream capacity of at least 30 Mbit/s covered 66.2% of households (European Commission, 2013). In January 2013, the fixed broadband penetration rate was 34.2%. The penetration rate of high-speed connections of at least 30 Mbit/s was 12%, whereas the penetration rate of very fast connections of at least 100 Mbit/s was 1.2% (European Commission, 2013).
With regard to mobile networks, in 2012 access to HSPA 3G networks was available to 90.4% of the population, whereas 4G LTE networks were available to 51.7%. As of mid-2013, the broadband wireless networks with capacities of 16 Mbit/s, 6 Mbit/s and 1 Mbit/s were available to 4.6%, 48.9% and 95.8% of the households, respectively (Breitbandatlas, 2013). The broadband mobile penetration rate was 41.1% as of January 2013 (European Commission, 2013).
8.5 Case analysis
8.5.1 Operators
The fixed broadband market is characterized by an extensive use of xDSL lines, dominated by the incumbent operator Deutsche Telekom. Alternative operators have been relying on the regulated unbundled lines of Deutsche Telekom for competition. Infrastructure-based competition is provided by cable operators who own their own access networks. By using DOCSIS 3.0 cable operators are able to provide a high-speed broadband service and they have been able to realize the highest growth rate in fixed broadband lines in recent years.
In the wireless broadband market four operators own physical wireless access infrastructure and the competition between them is quite strong.
8.5.2 Main features of policy developments
Cooperation between the federal, regional and local levels of government has proven to be the central element of the policy measures aimed at broadband development in Germany. Coordinated efforts were first made to boost the demand side in the early years of broadband deployment, while the supply side was expected to be driven more or less by market forces alone, once the competition had been introduced and some general anti-competitive regulatory safeguards related to the market power of the incumbent had been adopted. However, over recent years governmental efforts have become increasingly concentrated on support of the supply side and range from incentive measures to promote and facilitate investment (risk and infrastructure sharing, consideration of investment for price-setting measures, etc.) to the provision of financial support in various forms. Market failures in rural areas have required an even more direct public involvement in the form of infrastructure and services provision by Stadtwerke (communal enterprises) and laying of empty ducts by municipalities for their subsequent rental to the broadband providers. At the same time, demand-promoting measures have retreated to the background, so that currently German policy can be called a bit one-sided.
These developments indicate a possible (re)turn of German telecommunications policy towards industrialism, at least with regards to fixed broadband development.
Throughout most of the period considered, Germany has been a close follower of the policies developed by the European Commission in Brussels. However, realizing the growing importance of broadband for Germany’s competitiveness and its status as a European and global economic power has resulted in attempts to anticipate – and even determine to a degree – the EU’s information society policies and broadband policy in particular. For instance, Germany was hard on the Commission’s heels auctioning the first Digital Dividend and nowadays it is preparing most thoroughly for the second round.
Against this background, one should consider the fast growing importance of the radio spectrum policy as part of the broadband developments during recent years. So far, the policy measures in this field are very different from the measures for the promotion of fixed broadband: the federal government is mostly concerned with the provision of the scarce resource of radio frequencies.
8.5.3 Expectations based on theory
Taking the theory of the ladder of investment as a way to analyse the level of competition achieved by the different operators in the fixed network market, the following points can be observed:
Alternative operators have not had the motivation to deploy their own fixed broadband access infrastructure. The conditions to use the copper lines of the incumbent operator were quite clear and attractive, and hence they have been using the local loop of Deutsche Telekom to provide broadband services. This has brought competition to the services market.
Introduction of new broadband technologies (vectoring), extending the life of copper wire is likely to cement this situation and further postpone the emergence of infrastructure-based competition from alternative operators.
Cable operators are using the access networks that were initially deployed to provide TV services. By employing DOCSIS 3.0, they are able to provide a high-speed broadband access service. Cable networks are not regulated: that is, they are not subject to any access or price regulation. Increasing infrastructure-based competition has been the result.
There is limited deployment of FttH/B networks. Neither the incumbent operator nor the alternative operators have identified an attractive business case to make the necessary investment in large-scale roll-out of fibre-based networks.
8.5.4 Lessons learned
The following lessons can be derived from the case analysis made:
– Our analysis shows that even though German telecommunications policy and regulation are technologically neutral, they impact the deployment of xDSL-, cable- and fibre-based networks in different ways. While policy measures seem to respond beneficially to the needs of xDSL and cable providers, fibre providers – both the incumbent and alternative operators – lack motivation and resources to roll out infrastructure.
– The policy and legal framework has failed to provide sufficient measures for alternative operators to enter into infrastructure-based competition with the incumbent. However, the latest (2012) amendments to the German Telecommunications Law are intended to address this issue; their full effect is yet to be seen.
– Setting high data rate targets as part of the broadband strategy – i.e., pushing beyond the capabilities of xDSL networks – could be instrumental in promotion of fibre and cable development. However, the recent development in vectoring and bonding technologies will extend the life of the copper lines. It may move the alternative operators down the ‘ladder of investment’, as unbundling becomes more complicated and potentially less attractive, driving alternative operators to procure bitstream-like access instead. With this development, effective infrastructure-based competition becomes more unlikely in the near future.
– With about half of all households being covered by cable networks, infrastructure-based competition nevertheless is likely to grow as users demand increasingly higher data rates.
– The market strength of the incumbent operator remains significant and, thus, justifies continued asymmetrical regulation.
– Mobile broadband networks play an increasingly important role due to the higher data rates they can provide, but at the moment they are predominantly used to ensure basic broadband coverage (1 Mbit/s) and to close the gaps in fixed broadband provision. Fixed access networks continue to provide much higher data rates. Moreover, mobile networks are becoming increasingly dependent on fibre-based fixed backhaul networks.
8.6 Conclusions
In this chapter we have analysed the development of the broadband market in Germany and the results in terms of broadband penetration and competition that have been achieved so far.
The results show that in the fixed broadband market alternative operators have been competing strongly with the incumbent operator by using the regulated copper-based access network of Deutsche Telekom. On the other hand, cable operators have upgraded their networks with DOCSIS 3.0 and have been using their networks to compete head-on with other fixed broadband operators. In the wireless broadband market there are four different operators who are competing intensely to serve end-users.
Policy and regulatory measures have played central roles in these developments, enabling and facilitating access to infrastructure and resources and promoting an investment-friendly climate. However, one-sided incentives and demand-stimulating measures seem to encounter their limits as the market does not react to them according to expectations, especially in failing to supply high-speed broadband to the rural areas. The government is becoming more intensively involved in the supply-side, de-emphasizing demand-oriented activities. Implications of this policy shift may be felt more strongly in the near future, when the announced objectives beyond the basic broadband coverage are to be realized.
Technology is another important driver of the broadband development in Germany as the case of the mobile broadband suggests. Commercial use of the LTE standard combined with the prompt auctioning of the required radio spectrum has allowed the closing of the gaps in basic broadband provision and achievement of ubiquitous coverage. Further technological developments in this area are likely to enhance the significance of mobile and wireless broadband beyond the subsistence provision, and current radio spectrum policy consultations are providing the pathway for its deployment.
References
9 United Kingdom
9.1 Introduction to the case study
Like other OECD1 and EU countries, the UK now has a mature broadband market with penetration above 80% of households2. This places the UK ninth in the OECD and sixth in the EU league tables of broadband adoption. Today, the average headline access data rate is around 9.4 Mbit/s, however, the two principal network operators, BT and Virgin Media, have upgraded their networks to offer access data rates of up to 100 Mbit/s in the more densely populated areas of the country. The UK government had the objective of all households having access to at least 2 Mbit/s by 2012, which might be considered unambitious.
Where the UK differs from other countries is that it was the first country to adopt ʻequivalence of inputʼ (EOI) and ʻfunctional separationʼ of the incumbent operator, BT, to enhance competition in the broadband market. The functional separation of BT came about as a result of a set of Undertakings3 signed between BT and the regulator, Ofcom, in 2005, following the Telecoms Strategic Review (TSR). The purpose of EOI and functional separation was to deter BT, which was the dominant provider of unbundled local loops and wholesale broadband access, from discriminating against its retail competitors. At the time of the TSR discrimination, in particular non-price discrimination, was considered a major roadblock to the development of a dynamic broadband market. Such behaviour by the dominant firm may be hard to detect by entrants and regulators, and it may have been the expectation, rather than the experience, of discrimination that concerned rival operators. Nevertheless, Ofcom stated in its second TSR document that competing operators who rely on BT for access ʻhave experienced twenty years of:
Slow product development;
Inferior quality wholesale products;
Poor transactional process; and
A general lack of transparency.ʼ4
Since the adoption of the Undertakings in the UK, other countries, notably Sweden, New Zealand and Australia, have also adopted versions of functional separation, while Italy introduced a form of functional separation in 2002 (see Chapter 10). In 2009 the European Union adopted a revised Framework Directive in which functional separation was included as an exceptional remedy that national regulatory authorities (NRAs) could impose on firms with significant market power (SMP) if all other remedies had not corrected competition problems5.
This case study, therefore, concentrates on Ofcom’s Telecoms Strategic Review and the resulting Undertakings. Section 9.2 describes the state of the broadband market prior to the adoption of the Undertakings in 2005. Section 9.3 examines the TSR, setting out the background to the review; summarising the responses from some of the players in the market; and finally describing the key remedies of equivalence of input (EOI) and ʻfunctional separationʼ defined in the Undertakings. Section 9.4 describes the market today and shows how both the retail and wholesale broadband markets have evolved since the Undertakings. Section 9.5 presents the case conclusions.
9.2 The broadband market before 2005
Broadband was first made commercially available in the United Kingdom in April 1999 by the two cable operators, NTL and Telewest6, although BT did not launch a commercial DSL service until July 2000. BT was relatively late in launching commercial DSL compared with its counterparts in other European countries.
By the first quarter of 2005 (just before the implementation of the Undertakings), penetration had reached 7.25 million lines, 31% of households. The rate of growth was beginning to accelerate, as can be seen in Figure 9.1.

Figure 9.1 Broadband penetration, UK, 2002–2005
Table 9.1 shows the launch date of cable and DSL in the five largest EU member states together with the penetration level by June 2005, by which time the UK had the second-highest level of penetration in this group of countries.
Table 9.1 Broadband launch dates and penetration, UK

At the time, the market was dominated by ISPs who resold BT’s bitstream products. These firms accounted for 46% of all broadband customers. BT and the two cable companies had 1.8 million and 2.1 million customers respectively. The share of the market taken by LLU was very small: just 39,500 customers. The average data rate of broadband access was a little over 1 Mbit/s7.
At the retail level, the market was relatively competitive. No firm had a market share greater than around 24%, which compared well with countries such as France and Germany, where France Telecom and Deutsche Telekom had retail market shares closer to 50%. However, at the wholesale level there was a very different picture. As most retailers relied on BT’s infrastructure to provide services, BT had a wholesale market share of around 70%.
Although the retail market was competitive, the overwhelming reliance of competitors on bitstream products for access meant that they had little if any opportunity to differentiate their products from BT’s. In essence BT set all the parameters of service quality from access data rate to repair times and there was no ability for its rivals to provide a higher quality services. Therefore, BT’s competitors could only compete by charging a lower price, and so needed to have lower retail costs.
Further, BT’s dominant position in the wholesale market and its presence in the retail market led to the potential to discriminate against its downstream rivals, although no such discrimination was ever proven. Discrimination can take either price or non-price forms. Price discrimination refers to the charging of a different price for an essential input to internal and external customers, without any cost-based justification. External customers are usually charged the higher price and so are unable to compete with the vertically integrated firm. Non-price discrimination refers to providing lower quality of service to external customers compared with the integrated firm’s own retail business. Longer installation times, longer repair times and slower product development are all examples of non-price discrimination. This behaviour is designed to advantage the integrated firm and harm its rivals8.
Starting in April 2003, Ofcom’s predecessor, Oftel, conducted an ex ante review of the wholesale broadband access (WBA) market. This review, conducted under the Communications Act 2003, which implemented the European Union’s Common Regulatory Framework (CRF)9, found BT to have significant market power (SMP) in the WBA market and Oftel therefore imposed a number of ex ante obligations on BT in the relevant market. The obligations that a national regulatory authority (NRA) may impose on firms with SMP on the relevant market are set out in Articles 9–15 of the Access Directive (AD).
Two obligations imposed on BT by Oftel are particularly important for the purposes of this case study. First, BT was under an obligation of ʻNo undue discriminationʼ. How the Communications Act 2003 and Oftel interpreted this obligation is central to understanding the actions that Ofcom took as a result of the TSR.
Article 10AD describes the obligation of non-discrimination and consists of two paragraphs:
1. A national regulatory authority may, in accordance with the provisions of Article 8, impose obligations of non-discrimination, in relation to interconnection and/or access.
2. Obligations of non-discrimination shall ensure, in particular, that the [SMP] operator applies equivalent conditions in equivalent circumstances to other undertakings providing equivalent services, and provides services and information to others under the same conditions and of the same quality as it provides for its own services, or those of its subsidiaries or partners.
The CRF was transposed into UK law by the Communications Act 2003, which entered into force on July 23rd 2003. The non-discrimination obligation is set out in Section 87(6)(a) which allows the regulator to impose ʻa condition requiring the dominant provider not to discriminate unduly against particular persons, or against a particular description of persons, in relation to matters connected with network access to the relevant network or with the availability of the relevant facilities.ʼ
In neither the EU Directive nor the UK law is discrimination banned outright. Article 10AD requires only that the operator ʻapplies equivalent conditions in equivalent circumstancesʼ whilst UK law proscribes the dominant provider from ʻunduly discriminatingʼ.
In a document discussing how it intended to impose access obligations under the new regulations, the then-regulator, Oftel, gave guidance as to its interpretation of non-discrimination.10 Perhaps the most significant section is 3.8, which reads:
Non-discrimination’ does not necessarily mean that there should be no differences in treatment between undertakings, rather that any differences should be objectively justifiable, for example by:
a) differences in underlying costs, or
b) no material adverse effect of competition.
In section 3.11 Oftel says that it would find differences in underlying costs to be a valid justification for making different products available on different terms to different parties.
The implication of the above is that BT could legitimately treat external customers differently from its own downstream business if such different treatment was objectively justifiable. Such a difference in treatment would not technically be discriminatory, although it may feel that way to a competing operator.
In 2005 Ofcom, which replaced Oftel as the regulator in 2004, set out guidelines for how it would investigate potential cases of discrimination on competition grounds11. It described undue discrimination as ʻwhen an SMP provider does not reflect relevant differences between (or does not reflect relevant similarities in) the circumstances of customers in the transaction conditions it offers, and where such behaviour could harm competitionʼ (page 7). Ofcom then provides the example of the SMP operator providing different levels of reliability to customers in similar circumstances at the same price ʻand this was capable of harming competition between the two customersʼ. ʻCustomersʼ here includes the downstream division of the vertically integrated SMP provider that competes with an external customer.
Material harm to competition is therefore a critical element of the meaning of discrimination as defined in UK law.
Although BT was never found to have behaved in such a manner, nevertheless and as we shall discuss later, the problem of discrimination became central to Ofcom’s Telecoms Strategic Review and led directly to the obligation in the Undertakings of ʻequivalence of inputʼ.
The second relevant obligation imposed on BT was accounting separation, which is described in Article 11 AD:
A national regulatory authority may, in accordance with the provisions of Article 8, impose obligations for accounting separation in relation to specified activities related to interconnection and/or access.
In particular, a national regulatory authority may require a vertically integrated company to make transparent its wholesale prices and its internal transfer prices inter alia to ensure compliance where there is a requirement for non-discrimination under Article 10 or, where necessary, to prevent unfair cross-subsidy.
The need for accounting separation was described by the Director General of Oftel in his 2003 consultation on financial reporting in which he states:
Financial reporting is an essential part of regulation. As an economic regulator, the Director frequently requires high quality financial information from regulated companies. This is because certain obligations placed on regulated companies require rigorous and effective monitoring in order to ensure compliance and, in the case of non-compliance, allow the Director to take appropriate action.12
One of the specific reasons given for the need for cost accounting is that the SMP operator can demonstrate its compliance with the non-discrimination obligation (para. 2.3). This view is supported by the European Regulators Group (ERG):
Accounting separation should ensure that a vertically integrated company makes transparent its wholesale prices and its internal transfer prices especially where there is a requirement for non-discrimination.13
The ERG makes it clear that the accounting separation obligation exists to counter price discrimination, where an SMP operator charges a higher price externally than it does internally. It is also an instrument to make transparent any inappropriate cross-subsidy, for example between a product subject to competition and a monopoly product allowing the dominant firm to appear to be reducing its costs, and therefore prices, in competitive markets whilst raising them in monopoly markets. Cave and Martin describe the central benefit of accounting separation:
Separate accounting with identical interconnection and internal transfer prices provides the regulator ex post with information about the profitability of wholesale services, and enables him or her to detect abuse of monopoly power in the bottleneck facility by observing and comparing rates of return earned on ‘wholesale’ and ‘retail’ activity.14
Accounting separation has three problems. First, if an upstream monopolist faces different costs to serve its internal and external customers then it may legitimately charge different prices. Secondly, the regulated firm has an incentive to assign costs strategically by over-allocating costs to monopoly parts of the business and reducing costs in the competitive areas. Finally, accounting separation provides no transparency for non-price discrimination. The upstream monopolist still has the incentive to harm its rivals and detection is still difficult.
It is this third problem which was of most concern to competitive operators, and eventually to Ofcom. Whilst accounting separation could make transparent, and therefore deter, price discrimination, it was of no use in preventing non-price discrimination.
9.3 The Telecoms Strategic Review
9.3.1 The market before the review
The UK first introduced competition in the telecoms market in 1984 with the licensing of Mercury Communications as the sole competitor to BT in domestic markets. In return Mercury entered into commitments to develop a domestic trunk network, but relied on BT for local access, except in some business districts. It used the Cable & Wireless international network for overseas calls. In 1985, Oftel determined interconnection prices between the two firms that were initially favourable to Mercury, as a method of supporting entry.
In 1991, following the UK government’s review of the duopoly, this period of ʻmanaged competitionʼʼ drew to an end as other firms were permitted to enter the market. The end of the duopoly allowed cable companies, until then permitted to offer telephony only in partnership with Mercury or BT, to enter the market providing infrastructure-based competition to BT, which was Oftel’s preferred form of competition.
A further policy designed to support infrastructure competition was differential access prices for service-based and infrastructure-based competitors. The former had to buy inputs from BT at discounted retail prices, whilst the latter could buy at lower wholesale rates that were the same as BT charged internally15.
By the time of the review, the UK telecoms market was more competitive than most other markets at the retail level. BT had a market share of around 25% in the retail broadband market, 82% of exchange lines and 60% of fixed traffic16. BT’s strength in the calls market came from ʻother callsʼ (including calls to free dial-up internet access), which accounted for 47% of all minutes and in which BT had a 70% market share. By contrast, BT had only a 34% share of international call minutes, although such calls were only a small part of the market (just 2.3%).
9.3.2 The review
As early as 2002 some players in the telecoms market began to lobby for a strategic review of telecoms regulation and the break-up of BT17. Those who argued for a review believed that the market was being held back by the vertically integrated nature of BT and that separation would increase dynamic competition in retail markets. They argued that investment by competitors was being held back because they expected BT to use its integrated structure to sabotage any product development by rivals, thus preventing investors from earning a reasonable return on any investment. It was not necessary for BT actually to have harmed its rivals for them to change their behaviour; all that was required was an expectation of discrimination to deter investment. Although there is little hard evidence to support the claim that investment was being held back, the very low uptake of LLU can be seen as backing up the claim. In July 2004, there were just 13,000 LLU lines out of a total of 4.4 million broadband access lines.
Ofcom launched the TSR in April 2004 with a first phase consultation document18 in which it set out the purpose of the TSR as to:
assess the options for enhancing value and choice in the UK telecommunications sector. It will have a particular focus on assessing the prospects for maintaining and developing effective competition in the UK telecoms markets, while also considering investment and innovation
Ofcom set out its analysis of the sector looking both at the level of competition at the time and towards the future with an analysis of technology trends. Stakeholders were asked ʻfive fundamental questionsʼ and sixteen more detailed questions. The five fundamental questions were:
In relation to the interests of citizen-consumers, what are the key attributes of a well-functioning telecoms market?
Where can effective and sustainable competition be achieved in the UK telecoms market?
Is there scope for a significant reduction in regulation, or is the market power of incumbents too entrenched?
How can Ofcom incentivise efficient and timely investment in next generation networks?
At varying times since 1984, the case has been made for structural or operational separation of BT, or the delivery of full functional equivalence. Are these still relevant questions?
In the Phase 1 consultation document, Ofcom found a mixed picture of benefits to UK consumers. It found, for example, that whilst there was plenty of competition in the fixed voice market, most of this was based on service provision and that BT still provided most access infrastructure, despite Oftel’s policy of infrastructure competition. Similarly, BT dominated the broadband access market at wholesale level, although the retail market was competitive19. Ofcom’s overall conclusion, therefore, was that the 20 years of competition prior to the TSR resulted in only partial benefits for UK consumers in both residential and business markets.
Responses were received from over eighty interested parties, including fixed and mobile operators, consumer representative organizations, independent experts and individuals with no affiliation. Although the responses were wide ranging, a central theme to emerge was the problem of discrimination and the ineffectiveness of the legal/regulatory regime to prevent such behaviour. Some operators went further and argued that both Article 10AD and the UK law allowed dominant operators to discriminate by not providing equivalent products in equivalent circumstances.
In its response to the TSR, Cable & Wireless, then the UK’s second-largest fixed line operator and which had absorbed Mercury Communications in 1997, stated:
By far the biggest issue for this review is the problem of discrimination as regulating to prevent discrimination remains the key unsolved problem of regulation. Although there are existing regulatory rules and structures to deal with the problem of discrimination, in practice they have been ineffective in preventing BT from favouring its own operations.
The examples of such discrimination are endless. In the world of broadband, BT was allowed to create an LLU20product which was prohibitively expensive, not industrialised and not fit-for-purpose, which meant that it was entirely unsuitable for mass-market take-up. The result is that there is currently virtually no competition in broadband based on LLU. In the world of narrowband voice, there is a similar story to tell. The basic monopoly access network building blocks to narrowband competition, such as call origination, carrier pre-selection and wholesale line rental have all been made available to BT’s competitors on sub-standard terms, such that the cost base of competitors, and the maximum functionality they can offer to customers, are compromised. Again, the result is that BT has been permitted to retain an artificially high market share in narrowband voice to the detriment of innovation and of end-users.21
Energis, another competitor to BT which has subsequently been acquired by Cable & Wireless, discussed the problem of ʻundue discriminationʼ. It stated:
Oftel’s approach to equivalence (in common with many regulators in telecommunications around the world) took as its starting point a formal requirement for equal treatment (or non-discrimination) and then engaged in a series of compromises based on equivalence of outcome to produce the detail of regulatory decisions.
The essence of this approach can be seen in the debate over the use of the term ‘undue’ discrimination. This approach embedded the concept of ‘due’ discrimination in the regulatory regime, allowing differences between the systems that BT used to supply itself, and competitors, where there were ‘objectively justifiable’ differences. The problem with that approach is that it assumed that Oftel would be effectively empowered to distinguish between ‘due’ and ‘undue’ discrimination. While in many cases this approach seems to have worked, in other markets, that hasn’t been the case.22
Energis was established in 1992 by the national electricity transportation network, National Grid. It used National Grid’s network to develop a fibre-optic trunk network which formed the basis of its offering to business customers. Energis, through its subsidiary PlanetOnline, worked with the electronics retailer Dixons to create Freeserve, an Internet service provider (ISP) providing free dial-up Internet access based on an 0800 number. At its peak in 2000, Energis had a stock market valuation of £10 billion, however in July 2002 it was placed into receivership and was acquired by Cable & Wireless in 2005 for a little under £600 million.
The essence of these responses was that preventing discrimination was not enough when the obligation of ʻno undue discriminationʼ allowed justifiably different treatment by the dominant firm of its own downstream business and that of its competitors and allowed different treatment when there was no material effect on competition.
Cable & Wireless’s example of LLU provides a good example. LLU allows competitive operators to rent the copper local loop that runs between the local exchange and the customer premises. The LLU customer needs to install its own equipment in the local exchange to allow broadband signals to be sent over the local loop. It can then sell that service to consumers. BT, like other incumbent operators in their own countries, does not use LLU to provide broadband access themselves. So BT’s retail division was buying a different product from its competitors23.
There was a similar concern with narrowband or traditional voice access products. The externally supplied product is known as wholesale line rental (WLR) and allows a downstream competitor to rent from BT a local exchange line conditioned for voice services. BT itself did not use WLR to provide voice services at the time of the TSR.
Referring back to the legal definitions of discrimination, BT could well argue that differences between internal and external cost and terms were justified and that therefore they were not discriminating under the definition of ʻundue discriminationʼ.
However, such a defence was unnecessary as no discrimination cases were successfully brought against BT: indeed Ofcom did not find explicit evidence of discrimination during its review. What became clear, however, was that competing communications providers (CPs) lacked confidence in a system that allowed BT to duly discriminate as evidenced by the paragraphs from the Cable & Wireless and Energis responses quoted above. The expectation of different treatment was enough to change the behaviour of downstream competitors.
On 18 November 2004, Ofcom issued its Phase 2 consultation document.24 This reviewed the comments received from the first phase and put forward specific proposals for future regulation of the electronic communications market.
Central to Ofcom’s analysis in Phase 2 was the concept of ʻenduring economic bottlenecksʼ (para. 1.17) which it described as those areas of the network where ʻeffective, infrastructure based competition is unlikely to emerge in the medium termʼ. In possibly the most damning paragraph in the Phase 2 consultation, Ofcom said that competing operators who rely on BT for access ʻhave experienced twenty years of:
Slow product development;
Inferior quality wholesale products;
Poor transactional process; and
A general lack of transparency.ʼ
Ofcom concluded that the ʻno undue discriminationʼ remedy by itself had proved inadequate to address the competition problems caused by economic bottlenecks and that a stronger remedy was needed. It partially laid the blame at the door of its predecessor, Oftel.
Oftel’s approach might be characterized as accepting certain differences of outcome which arise from the existence of asymmetrical inputs for BT’s downstream businesses and those of third parties, provided these were not material or deliberately or perversely created by BT to impede competition. Oftel worked to ensure that wholesale products specifically designed by BT under regulatory pressure were as close to being fit-for-purpose as possible. But clearly this approach has not resolved the continuing problems of lack of equality of access in a number of areas. Firstly, BT faces weak incentives to comply and, as a result, the achievement of fit-for-purpose products which BT itself has no interest in using or selling has required a high degree of regulatory intervention. Secondly, the process permits differences between the treatment of BT’s wholesale customers and its own retail activities which, while relatively insignificant in isolation, constitute significant disadvantages when taken in combination.
In the last sentence of this quote, Ofcom discusses what has been referred to as ʻcumulative materialityʼ. This is the idea that it is possible for there to be many minor differences between an internal and an external wholesale product which, when each difference is taken alone, appear unimportant but which when they have a cumulative impact can result in a significant disadvantage for the external customer.
9.3.3 Equivalence of input
Ofcom’s principal proposal arising from the TSR was to strengthen the non-discrimination remedy by requiring what it termed ʻreal equality of accessʼ which would prevent BT having justifiable reasons for providing different services internally and externally. This would require ʻequivalenceʼ at the product level and clear behavioural changes by BT.
At the product level, Ofcom stated that equality of access implies BT’s wholesale customers should have access to:
the same or a similar set of regulated wholesale products as BT’s own retail activities;
at the same prices as BT’s own retail activities; and
using the same or similar transactional processes as BT’s own retail activities. (para. 1.36)
Ofcom termed these characteristics of equality of access ʻequivalence of inputʼ. One purpose of the proposal was to strengthen the incentives for BT to provide fit-for-purpose wholesale products without intrusive regulation.
Ofcom also stated that it was important that there is equivalence throughout the product development process and product life cycle. It implied that BT’s wholesale customers have the same ability as BT’s retail activities to introduce changes or have problems addressed.
The final stage of the TR was the issuing by Ofcom of a ʻStatementʼ including a set of undertakings by BT in lieu of a reference under the Enterprise Act 200225. Paragraph 2 (Definitions and Interpretation) of Annex A sets out what is meant by Equivalence of Input
ʻEquivalence of Inputsʼ or ʻEOIʼ means that BT provides, in respect of a particular product or service, the same product or service to all Communications Providers (including BT) on the same timescales, terms and conditions (including price and service levels) by means of the same systems and processes, and includes the provision to all Communications Providers (including BT) of the same Commercial Information about such products, services, systems and processes. In particular, it includes the use by BT of such systems and processes in the same way as other Communications Providers and with the same degree of reliability and performance as experienced by other Communications Providers.
Since the signing of the original Undertakings a number of amendments have been introduced and brought together in a consolidated version. In this consolidated version ʻsameʼ is helpfully defined as meaning ʻexactly the sameʼ.
Whereas the non-discrimination requirement left room for some degree of ambiguity, the definition of EOI makes it clear that BT must provide exactly the same products internally and externally under the same conditions, etc.
The list of products to which EOI was applied is set out in paragraph 3.1 of the Undertakings. These are:

These products existed at the time of the TSR and were offered by BT in the wholesale market. Thus it can be argued that they had to be reverse engineered to be offered under EOI terms.
However, the Undertakings also commit BT to providing certain (at the time) future services on an EOI basis (para. 3.1). These are listed as:
a) Wholesale Extension Service Access Product;
b) Wholesale Extension Service Backhaul Product;
c) Wholesale End-to-End Ethernet Service;
d) IP based Bitstream Network Access products that are the successors to IPStream or DataStream; and
e) A successor product to Wholesale Line Rental if:
i) such a product is provided using BT’s NGN, based on Multi-Service Access Node (MSAN) access; and
ii) BT is determined by Ofcom to have SMP in a Network Access market or markets which includes that product.
Looking further to what was in 2005 the future, the Undertakings place certain obligations on BT regarding the provision of next-generation networks (NGN). Section 11 of the Undertakings makes it clear that BT will provide network access to its NGN on an EOI basis.
The Undertakings seek to ensure that BT designs-inequivalence of inputs into future products. Thus whilst there may have been a cost associated in ensuring that ʻoldʼ products were made fit for EOI, new products should not incur the same costs.
Ofcom also introduced the concept of ʻequivalence of outcomeʼ which was a weaker form of equivalence, more akin to non-discrimination, and was applied to products that at the time were expected to become redundant as they were overtaken by new services such as those listed above.
The difference between the ex post remedy of non-discrimination applied ex ante and the design of the specific ex ante remedy is central to an understanding of the Undertakings and their impact on the UK telecommunications market.
EOI was and remains a radical change from the ʻno undue discriminationʼ requirement placed on BT in markets where it has SMP. Under the non-discrimination approach, BT did not have to design-in to existing products and processes the equality of treatment of internal and external customers. Each could use a different product and process and differences between the two could be justified, allowing BT to charge different prices or to impose other non-price terms.
BT, or indeed any other incumbent firm, could legitimately argue that its network was built for use by a single integrated firm and was not designed for access by other networks. It was designed to carry calls from the calling party to the receiving party (end-to-end calling) and not to pick up calls or deliver calls to other (national) networks. Therefore, BT could argue that it faced lower costs to deliver a call end-to-end on its own network than to carry calls to or from an interconnected network. Likewise it could argue that it could provide different order-processing systems internally and externally.
Therefore, under the definition of non-discrimination adopted by Ofcom, its treatment of internal and external customers differently was objectively justifiable and therefore not unduly discriminatory. Nevertheless, industry participants and Ofcom determined that the competition policy principle of non-discrimination was not sufficient to stimulate effective and sustainable competition downstream of the economic bottleneck and so a stronger, specifically ex ante remedy was required to overcome the incentive to discriminate.
That remedy, equivalence of input (EOI), requires equal treatment to be designed into products. BT’s commitment in the Undertakings is to provide the ʻsameʼ product, timescales and information with the same degree of reliability. BT is also expected to respond to requests for new services from wholesale customers using the same process: i.e., it should not distinguish between a request from BT Retail and external customers.
There has been no legal testing of equivalence but it would seem unlikely from the unequivocal wording of the Undertakings that BT could claim external customers were not in an ʻanalogous situationʼ to their internal customers.
Equivalence can therefore be regarded as a specifically ex ante approach to redress incentives for discrimination, whereas the ʻno undue discriminationʼ obligation was an ex post remedy applied ex ante.
9.3.4 Functional separation
In the Undertakings, BT also agreed to a change its organization form and incentives for managers. The new organization form became known as ʻfunctional separationʼ though the term itself is not used in the Undertakings. BT made a significant number of commitments, the three most important and relevant of which were to establish:
a separate Access Services business unit with a separate brand name: One of the first deliverables from BT was the establishment of Openreach, a new business unit separated from the rest of BT with responsibility for providing the majority of the input equivalent wholesale products. Although not explicit within the Undertakings, it was a perceived aim of BT, through establishing Openreach, to develop a different culture which treated all of its customers in an equivalent manner. The introduction of Openreach ensured that there was a ʻcleanʼ interface with all the operators competing in the downstream markets and greater transparency for monitoring compliance with the Undertakings;
a Code of Practice for employees: it was obviously essential that the detailed set of commitments made in the Undertakings was understood clearly by the employees affected and so a simple code of practice was needed, backed up by training and support services for employees;
an Equality of Access Board (EAB): this body provided an independent means to monitor the implementation and administration of the Undertakings, to ensure that BT remains compliant with its commitments. Although it is a body internal to BT, its independence comes from the fact that three of its five directors are required to be independent of BT.
The purpose of these organisational changes was to remove the incentive to discriminate and so to facilitate the implementation of equivalence of input. Openreach managers have a set of incentives that are not connected to the overall performance of BT, but only to the performance of Openreach. In theory at least, this should encourage managers only to consider their own division, rather than the effect of their decisions on the profitability of other divisions or the business overall.
9.3.5 Parallel actions
The signing and implementation of the Undertakings were not the only actions taken by Ofcom to attempt to stimulate the take up of LLU and therefore change the competitive dynamics in the UK market. Two other actions were important: Ofcom’s review of the wholesale local access market (WLAM) and the setting up of the Office of Telecoms Adjudication (OTA).
In May 2004, Ofcom began its market review of the WLAM in line with its obligations under the CRF. The review defined the market on technologically neutral grounds such that both copper local loops and the cable access networks fell in the same market definition. Ofcom found BT to have SMP in the relevant market and so imposed a number of ex anteremedies designed to ensure access to local loops by third parties on fair and reasonable terms.
For the purposes of this case study, the most important obligation placed on BT was that of cost orientation. Condition FA3 of the formal Notification required that BT provide network access for a price that was ʻreasonably derived from the costs of provision based on a forward looking long run incremental cost (LRIC) approach and allowing an appropriate mark up for the recovery of common costs including an appropriate return on capital employed.ʼ
To establish the appropriate cost oriented price, Ofcom also investigated BT’s weighted average cost of capital (WACC) calculating a separate WACC for BT’s low-risk local access network business and the rest of the company, and the value of BT’s copper network. Both these consultations provided Ofcom with evidence that allowed it to reduce the price of both fully- and partly- unbundled local loops.
Table 9.2 shows the development of the price of fully- and partially-unbundled loops from 2002–200926. The data show a sharp decline in the monthly rental average cost of the first year between 2003 and 2005 with some fluctuation of charges since then but at prices between one-half and two-thirds of the 2005 price.
Table 9.2 Cost of LLU, UK, 2002–2009
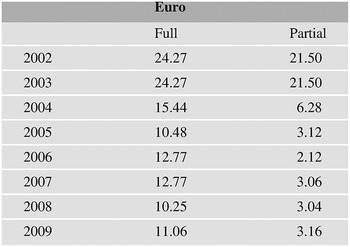
The substantial reduction in the price of unbundled local loops would clearly have a significant impact on the economics of unbundling for competitive operators and may well have been at least as important as the functional separation of BT in encouraging investment by competitors.
The second parallel development was the establishment of the Office of Telecom Adjudicator (OTA) in 2005, now superseded by OTA2. The principal purpose of the OTA was to ensure that the processes for LLU and other ʻcurrent generationʼ access products (for example, wholesale line rental) were industrialised and ʻfit for purposeʼ. It was technically independent of both Ofcom and the industry although its accommodation was provided by Ofcom and its members were representatives of BT and its competitors.
The original OTA was established to ʻfacilitate swift implementation of the processes necessary to enable competitors to gain access to BT’s local loop on an equivalent basis to that enjoyed by BT’s own businesses. The Telecommunications Adjudicator will also be able to bring all parties together to find a prompt mediated resolution of working-level implementation disputes.ʼ
OTA2 has a slightly different objective: ʻOTA2 will facilitate the swift implementation of processes where necessary to enable a wider range of Communications Providers and End Users to benefit from clear and focused improvements, in particular where multi-lateral engagement is necessary.ʼ
The OTA2 website sets out a six point ʻvisionʼ:
the OTA2 will champion end user issues;
Communications Providers will benefit from a competitive telecommunications infrastructure based on Openreach products that has no operational barriers to success;
there will be implementation (as quickly as is reasonably possible) of new product functionality, features and services relating to In-scope Products that will be seamlessly introduced;
migrations between broadband and narrowband products of both BT and other Communications Providers will be seamless, timely and with minimal interruption to service for end users;
dips in operational quality performance of In-scope Products provided by Openreach will be unusual and will be proactively managed by Openreach to ensure the least impact on Communications Providers and end users; and
participation by Communications Providers in the OTA2 Scheme will be widespread and representative.
Although OTA2 mentions end users in its objectives, the scheme participants are all drawn from the supply side of the market with no user representatives. The main scheme participants are the larger communications providers: BT, Openreach, BSkyB, Cable & Wireless, Everything Everywhere, Exponential-e, Global Crossing, O2, Scottish and Southern, TalkTalk Group and Virgin Media. Smaller communications providers are represented through the Federation of Communications Services.
Equivalence of inputs and functional separation, reduced LLU prices and the OTA can be seen as a three-pronged strategy to encourage the development of LLU as the principal wholesale product for broadband access. It may not be possible to separate the effectiveness of any one part of the strategy and of course it may be that the three together were critical to ensure increased adoption of LLU. In the next section of this case study we examine the UK broadband market today, at both the retail and wholesale levels.
9.4 The broadband market today
9.4.1 The retail market
Broadband penetration has increased substantially since July 2005 and now stands at 22.1 million lines or 83.7% of households27. This level of household penetration places the UK ninth in the OECD countries and 6th in the EU, behind Sweden, the Netherlands, Denmark, Finland and Luxembourg. South Korea, Iceland and Norway also have higher levels of household penetration than the UK.
Figure 9.2 below extends Figure 9.1 to cover the period 2002–2013. A comparison of the rate of growth of broadband lines in the UK before and after the Undertakings shows no significant difference: diffusion of broadband continues to show the classic ʻSʼ shaped growth. There appears to be a slowdown in the growth of broadband in the wake of the 2008 financial crisis, with growth resuming in late 2010.

Figure 9.2 Broadband Penetration, UK, 2002–2013
The retail broadband market has also seen substantial consolidation amongst suppliers. The four largest suppliers (BT, Sky, TalkTalk and Virgin Media) now have a combined market share in excess of 90%. At the time of the Undertakings, neither Sky nor TalkTalk was a significant player in the retail market, so both have entered the market on the back of an improved climate for LLU.
Sky’s market growth has been largely organic, benefiting from its strong position in the Pay-TV market to cross sell broadband to its existing customer base. TalkTalk Group, by contrast, has been acquisitive, acquiring the UK customer bases of AOL and Tiscali.
Table 9.3 shows various acquisitions that have taken place in the market over the period 2006–2009.
Table 9.3 Selected ISP mergers, UK, 2006–2013

Ofcom explains the spate of mergers and acquisitions in the sector by the increased need for scale as a result of the increase in the uptake of LLU. For each unbundled exchange, the unit costs fall with each additional subscriber, meaning that scale is important for an ISP operator to be profitable, compared with using wholesale bitstream products from BT.
Whilst consumers’ choice of supplier may have diminished since 2006, consumers have benefited from an increase in the average connection speeds available.
Figure 9.3 shows the average actual broadband data rates for the period 2009–2013, which has grown steadily from 4 Mbit/s in 2009 to over 14 Mbit/s in 2013. Between 2012 and 2013 there was an exceptionally large increase in actual access data rates as more customers signed up to ʻsuperfastʼ broadband products based on fibre to the cabinet or DOCSIS3.

Figure 9.3 Average broadband connection data rates, UK, 2009–2013
This increase in average connection data rates has largely been driven by the upgrade of DSL lines from ADSL to ADSL2+ and by the upgrade of the Virgin Media cable network to DOCSIS3.
Table 9.4 below shows a selection of super-fast broadband implementations and trials as identified by Ofcom in July 2009.
Table 9.4 Selected super-fast broadband implementations and trials, UK, July 2009
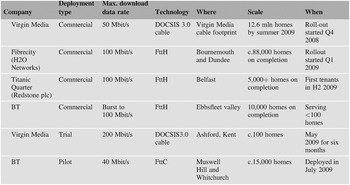
Since July 2009, there have been a number of further announcements, in particular by BT and Virgin Media.
In October 2010, Virgin Media announced plans to upgrade to 100 Mbit/s from December 2010 with the entire network being upgraded by mid-201229. In March 2011, Virgin Media announced that its 100 Mbit/s service had passed one million homes and was on track to meet the 2012 deadline. In November 2013, Virgin Media announced plans to increase the access data rate to over 150 Mbit/s to all of the 12.5 million homes its network passes in 201430.
BT has responded to Virgin Media’s various upgrades, and arguably to political pressure, by launching Fibre to the Home (FttH) and Fibre to the Cabinet (FttC) products, which it retails under the brand ʻInfinityʼ. This fibre based service provides access data rates of up to 40 Mbit/s. Infinity was first trialled in exchanges in London, Cheshire and Glasgow and in January 2014 was available in around 1,900 local exchange areas covering over 75% of UK homes31.
In January 2013, according to the EC Broadband Scorecard, 14.5% of broadband lines provided data rates of 30 Mbit/s up to 99 Mbit/s, while 0.9% provided data rates of 100 Mbit/s or above.
9.4.2 Broadband services
With the growth in the average access data rate has come a change in how the Internet is used. One of the most important applications that demands high bandwidth is ʻcatch-up TVʼ, through services such as BBC i-player, and the equivalent from the other TV channels, which has enjoyed particularly strong growth. In March 2013, there were 272 million requests for TV and radio programmes on BBC i-Player, up from 78 million in 200932. Equivalent data on ITV Player were not available.
BT has also entered the TV market offering IPTV over its FttC/H network. In 2013 BT secured the rights to show Champions League football matches live with a bid of over £800 million putting it squarely in competition with Sky’s and Virgin Media’s TV offerings. In fact, over 2013 there has been a noticeable shift in the locus of competition in broadband markets from Internet access to TV, with products such as ʻSky plusʼ and Virgin Media’s TiVo becoming increasingly popular.
9.4.3 The wholesale market
Whilst there have been many changes in the retail market, it is perhaps the wholesale market that has seen most change since the Undertakings were signed.
In 2006, 2010 and 2013, Ofcom conducted market reviews of the wholesale broadband access (WBA) market . This market lies at the intermediate level between the wholesale local access market (WLAM) and the retail broadband market (RBM). Whereas BT and Virgin Media self-supply the whole broadband value chain, most other ISPs operate only in the WBAM or retail market. LLU operators enter at the WBA level, buying unbundled local loops as their input, while retail ISPs enter at the retail level, buy bitstream access either from BT or an LLU provider that operates in the WBA market, as illustrated in Figure 9.4. It should though be noted that most LLU operators also buy bitstream access from BT in areas where it is uneconomic for them to place their own equipment in exchanges and purchase unbundled loops.

Figure 9.4 Broadband market structure, UK, 2013
Legend: WNIA: Wholesale Network Infrastructure Access (Market 4 in the EC 2007 Recommendation); WBA: Wholesale Broadband Access (Market 5); RBA: Retail Broadband Access (not included in the 2007 Recommendation); VM: Virgin Media (the cable operator).
When Ofcom’s predecessor, Oftel, first reviewed the WBAM in 2003, it was only able to identify one national market33 and Oftel found BT to have SMP in that market. By the time Ofcom reviewed the market again in 2006 and 2010, it found there to be three geographic markets based on the number of LLU operators plus Virgin Media present in exchange area. According to the 2010 market definition the three markets are defined as:
Market 1: exchanges where only BT is present (11.7% of premises);
Market 2: exchanges where two Principal Operators (POs) are present or forecast and exchanges where three POs are present or forecast but where BTs share is greater than or equal to 50 per cent (10.0% of premises); and
Market 3: exchanges where four or more POs are present or forecast and exchanges where three POs are present or forecast but where BTs share is less than 50 per cent (77.6% of premises).
In the final statement Ofcom found BT to have SMP in Markets one and two, but no firm was found to have SMP in Market 3. This means that in exchange areas covering more than three quarters of all premises, BT is no longer dominant. Although the market definitions and size of the markets was somewhat different in the 2006 WBAM review, the finding of SMP was the same.
By 2013, the market had developed yet further and Ofcom found only two markets:
Market A: exchange areas where there are no more than two Principal Operators (POs) present or forecast to be present, which accounts for 9.6% of UK premises.
Market B: exchange areas where there are three or more POs present or forecast to be present, which accounts for 89.7% of UK premises34.
This finding is a major change from the 2003 market review. Ofcom found that effectively competitive markets were operating below the retail level and thus the retail market in some 90% of the UK was not dependent on regulation at the wholesale level, albeit it is dependent on regulation at the LLU level.
This change in the market structure, and thus the finding of SMP, has come about because ISPs have substituted LLU for bitstream or wholesale access. TalkTalk Group now has over 2,700 exchanges enabled, covering some 24 million homes within 5 km from the exchange, 97% of all households. Sky has enabled over 2,300 exchanges covering 23.3 million homes within 5 km35.
Figure 9.5 shows the number of wholesale copper access lines, i.e., those not offered by BT, by type: resale, bitstream and LLU. Resale lines peaked in January 2007 as LLU began to take an increasing share of the market. Until January 2006 almost no customers accessed broadband via LLU, but by January 2008 LLU was the most popular single method of wholesale copper access and by July 2010 two-thirds of wholesale copper access lines were via LLU. In July 2010 some 29% of all retail access lines were via LLU, whilst bitstream and resale combined reached around 22%.

Figure 9.5 Wholesale copper access methods, UK, 2002–2009
Over the same period, cable’s share of the market has declined from 59% to 20%. In part, this decline is due to BT extending its broadband availability to around 99% of homes whilst cable still only reaches about 55% of homes: BT’s larger physical reach ensures that twisted copper wire has been able to gain a larger market share.
What we have seen in the UK therefore is a dramatic change in the nature of competition from one based on a mix of cable and the reselling of BT’s bitstream products, to one where LLU has a significant and growing market share with unbundled loops largely replacing bitstream.
This change in the wholesale market is important as LLU allows ISPs considerably more control over their own products. Whilst care should always be taken over simple correlations, especially over time, Figure 9.6 shows a strong correlation between LLU as a share of all competitive copper access lines and the weighted average access data rate enjoyed by users. However, it should be noted that the greatest percentage increase in access data rates happen when LLU had only a very low market share (less than 10%).
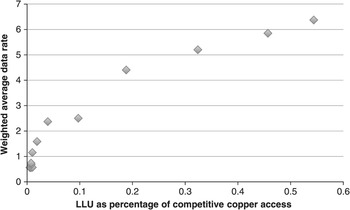
9.6 Relationship between LLU and average access data rate, UK, 2002–2008
9.5 Conclusions
During the decade 2000–2010, the UK broadband market has experienced substantial changes. Cable broadband was launched in 1999 and a DSL version with a wholesale variant was not available until 2000. The few customers who took up broadband could only get access data rates of 512 kbit/s. Today, over 80% of households have a fixed broadband connection and the market is still growing, although the rate of growth has slowed. Access data rates of up to 100 Mbit/s are available to all households passed by the Virgin Media network and rates of at least 40 Mbit/s to around 85% of households passed by the BT FttH/C network.
Until 2005 the broadband market was relatively undynamic: other than Virgin Media, BT’s rivals relied on BT’s wholesale bitstream products which meant that they could not differentiate the service quality they offered customers. Local loop unbundling (LLU) had hardly been taken up in 2005, with just a few tens of thousands of lines unbundled. However, access via bitstream meant that barriers to entry were low and so the retail market was fragmented compared with many other countries which had a retail market dominated by the incumbent operator.
The market today is very different. LLU is now prevalent throughout the country and the level of competition in the WBA market is such that Ofcom has been able to find exchange areas covering some 90% of the population free from a firm with significant market power. This change has largely come about because Ofcom forced through three key regulatory changes in 2005: EOI and the functional separation of BT; reduced LLU prices and the creation of the OTA with a brief to make LLU work.
Since that time we can see a ʻvirtuous circleʼ evolving as LLU-based ISPs installed more advanced DSLAMs, based on ADSL2+ and ADSL Max, allowing them to offer access data rates of up to 24 Mbit/s. Both BT and Virgin Media have responded to this competitive pressure by investing in FttC/H and DOCSIS3.0 respectively, allowing them to offer ʻsuper-fastʼ broadband. As higher data access rates have become available, Internet usage has changed to take advantage of this higher bandwidth, with catch-up TV being a particularly popular application.
The rate of diffusion of broadband amongst UK consumers appears to have been hardly affected by the regulatory changes of 2005. However, there have been a number of fundamental changes in the structure of the market and the quality of services available to consumers since 2005.
The regulatory reforms introduced by Ofcom in 2005 can be said to mark the watershed between the relatively undynamic early days of broadband and the more dynamic second half of the decade. What cannot be concluded with any degree of certainty is the effect any individual reform had or whether it was the package of the three reforms together that helped change the market. The much-heralded reform of EOI and functional separation may have been necessary but there is insufficient evidence to know whether it would have been sufficient in the absence of lower prices and the OTA. What can be concluded with certainty, however, is that UK consumers today enjoy the advantages of a highly competitive market, much higher data access rates and a lower price per Mbit/s than their predecessors did in 2000 or indeed 2005.
1 Organisation for Economic Co-operation and Development (OECD).
2 Source: Ofcom, ‘Telecommunications Market Data Update, Q2 2013.
3 Ofcom Final statements on the Strategic Review of Telecommunications, and undertakings in lieu of a reference under the Enterprise Act 2002, 22 September 2005.
4 Ofcom Strategic Review of Telecommunications: Phase 2 Consultation Document, (para. 1.19).
5 Directive 2002/19/EC of the European Parliament and of the Council of 7 March 2002 on access to, and interconnection of, electronic communications networks and associated facilities (Access Directive) as amended by Directive 2009/140/EC, Article 13a.
6 These two companies have since merged to form Virgin Media.
7 Source: Ofcom, author’s calculation.
8 There has been substantial academic analysis on the incentives of vertically integrated firms with upstream market to harm their rivals in downstream markets. For a good discussion in the context of the UK telecoms sector, see , and (2006), Regulating for non-price discrimination: The case of UK fixed telecoms, in Competition and Regulation in Network Industries 2006 (3).
9 The CRF is a set of five Directives designed to establish a consistent regulatory process across the EU based on the principles of competition law, although with market investigations, or ʻreviewsʼ conducted ex ante.
10 Oftel (2002) Imposing Access Obligations under the new EU Directives,sections 3.4–3.11.
11 (2005) Undue discrimination by SMP providers: How Ofcom will investigate potential contraventions on competition grounds of Requirements not to unduly discriminate imposed on SMP providers.
12 (2003) Financial Reporting Obligations in SMP Markets: A consultation on accounting separation and cost accounting, para. 2.1.
13 (2003) ERG Common Position on the approach to Appropriate remedies in the new regulatory framework, page 49.
14 M. Cave and I. Martin (1994), The costs and benefits of accounting separation Telecommunications Policy 18 (1), 12–20.
15 For a more detailed analysis of competition before the TSR, see and (1996) Entry, Competition and Regulation in UK Telecommunications, Oxford Review of Economic Policy,12 (4), 100–121.
16 Source: Ofcom Telecoms Market Data Tables, Q2 2005.
17 Notably Cable & Wireless, for whom the author worked as a consultant on a project related to the separation of BT.
18 (2004) Strategic Review of Telecommunications: Phase 1 Consultation Document.
19 Ibid, page 22.
20 Local Loop Unbundling.
21 Cable & Wireless Response to the Ofcom ʻStrategic Review of Telecommunications Phase 1 consultation documentʼ.
22 Energis Response to the Ofcom ʻStrategic Review of Telecommunications Phase 1ʼconsultation document.
23 Ofcom also agreed with this statement by C&W. In the Phase 2 consultation document it said ʻWe believe that similar stories could be told about carrier pre-selection, wholesale line rental, partial private circuits and indirect access in their early daysʼ (para. 6.3).
24 Ofcom Strategic Review of Telecommunications: Phase 2 Consultation Document.
25 Ofcom (2005) ʻStatementʼ (see note 3).
26 Data source: European Commission Implementation Reports 2003–2009. These prices are shown in euro in the Implementation Report. Prices have been converted to Sterling and then back to euro using the average exchange rate for the period.
27 Source: Ofcom, Telecommunications Market Data Update, Q2 2013.
28 Note: Sky acquired only O2?s domestic UK broadband business and not the mobile network.
29 Virgin Media press release 27 October 2010.
30 Virgin Media Press Release 11 November 2013.
31 Source: SamKnows. Website www.samknows.com checked 24 January 2014.
32 Source: BBC i-player Monthly Performance Pack, March 2013.
33 For historic reasons the city of Kingston upon Hull in northeast England has never been part of the BT network. Therefore Oftel in fact found two geographic markets, ʻthe Hull areaʼ and the rest of the UK. For the purposes of this case study, however, we shall ignore the Hull area.
34 Source: Ofcom, Review of wholesale broadband access markets 1 August 2013. The Hull area accounts for the remaining 1.3% of households.
35 Source: www.samknows.com.
10 Italy
10.1 Introduction to the case study
This section highlights the latest developments of the Italian telecommunications market. The main body of this chapter is focused on the development of broadband, covering fixed and mobile networks. Section 10.2 briefly recalls, for an understanding of the starting conditions, the historical developments including the early days of liberalization. Section 10.3 illustrates the correlation of television and broadband. Section 10.4 moves on in the analysis to investigate the development of the broadband sector, the role of unbundling, and the investments levels. Section 10.5 discusses, the model of functional separation and equivalence of Telecom Italia (TI). Section 10.6 covers current developments with FttX and LTE, and Section 10.7 reviews the achievement of the Digital Agenda targets. Section 10.8 provides the case analysis and Section 10.9 provides the conclusions.
The growing Italian broadband market is still typified by the ‘original sin’: that is, the lack of a cable-TV operator1 and the inherent competitive pressure that might come with it. Absent CATV, the broadband market chiefly relied on local loop unbundling and bitstream access and has moved, to a certain extent, towards a complementarity between landlines and mobile networks. In 2013, the number of fixed lines decreased, down 2.3% year over year (YoY), from 21.8 to 21.3 million. At the same time the number of broadband lines increased: + 2% YoY from 13.6 to 13.9 million lines, as the average connection data rate grew: +23% YoY. Further increases were noted in the number of IPv4 addresses: +12% YoY.2
With regard to mobile broadband, more than 32 million SIMs were used for mobile data traffic (+20% YoY, 2Q 2013). Mobile broadband also contributed to foster overall connectivity, since 4.8% of citizens had access to broadband only over wireless networks. Some 8.8% of the Italian citizens using fixed networks were below the ʻdigital divideʼ in 2013: 3.8% had no DSL; 3.2% of broadband connections had data rates under 2 Mbit/s; 2% had ‘nominal’ or inconsistent coverage due to the length of the lines and other factors affecting performance. The resulting total was a (fixed and mobile) broadband divide figure of 4%.3
While the performance of fixed and mobile networks remains substantially different so far, fixed/mobile substitutability is a trend bound to become more important when 3.5G and 4G broadband access services can perform at a similar level to the alternative DSL broadband services, or can compensate for the lack of broadband service in low-density areas.
It is difficult to quantify how broadband is being used in micro-businesses (3 to 19 people), which represent the bulk of the Italian economy, due to overlap with residential broadband usage within families and their closer circles. However, data published by the National Institute of Statistics (ISTAT) in December 2013 showed that about 67% had a company website, about 44% sold goods using e-commerce in 2013 and 96.8% of SMEs with at least ten employees used a broadband connection to the Internet in 2013.4 With regard to households, in 2013, 60.7% had a broadband connection to access the Internet, with some differences between north and south. Of the population above six years of age, 54.8% used the Internet and 33.5% used the Internet almost daily in 20135. It is fair to say, looking at this data, that 2013 marked a huge step up in broadband consumption, for both households and companies.’
Historically, the lack of CATV, together with a strong presence of commercial free-to-air television, has led to durable monopolistic conditions. Those were alleviated by the deregulation imposed by the European legislation (which in Italy essentially started in 1995 with the introduction of ‘closed user groups,’ to be followed by public voice telephony from 1 January 1998) and implemented by the Ministry of Communications and AGCOM, Europe’s first integrated regulator for telecom and media, which started operations in March 1998. The privatization of Telecom Italia (in 1997) also significantly conditioned the early days of telecommunications liberalization in Italy.
The liberalization subsequently focused on wholesale-based competition by creating favourable conditions for the uptake of local loop unbundling (LLU). Linked – again –to television, as the Competition Authority (AGCM) would only allow TI to enter the free-to-air television market in exchange for favourable access conditions to its own civil infrastructure – to the advantage of altnets (alternative network operators) – in 2001.
Regulatory-based access to the civil infrastructure, coupled with an entrepreneurial vision, led to the first attempt in Europe by an alternative operator – E.Biscom/Fastweb – to build a nation-wide network based on FttH in 1999. This attempt only partially succeeded, although Fastweb does manage to this day to serve roughly 15% of its customer base (1.9 million in 2Q 2013)6 with various fibre-based solutions (FttH/FttCurb). Fastweb has also deployed an FttX infrastructure with roughly 2 million homes passed and is now developing its FttCab presence. In addition to this, Metroweb, an infrastructure-only provider, provides FttH access to roughly 0.3 million homes passed in Milan and other cities in northern Italy.
With regard to the overall infrastructural development, the upgrade of the national network is ultimately based on the provision of broadband and ultra-fast broadband (in excess of 30 Mbit/s) in all major cities, using mainly VDSL2+ as a technology and mobile broadband using 3.5G and 4G with important overlaps in coverage. The industrial plan of TI for the period 2014–2016 foresees coverage of 50% of the population based on FttCab and 80% based on LTE.
Lastly, in terms of reinforcing competition in the fixed voice and broadband markets, the importance of the Italian model of equivalence of access should not be underestimated in understanding the actual operating conditions for alternative network operators.
10.2 From the historical network to the early days of liberalization
10.2.1 Telecom 1.0: the history of the Italian telecommunications sector (1853–1995)
In 1853, the Italian government established a government-granted monopoly on long-distance transmissions (i.e., telegraphy service) sanctioning a strong public presence in the telecom sector, with the main consequence that all relationships between the state, the licensee and the customers had to be regulated by laws. A law of 1892 enforced public presence by stating that, on licence expiry, all installations should return to public ownership, without any compensation fee. The main effect of such a normative prescription was to reduce the propensity to invest and, as a consequence, to restrain the increase of users, especially in the smaller cities. However, because of the deployment of the first long-distance networks, from 1904 to 1907 the overall number of customers increased, though remaining far below that of similar European countries.
In 1923, a Royal Decree (R.D. n.339) initially reserved to the state the right of installation and operation of telephone networks for both private and public use. However, in 1925 existing concessions were consolidated and awarded to five private companies (Stipel, Telve, Timo, Teti and Set) for regional telephony and R.D. 884/1925 entitled the state agency ASST (Azienda di Stato per i Servizi Telefonici) to coordinate and interconnect them for interregional and international calls. Moreover, other private companies, Italcable, financed by Italian migrants to Argentina, and Italo Radio, were entitled to provide intercontinental telegraph and telephone services from 1921 to 1941, the year that they merged.
The basic rationale of such a governance model for the Italian telecommunications system stemmed from the necessity to avoid a high concentration of services in the hands of a single (private and/or foreign) licensee, while reaching the economic policy objective of using private funds to finance investments, a necessity given the heavy public debts accumulated during World War I.
The radical shift towards the full public control of the telecommunications sector began in the late 1920s and was scaled up in 1933 with the foundation of IRI (Istituto per la Ricostruzione Industriale; i.e., the Institute for Industrial Reconstruction, a state-owned conglomerate aimed at counterbalancing the effects of the global depression on the Italian economy) and STET (Societa’ Torinese per l’Esercizio Telefonico), its sector holding for telephony. STET acquired control of Stipel, Telve, and Timo – i.e., the telecommunications assets of SIP (Società Idroelettrica Piemontese) – through the emission of state guaranteed bonds, which could be converted into shares.
STET became public in 1936 and by the end of the conversion process more than the 40% of the equity was in private hands. In 1958 STET also acquired the control of the remaining private licensees (SET and TETI). In 1964, following the nationalization of electric utilities in ENEL, through the enforcement of D.P.R. n.1594/1964, the five regional licensees merged with SIP. Note that the regional electric utilities were also controlled by IRI. Hence the nationalization indemnities obtained by SIP could be used to finance the diffusion and modernization of the telephone services. The merged company was renamed Società Italiana per l’Esercizio Telefonico (SIP) and became the nationwide licensee responsible for almost all telecommunications within and among the 210 newly-established districts. It was controlled by STET but also retained the private shareholders of the previous SIP, who were attracted by the profitability of the telephone business.
In the same year, STET also acquired the control of Italcable and Telespazio (responsible for satellite communications). As a result, STET was entitled to technically and managerially address all the licensees in the telecommunications sector, while the state agency ASST, still in charge of national long-distance and international services, lost much of its strategic role.
Moreover, especially in the 1980s, STET pursued a strategy of vertical integration and expansion in the adjacent industries of the emerging ICT ecosystem: IT services, telecom manufacturing, infrastructure building, research and development, data services, publishing and advertising. The attempt to enter the cable-TV business failed, because of both technical and regulatory problems, and the venture was transformed into a satellite Pay-TV platform.
The redesign of the governance structure of the whole sector spurred a new growth period in terms of users and installations. From 1964 and for almost ten years, a steady growth in the rate of user uptake was recorded, also as a consequence of substantial investments to update the network, the introduction of new tariff policies for both local and long-distance calls, the abrogation of additional fees for residents outside the cities and, last but not least, the low risks associated with a monopolized structure of the sector. In those times, major attention was also given to cost control, reduction of the financial leverage and the use of depreciation for self-financing.
During and after the oil crisis of the 1970s, the sector suffered due to the tariff freeze imposed by the government to try to keep inflation under control.
In contrast, during the 1980s SIP enjoyed a close relation with the government, which provided funds channelled through IRI to increase equity, allowed the increase of tariffs and the decrease of licence fees; and allowed the flow of subsidies from international and long distance traffic to the operation of local networks. SIP also received financial support from the Italian bank CDP (Cassa Depositi e Prestiti, which finances public infrastructures using postal savings) and the EIB (European Investment Bank). This enabled the company to sustain heavy capital expenditures in network capacity expansion and modernization, and helped to reduce the gap in infrastructure quality between northern and southern Italy.
The first half of the 1990s saw further important steps in the growth of SIP, such as the activation of the first large-scale mobile network and of the first digital access network – ISDN.
In 1994, the consolidation of the mixed public-private monopoly of telecommunications services controlled by IRI was completed: STET, SIP, Italcable, Telespazio, Iritel (formerly ASST) and SIRM (maritime services) were all merged to form TI.
10.2.2 From monopoly to competition: the early days (1995–1998) and beyond
The public-private telecom monopoly has fostered the development of a telecommunications system with users’ interests protected in terms of availability of services and the level of tariffs (within the usual pre-liberalization context of tariff unbalance and publicly-financed universal service obligations). High fixed costs for network deployment and economies of scale justified the monopoly of the access network at a micro-economic level. However, the creation of a European telecom regulatory framework and the ambitious ideas exposed in the Green Paper (1987), substantiated in 1990 by the ʻtwin Directive setʼ (Competition in telecommunications and Open Network Provision), eventually led to the liberalization of the Italian market, with sizeable effects on competition. At the same time, the privatization of TI became a core issue at both national and European levels, as it contributed to pay off IRI’s debts in other industries and prepare for Italy’s adoption of the euro, from 1 Jan 1999 starting with non-physical payments.
A long-term reform process was initiated with State Law n.58/1992 transforming the state agency ASST into IRI-owned Iritel in order to separate ownership and management from regulation. The reform of the governance system was more precisely defined in 1995 and 1997 by the establishment of the regulatory authorities for public utility services (State Law 481/1995) and the actual setting up of the Autorità per le Garanzie nelle Comunicazioni(AGCOM, the telecommunications and media regulator, Law 249/1997), which began its operations in March 1998 (more on the creation of AGCOM in Section 10.2.4). The new corporate model required major organizational changes such as adopting a divisional structure to make the different lines of business more independent and their individual performances more visible. Moreover, key legislative initiatives targeted the abolition of exclusive and special rights previously assigned to the incumbent. Crucially, D.P.R. 22/12/1994 introduced non-exclusivity for the incumbent in the provision of mobile communication based on GSM technology7. Moreover, State Law n.103/1995 – finally transposing EC Directive 90/388 – allowed any European service provider to offer (existing or potential) data services and closed user groups to business customers. Overall, the full transposition of European Directives was quite slow, mostly due to lobbying and delaying actions from established industry groups.
Among the most important steps, was the enactment of D.L. n.546/1996, converted into State Law n.650/1996, which allowed the government to more easily implement the EU directives; State Law 55/1997 and D.P.R. 318/1997 provided the core elements of access and interconnection as well as universal service.
Full liberalization was completed with the (emotional, one could say) award of the first authorization for public voice telephony service in February 1998 to Infostrada (today owned by Wind), quickly followed by a large platoon of network and service operators. The most notable were Fastweb, Wind, BT-Albacom and Tiscali. Vodafone entered the fixed broadband business at a later stage, although today it has a substantial customer base, almost as large as Fastweb. Wind, currently the most important competitor to TI in terms of fixed broadband market share, was born in 1997 as a spin-off of the national electricity incumbent (ENEL). France Telecom and Deutsche Telekom were part of the initial set of key shareholders. However, they soon exited the venture and sold their shares to ENEL. In 2005, ENEL then sold Wind to Wind Telecom S.p.A. (formerly Weather Investments) owned by the Egyptian group that also owned Orascom Telecom. In 2011, Wind became part of the Vimpelcom group, following a merger between the Russian company, with the participation of Telenor, and the Egyptian Orascom Telecom. Wind started off as an integrated fixed and mobile operator and incorporated Infostrada, but was able to exploit this integration only to a certain extent. Today, Wind is a major mobile operator.
10.2.3 The early days of Internet access in Italy
Internet access ‘in Italy’ (i.e., by means of a permanent physical node) started as early as 1986 in Pisa. Italy was tied for third European country to get on the Net, following the UK and Norway and at the same time as the Netherlands.8 Generalized access to the Internet was essentially launched as a scientific project – at a cost equivalent to about EUR 2.5 billion – in 1988 to unify the various scientific institutions and their large computers in Italy by means of a single network, GARR (Gruppo Armonizzazione Reti della Ricerca – from the ministerial committee which gave its name to the network).
The first commercial ISPs for residential users appeared several years later, in 1992–1993, building on their experience with bulletin board systems (BBS). In 1994 I.net became the first ISP for business customers, joined a little later by IT.NET.
I.NET and IT.NET used links provided by Unisource and Pipex, respectively. However, the carrier network, the landing points of the marine cables and all the core connections that made narrowband traffic possible were almost entirely provided by TI; without TI little would have happened in this regard.
However, as noted in other countries, the incumbent was essentially taken offguard with respect to the ‘early adoption of the Internet’ when considered as a mass-market for businesses (which TI only entered in 1996) and residential customers (with TI’s first offer in 1998, under the brand name of TOL – Telecom Italia Online).
With regard to the residential market, the uptake of Internet access (with very slow and expensive connections, especially if long distance calls were required) was a bottom-up affair, more from the edge than from the core. Especially between 1992–1996, Internet access was mainly propagated by former BBS (bulletin board system) managers turned into service providers. Names like Agorà, MC Link, Video On Line and I.net, amongst others, are early examples of more professional services, all active since 1992–1993. Agorà, based in Rome, was particularly significant as it was born out of necessity, for the Radical party (a small political party, which became an important civil liberties movement in the 1970s) to connect with its many affiliates throughout Europe using the Internet as a means to avoid costly phone calls and faxes. Video On Line (started in 1993) was the first mass-oriented provider and it built on its connection with the research center CRS4, at that time directed by the Nobel prize laureate Carlo Rubbia, also a former director of CERN (where the Web was born). See Figure 10.1 for a screenshot of its home page. Video On Line is (self) credited with hosting Europe’s first online version of a daily newspaper (L’Unione Sarda) in March 1994.

Tiscali, which was established January 1998, was considered an heir to Video On Line, as they both originated from Sardinia and as it fostered the mass-market adoption of access to the Internet, being the ‘ideal type’ of a bold, fast competitor, without ever making a profit in more than 10 years of its operations.
Tiscali’s key strategic move consisted in pioneering the ‘reverse’ (indirect) interconnection mechanism. From March 1999 onward, Tiscali offered a subscription-free Internet service whereby the customers only had to pay for the time they were online. Tiscali then derived its income from the ‘indirect interconnection’ option, whereby the interconnected operator (TI in this case) pays to a carrier (Tiscali) an interconnection charge for bringing traffic to its network. In other words, TI offered an interconnection service to the third-party operator Tiscali. At the time, giving up paid subscriptions was a bold move, which allowed Tiscali to gain an important share of the market. This made Tiscali’s IPO in October 1999 a real success: at the apex of the dotcom bubble, Tiscali exceeded Fiat’s market valuation. Tiscali used these financial resources to expand its ISP operations in several advanced European countries. But in subsequent years economic and financial problems forced it to sell all its ventures outside Italy.
Another extremely successful IPO was at the origin of E-Biscom in March 2000. This venture was the result of an agreement with AEM (the energy utility of Milan) to create an infrastructure company (Metroweb) and a telecoms operator (Fastweb). E. Biscom had participations of 33% and 70%, respectively. E.Biscom was incorporated into Fastweb in 2004.
10.2.4 AGCOM, the first integrated regulator in Europe
AGCOM (Autorità per le Garanzie nelle Comunicazioni) was created as a single, or ‘integrated/convergent’ regulator in July 1997 with the task of applying European legislation in telecoms and media. However, operations only started in March 1998, with the formal appointment of the first board. It was essentially modeled after the experience of the Canadian regulator (CRTC) and the Federal Communications Commission (FCC) in the US. For the first time in Europe, a regulator would be responsible for jointly regulating media and telecommunications. Others, like OFCOM in the UK, followed suit only several years later. AGCOM superseded the Media Authority9 and inherited most of its competences from the Ministry of Communications (now part of MISE, the Ministry for economic development), although some job-sharing with the latter continues to this day, especially with regard to the issuance of authorizations, spectrum management and broadband policies. Overall e-policy making, including today’s ʻDigital Agenda for Italyʼ initiative, is managed by the Prime Minister’s office, together with MISE. In 1998, creating an integrated regulator was ambitious. However, while a number of telecom/media subjects are discussed jointly by AGCOM’s board, the management of single regulatory issues remains largely divided between the regulators’ offices and treated without too much emphasis on ‘convergence’.
On the other hand, being ‘convergent’ has often put AGCOM at the forefront of regulatory and market developments, sometimes resulting in innovative thinking. Nevertheless, critics have pointed out that, especially with regard to audiovisual matters, the governance of the regulator exposed the regulator to political influence, with a President appointed by the Prime Minister and a board of four Commissioners nominated by the Parliament.
In the end, if regulatory performance should be judged by metrics, it is uncontestable that Italian consumers benefit from low retail prices (including mobile pricing, notwithstanding termination rates which for a number of years remained within the higher bracket of EU members), and ease of choice (one mobile number out of four in Italy is ported). Today, TI has roughly 14 million direct access lines (63% of the access market) while a further 7.2 million lines of its network are managed by altnets. In addition, 0.5 million lines (NGA/FWA) are owned by alternative network operators.10
10.2.5 The privatization of TI
A few key points of the privatization of TI are relevant for our discussion on the Italian broadband market.
The privatization model chosen for TI is the subject of several, mostly critical, analyses. They all underline that the original model (a public company with a large set of shareholders) failed to be properly implemented (or, was the problem inherent in the model of choice?) and that, eventually, controlling shareholders emerged and charged the company with high financial leverage. The debt still hampers investment, and has radically downshifted the position of the company in the international markets. It is difficult to disentangle the complementary effects of privatization, liberalization, pro-competitive regulation, financial bubble and global difficulties of telecom operators in engaging with the Internet world. However, there is no doubt that under these circumstances the privatized company was unable to pursue the same bold growth strategy and to secure to the shareholders the same handsome financial performance as the previous mixed-capital venture.
Essentially, the private TI went through four distinct changes of controlling groups. Firstly, in 1997, the Treasury granted the control of the company to a small nucleus of investors including Ifil (the Agnelli family), Mediobanca and other recently privatized banks, bank foundations11 and building companies, with the private placement of less than 10% of voting rights. Moreover the Treasury placed most of its other shares through a public offering: about 1.5 million small investors acquired 32% of the equity. The weakness of these initial core investors led to what has been labeled as the largest hostile takeover in European history in 1999: Olivetti bought 51% of the equity through a public offering. The investment, worth more than EUR 30 billion, was financed with debt but also by selling to Mannesmann the control of Infostrada (subsequently acquired by Wind), and that of Omnitel, the second Italian mobile operator, eventually acquired by Vodafone.
The operation, as much as the original privatization, was marked by heavy-handed intervention from political parties leading to a leveraged buy-out which made no economic sense and allowed a few key investors to take control of TI through a long chain of Chinese boxes that ended in Bell, a Luxembourg-based holding company.
In 2001, the third change of the controlling group did not require a public offering. Olimpia, an ad-hoc vehicle created by the Pirelli and Benetton groups, banks and some of the Bell shareholders, acquired 23% of Olivetti’s equity from Bell, paying twice the market value; EUR 7 billion in cash was sufficient to acquire the control of TI, a company which at the time had a market capitalization of EUR 55 billion.
A lot of divestments, consolidations (between Olivetti and TI) and the buyback of the floating capital of TIM were executed only to help the controlling group to pay its debts. But eventually Olimpia had to give up and a new vehicle, Telco, took control of TI with 23% of equity in 2007. Telefónica of Spain owns more than 40% of Telco and has negotiated a further increase of its holdings, de-facto becoming the controlling shareholder of TI. These leveraged buy-outs (LBOs) resulted in a huge debt that peaked at EUR 40 billion in 2005.12 After years of painstakingly repaying, the debt is ‘down’ to EUR 28.2 billion as of 31 December 2012.13 However, for many years investments have been severely constrained in order to assist Bell, Olimpia and now Telco to maintain their control.
10.3 Television, Internet, and mobile broadband
10.3.1 Broadband development: the importance of television in shaping competition and regulation in Italy
No serious discussion on the evolution of broadband in Italy can take place, in our view, if the role of television is not carefully considered. As we pointed out in the introduction, the ʻoriginal sinʼ of Italian broadband is the lack of competitive pressure stemming from the absence of CATV. Television competition also affected access conditions following regulation introduced by the Competition Authority.
The early liberalization of the free-to-air (FTA) television market, also allowing foreign broadcasters to transmit from Italian territory, was coupled with legislation (DPR 29 Marzo 1973, n. 156) that briskly halted CATV in its infancy. Part of that legislation was later on declared unconstitutional and amended in 1975. However, by then FTA TV was already established as the (cheaper) means of choice for local broadcasters, essentially making the deployment of a nationwide CATV uneconomical.
As around 1995 it became conceivable to use a CATV infrastructure to compete with emerging pay-TV satellite services and as a broadband vehicle, TI chose to invest heavily in the so called Socrate Plan, aimed at deploying a fibre+coaxial cable network in all major Italian cities14. This move was criticized as a market pre-emption by the dominant player in infrastructure, as it took place on the verge of full liberalization from 1 January 1998. However, the passive infrastructure was only partially deployed as TI’s broadband investments were shifted towards ADSL. The pay-TV company of the TI group (Stream, created in 1997) migrated to satellite and was eventually sold to Newscorp in 2003.
The business model of Fastweb, a joint venture of the Milan municipal utility AEM and e.Biscom, a new entrant that went public in 2000 just before the explosion of the dotcom bubble, also was centred on the convergence between broadband and television. The first investments in Milan benefited from synergies with AEM’s existing and new electricity infrastructures. Further expansions in other cities benefited from a landmark decision15 of AGCM (the Competition Authority) which, as a compensation for allowing TI to enter the analogue terrestrial FTA television market, forced the company to provide non-discriminatory access to all of its civil infrastructure from 1 April 2001. Many kilometres of ducts (3000–6000), all located in premium areas and initially constructed for the Socrate network, were thus reused.
Fastweb – having incorporated E.Biscom and now a part of Swisscom – today has roughly 290,000 live customers served over FttB (Fibre to the Building) and has passed more than 2 million residential or business units. Nonetheless, the overwhelming majority of its customers are now served via DSL technology. In fact, the price range of FttB services initially offered by Fastweb met with relatively limited response; it was not competitive with cheaper ADSL services and triple-play was offered at prices between EUR 50–80 per month. Moreover, at the time Youtube did not exist nor did thousands of other services available today, which probably would have convinced more customers to sign up.
Both TI and Fastweb have for many years, but with limited success, attempted to distribute video content on their networks through proprietary IPTV services, the lack of control on premium content being the main difficulty, even if Newscorp/SKY had been required by the European Commission to sell its premium content on the wholesale market to distributors on different platforms.
The pay-TV sector now sees SKY and the digital terrestrial television (DTT) group Mediaset (controlled by the Berlusconi family) as the main competing actors. Many other small scale local broadcaster adopt a real estate business model: i.e., they exploit regulations that might remunerate them when spectrum will be assigned using market mechanisms (probably) to mobile operators, or lease it to operators that need it to enrich their terrestrial offerings. Both attitudes are de-facto incentivized by the low administrative price of the spectrum.
At present, the major broadcasters have a mixed attitude with respect to the broadband network. On one hand, they strenuously defend their proprietary platforms against the risk of substitution and the old linear television model against the new video services offered by over the top operators (OTT) via the web. On the other hand, they increasingly use the broadband network as a complement, notably through catch-up TV, and using proprietary set-top-boxes connected to broadband as buffers and storage to realize quasi-on-demand video offerings.
As we will see in the following section, to further increase fixed broadband penetration and make the development of NGA infrastructures economically viable, a big jump ahead in the demand for video services through the broadband network is probably necessary in a country like Italy, characterized by low PC use at home and high diffusion of mobile services.
10.3.2 The evolution of fixed broadband in a mobile nation with low PC penetration
In the 2003–2004 period following strict enforcement of LLU regulations, Italy had the highest relative growth rate of broadband access lines in Europe.16 In the same period ADSL lines increased from 9.2 to 14.6% of the total European DSL market. By 2005 Italy was relatively well placed in comparison with other EU member states, although cable really made a difference in countries with competing CATV infrastructure such as the Netherlands and the UK.17 The LLU price reduction continued between 2005 and 2008, fostering the take-up of broadband. However, starting with 2009, a number of price hikes were enacted. This did not reverse the trend of increasing market shares for altnets but, coupled with the outburst of the economic crisis, made the competitive scenario significantly more challenging.
In recent years, broadband penetration has continued to grow, despite the on-going recession in the country. Demographics and digital literacy have certainly played an important role in broadband take-up. Similarly to other countries, the absolute number of fixed lines is decreasing constantly, while the percentage of broadband lines (in proportion to total lines) and the market share of altnets are increasing. See Table 10.1 and 10.2.
Table 10.1 Fixed access lines, incumbent and altnets, Italy, 2011–2013

Table 10.2 Altnets’ access lines by technology, Italy, 2011–2013

The detailed, internationally harmonized annual survey of the Italian statistical office (ISTAT) on Aspects of daily life shows that the take-up of broadband is still low, although strongly increased in comparison to the previous year: 60.7% of Italian households had a broadband connection at home in 2013. The share of households that had a personal computer at home was 62.8%.
In other words, most of those that appreciate the Internet have adopted a broadband connection but Italy is characterized by a sharp divide in terms of computer literacy, education, age, income, social and employment conditions and regional development; that excludes a surprisingly large part of the population, typically the older and the less educated, from the benefits of the Information Society.
No single factor taken alone is sufficient to explain the divide but many of them are correlated and have a synergistic effect on exclusion. However, low income very often acts as the main barrier for households in which children could promote the adoption. In contrast, the lack of technological skills and of cultural interests are the main barrier for older people.
As Internet adoption continues to grow, albeit at a slow pace, those main factors become even more relevant to characterize the excluded household. See also Table 10.3 and 10.4.
Table 10.3 Broadband and PC penetration by household type, Italy, December 2013

Table 10.4 Mobile subscriptions, Italy, 2004–2013

The infrastructural divide does not play a major role in explaining exclusion. However, if broadband services are not available or the quality and speed of the connection is low, further barriers could become evident. With respect to the scope of actually used services and applications: it is doubtful that a demand for ultra-fast broadband connections could reach the critical mass for economic feasibility if consumers don’t become regular users of video content services. Note, in particular, that current 3G broadband contracts limit the monthly traffic to 1–2 GB and are therefore unsuitable for regular use of high-quality streaming or near-video-on-demand services on connected TV sets. On the contrary, these services could be attractive for elderly people that don’t use the Internet but have fixed lines and spend a lot of time watching television.
Another factor that needs to be taken into account when evaluating the broadband evolution in Italy is the traditional divide between desktop penetration and mobile adoption, which in recent years further increased due to the strong take-up of smartphones and tablets and the reduction of active landlines. Traditionally, Italy ranked in the lower echelons of comparable countries in Europe in PC penetration, which is in part a result of lower education and digital literacy rate and an unfavourable demography. However, with 92.7 million SIM cards for a population of 60 million, out of which 34.2 million are SIMs which generate IP traffic (8.6 million are for data-only cards)18, Italy is certainly a strongly mobile-oriented country.
The mobile trend was set in 1995, with the massive adoption of pre-paid subscription and SIM cards based on top-up recharge. From the same year, post-paid subscriptions were, and continue to be, penalized by a ‘luxury’ tax. Prepaid subscriptions were first offered by TIM, the mobile brand of TI, as a successful reaction when Omnitel entered the market as the second Italian mobile network operator (MNO).
The relevance of mobile has to be factored in with regard to all future broadband plans. While mobility is key everywhere in the world, particularly in Italy the fourth generation of mobile – with its significant comparative performance advantage over third generation – will almost certainly play a dominant role in broadband penetration overall. This assumption is consistent with the interest shown by MNOs at the time of the auction for LTE frequencies in September 2011, which generated close to EUR 4 billion of revenues for the Italian Treasury.
LTE-based commercial offers are now available from TIM and Vodafone, while Wind is currently deploying its 4G network starting with the most population-dense areas19. The current 4G coverage is above 40% of population.20 Mobile traffic in Italy in 3Q 2012 was up 32% year-over-year.21
10.4 Broadband, unbundling and the investment challenge
10.4.1 LLU regulation as a means to foster national infrastructure deployment
In the ‘ladder of investment’ concept, popularized amongst others by M. Cave (of Warwick University, UK), Local Loop Unbundling (LLU) occupies an important place. While not akin to competition by providing a fully alternative infrastructure, LLU is nevertheless relevant in terms of investments from alternative network operators, although largely based on renting the incumbents’ loops.
In Italy, LLU played an important role in creating a level playing field. Its enactment in Italian legislation preceded the European requirements: in 1999, AGCOM started technical analysis, provided guidelines and designed monitoring. TI published its first reference offer in 2000. However, for some years implementation was difficult because of cumbersome procedures and economic conditions that made it hard for altnets to replicate the incumbent’s retail offers.
During those years AGCOM was developing, its landmark approach to non-discrimination in fixed telephony (Del. 152/02/CONS), first applied to interconnection costs as the base of replicability of the incumbents’ offers. Subsequently, non-discrimination coupled with regulatory accounting were used (Del. 3/03/CIR) to determine that the ʻLLU reference offerʼ for 2003 had to be improved. The incumbent’s retail access offers were not replicable by an efficient OLO using LLU, lacking an adequate cost model and considering possible inefficiencies of the access network, while discounting future cost reductions led to the decision to set lower LLU monthly fees, these being reduced to the best European benchmark, the Danish one at EUR 8.30/month22.
To incentivize the growth of the broadband market and to implement the second EU policy framework (including directives 2002/19/CE, 2002/20/CE and 2002/21/CE), some complementary actions were taken: (1) quicker implementation of the 2002 regulatory framework in a single Code (namely, Codice delle comunicazioni elettroniche, D.Lgs 259/2003), and (2) the launch of a national program for broadband development in southern Italy (Law 80/2005)23 to reduce the digital divide in the south24.
Meanwhile, the Competition Authority (AGCM) was investigating the non-replicable TI offers to business customers (Case A351, initiated 5 June 2003), which ended with the State Council judgment 1271/2006 of 10 March 2006, resulting in a fine of EUR 115 million imposed on TI). In an attempt to improve its position in the antitrust case, TI agreed to keep the price of LLU stable until December 2006; it was at EUR 8.30/month at the end of 2004. In fact, in subsequent years the monthly fee was further reduced, applying a network cap (until December 2007) and using historical cost data for civil works costs.
In Italy, LLU regulation was thus championed as a means to foster infrastructure deployment. It was expected that lowering prices for renting loops and easing collocation at the central office level would allow for the emergence of stronger competitors, who would be capable of further investments and innovation when building on a sufficiently large customer base, similar to E.Biscom/Fastweb at the turn of the millennium.
However, since 2010, AGCOM reversed the path followed until that moment, allowing for increasing prices for LLU: EUR 8.70/month from 1 May 2010, EUR 9.02/month from 1 January 2011 and EUR 9.28/month from 1 January 2012.
The price increases for unbundling and other wholesale services were made conditional on the verification by AGCOM of the attainment by TI of certain parameters measuring quality improvement and modernization of TI’s access network. In 2013, however, changes in the cost model and other considerations related to the cost of capital have led to a generalized reduction in the price of regulated wholesale services, including services provided over next-generation access networks. This decision generated a confrontation with the European Commission, which however ended with AGCOM sticking to the reductions and setting up an additional obligation for TI to grant access at the cabinet level.
Overall, notwithstanding a certain continuity in investments in fixed networks, it can be said that in the last five years the development of networks did not occur at the same pace as in some other European countries. For some, this is the consequence of a continuing ‘muddling-through’ of investment strategies in the fixed networks, which was already visible between 2005 and 2008 (Caio, Reference Caio2009). For others the explanation is to be found in the weak demand, which for different segments of the population is related to lack of skills or interest or to income problems, and to a minor degree to the lack of advanced applications.
During these years, on one hand, the telecom incumbent focused on convergence and the provision of integrated services, accessible independently of the customers’ devices. On the other hand, Fastweb tried to follow the growing demand for higher data rates by offering higher speed over existing lines and IPTV in major Italian cities,25 rather than developing further portions of the network. Furthermore, as broadly discussed within the ISBUL project,26 measures on the demand side favoured customers willing to use new broadband services on the base of the existing broadband networks. In fact, incentives were allocated to carriers; as a consequence, they were able to reach final customers only indirectly and did not promote the competition among carriers that favoured broadband diffusion in areas where LLU was deployed. This probably made it possible for some subscribers to pay less for low data rates but did not lead to a better performance or significantly widen the customer base.
Other initiatives, taken at the legislative and policy level, were aimed at fostering the take-up of broadband services.27 Specifically, in 2003 the central government initiated a long-term project to bring broadband networks to southern Italian regions to reduce the digital divide. The project was managed by the CIPE28, coordinated by Sviluppo Italia29 through Infratel S.p.A.30 and operated by the latter. Since 2005 the project has been managed through Law 80/2005 – in accordance with regional authorities, carriers and utilities.31 It aimed to deploy about 1,800 km of fibre – to modernize the primary backhaul network down to central offices and allow for minimal broadband services – in 265 municipalities in southern regions with a budget of up to EUR 230 million.
The digital divide for broadband was reduced to approximately 4% of the population by 2013. Furthermore, the establishment in 2010 of a special committee at ministerial level32 and a Memorandum of understanding among the central government, the regulator, TI and Fastweb fostered the development of a country-wide broadband program to streamline the deployment of fibre networks and to reduce the digital divide in the regions, including the sharing of information and investment plans.
Today, there is still a substantial gap in terms of broadband penetration between Italy and comparable EU member states. The combined effect of private firms’ strategies and public policies has led to at least three main effects: (1) the creation of a infrastructural gap between Italy and European forerunners (e.g., Denmark, the Netherlands, Sweden); (2) a substantial stagnation of demand evolution; and (3) the lack of a strong stimulus for the digitalization of public and business activities, with a negative effect on the creation of start-ups, level of investments by service providers and so forth.
10.4.2 Regional broadband development: different models, one target?
The difficulties in implementing a national Digital Agenda are in part related to the Italian institutional framework that assigns concurrent or exclusive authority over many public policies to regions. Moreover, cumbersome procedures and inefficient decisional processes have caused, in many cases, an insufficient and delayed use of the European regional development and cohesion funds. As a consequence, infrastructure deployment initiatives at the regional level are marked by significant differences and their success strongly depends on market, governance and geographical factors (see also Nucciarelli et al., Reference Nucciarelli, Castaldo, Conte and Sadowski2013)33. A number of regions, provinces, and other local bodies initiated investment in broadband infrastructures in the first years of this century, with the aim of connecting administrative offices and other public service buildings. In contrast, the central government had developed a centralized procurement mechanism for telecommunications services based on public tendering. The Lepida network, conceived in 2002 and owned by Region Emilia-Romagna, is probably the most ambitious project of this kind. It is managed since 2007 by Lepida S.p.A. an in-house service provider owned by the region (and other public bodies, such as provinces, municipalities and universities, each with a single share). The network has been deployed by sharing ducts with the optical network of regional multi-service utilities, which also managed the construction process. The fibre network has a geographic component (2,600 km of ducts connecting 372 points of presence), a metropolitan component (several optical MANs with 448 km of ducts connecting 721 buildings), and a fixed wireless component. From 2011, Lepida also stipulates a 15-year IRU (indefeasible right of use) with public service operators in order to use its surplus dark fibre to resolve the digital divide in underserved areas. Moreover, it sells backhaul capacity to small local ISPs and WISPs.
It is envisaged that, using Lepida, ultra-fast connectivity could be made available to the industrial clusters that characterize the region: Emilia Romagna is home to Ferrari and to a myriad of advanced mechanical and machine tools firms.
The first examples of regional support for investments by public service operators, based on the so called ‘Scottish model’, are the Sardinia and Tuscany state aid regimes, aimed at bridging the digital divide in rural areas, which were approved in 2006. The Sardinia tender specified that the aid, EUR 6.1 million provided by regional and state resources, had to be used to upgrade the central offices of TI in order to offer ADSL services in unserved towns. In Tuscany the four provincial tenders were technologically neutral and required a download data rate of at least 640 kbit/s to be provided. Three of them were attributed to small regional wireless operators, the fourth to TI. A number of subsequent regional projects followed these models.
More recently two of the richest and most developed regions in the north, Lombardia and Trentino (Provincia Autonoma di Trento – an autonomous entity), have developed plans for both bridging the digital divide and deploying ultra-fast broadband. Note that Milan, the capital city of Lombardia, is already well-endowed in terms of modern infrastructure (passive fibre infrastructure owned by Metroweb and used by Fastweb and now by TI) for FttB/FttH residential services. Therefore it was excluded from the regional plan. In the other densely populated areas of the region, the economic feasibility of the initial project (based on a mixture of point-to-point and G-PON FttH architectures) requires the switch-off of the copper access network.
In both cases, the digital divide component of the plan has passed the state-aid scrutiny, while the ultra-fast component is still in discussion: in Lombardia the regional administration did not succeed in obtaining the agreement of TI and the major OLOs; in Trentino the OLOs have opposed the agreement reached between TI and the regional agency.34
In 2010, the Provincia di Trento had initially obtained clearance from the State Aid – Competition Directorate in Brussels for its plan of ‘widespread’ ultra-fast broadband to small cities and villages, which are nevertheless supported by a very strong, all-year-round tourism industry in the area (the Dolomites) and the willingness to retain and develop several clusters of advanced ‘green economy’ industries. The plan envisaged, on one hand, the deployment of a backbone fibre network, which the public-owned company Trentino Network has deployed and, on the other hand, the roll-out of a fibre-based access network.
The aim of the plan was to create an ultra-fast broadband network to cover 100% of the population and of business enterprises by 2018, by creating a company with both public and private capital dedicated to covering 60% of provincial users (areas of medium profitability) while the low profitability areas were to be covered directly by the public company Trentino Network.
By 2012 almost 800 km of fibre were deployed in the backhaul and primary access network to connect 92 nodes. The access network is now integrated by HIPERLANs and, xDSL based broadband offered on a commercial basis by TI.
However, in 2012 DG Competition (EC) opened an investigation of the project since it felt that it should have been examined under the state aid procedure: at the time of writing the investigation is not finished but it is highly likely that changed market conditions, together with the delay generated by the investigation, will put an end to the ultra-broadband segment of the project.
A further interesting regional plan comes from another region of Mezzogiorno, where the Region of Sardinia aims to create a passive optical fibre infrastructure over a period of four to five years, according to a project-financing model. The project involves the construction of cable ducts and, at the same time, exploiting the civil works for creation of a methane pipeline. In this way, the region intends to make access to ultra-fast broadband available to citizens, by including the new fibre-optic access infrastructure in the works for the gas pipeline and making it available to the telecommunications operators.
10.4.3 National framework schemes for broadband and ultra-fast broadband
The European Digital Agenda requires that member states develop national plans for broadband in order to attain the common European goals in terms of reach, data rates and adoption (broadband at 30 Mbit/s for all, 50% of households with 100 Mbit/s connections) by 2020. The Ministry for economic development (MISE) has been entitled by Law 69/2009 to coordinate specific initiatives for the local development of broadband, while overall coordination for the Digital Agenda is retained by the Prime Minister’s office.
MISE has proposed three state-aid framework regimes that have passed the scrutiny of the European Commission. The first regime, N 646/2009, aims to use resources from the European Agricultural Fund for Rural Development. It envisages the concession to public service operators of fibre backhaul deployed through public tenders and financial support to end-users for the acquisition of customer premises equipment (such as antennas or modems) which are required to use wireless or satellite technologies in the most remote areas. The second regime, SA.33807 (2011/N) and the third, SA.34199 (2012/N) are framework schemes for deployment of broadband and ultra-fast broadband, respectively.
To ease the administrative burden, a single, country-wide state aid scheme can be used to cover ‘under one umbrella’ the different regional or local projects that will originate from the availability of funding instruments, mostly at local level. However, in case local authorities intend to deviate from the framework, they will be required to notify the European Commission of the amendments separately. Moreover, Infratel – the in-house company of the ministry – provides a one-stop shop for the technical aspects of the projects and assists local authorities in the tender process.
The underlying logic is to facilitate the achievements of the infrastructural targets of the European Digital Agenda focusing on the ʻwhiteʼ areas: that is, those with market failure or low-density areas. Public money is to be assigned to a network operator and associated civil works contractors for the deployment of next-generation networks. Public money typically covers 70% of the total cost. Access must be granted by the network operator on a non-discriminatory basis, with rigid claw-back schemes ensuring a fair, but not excessive, return on the private capital invested. Existing infrastructures can be transferred to the project as part of the bid. This ‘gap funding’ approach is used also in the ultra-fast broadband scheme.
In addition, a ʻDirect Interventionʼ and a public-private partnership (PPP) approach are considered. In the case of direct intervention, the passive infrastructure will be owned by the public body that promoted the project, a concessionaire will be selected by a tender procedure to be in charge of the provision of wholesale services, and several service providers (but not the concessionaire) will provide the retail services. In the PPP model, the private partner will be chosen through an open tender procedure. The private partner has to develop a detailed business plan, including technical and financial aspects. The partnership will own and operate the infrastructure, providing non-discriminatory access to the retail service providers.
10.5 The Italian model of functional separation: from equivalence of output to equivalence of input
The case study on Italy seems particularly interesting in the light of the discussion on functional separation.35 Starting from 2009, AGCOM has accepted Undertakings (or Commitments) offered by TI, based on the principle of equivalence of output (EoO). This solution, which is still in place in 2013, is finally evolving towards equivalence of input (EoI).
AGCOM has for a long time applied, and continues to apply, the two key concepts of non-discrimination and equivalence of access within the framework of the European legislation in the telecommunications sector. From this framework, following a detailed market definition and analysis, obligations are imposed on operators identified as having significant market power, However, non-discrimination between the incumbent’s downstream arm and the altnets competing in downstream markets has been pursued using additional tools. With regard to wholesale service delivery and network provisions, the Undertakings have contributed, based on an EoO model, to address a number of issues, ultimately improving consumers’ choice and competition at large.
In the European regulatory framework, there are two types of equivalence:
Equivalence of Inputs (EoI): the downstream access product retailed by the incumbent uses exactly the same physical upstream inputs as the downstream product supplied to its competitors, e.g., same tie-cables, same electronic equipment, same exchange space, etc. The (wholesale) product development process is therefore exactly equivalent in its provision in terms of functionality and price.
Equivalence of Outputs (EoO): the access products offered by the incumbent operator to alternative operators are comparable to the products it provides to its retail division in terms of functionality and price, but they may be provided by different systems and processes.36
In pursuing non-discrimination, AGCOM started well ahead of time and imposed a first set of rules to ensure equivalence of access in 2002. Those rules, including margin squeeze tests, were updated periodically (most recently in January 2010). In addition, starting from 2008, as a result of accepting TI’s undertakings (effective from 1 January 2009), monitoring and implementing EoO became an iterative process. See Figure 10.2 for the EoO model. Such processes imply close monitoring, facilitating technical solutions and implementing detailed business support and operational support systems. The current model has a relatively long history.
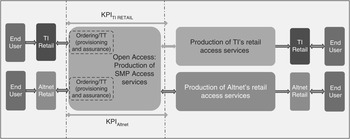
Figure 10.2 The equivalence of output model, Italy
July 2000
In July 2000, twenty-six alternative network operators wrote a joint letter to AGCOM to protest against the discriminatory practices, which, according to them, were used by TI, the incumbent operator. TI was accused of delaying (business/technical) operations, squeezing the margins of alternative operators, discriminating these operators to the advantage of the downstream divisions of TI operating in the same markets and using technical and economical discrimination as an anti-competitive weapon.
May 2002
Following a year-long investigation, including a detailed procedure and the opinion of the national Competition Authority, a landmark decision (152/02/Cons) was adopted by AGCOM in May 2002. That decision focused on ensuring equivalence of access and non-discrimination (ʻparità di trattamento interna-esternaʼ). The decision imposed on TI (as SMP operator) included the adoption of margin squeeze tests, accounting separation and a cost accounting methodology. Functional separation between the IT-systems of the wholesale and retail divisions of TI was also imposed, together with publishing service level agreements (SLAs) to ensure technical non-discrimination.
The decision has been amended over the years (most recently in 2011, with a complete redesign of the margin squeeze tests), but its key principles (economical and technical non-discrimination, equivalence of access) remain central and fundamental to a number of AGCOM’s decisions, including market analysis and related remedies for insufficient competition imposed by obligations in line with the EU legislative framework.
2006–2008
During this period, the issue of a possible separation of TI’s access network was at the core of the institutional debate, both from a general policy and from a regulatory point of view.
Law 248 of August 4, 2006, taking inspiration from the EU ‘modernization’ Regulation37 provided AGCOM with the powers to evaluate and accept commitments offered by operators within the limits of AGCOM’s competences and within the task of promoting competition in the provision of electronic communication networks, services and associated facilities and, eventually, to make them binding (Article 14 bis)38.
That summer, a lively political discussion started on the possibility and the merits of imposing a structural separation of TI’s access network activities. The key reasoning was that, due to the two successive LBOs which had created a huge debt to be repaid by TI to its shareholders (mainly to the most important Italian banks), selling the access network of TI and creating a ʻnewcoʼ could create value and shelter the company from an hostile takeover. Also, a key part of the ʻRovati planʼ (from the name of one of the PM advisors) was the divestiture of the mobile arm of TI, TI Mobile (TIM), a proposal that ran directly against the strategic decisions of part of TI’s top management at the time. The animated public discussion finally led, ten days after the publication of the plan (6 Sept 2006), to the resignation of the former CEO of TI, M. Tronchetti Provera, to mark his opposition to a board decision that supported the divestiture.
However, in the following months, with a new CEO (F. Bernabé) TI repeatedly opposed any kind of structural separation plan, arguing that the access network is an irreplaceable asset whose expropriation would represent a major and totally disproportionate remedy. Bernabé also explained that a functional separation would jeopardize the investments and put at risk the solvency of TI and its capability of addressing its leverage.39
Based on market analysis performed by AGCOM under the EU regulatory framework, TI was confirmed as dominant in all fixed network markets; in particular, the national wholesale market was typified by a single fixed access network, not economically replicable and competition in all fixed national retail markets relied on wholesale products offered by TI.
On the basis of such market analysis findings (and also under the threat of several on-going proceeding for sanctioning TI’s regulatory infringements), TI proposed a number of undertakings to AGCOM, aiming at introducing a model of functional separation for the provision of wholesale access services.
2008–2009
At the end of a long and thorough scrutiny process (based on several interactions with TI to improve the Undertakings and a subsequent public consultation), a detailed set of new undertakings (Impegni40), aimed at improving the competitive scenario in Italy and concretely addressing a number of technical and practical issues in TI’s working relation with the alternative network operators, was finally accepted by AGCOM in late 2008. It became binding from 1 January 2009.
As a matter of fact, the Undertakings were prompted by two different families of problems: practices which were already sanctioned by the regulator with heavy fines imposed on TI, and regulatory/discrimination issues to be addressed by a number of mostly technical and process-design implementations. The two key incentives for TI in proposing the Undertakings were: freezing, and ultimately avoiding, the potentially heavy sanctions for violation of fair business practices and avoiding scrutiny by the Competition Authority if abusive discrimination could be proved by the alternative operators.
This led to the creation of one large set of undertakings articulated over sixteen groups of actions.
2009– 2010
Following notification to the European Commission of the proposed remedies on wholesale broadband access and wholesale local loop markets, and the detailed comments of the Commission, some of the Undertakings became formal regulatory remedies based on the market analysis proceeding under Article 7 of the Framework Directive. Indeed, the Commission, while endorsing the non-discriminatory approach underlying the Commitments, formally pointed out in a comment letter41 that voluntary undertakings cannot replace regulatory obligations and clarified that NRAs should notify them of any voluntary undertakings by SMP operators as long as they constitute, directly relate or are ancillary to remedies.42
2011–2012
Work continued on a regular basis to implement all of the Undertakings; at the end of 2011, some Undertakings were considered fully implemented and TI was discharged from potentially heavy sanctions. Monitoring of some key commitments remains in force to ensure the smooth implementation and compliance.
In 2014, the Commitments will be reassessed in the transition to an equivalence of input model, taking into account the publication of the EC Recommendation on non-discrimination43 and the technological evolution of the network and fibre to the cabinet procedures.
10.6 Current developments: FttX and LTE as complementary systems?
10.6.1 Extending the life cycle of copper using fibre
In the period 2009–2013, TI has steadily deployed fiber in its own access network. Primary and secondary network coverage now reach into 0.8 million households; coupled with Fastweb’s 2 million homes passed, this provides for coverage of around 14% of households. However, TI is also laying down copper and the installment of fibre is primarily aimed at deploying a state-of-the-art VDSL-2 network. TI thus intends to extend the life cycle of copper. In addition to the NGA rules adopted by AGCOM in January 2012 (which can be summarized by unbundling of fibre ‘when technically possible’ and an obligation to provide alternative end-to-end services), and in April 2013 (bitstream/VULA over FttH and FttCab, NGAN Access), three sub-proceedings, now contained in the forthcoming market analysis, should further enhance regulatory certainty for future choices:
1. Evaluate the regulatory impact of enhanced VDSL and VDSL2 technologies on TI’s sub-loop unbundling (SLU) obligations. These include VDSL ‘vectoring’ (aimed at eliminating interference or ‘crosstalk’ between copper pairs in a cable), ‘bonding’ (combining several copper pairs to realize a higher data rate), and of the ‘phantom mode’ concept (providing a third communication channel, using a ‘virtual pair’ in addition to the physical pair).
2. Update the BU-LRIC (bottom-up long range incremental costs) model for regulated NGA access products, and provide the definition of areas where there is no infrastructure competition in order to implement geographically differentiated price regulation for virtual unbundled access (VULA) and wholesale broadband access (WBA) at parent node level.
3. Evaluation of the conditions for imposing ‘symmetric obligations’ to provide access to physical infrastructure of which duplication would be economically inefficient or physically impossible.
10.6.2 Mobile broadband deployment
The complementary tier of development to look into is certainly represented by mobile broadband and implementation of LTE (long-term evolution, the fourth generation of mobile telephony). Following an auction in September 2011, four operators are now at work to deploy the new networks (TIM and Vodafone already launched commercial offers in 2012) with different coverage and performance strategies, reflecting differences in the assigned spectrum right of use).
The outcome of these strategies will certainly mark a deep impact on the deployment of next generation access networks, especially in a country like Italy with such a strong mobile foothold.
Already, in several parts of the country the actual difference in terms of data rates between mobile and fixed network is not a major challenge for LTE to bridge. LTE will test the resiliency of fixed networks as we know them.
Throughout the country, mobile networks are being modernized by massive deployment of fibre to connect thousands of base stations and ensure backhaul quality, as well as by incentivizing users to offload mobile traffic to Wi-Fi hotspots connected to the fixed network.
In Italy the 4G coverage requirements – unlike Germany’s, in this case – did not request the operators to start from rural zones. However, today the pattern of 3G usage already shows that mobile broadband is used often for lack of fixed broadband in semi-dense zones or very low-density areas.
10.7 Achieving the Digital Agenda for Europe targets: Italy’s positioning
For a long time, Italy had no formally established Digital Agenda, although it actively participated in the discussion at the European level which led to the definition of the Digital Agenda for Europe. However, in the period 2006–2012 several initiatives were implemented, mainly focusing on reducing the digital divide in southern Italy but with regional plans also addressing the north. In addition, as already pointed out in this chapter, other regional plans in economically important regions, such as Lombardia, Trentino – Alto Adige and Emilia Romagna, started to address next-generation networks, which, with regard to the national footprint, are largely deployed in competition by TI and Fastweb.
The Italian Digital Agenda (ADI) was established in the form of a High Level Steering Committee, a pivotal entity coordinating several public entities44. Another decree (18 October 2012, n° 179 ʻFurther urgent measures for the growth of the countryʼ – cd Growth measure 2.0) established a formal planning process for implementing the ADI. The actions foreseen in the European Digital Agenda are attributed to six working groups: infrastructure, e-commerce, e-government, digital competences, research and innovation, and smart communities. Items of immediate relevance for broadband services include: digital identity, open data, digital education, digital health, digital divide, electronic payments and digital justice.
At the time of writing, the most updated document benchmarking the achievement of the targets of the Digital Agenda for Europe is the Digital Agenda Scoreboard 2013.45
With 13.7 million broadband lines, Italy assumes the fourth position in the EU28 in terms of total lines. In terms of penetration it assumes a position between Slovakia and Portugal with 22.5% against the EU average of 28.8%. In terms of data rates: 83.7% of broadband lines have a data rate at or above 2 Mbit/s; 14.2% are at or above 10 Mbit/s; and only 0.1% is at or above 30 Mbit/s.
In November 2013, the Italian government created a group to monitor the adequacy of investments and efforts to reach the targets of the European Digital Agenda. In January 2014 the group delivered a report which shed a more optimistic light on the take up of faster broadband networks, together with some important caveats.46
10.8 Case analysis
This section takes a deeper look into the current and prospective situation of broadband and ultra-fast broadband in Italy. The bottom line is that, while the existing situation in terms of future-proof infrastructure and innovative services is not entirely encouraging, there are also some positive signs of development.
As mentioned, the role of demographics, with a markedly ageing curve, and unfavourable geography, with many small cities scattered over predominantly hilly or mountainous terrain, are negative factors in broadband development, especially when coupled with the absence of cable-TV. In addition, the impact of two consecutive leveraged buy-outs on the ability of TI to invest in infrastructure has been huge, and might finally result in Telefonica taking full control of the company.
In this complex environment, with regard to prices and overall quality of service, AGCOM played an important role in fostering competition by focussing early on local loop unbundling and by trying to develop a sound ‘equivalence of output’ model. Also, it was probably beneficial for the system to have an integrated regulator able to deal with convergent markets, such as telecom and media, as a single entity.
In the last five years or so, the impact of broadband networks on economic growth is broadly acknowledged (see e.g., Czernich, Reference Czernich2011), the increasing demand for higher data rates, and the EC’s strategy supporting the development of broadband infrastructures (i.e., the Digital Agenda for Europe) raised new challenges within the Italian telecom system. The ʻCaio reportʼ showed that until mid-2009 about 13% of Italian households suffered from the digital divide by being excluded from any kind of Internet connection or being connected at a data rate below 640 kbit/s (Caio, Reference Caio2009).
However, as argued by Tonetti (Reference Tonetti2011), the development of broadband infrastructures has received a new impulse from 2008 on. At the EU level, the European Economic Recovery Plan (Communication COM(2008) 800 Final) along with the Community Guidelines on State Aid rules (Communication 2009/C 235/04), encouraged a new wave of investments in the Italian market, based on the introduction of a series of laws to streamline and simplify the procedures to initiate broadband projects in peripheral areas, at both local and national level (see Laws 133/2008 and 69/2009). Infrastructure development was considered subject to project financing rules and strictly linked to the necessity that technical and organizational structure of projects contribute to a network system open to competition, in line with national and EU laws. However, public and private funding aimed at: (1) technological improvement of public and private communications networks; (2) the provision of advanced information and communication services to the country as a whole; and (3) the reduction of the socio-economic gap among the regions, have been announced several times, but budgets were never or only fractionally allocated and spent. In 2013, after multiple changes in the destination of the funds, a decision was finally taken to allocate a number of appropriations as planned.
On the regulatory level, AGCOM has tried to create a more balanced playing field by enforcing the principle of equivalence of access and non-discrimination (already in 2002, with the decision 152/02/CONS) and subsequently to foster the development of next-generation access networks (NGN) with the implementation of equivalence in access to new NGN infrastructures (Deliberation 731/09/CONS) (see also Bourreau et al. Reference Bourreau, Hombert, Pouyet and Schutz2009, Avenali et. al. Reference Avenali, Matteucci and Reverberi2010a, Reference Avenali, Matteucci and Reverberi2010b). In fact, AGCOM imposed on TI the obligation to provide access to ducts, as well as to dark fibre, to alternative operators intending to deploy fibre networks. Moreover, in line with the European Commission’s Recommendation on regulated access to next-generation access networks (C (2010)6223 – 2010/572/EU) and the accompanying document (SEC(2010) 1037 final) and the related Communication C(2010)472, AGCOM incentivized co-investments, although it did not impose any obligation for the unbundling of new fibre networks. This decision may be reconsidered when commercial products for managing different wavelengths become available on the market. Nonetheless, TI has been forced to provide to alternative network operators end-to-end NGAN services and bitstream/VULA (virtual unbundled local access) services as of 2013.
Nowadays, the deployment of NGA is widely considered an innovation with potential positive economic growth especially at a time of wide economic-financial crisis. Moreover, a wide debate has developed in recent years about the different degrees of public involvement in the investment strategies for NGA, at both national and municipal (or regional) level. As illustrated by Nucciarelli et al., (Reference Nucciarelli, Sadowski and Achard2010) local governments can take the lead or at least stimulate broadband initiatives, for instance by promoting public Wi-Fi networks in specific spots, as for instance the Province of Rome47 did. This is also possible because of flexible and alternative models for public-private partnerships. Sharing stakeholders’ competences and allowing public actors to create the basis for provision of a public service is a prerequisite to exploit efficiencies in management and operations carried into the projects by private investors. In a nutshell, public-private partnerships can be considered as an alternative method to provide access to a variety of infrastructure resources and, by their own nature, they force a look at the long-term implications of broadband initiatives, also in terms of policy strategies.
This is one of the rationales behind the on-going debate at the central government level about the implementation of a package of stimuli for GDP growth in the upcoming years. The intention to foster the deployment of broadband infrastructures confirms at least two main factors in investment trends, not only at the Italian level but also at the EU28 one. The first factor deals with raising the importance of public commitment. Large (but also local) projects cannot be made operational without public funding as it helps to remove barriers to private investments, especially in grey and black areas, as the Commission observed in its 2009 Guidelines. Moreover, public funding could play a key role in the deployment of NGA especially where high costs make outlays for municipal (or regional) Fibre-to-the-Home networks unfeasible and unmanageable for private operators. However, the sustainability of an Italian Internet model does not only rely on the degree of sustainability of investments. In fact, as also argued by Caio and Sideri (Reference Caio and Sideri2011)48, there also exists a digital divide different from the geographical one. About 40% of Italian families do not own a personal computer, which has a significant impact on the digital divide of people in terms of computer and Internet skills. The degree of digital literacy also impacts on demand growth and its qualitative evolution. On a more positive note, the massive take-up of smartphones, and increasingly of tablets, compensates for the initial lag in PC penetration. Recent data continue to show that the percentage of micro-companies that are still not using the Net or, in some cases, do not own a computer, is extraordinary – up to 20% in some regions. This is more a cultural divide than a digital divide based on the lack of high-speed broadband.
10.9 Conclusions
The development of monopolistic markets is always closely linked to the investment strategies implemented by the single player. Infrastructure and services development as well as R&D activities and the evolution of demand themselves closely depend upon the actions taken in the market by the monopolistic player.
The Italian telecom sector – as in all countries where a state-controlled carrier operated with legal monopoly status – has evolved over decades, following the highs and lows of TI which for many years has been responsible for the innovation of the telecom and related sectors. After market liberalization occurred, the market opened to competition leading to a gradual reduction of prices for end customers, but also to the fragmentation of the investment actions taken to update infrastructures using emerging technologies and demand expectations.
The development of the broadband sector followed a path of initial high growth due to the action of the incumbent TI and successive slow-down as a consequence of the lack of leadership by TI in the ICT (Information and Communication Technology) ecosystem. Multiple investors (both public and private) stepped into the market and service providers proliferated to intercept the added value created by integrated communication solutions and interoperable systems and technologies.
The broadband sector currently suffers the lack of platform competition, as no cable infrastructure exists. Competition between xDSL and fibre exists since the early stages of the broadband development and has been characterized by a preliminary deployment of fibre connections (i.e., Fastweb and the Socrate project) but then became depressed by fragmented initiatives in support of demand.
These initiatives were not aimed at stimulating new demand for higher data rates nor to target the specific barriers to adoption of specific demand segments (household income, digital literacy, insufficient quality of e-government), as analysed in Dolente et al. (Reference Dolente, Galea and Leporelli2010) and Leporelli (Reference Leporelli2010) but rather at decreasing the prices to be paid by the generality of final customers (even those with greater willingness to pay and/or located in high-cost areas) to the benefit of low-quality xDSL connections. Accordingly, repetitive, inefficient and indirect demand support to the generality of customers, along with the lack of stimuli for an infrastructural upgrade, targeted both to the areas in which NGA infrastructure (FttC in most cases) will be sustainable and to improve the average quality of basic broadband connectivity available to actual users, has led to a gradual decrease of innovation, which has resulted in stand-alone and regional initiatives by both the incumbent and its competitors. Thereafter, demand did not develop due both to a substantial lack of infrastructures (largely not being developed because of demand uncertainties) and to a low degree of digital literacy and willingness to pay of low income or elderly households.
To resolve the current stagnation in investments and in leadership, two main points should be considered:
– the reduction of the digital divide among the population, aiming at increasing the digital skills of the younger generation as well as the elderly with programmes to be tailored to their specific needs (avoiding ‘digital crusades’ with untargeted funding); and
– the creation of a legislative and policy framework within which public and private stakeholders can develop investment strategies and schedule operations for the medium-to long-run.
References
1 See Section 10.3 for details.
2 Sources: AGCOM, 2Q 2013 and, for capacity and IP addresses, Akamai’s Second Quarter, 2013 State of the Internet Report.
3 All data in this paragraph sourced by AGCOM, 2Q 2013.
4 Source: ISTAT, the National Institute of Statistics.
5 Source: Le tecnologie ICT nelle Imprese e Cittadini e nuove tecnologie, ISTAT 19 December 2013.
6 Source: AGCOM.
7 The TACS service started in 1990. While Telecom Italia was created via the incorporation of four different companies in July 1994, TIM – Telecom Italia Mobile – was established in 1995; at the same time as GSM was launched in Italy.
8 Other local networks had temporary connections, also via satellite, already in 1982.
9 Garante per l’Editoria.
10 Source: AGCOM, 2Q 2013.
11 Bank foundations are a type of not-for-profit organization with a particular fiscal structure.
12 Source: TI’s Financial reports 2006.
13 Source: TI’s Financial reports 1Q 2013.
14 The ambitious broadcasting/broadband network platform project Socrate was to deploy fibre-optic and coaxial cables in the 19 biggest Italian cities, with the target to reach about 10 million people by 2002. The network was meant to have a data rate of 1.5 Mbit/s download and 64 kbit/s upload, providing cable TV programmes and interactive services, and increase the company value within the scenario of the upcoming liberalized market. Right after the privatization had started in 1997, however, the Socrate project slowed down due to changes in Telecom’s governance structure and the deployment of xDSL systems over copper networks to enable fast Internet connections to both residential and business customers.
15 AGCM, Provvedimento n. 9142 (C4158) Seat Pagine Gialle/Cecchi Gori Communications, Aug. 2000.
16 In terms of absolute variation, always with reference to the 2003–2004 period, the highest increases were recorded in France and in the United Kingdom, immediately before Italy. Source. AGCOM’s annual report, 2005.
17 Source: SEC(2006)193, Annex to the Implementation Report, EC.
18 Source: AGCOM, data at 2Q 2013.
19 H3G withdrew early in the auction for 800 MHz frequencies but purchased rights of use in the upper bands.
20 Source: TIM October 2013.
21 Source: AGCOM.
22 See Leporelli and Reverberi (Reference Leporelli and Reverberi2004a and Reference Leporelli and Reverberi2004b) for an analysis of the replicability conditions.
23 Since 2001 AGCOM has mandated unbundling of the local loop (LLU) and the wholesale offers; retail offers were regulated at the time but this is no longer the case.
24 Although several areas in the north, especially Alpine valleys are still underserved. Ciapanna and Sabbatini (Reference Ciapanna and Sabbatini2008) analysed the development of Italian telecom regulation framework by highlighting the main changes in the Italian law system. They also illustrated the main interventions at national and regional level and explained how the legislation and regulatory environment evolved across the years 1995–2009.
25 Source: ITU, 2005.
26 Source: ISBUL, 2010. The ISBUL (Infrastrutture e Servizi a Banda Larga e Ultra Larga) project was a research initiative initiated in 2009 by the AGCOM to unravel the main determinants of the Italian broadband sector. With a total funding of about EUR 700,000, the project was led by the University of Rome ‘La Sapienza’ and put together academics from different universities, doing research on broadband economics (www.progettoisbul.net).
27 See for example the D.Lgs 198/2002.
28 CIPE (Comitato Interministeriale per la Programmazione Economica) is a committee made up of representatives of different ministries with specific competences in the allocation and management of funds to be spent for public investment projects. CIPE Decision n.83/2003 regulated the programme.
29 Sviluppo Italia S.p.A. was established in 1999 to attract foreign investments and foster the industrial development of southern Italy. In 2007 it was renamed into Invitalia S.p.A. (Agenzia nazionale per l’attrazione degli investimenti e lo sviluppo d’impresa).
30 Infratel S.p.A. (Infrastrutture e Telecomunicazioni per l’Italia) is an in-house company of the Ministry of Economic Development and it is responsible for carrying out the Broadband Program.
31 Source: ISBUL, 2010.
32 Comitato interministeriale per la banda larga.
33 Nucciarelli et al. (Reference Nucciarelli, Sadowski and Achard2010; Reference Nucciarelli, Castaldo, Conte and Sadowski2013) analysed regional projects (e.g., Progetto Banda Ultra Larga Lombardia, Trentino Network, Lepida Emilia Romagna, Terrecablate Siena) variously developed in the last decade to elaborate on the role and function of public-private interplay and to investigate the main threats to local broadband initiatives. The analysis organized the findings into four main categories (i.e., project targets, governance mechanisms, network structure, and provision of services) according to the conceptual framework illustrated in Nucciarelli et al. (Reference Nucciarelli, Sadowski and Achard2010).
34 For a list of European Commission’s decision on the compatibility of State Aid regulation with Italian regional projects see Nucciarelli et al. (Reference Nucciarelli, Castaldo, Conte and Sadowski2013).
35 Separation aims to reduce the vertical integration of companies. To reach this aim, different forms of separation have been adopted ranging from less (accounting) to more (ownership) intrusive ones. Functional (or operational) separation consists of the gradual splitting up of a vertically integrated company along the lines of its operational practices. This form of separation can be implemented in various degrees (e.g., creation of a wholesale division, business separation) and lead to the legal separation of business units (see also Cave, Reference Cave2006). Literature has investigated the potential impact of separation on investment incentives (Tropina et al., Reference Tropina, Whalley and Curven2010), its possible disadvantages (CEPS, 2008), and other European experiences (Whalley and Curven, Reference Whalley and Curven2008; Cadman, Reference Cadman2010; Teppayayon and Bohlin, Reference Teppayayon and Bohlin2010).
36 BEREC guidance on functional separation – BoR (10) 44, 7–8.
37 EC Regulation n.1/2003.
38 Functional separation as a regulatory remedy is now possible in the ʻnew’ regulatory framework (2009 Review).
39 See for instance Public hearing, Lower House, Italian Parliament, 30 Sept 2008 (Resoconto della IX Commissione permanente (Trasporti, poste e telecomunicazioni) 30 settembre 2008).
40 Decision 718/08/Cons.
41 See Press Release IP/09/1613, containing links to relevant material.
42 Interactions between NRAs and the European Commission in case of voluntary separation are now dictated by the new art.13b of the Access Directive.
43 Commission recommendation on consistent non-discrimination obligations and costing methodologies to promote competition and enhance the broadband investment environment – C(2013) 5761.
44 The Minister for Economic Development, The Minister for Public Administration and simplification, the Minister for territorial cohesion, the Minister of Education, Universities and Research and the Ministry of Economy and Finance.
45 Brussels, 12.06.2013, SWD(2013) 217 final Commission Staff Working Document.
46 The English version of the report (slides) is available at www.slideshare.net/Palazzo_Chigi/achieving-the-objectives-of-the-digital-agenda-for-europe-dae-in-italy-prospects-and-challenges.
47 In Italy, a province is an administrative territory, roughly equivalent to a county in the UK, with similar heterogeneity in terms of population and size.
48 See also Caio (Reference Caio2009).
11 France
11.1 Introduction to the case study
This case study aims to provide deep insights into the dynamics of French broadband markets, which in turn could provide valuable inputs into the policy and regulatory debate on how to stimulate broadband development leading to the realization of the Digital Agenda for Europe with a 2020 target.
The past few years have seen major transformations in the French broadband industry and in French regulatory governance more generally. On the industry side, major changes have been necessary to the strategies of actors to adapt core networks to support the new fixed and mobile access interfaces. On the regulatory side, changes in the French broadband markets have been evolutionary. They are characterized by a complex interplay between public and private actors.
The industry currently faces two major issues:
– The first major challenge is the development of ultra-fast broadband networks, fixed and mobile. It requires balancing the objectives of competition, investment and planning, and therefore consideration of ways, from a regulatory perspective, that ensure the deployment of open networks to be used in the long-term;
– The second issue concerns the relations between the different actors in the value chain (suppliers, operators, service providers, content producers, consumers or users) whose strategies raise complex issues including that of the ʻneutralityʼ of the Internet and more generally of electronic communications networks.
The French case study aims at identifying and analysing the challenges and dynamics of the trajectories of fixed and mobile broadband markets through a set of key indicators and an economic analysis of the competitive and regulatory developments of the industry.
The goal is to discuss these trends and their consequences for the industry trajectory in order to provide a comprehensive analysis of French broadband markets based on up-to-date information.
This study is expected to address in particular the role of regulation and competition in the uptake and developments of next-generation fixed and/or mobile broadband networks. It includes in particular the following key highlights:
– Identifiying of new market patterns;
– Analysing of firms’ strategies;
– Analysing the role of public actors as key players in broadband markets;
– Showing the regulatory approaches and explaining how they impact investment and competition within the markets;
– Providing an understanding of the attitude of incumbent players regarding the open access initiatives and the regulator’s measures to promote partnership and shared infrastructure.
The French case study investigates the following research question: How does broadband market regulation affect competition and industry structure? To answer this question, background data on telecom metrics has been used.
The material presented here is intended: (1) to consolidate and disseminate the latest developments in French broadband markets; (2) to share experiences and lessons learned from the deployments of the broadband technologies; and (3) to analyse the broadband markets in a comprehensive and detailed manner so it can be useful for comparative studies in this area.
The French case study consists of the following sections. In this section, we sketch the case by introducing the main trends and stakes in matters of economic and social benefits and market competition. In Section 11.2, we put into perspective the historical development milestones that led from narrowband to broadband. In Section 11.3, we depict the major stakeholders from the public and private spheres in order to better understand their interactions. In Section 11.4, we distinguish the main kinds of next-generation access technologies and consider Orange’s civil engineering infrastructure features. These elements are essential to understand the main stakes in broadband deployment considered in Section 11.5. In Section 11.6 we review broadband regulation mechanisms and infrastructure sharing. In Sections 11.7 and 11.8, we discuss successively the market risks and dynamics and investment strategies before analysing the impact of broadband regulation mechanisms. Section 11.9 addresses the achievement of the Digital Agenda targets. In Section 11.10 the current market dynamics are discussed and in Section 11.11 the case analysis is provided and some remarks about lessons learned, possible generalizations and recommendations conclude the case.
11.2 Main trends and major stakes
11.2.1 Digital economy benefits
The digital economy represents about EUR 115 billion or 6% of GDP in France and nearly 300,000 direct and indirect jobs1. It is one of the most dynamic sectors, providing high added-value products and services. In particular the Internet is the cause of one quarter of growth in France between 2000 and 2008 (COE-Rexecode, 2011). The investment corresponding to the digital infrastructure and equipment (core networks, backbone networks, terminals) can be estimated to be at least EUR 50 billion in this decade (IDATE, 2010).
In France, the revenues from the digital economy are estimated at EUR 97 billion or 5% of GDP. In this number, electronic communications services represent a turnover in the final market of nearly EUR 45.1 billion or 2.3% of GDP. The electronic communications operators invest around EUR 6.5 billion per year and accounted for 128,810 direct jobs in 2012. This sector is of vital importance to the development of fast and ultra-fast broadband Internet, fixed and mobile services.
Broadband market growth in France is mainly driven by digital subscriber line (DSL) offers. It results in access-based competition that seeks to promote local loop unbundling (LLU). The widespread availability of LLU has helped to increase both competition and innovation, providing operators with direct access to the copper pairs. Sector-specific regulation has helped operators to move up the ladder of investment by maintaining economic leeway between wholesale offers for accessing the local copper loop and the regional counterpart, bitstream. In addition, the Fibre-to-the-Home (FttH) networks are expanding quickly and have been deployed across more than 9,900 km of roadway, although these roll-outs are currently concentrated in the country’s most densely populated cities.
In 1Q 2013 the fixed broadband market included over 30.9 million households covered, nearly 24.22 million subscribers to high-speed broadband Internet and 1.705 million subscribers to ultra-fast Internet, all operators and all technologies combined, including:
– 365,000 Fibre-to-the-Home (FttH) or Fibre-to-the-Building (FttB) subscribers;
– 675,000 other subscribers at data rates greater than or equal to 100 Mbit/s;
– 665,000 other subscribers at data rates between 30 and 100 Mbit/s;
– 385,000 other subscribers with cable, Wi-Fi, satellite or radio-based local loop.
11.2.2 Market boosters
Because of consumers’ growing demand for content and higher data rate access, the market is moving to ultra-fast broadband solutions with the deployment of new optical fibre in the local loop. Ultra-fast broadband already makes it possible to achieve relatively high symmetrical bitrates. It helps to stimulate the development of enhanced services, particularly in the broadcasting area, including the simultaneous reception of several high definition channels.
The mobile market has had strong growth with the explosion of data traffic made possible through the deployment of 3G networks (introduced in 2010), availability of terminals adapted to new uses and the establishment of offers more attractive to consumers. Indeed, the continuous improvement of mobile networks and the availability of end-user terminals with better performance pushed the offer for data-oriented services with data rates similar to fixed access networks in a mobile environment. Today, mobile service offerings can largely meet the end-user demand in terms of traffic. The following drivers are boosting the mobile broadband traffic:
– The market shares of smartphones, tablets and dongles are experiencing significant growth;
– Video-sharing platforms based on user generated content are succeeding;
– Internet browsing and access to emails lead the growth of broadband subscriptions;
– Social networking and microblogging are essential mobile applications; almost 45% of French Internet users visited a social network in 2013 (CREDOC, 2013).
11.2.3 New competition challenges
A key question is whether the entry in 2010 of a fourth mobile operator – Free Mobile – increased competition to benefit consumers. Prices in France are indeed above the European average and tend to favour large consumers. To what extent can the new entrant destabilize the mobile market? Because the incumbents are strong, the new entrant, given its size, probably would be the first to disappear in case of a price war. France Télécom and Free willingly signed a 2G roaming agreement, which has been extended to 3G roaming. Indeed, Free Mobile has been recently granted national roaming rights on the 3G network of France Télécom2 as a means of completing the footprint of its own 3G network, i.e., to complement its own network coverage obligation of 25% of the population. Will this agreement help spur a new momentum in the French mobile market? Has the French mobile market still significant growth potential? These are a few questions that we aim to answer in this chapter.
The issue of deployment of open networks is arising even more acutely in the case of ultra-fast fixed Internet. Indeed, the deployment of these new networks must not lead to a weakening of competition and even less to a remonopolization of the local loop. It is essential in this context to ensure that the final part of optical fibre networks into homes and businesses, which forms a potential bottleneck, is open and technologically neutral, while preserving incentives for investment and infrastructure competition. This requires regulation to set some ex-ante rules to provide certainty and visibility to the actors.
11.2.4 Economic model renewal
Successful long-term deployment of broadband networks raises the crucial question of the underlying economic models based on the interplay between contents and networks: the deployment of ultra-fast Internet makes possible the explosion of new uses. Conversely the existence of attractive content stimulates the appetite of consumers for ultra-fast services and supports the deployment of networks. In this context, the question is about sharing value and financing networks between the various links in the value chain. Where operators occupy by nature an important role in the deployment of next generation networks and the marketing of next generation services, the French case study intends to show that local authorities have a key role to play in the successful deployment of FttH, in particular in rural areas, as confirmed by 78% of mayors in the rural areas, who consider the availability of fixed broadband a priority for their town.
11.3 Historical developments: from narrowband to broadband
11.3.1 Key milestones of the French telecommunications industry
The history of French telecommunications is largely that of political intervention in scientific progress. Political control over telegraphic services was pursued as early as 1837. The French king, Louis-Philippe, perhaps saw this as a logical extension of the control of the press, which Charles X had initiated as part of the July Ordinances of 1830. State monopoly of telegraphic services, for military and political reasons, was finally established in 1851. The French Post Office gradually absorbed the telegraph service, one minister becoming responsible for post and telegraph service in early 1879.
Between 1890 and 1915 the number of phones in France more than doubled every five years, rising from 15,400 to 357,500. However, the distribution of phones in proportion to the population was modest. One of the main reasons for this slow growth was the method of financing networks. The cities that wished to acquire a telecommunication system had to provide the administration with the initial financing. The administration later reimbursed the locality in proportion to the receipts from subscribers to the new network. Unequal distribution of phone networks across the country and lack of inter-regional connections resulted from this approach.
Between the two World Wars the French Government policy ensured that the telephone service was geared more closely to the needs of the commercial and industrial sectors, and that modern services were provided to all at the same price across the country. The setting of more, and better quality, lines was also begun, using underground cables. Arteries of lines radiating from Paris to many regional telephone exchanges were constructed between 1924 and 1938. Finally, the replacement of manual by automatic exchanges was gradually achieved, using the rotary system.
Paris, its suburbs and eventually the main provincial centres saw their exchanges automated from the 1930s. In the countryside, however, the problem of modernizing 25,000 exchanges, half of which supported less than five subscribers, had to be approached differently and a semi-automatic system resulted. Nevertheless, France still had one of the lowest ratios of phones to people in 1938 with 3.79 per cent whereas the United States had 15.27 per cent, Sweden 12.47 per cent, and the United Kingdom 6.74 per cent. Most French phones were used for business purposes and in the home the phone barely penetrated below the upper middle classes. Most phones were to be found in urban areas of northern France; elsewhere, only the exclusive resorts, such as Biarritz, Nice, and Cannes, were well-equipped.
French telephone, telegraph, and radio communications services suffered greatly from World War II. The cable network suffered similarly, with equipment and buildings destroyed or badly damaged. In the several post-war economic plans, no priority was given to the telecommunications sector and between 1947 and 1966 only 0.2 per cent of the country’s gross national product was spent on telecommunications. However, the creation of the Centre National d’Etudes des Télécommunications (CNET), now Orange Labs, in 1944 was all-important in encouraging further experimentation. From the mid-1940s new technical advances were made as a result of this official collaboration with the French telecommunications and electronics industry. The first coaxial links connected Paris to Toulouse in 1947 and coaxial cable gradually replaced the old paired wire. Shortly thereafter NATO financing ensured the development of transatlantic coaxial connections.
In the mid-1960s digital switching experiments had begun in France and by 1970 fibre-optic cable began to be used to support signal transmission. This research was paralleled by work at CNET into the problems of fully electronic, i.e., digital, connections. The national operator had an under-equipped infrastructure due to delayed technological development, which represented around two per cent of France’s gross national product. However, at that time the system began to be modernized as part of a long-term digitalization strategy.
11.3.2 Towards the modern era
By 1986 France had 25 million main lines which supported the connection of 96 per cent of French homes, as well as the development of many innovative products and services, such as the Teletel videotex system. From 1983 Teletel began to replace paper phone directories and its Minitel terminals were purchased in substantial quantities to create a largely captive market. In 1989 the Teletel system boasted a total of 85 million connection hours through 5 million terminals. The connection of Teletel to Transpac, the French national packet-switching network, implied that subscribers throughout the country could use other services, regardless of distance. National and international business connections combining voice and text distribution via the ʻNumerisʼ ISDN system became possible, although full utilization would have to wait until the mid-1990s.
Such successes can be attributed to a consistent and monopolistic government policy and efficient investment in telecommunications equipment. By the 1990s, France’s hundred per cent digital phone system was among the most modern in the world. Yet, events in the telecommunications world would soon overtake the company and its monopoly. The burdens of bureaucracy soon left the company struggling to catch up with the rest of the worldwide industry, already undergoing a process of deregulation and privatization that would transform the nature of the telecommunications business. Eyeing the success of other recently de-nationalized telephone providers, particularly the British system, and the telecom activities of the BPO, now renamed British Telecom, the French Government adopted a new name, France Télécom, giving it at least the appearance of keeping up with modern industry trends.
Demands for full deregulation of the European telecommunications industry resulted from the Commission of the European Communities (CEC) Green Paper in 1987. In part, the inability of monopoly organizations to cope with rapid technological change, and also the need for competition essential to support an economy driven more by information than production has contributed to these moves.
The French law passed on 2 July 1990 on the organization of public posts and telecommunications services transformed Direction Générale des Télécommunications into a public-service carrier with corporate legal status under the name France Télécom. This legal reform substantially changed the contractual relations between France’s national operator and its partners. From 1 January 1991, these relations became governed by the French concept of ’private law’. Thus, from that time France Télécom gained budgetary, managerial, and organizational independence, like most of its European competitors. Yet the company remained under the guardianship and tight control of the Ministry of Posts and Telecommunications. The company’s monopoly status remained intact.
France Télécom faced the loss of portions of its monopoly after 1993, under the terms of the European Community’s Open Network Provision of 1989 which guaranteed to all value-added network (VAN) service providers equal access to their countries’ telecommunications infrastructure. The supply of terminal equipment, such as telefax machines and telephone handsets, and VANs’ services such as home banking, then became open to competition, although strictly licensed. Competition in the provision of computer data transfer was also allowed, provided that private firms did not undercut France Télécom.
In the late 1980s and early 1990s the French telecommunications industry tried to achieve the international scope necessary to compete in new markets such as car telephones and radio-telephone paging equipment. France Télécom emerged as one of the world’s top four public telecommunications carriers.
During the late 1990s, France Télécom found itself rushing to catch up with many of the major developments in the telecommunications industry. In particular, the company was very late to the Internet table, a lateness blamed on the company’s complacency with its Minitel ‘cash cow’. But the Minitel service, which had not seen any significant technological advancement since its introduction in 1983, quickly paled in comparison to the Internet, and particularly with the rise of the World Wide Web. In May 1996 France Télécom finally introduced its own Internet service provider, dubbed Wanadoo. The company also joined the growing wave of mergers and partnerships sweeping the telecommunications industry, announcing its intention to form a partnership with Deutsche Telekom and Sprint Communications, called Global One.
In 1997 the company joined another joint-venture partnership, Infostrada, formed by Olivetti Corporation and Bell Atlantic, which brought the company into Italy’s recently deregulated telecommunications industry. During the 1990s, France Télécom began entering international markets including Argentina, Mexico, Indonesia, Senegal and Vietnam. In recognition of its own growing international nature, the company removed the accent aigu from the spelling of its name, becoming France Telecom in 1993.
In the meantime, France Telecom, or at least its management, eyed with some envy the developments of the European telecommunications industry, as country after country denationalized their telephone carriers and ended their government monopolies, a process culminating in Deutsche Telekom’s deregulation in 1996. An initial attempt to end French government control of the company and bring the company to the stock market was brutally rebuffed by France Telecom’s own employees, 75 per cent of whom participated in a strike protesting the move which would end their civil servant status. The next attempt to denationalize the company had to wait until 1995, and again was quashed by an employee strike. But several months later the French government passed a new law transforming the company into a Société Anonyme. This event took place on 1 January 1997. It resulted in a public company in name if not yet in fact. The date for the company’s entry on the Paris Bourse was set for June 1997 for a sale of shares worth from FFR 25 billion (EUR 3.8 billion) to FFR 40 billion (EUR 6 billion), the largest public offering ever in France.
France’s government, led by the right wing, seemed prepared to allow France Telecom to leap into the new telecommunications era. However, the national election of May 1997 brought the Socialist Party to power, vowing to stop, or at least to postpone, the public offering. Although placed on hold, France Telecom’s public offering (which would result in the French government’s share being reduced to some 55 per cent) seemed inevitable and likely to occur before the European Union’s 1 January 1998 deadline.
11.3.3 From France Telecom to Orange
The Direction générale des Télécommunications became France Telecom on 1 January 1988. France Telecom provided fixed telephony services and was also moving towards mobile services and the provision of Internet access. Between 2000 and 2003, the purchase of Orange (UK) gave a new dimension to the company, which became the leading ISP despite a fierce price war.
In September 2004, the French state sold some of its shares so that it would not be the majority shareholder any more. Hence France Telecom became a private company – 115 years after its nationalization the phone became private again in France. A number of important corporate events followed.
On 27 July 2005 France Telecom announced the takeover of 80% of the mobile phone operator Amena, which had 24% of the market in Spain, for EUR 6.4 billion of which EUR 3 billion corresponded to a capital increase.
By 2005 France Telecom was the second-largest ADSL operator worldwide, after China Telecom and before SBC Communications, and the first European ADSL operator, according to the company Dataxis France.
Since 1 June 2006 France Telecom has been commercializing all its products and services outside France under a single brand: Orange.
In June 2007 the French state sold another 5% of its France Telecom shares. As a result the public shareholding (French state and ERAP) represented 27%. At the same time, France Telecom sold Orange Netherlands and bought out the Spanish Internet service provider Ya and the Austrian mobile phone operator One.
On 21 September 2010 France Telecom contributed up to 40% of the capital of Meditelecom (with the Méditel brand), the second mobile phone operator in Morocco. When the operation was set up, Meditelecom had 10 million customers. The agreement planned that France Telecom would increase its share to 49% of the capital by 2015.
In February 2012, the fixed-line telephony services came under the Orange brand. Since then all solutions marketed by France Telecom have been using this brand. On 1 July 2013 Orange became the new name of the group.
11.3.4 Decisive reforms and liberalization policies
The transformation of France Telecom from a monopoly provider of public services into a provider of services to consumers in a competitive market took place gradually and with some difficulty. Since 1998 the telecommunications market in France has been fully competitive in accordance with the EU directives. However, as the cost of installing infrastructure is very high, the competition has chosen to build its own backbone cable and optical fibre network and has not chosen to build its own access infrastructure. Therefore, the opening of the market was essentially based on the provision of France Telecom’s infrastructure to its competitors. In other words, France Telecom was instructed to allow competitors to use its network, providing them with access to the telecommunications market and allowing them to propose access offers based on its facilities (using France Telecom’s wholesale offers, unbundling, etc.).
The constraint imposed on France Telecom was essentially legislative and regulatory. The system was and is still based on the imposition of rules by the French government and the European Union. Economic frameworks have been put in place by the government to apply the appropriate regulation (e.g., validation of interconnection rates, validation of wholesale tariffs). A strict enforcement of the rules by the French regulator (ARCEP) and the Competition Authority (especially by denunciation of competitors) has been put in place. As a result, France Telecom has been repeatedly condemned to heavy fines for obstructing free competition.
11.4 Major stakeholders in broadband development
11.4.1 The French government and the regulator
The parliament, the government and the regulator have worked to facilitate the access to ultra-fast broadband by the population and businesses.
The law for the modernization of the economy of 4 August 2008 required the pooling of FttH networks and the access to fibre for new buildings. It creates a ʻright to fibreʼ based on the same principle as the ʻright to the antennaʼ. The law on the fight against the digital divide (Pintat Act) of 17 December 2009 aimed to prevent the emergence of a new digital divide. It defined the digital territorial coverage master plan and created the digital development fund for territories (FANT) to finance the deployment in areas not covered by private initiative. Moreover, the government set goals for the deployment of very high data rates on the whole territory – 70% of the population to be covered in 2020 and 100% by 2025 – and made this a priority of the program of investments for the future.
To achieve these objectives, the government introduced a national ʻhigh-speedʼ plan in June 2010 to concomitantly stimulate investment by operators beyond the densest areas and to support digital development projects driven by local authorities. Furthermore, the state has mobilized EUR 900 million in subsidies for future investments through the National Fund for the Digital Society (FSN) to support public initiative networks (PINs) that are complementary to deployments based on private initiative.
To take into account the expectations of local authorities, expressed through their associations, the government has made the following decisions3:
– Regional advisory committees for regional digital development (CCRANT) involving local authorities and operators have been put in place in areas under the authority of the Préfet, which guarantees the coherence of projects and good coverage of all territories. Their purpose shall be to promote the quality of the dialogue between the private and public operators and ensure the proper implementation of commitments;
– The maximum co-financing ceilings were raised from EUR 350 to EUR 433 per outlet in order to better take into account the situation of the most rural areas. In addition, the maximum amount of this intervention is doubled for the connection of businesses located in areas of activities intended to be labelled ʻhigh-speed activity areaʼ and tripled for priority education and health buildings;
– The rates of assistance applicable for the overseas departments were increased to take into account their specificity. In addition overseas communities not currently connected to the Internet by submarine cable could file a grant application specifically for this purpose.
The funded ʻhigh-speedʼ national program was published on 1 July 2010 and had three components:
– To stimulate investment of network operators outside densely populated areas. Non-subsidized but long-maturity loans may be granted to high-speed network operators, active outside the very densely populated areas. They will enhance the investment capacity of operators or of delegated public initiative networks. This component amounts to EUR 1 billion and was opened in summer 2011;
– To support digital development projects of local authorities. Funding will be provided to support the projects of local authorities that are complementary to the deployments based on private initiative. This financial support is mainly intended for the deployment of fibre networks to the subscriber. In addition, the public initiative projects may contain the deployment of alternative technologies to improve the quality of broadband access (wireline network modernization, deployment of wireless networks or satellite equipment). This component amounts to EUR 900 million and was also opened in summer 2011;
– To ensure coverage of areas which are the most difficult to access. Research and development work dedicated to satellite technologies have been funded to continue covering sparsely populated areas. This is a component of the digital national fund with EUR 100 million, of which EUR 40 million was allocated in 2011 to prepare the next generation of satellites dedicated to provide access to high-speed internet.
As the incumbents are the major players regarding FttH, their strategies are being monitored closely by ARCEP, the French regulator, in deciding to define strong measures if and when necessary. ARCEP was created in 1997 as an independent administrative authority responsible for (among other tasks):
– defining the conditions of access to lines and therefore today’s FttH deployment and sharing of new FttH networks;
– determining the specific obligations to be imposed on operators identified as having significant market power (SMP). It is important today in facilitating broadband deployment, whereby obligations are imposed on Orange regarding access to civil engineering infrastructure or access to the sub-loop of its copper access network.
Moreover, ARCEP leads the GRACO group which was set-up for the exchange of information between ARCEP, local authorities and operators4.
11.4.2 Public and private stakeholders
The telecommunications market was opened to competition in January 1998 and since July 2003 operators are no longer subject to authorization. Each operator has the ability to define its investment projects without being subject to roll-out or coverage obligations. Only operators that use radio frequencies may be subject to such obligations; this applies to mobile operators and network operators using terrestrial radio fixed access.
Among the operators that deploy networks a distinction can be made between:
– operators active in the retail market, including the major national operators (i.e., Bouygues Telecom, Free, Numericable, Orange, SFR) which have already begun the deployment of high data rate networks, mainly in large cities; and
– wholesale-only operators, usually led by a local authority, deploying wireless networks to offer wholesale services to operators in the retail market (e.g., Altitude infrastructure, Axione, Covage, SFR Communities, Tutor).
Among the suppliers of Internet access are the large national operators, but also local and specialized operators. End-users can generally benefit from different competing service offers on the same access network.
11.4.3 Local authorities
The deployment of new networks is a major industrial and financial project that involves both private operators and public authorities at various levels, including local authorities that are key stakeholders in the digital development of their territory. They can often play a major role in the deployment of ultra-fast Internet.
Since 2004, the French legislative framework has allowed communities to act as operators in the electronic communications sector. This has never been the case before. From that moment they have been able to reinforce their action in relation to regional digital development in the field of high and very-high data rate networks.5 Local authorities can play a decisive role in furthering regional development by enabling the broadband roll-out by operators through measures that encourage them to share their resources. They can also provide local information on underground infrastructure, help coordinate civil engineering works, install ducts for future use, authorise less costly civil engineering infrastructure and wiring on building facades, and encourage the pre-installation of fibre in new buildings and in buildings undergoing major renovations.
Many communities have begun thinking about the deployment on their territory of new ultra-fast networks. According to the law on the fight against the digital divide, this thinking is to be reflected in the development of master plans. Twenty projects of ultra-fast public initiative networks have already been built or are being defined. Some of them are conducted on a departmental or regional scale and deal with more than 100,000 lines.
Local authorities are involved at several stages (ARCEP 2011a). First of all, they develop, usually at the departmental level, the digital territorial development master plan (SDTAN) under article 24 of the Law on the fight against the digital divide of 17 December 2009. These indicative documents are essential. They provide an inventory of existing networks and of digital coverage. Moreover, they identify projects in progress or being planned. They also present the vision of the territory in matters of digital coverage and include action scenarios on how to achieve the vision, according to a strategy to promote consistency between private investment and public intervention. Subsequently, local authorities are consulted by the operators while they are deploying their networks. Finally, local authorities may decide to take a public initiative for network deployment, such as the law allows in accordance with the regulatory framework. These networks enable FttH deployment beyond the territories that would be covered by private operators. They also allow meeting the expectations of the population in the territories that will not benefit in the short term from fibre deployments, through the implementation of alternative solutions providing higher data rates.
Local authorities’ financial contribution to FttH roll-outs in more sparsely populated areas could be decisive and depend on:
– the role of the Caisse des Dépôts in helping local authorities to finance fibre deployment projects;
– the possibility of public-private partnerships with minority public funding in order to deploy fibre.
Local authorities can also help operators in their fibre roll-outs:
– by providing field studies identifying the best configurations and available infrastructure;
– by making available civil engineering ducts or overhead infrastructure for fibre deployment and space to host the concentration points;
– by installing additional ducts during road work;
– by authorizing the installation of cables on the facade of buildings;
– by permitting use of light engineering, installation of street cabinets, etc.
Upgrading the copper network is an alternative to full fibre deployment, which may be a solution for less densely populated areas in order to pave the way for FttH in the future. And, the demand for broadband upgrades is growing, which is becoming a major concern for a rising number of local authorities. Upgrading broadband through ‘classic’ sub-loop unbundling can lead to a real improvement in access rates for customers. However, there are high risks in such a roll-out for alternative operators, as sub-loop unbundling could be a way for the incumbent to regain market share.
While local authorities and public utilities are at the forefront of deployment and management of FttH infrastructure and networks, the implementation of the business models of FttH, especially the ones triggered by public entities, may encounter quite some hurdles and could diverge from local authorities as simple passive infrastructure providers to info-structure providers with active services provisioning.
Communities can benefit from state support within the framework of the national high-speed programme, particularly when their initiatives have a coherent strategy as defined in a SDTAN. To ensure consistency between the various initiatives in the territory, it is essential that local and regional operators align their strategies and, conversely, that operators provide transparency of their deployment projects.
Some communities have already initiated the operational phase of their projects, including the selection of private partners, the construction, and the technical and commercial operations. Many more are in the design phase. Hence, a sharp increase in public procurement procedures is expected between 2014 and 2016.
There is a high diversity in arrangements being used: including public service concessions, the farming-out of works contracts, market-based contracting (for design, construction, operation, and maintenance), and partnership contracts, among others. This will provide for different learning trajectories in the roll-out of broadband outside the major cities.
Although the implementation of high data rate broadband, including fibre to the premises, appears as inevitable, there are significant technical, economic, legal and financial risks that local authorities are facing and need to manage. They therefore tend to use private providers to help them manage these risks.6
11.5 Next-generation access technologies and network renewal
Before distinguishing and discussing the main kinds of next-generation access technologies, which are crucial for cost-effective broadband ‘last-mile’ access solutions, we are going to consider Orange’s civil engineering infrastructure, which is essential for alternative operators to be able to supply end-users with ultra-fast broadband services.
11.5.1 Orange’s civil infrastructure
Orange’s network is historically structured as a hierarchy with, at the lowest level, close to 13,000 main distribution nodes or subscriber connections points called NRAs (nœud de raccordement d’abonné (subscriber connection node) – the main distribution frame (MDF)) which terminate several hundred to tens of thousands of telephone lines (on average 2,500 lines), and approximately 126,000 sub-distributors (SR) of varying sizes comprising an average of 250 lines.
The civil engineering infrastructure, including the ducts, pipes, etc., provides the canal for the cables with the wires connecting the NRAs and SRs with the homes and businesses. The point in the network where the subscriber’s wires can be accessed by the alternative operator is important, as the level of aggregation that is provided determines the cost of providing services. The point of access also determines which part of the network is replicated and which part is shared.
For the deployment of FttH the availability of empty ducts and pipes as well as poles is important. Orange has a considerable civil engineering infrastructure that supports the telephone network, including:
350,000 km of civil engineering underground pipes (sheaths), and
about 13 million posts and millions of supports on utility poles, usually managed by ERDF, the energy grid operator.
However, some of the cables of the telephone network are buried directly in the ground. In that case, it is not possible to rely on existing civil engineering infrastructure to facilitate the deployment of a new fibre network.
In cases of FttH, one or more fibres can be deployed from the access point to the home, or into an apartment building or business premises. If one fibre is used, the final part of the connection becomes shared; that is, multiple operators must have access to the fibre for end-users to be able to choose among operators. Figure 11.1 reflects the elements of the network infrastructure, highlighting the access point.

Figure 11.1 Network elements subject to regulation, France
On the one hand, multi-fibre roll-out has several advantages:
– operators can be independent, having their own network from end to end, whereas sharing a fibre involves complex interactions;
– operators can implement their own technology and differentiate their service offering on that basis;
– consumers can have the choice of several offers from different ISPs, and churn costs should be low.
On the other hand, the constraint created for the building operator seems reasonable, at least when the shared access point is located near or inside the building:
– limited cost difference between a single and a multi-fibre roll-out;
– OPEX is likely to be lower for a multi-fibre roll-out, which is particularly significant as the infrastructure will be used for several decades.
11.5.2 DSL technologies
The telephone network of Orange covers the entire territory; hence, the use of xDSL technologies (including ADSL) on this network allows 98.5% of homes to be provided with broadband, albeit with variations in data rates (depending on line length) and territorial disparities.
To provide xDSL on access lines connected to an NRA, an operator can install a device for injecting a high-speed signal, the DSLAM. The data rate that can be offered varies from 20 Mbit/s for customers close to the NRA to 512 kbps for customers with longer lines. On very long lines, broadband cannot be provided due to too much attenuation of the signal.
Since 2007, Orange has installed a DSLAM in all sites with NRAs, which provides 98.5% of the population with access to xDSL broadband. Alternative operators (Bouygues Telecom, Free, SFR, etc.) have co-located DSLAMs in about 5,600 NRAs, which allows them to use unbundled access to offer broadband to over 83% of the population.
To increase the data rate on Orange’s access network the equipment generating and receiving the xDSL signals (DSLAM or equivalent) needs to be positioned closer to the subscribers, for example by positioning it near the sub-distributor in a street cabinet. By connecting the DSLAM through fibre to the nearest switching centre, the copper lines are shortened and the fibre is moved closer to the homes. The increase in data rate should allow more than 95% of the concerned subscribers to receive xDSL access at a rate greater than 10 Mbit/s. The impact of the increasing data rate is even stronger when the homes are clustered around the sub-distributor, for example in a village.
By the end of March 2011, xDSL subscriptions offered by operators such as Orange, SFR, Free and Bouygues Telecom accounted for almost 93% of Internet access (excluding low-speed and mobile). Data rates provided by xDSL technologies range from 512 kbit/s to about 20 Mbit/s. The deployment of VDSL technology will further increase the available rates on some parts of the network, increasing the rates to around 50 Mbit/s.
11.5.3 Cable networks
In the 1980s and 1990s, coaxial cable networks were deployed for the distribution of broadcasting services, mainly in cities. Most of these networks are managed by Numericable which is the largest cable-TV operator and Internet access provider in France. The company was founded in July 2007 by the merger of two cable companies, Noos and NC Numericable.7 The company has 1,300 employees, nearly 8 million connectable outlets enabling broadband access and 1 million subscribers. Since the end of 2010, Numericable has been updating and replacing existing equipment with new generation equipment that supports the Euro Docsis 3.0 specification.
The deployment of optical fibre close to the connected home (FttLA for ʻFiber to the Last Amplifierʼ) can improve performance and provide access to an ultra-high data rate. To date, Numericable has completed the modernization of nearly 4 million outlets on which a download rate of around 100 Mbit/s (shared by several users) is provided. The upload rate is in turn much lower, of about 5 Mbit/s per subscriber.
11.5.4 Radio local loop networks
Radio systems for terrestrial fixed access (Wi-Fi, WiMAX, etc.) have been deployed mainly in areas poorly covered by xDSL networks. The data rates provided by WiMAX and Wi-Fi are strongly dependent on the backhaul capacity, the number of base stations and the number of users per base station. They can range from a few to tens of Mbit/s. These networks are usually managed by local operators or by specialized ones. Thanks largely to the intervention of local authorities tens of thousands of households and businesses are now connected to broadband through terrestrial wireless networks for fixed access.
Developments of WiMAX and Wi-Fi standards and the introduction of new technologies (including LTE) will provide for higher data rates in the medium term. To take full advantage of the performance of these new technologies, it will be necessary that the base stations are connected to the core network through an optical fibre link.
11.5.5 Satellite networks
Existing satellite networks allow broadband access to the Internet with theoretical data rates up to 2 Mbit/s. This access technology has some inherent limitations (latency, data quotas) inconsistent with highly interactive uses (e.g., network games) or with extensive use of connection (e.g., video). Satellite access is mainly used in areas which are not served by terrestrial networks. The recent launch of satellites based on newer technologies (e.g., Ka-Sat) will allow download rates of around 10 Mbit/s per subscriber to be offered.
11.5.6 Mobile networks
In 2008, the government issued a plan France Numérique 2012 with a view to providing guidance to the administration and to set targets regarding the digital economy. This plan aimed at supporting the economy with the following priorities:
– to enable any citizen to access networks and digital services;
– to develop the production and offers of digital contents;
– to increase and diversify the digital usages and services in enterprises, administrations and personal environments; and
– to modernize the governance of the digital economy.
Specific actions referring to radio frequency spectrum for mobile communication were included in the plan as follows:
– to start the request for applications for the use of available frequencies in the 2.1 and 2.6 GHz bands based on three objectives: to promote competition, derive the best value from spectrum and ensure the best possible coverage of the territory;
– to allocate the sub-band 790–862 MHz, released by the analogue TV switch-off, to cover the territory with fixed and mobile high data-rate networks.
Subsequently the remaining spectrum at 2 GHz (with the exception of the 2010–2025 MHz band for which no authorisation has been delivered yet) was granted to Free Mobile, enabling a new mobile operator to enter the French market in 2010.
In June 2011, the spectrum at 2.6 GHz (only the paired bands: 2x70 MHz) was assigned through a single-round combinatorial auction for a total of EUR 936 million to the existing operators Orange, SFR, Bouygues Telecom and Free Mobile. In December 2011 the spectrum at 800 MHz was granted through a single-round combinatorial auction for a total of EUR 3.5 billion to three operators, Orange, SFR and Bouygues Telecom.
Both the 2.6 GHz and 800 MHz assignment procedures included a scheme8 that was designed to encourage carriers to open their networks fully to mobile virtual network operators (full MVNOs). Among the priorities set for the assignment of licences were coverage obligations aimed at regional digital development (99.6% of the population and the priority roads to be covered within 15 years), and increasing the intensity of competition with the presence of at least four operators in the 2.6 GHz band.
The migration from 3G to 4G is to be carried out over a period of several years, as was the case with the transition from 2G to 3G. In early 2011, 3G networks covered more than 95% of the population. In 2013 they achieved similar coverage to that of 2G networks; that is, more than 99.8% of the population.
Meanwhile, mobile operators look for strategies and solutions that will enhance their existing 3G networks while addressing their 4G deployment obligations. In the coming years 4G will significantly increase the performance of mobile networks. LTE technology allows shared theoretical data rates of several tens of Mbit/s or even 100 Mbit/s, which could correspond under operational conditions to actual rates of several Mbit/s or even tens of Mbit/s.
11.5.7 Fixed-mobile complementarity
Mobile technologies also allow for fixed use: as such, they are a substitute for fixed networks. However, the new 4G mobile networks to be deployed will present, as it is the case today for 3G/3G+ networks, different operational characteristics compared to fixed networks, either in terms of pattern of use, quality of service or data volume. Therefore they are not a full substitute for fixed and ultra-fast broadband networks. The deployment of high and very-high data rate mobile networks is to be integrated into an overall consideration of the national plan. Indeed the transition from high to very-high data rate mobile requires connecting radio transmitters with fibre and therefore the deployment of fibre closer to the premises.
Whatever the technologies, including terrestrial and satellite solutions, access to broadband and ultra-fast Internet will need to be implemented in a complementary manner. This complementarity will allow meeting the immediate needs of rural areas as well as isolated areas without compromising the long-term objective of ultra-fast broadband access for all. This is particularly relevant where the investments in the increase of data rates can be reused as part of the investment in the transition to FttH. To realize this complementarity effective local planning is necessary. Thanks to local planning, it will be possible to identify detailed local needs and priorities and determine the adequate technology. Master plans are one of the best tools for this type of technology planning.
11.6 Main stakes in broadband deployment
11.6.1 Socio-economic stakes
The deployment of ultra-fast networks is an important factor in the development of innovative services for the benefit of individuals and businesses. These economic and social stakes are a factor in the attractiveness and long-term development of the territories.
On the one hand, FttH networks are expected to unleash their economic potential and societal benefits by opening up the first/last mile bandwidth bottleneck, thereby strengthening the information society while avoiding a digital divide. FttH networks hold great promise to enable the support of a wide range of new and emerging services and applications, such as quadruple-play, video on demand, videoconferencing, peer-to-peer audio/video filesharing, multichannel high-definition television (HDTV), multimedia/multiparty online gaming, telemedicine, telecommuting and surveillance.
On the other hand, wireless technologies have seen tremendous success over the years and they have become increasingly popular due to their fast deployment and their ability to provide flexible and ubiquitous Internet access. In particular, next-generation fixed wireless broadband networks (e.g., deployed as wireless mesh networks, WMNs) are currently motivated by several applications including broadband home networking, neighbourhood networking and enterprise networking.
The following figures reflect the use by consumers of the new broadband services (CREDOC, 2013):
– 71% of people are connected to the Internet at home for leisure, work, study, communication with relatives, shopping, etc.;
– 25% of people use the Internet for work or training;
– 43% of people use the Internet for administrative declarations or tax returns.
However, the quality of Internet access varies depending on location:
– Approximately 13% of households cannot have a download rate of 2 Mbit/s or higher. Below this threshold the quality of access is inadequate for some services;
– Approximately one out of four households cannot receive television services via their connection to the Internet. Moreover, one out of two cannot benefit from high definition television.
According to IDATE, France certainly ranks behind South Korea, Japan or the United States but is at the forefront of European countries, including the Scandinavian countries, in the coverage of FttH/FttB. The delay is not due to the percentage of households covered by high data rate networks, but to actual subscriptions. Indeed, only about 10% of eligible households actually subscribed. The reason for this is the high quality of ADSL and the lack of promotional offers by broadband operators until 2011. The first campaign began only in 2012.
11.6.2 Industrial stakes
The deployment of FttH networks is a major industrial project that requires the mobilization of technical resources and expertise.
In France, optical fibre does not represent a new technology. Indeed, it has been deployed over the last twenty years at the national level, in the so-called transport networks. To facilitate broadband, it has been deployed subsequently in the networks connecting telephone exchanges (the collection networks), first by Orange and later by alternative operators, as well as by local authorities, along with the unbundling of Orange’s local networks. New fibre local loops have been deployed to subscribers (residential and business premises) such that residents and businesses have access to the most innovative digital services.
FttH network deployment is a major industrial project because this deployment requires the large-scale mobilization of technical resources and expertise for production of optical fibre and network installation. The optical fibre service to all buildings requires the deployment of a network of over one million kilometres of fibre. This project can be compared to the deployment of the telephone network in the 1970s and 1980s, which had required more than 15 years.
11.6.3 Financial stakes
The financial burden of FttH deployment can be estimated nationally at about EUR 25 billion. This cost is highly dependent on population density, dispersion of housing and the availability of civil engineering infrastructures. Hence, this cost can be around EUR 400 per line in an urban area, while it can exceed EUR 2000 in rural areas where housing is scattered. The cost of deployment is not proportional to the population covered. That is, the cost of FttH coverage of 80% of the population and businesses represents about half of the total FttH deployment cost.
While a major part of investments is likely to be carried out by private operators, public funding is also needed. Public financing could help make high data rate networks economically feasible where the costs would otherwise be prohibitive. According to the current regulatory policy, such public funding should be targeted to alleviate barriers to private investment. The requirements on public funding will depend on the income that may be derived from the exploitation of new FttH networks, which in turn depends on user demand for very high data rates and new services.
The deployment of fibre to the sub-distributor should generally represent the largest part of the costs of the implementation of higher data rates. This cost is highly dependent on the length of the fibre and civil engineering infrastructure. In 80% of cases, the implementation cost is between EUR 30,000 and EUR 50,000 per sub-distributor. According to the obligations imposed by ARCEP, an access offer must be made available by Orange at a price reflecting the costs, including costs associated with hosting alternative operators according to cost orientation policy (ARCEP (2011b)).
The total cost is up to EUR 100,000 per sub-distributor. This amount depends heavily on the cost of deploying fibre to sub-distributors, which often fits into a larger project. This cost is generally borne by the local community backing the deployment, which then retains ownership of the facilities.
However, many investment proposals, in particular those involving infrastructure sharing by private sector operators or resulting from public-private co-operation, are perceived by potential investors as high risk transactions and therefore more likely to fail in attracting private financing. This may be because they have a longer payback period or simply because the promoters are too small and inexperienced to attract the interest of large financial institutions. Difficult liquidity conditions and uncertain economic prospects also limit the willingness to accept risk by private investors and, in effect, raise the financing costs.
Local and regional authorities are increasingly exploring alternative financing arrangements, including public-private partnerships (PPP) for financing broadband infrastructure. These solutions aim to optimize synergies from combining public and private sector financial resources as well as their respective competencies in regulation and in risk-based investments.
11.7 Broadband regulation mechanisms
The broadband regulation is based on the use of a large degree of sharing and providing incentives to investment. In this respect the regulation of Orange’s civil engineering infrastructure is essential for the deployment of an optical fibre local loop such that alternative operators also can supply end-users with ultra-fast broadband services.
11.7.1 Regulating access to Orange’s civil infrastructure
Accessing buildings is currently the major obstacle to FttH roll-outs for all operators. As a result, the French Government proposed legislative measures that outline the principle of sharing the terminal section of optical fibre networks and endowed the regulator ARCEP with regulatory powers in that area, notably for setting the technical and pricing terms for a system of infrastructure sharing. This stage of the roll-out requires property (co)owners to sign an agreement with a carrier who will need to perform work inside the (potentially co-owned) property. This choice of ‘building operator’ should in no way impede each of the building occupantsʼ freedom to choose their actual service provider.
In FttH projects civil engineering is the main cost factor (50% to 80% of the total roll-out cost); hence, access to existing civil engineering infrastructure is important to reduce the total costs. In accordance with the market analysis decision of 25 July 2008 (markets 4 and 5), Orange must provide access to its civil engineering infrastructure under transparent, non-discriminatory and cost-oriented conditions. Pursuant to the decision of ARCEP in July 2008, Orange is obliged to provide access to its ducts to other operators deploying FttH networks. The offer by Orange for that purpose is regulated by ARCEP, including its price. The offer must:
– provide efficient sharing of available space between different operators;
– promote the independence of operators involved in deploying such infrastructure;
– be offered at a price reflecting the costs incurred by Orange (cost orientation) and incorporating a smooth transition of subscribers to FttH;
– be independent of the length of the lines on the pooled portion of the networks, so as not to penalize deployment in rural areas.
Pursuant to a decision of ARCEP on 14 June 2011, Orange must also provide access to its poles and distribution points to other operators deploying FttH networks. This infrastructure will therefore be leveraged, especially in rural areas, where it is expected to reduce deployment costs. All operators need to be able to access this essential infrastructure to invest in ultra-fast broadband.
11.7.2 Infrastructure sharing: contractual and financial mechanisms
In addition, the Law on Modernising the Economy (4 August 2008) sets out specific rules for providing access to the last mile of ultra-fast broadband networks. This law states that the building operator must sign an agreement with the owner of the building. The agreement specifies the terms and conditions that apply to the deployment, maintenance and management of the fibre network in the building. The deployment of the fibre inside the building is financed entirely by the operator (at no cost to the owner). Once the agreement is signed, the building operator has six months to deploy the network (except for the last mile which involves agreements with other operators). The terms governing sharing between operators are not stipulated in this agreement, but rather in the agreements between operators.
To allow other operators to offer their services in homes that may be connected to the shared network, the operator who deployed this part of the network must offer them a passive access at the point of sharing. Such access must allow operators to control the entire technical chain by installing their own equipment at the sharing point.
Access can be done in several ways:
– co-financing offer: The operator participates in the financing of the shared network prior to its deployment by purchasing a usage right for the long term;
– access offer: After the deployment of the network, the operator buys a long term usage right;
– offer comprising access to the leased line (on the model of the local loop unbundling).
Investment offers or access offers allow an operator to have a long-term usage right on all or part of the fibre of the shared network. It also allows sharing of financial risk between the different operators who will then use the shared network to provide ultra-fast services.
These offers must be offered to other operators irrespective of whether the project is being carried out by a private operator or a local authority as part of a network of public initiative. When the project is supported by a local authority, co-financing should enable the mobilization of a maximum of private capital and encourage the effective use of the network by the major national operators.
In municipalities that constitute the ‘very dense areas’, co-financing amounts to a split of the total cost of the shared network between different operators. On the remainder of the territory, given the high cost of network deployment and the various investment capacities of the operators, co-financing will be gradual. It may well result in the acquisition of a permanent usage right on a limited number of lines deployed in a single project.
In principle, the co-financing of FttH networks shared by several operators should encourage investment while ensuring sustainable competition in the retail market. It secures the project for the operator that deploys the network by guaranteeing ‘customers’ from the initial project onward.
11.8 Mitigation of market risks
The deployment of a new local loop that runs to subscribers’ homes also means significant market risks that should be mitigated as much as possible. We can distinguish here two main kinds of risk. The first one is the risk of creating a local monopoly in each building. The second one is about the inconsistency in fibre deployments due to the complex interplay amongst the various stakeholders.
11.8.1 Risk of local monopoly
To mitigate the risk of local monopoly, operators are required by regulation to share the terminating sections of their optical fibre network. In other words, the first operator to install fibre in a building should provide other operators access to it under conditions that enable effective competition, allowing them to market a competitive offer to the residents.
For this purpose, the regulatory framework for FttH deployment outside dense areas has been detailed since the beginning of 2011. As a result, Orange must henceforth offer a range of ʻshared connection pointsʼ (SCPs). The related SCP service offer can be used by an operator made responsible for network deployment by a local authority as part of a public initiative.
Orange published its wholesale offer to access its fibre networks (FttH) outside dense areas in July 2011. In accordance with the principles set by the regulator ARCEP, the offer allows the pooling of networks in non-dense areas, giving end-users the choice of any service provider.
To meet this requirement and allow the full development of the new injection point near the sub-distributor, Orange signed an agreement with Free (Iliad Group) on deployments to be done in 2011 and 2012. Orange is to spend EUR 2 billion by 2015 to provide the optical fibre in 3,600 municipalities with coverage of 10 million households in 2015 and 15 million households in 2020, nearly 60% of French households.
11.8.2 Risk of deployment inconsistency
Spontaneous and unplanned deployments by multiple operators might lead to inconsistencies such as coverage holes (a few unserved homes between two pooling areas corresponding to two distinct pooling points), over-coverage (a few houses covered by two pooling areas under the responsibility of two different operators) or additional costs (if an operator deploys a FttH network for an entire neighbourhood with the exception of one street). That is why deployments should be made taking into account the views of all public and private actors involved in roll-out projects. This implies some complementarity between public and private projects and some coherence of the various projects of public initiative networks. Only strategic planning at a sufficiently large geographic scale can provide this overall consistency.
11.9 NGA investment strategies
The need for investment, both to maintain and upgrade existing networks and to build up the new fixed and mobile networks. can be estimated at around EUR 6 billion per year during the following 15 years9.
The country’s leading carriers have announced ultra-fast broadband deployment plans and the first roll-outs have already begun in Paris and several other major cities. DSL market players have opted to deploy new optical fibre local loops to the home. These new fibre networks open up new opportunities for LLU operators wanting to invest in their own local loop and so migrate from a strategy based on leasing to one based on investment. Cable operators are also working to upgrade their coaxial networks by pulling fibre to the premises.
To mobilize all investment capabilities to support the widespread deployment of FttH in the territory, it is desirable that the public and private initiatives be complementary and well-articulated. This particular issue requires, firstly, specifying deployment costs, secondly, describing the respective features of both types of investment.
11.9.1 Sharing deployment costs
The investments required of an operator to roll out an FttH network correspond essentially to the cost of building a new local loop that extends to the subscriber premises. Civil engineering is by far the largest cost item when constructing a new local loop. If an operator were forced to undertake its own civil engineering and to open trenches across the city, deployment costs would run into the tens of billions of euros across France. Pioneer roll-outs are thus taking place in cities where existing infrastructure can be reused: the incumbent carrier is deploying optical fibre in the ducts inherited from the former monopoly, while alternative operators are installing fibre in the underground sewer networks (e.g., in Paris) and in city-owned ducts (e.g., in Montpellier).
Finally the overall capital cost of deployment of fibre for all is estimated at EUR 25 billion. This cost is expected to be borne primarily by the private sector. However, public investment will be essential because the low population density of much of the French territory makes deployment costs unaffordable for the operators.
11.9.2 Private initiative
Private operators deploy FttH networks in the areas where it is economically viable. Given the deployment costs and expected revenues, they focus mainly on deployments in urban areas. Already, as part of the national ʻhigh-speedʼ programme, private operators have announced their intention to cover nearly 57% of households, corresponding to about 3,400 cities located in over 200 large urban areas throughout the territory, by 2020.
Private initiatives are encouraged by the regulatory framework which allows:
– mutual investments between private investors (operators) where the deployment of multiple networks would not be economically feasible (about 85% of the population and more than 95% of the territory);
– the deployment of competing networks, if the operators wish, where competition is economically feasible (about 15% of the population and less than 5% of the territory).
11.9.3 Public initiative
In mid-2010, 215 projects of the public initiative networks (PINs) type were identified, including 111 covering more than 60,000 inhabitants. Different types of communities are the source of PINs: regions, departments, joint associations and cities. They are usually set-up in partnership with a private operator, under different legal constructs: direct control, public service concession (concession or lease) or public private partnerships (PPP).
The public initiative networks deployed to date have mainly resulted in:
– unbundling of nearly 40% of telephone lines, primarily through the deployment of fibre collect networks (ARCEP);
– connecting by fibre nearly 4,400 business zones (AVICCA);
– improving the broadband coverage of areas not eligible for ADSL (called ʻwhite areasʼ).
Local authorities may start FttH deployment projects throughout the territory to the extent that they comply with legislative frameworks (Article L.1425–1 of the General Code of the Local Authorities). However, in view of the EU rules, public initiatives should not contain state aid in the territories that would be subject to private projects. Hence, a public initiative is legally more constrained for the territories that would be subject to private projects.
11.10 Realizing the Digital Agenda targets
11.10.1 Territory coverage: DSL deployment
On 30 June 2011 the wholesale broadband DSL market was nearly 11.2 million lines, of which more than 8.3 million were fully unbundled. Local loop unbundling, in particular full LLU, drives market growth. In the retail broadband market, these DSL access lines are marketed by alternative operators to residential users and to enterprises.
Thanks to local authorities’ projects, backhaul networks were developed in more sparsely populated areas. Around half of the EUR 2.1 billion invested came from public financing. As a result 1,420 new exchanges have been unbundled for use by alternative operators serving 4.6 million households.
11.10.2 Territorial coverage: fibre deployment
By cutting the link between the location of people or activities and urban areas, which over time have gradually concentrated much of the population, production and services, broadband deployment gives a chance to the most rural areas, which constitute the bulk of the territory. In contrast, areas that will not have access to ultra-fast broadband at affordable costs may experience an inevitable decline.
However, France is slow to complete its coverage of mobile and broadband Internet. It is slow in deploying networks with very high data rates that will succeed standard broadband networks. This is especially true in the rural areas, as the marginal cost of a subscriber is much higher than in urban areas, which discourages private operators to invest (SENAT, 2011). In this context, cheaper radio-based technologies could still be a useful supplement to fibre in less dense areas.
Moreover, FttB started off well with over 250,000 subscribers, including those connected to the network of Numericable, but the FttH proposition does not seem to convince potential subscribers. While 900,000 homes are connected, only 10% of them have subscribed. With high quality and inexpensive ADSL available in very dense areas where fibre has been deployed first, consumers still do not recognize a need to move from the old copper pair to fibre.
The framework for the deployment of fibre provides for a high level of sharing of networks (90%) over almost the whole territory (95% of the surface and 80% of the population). In the remaining dense areas, sharing is imposed only for the final part of the network (access to the buildings), whereby the operators have the choice to share or not the other parts of the network.
Since 2009, the main operators are engaged in fibre deployments on the ‘horizontal’ part; that is to say, located on the public domain rather than entering the building. On the one hand, there is FttH deployed by Orange, SFR and Free, and, on the other hand, fibre being deployed by Numericable to replace the portion of the coaxial cables located on public property, the so-called fibre to the amplifier (FttA), with the terminal portion remaining as coaxial cable. Fibre deployments are taking place in about forty cities.
FttH networks are currently deployed mainly in large cities. They allow subscribers at this stage to benefit from a symmetrical rate of about 100 Mbit/s; that is, in both the downlink and the uplink. There are 148 municipalities (representing 20 urban areas) constituting the ʻdense areasʼ characterized by a high proportion of collective buildings.
The number of houses covered by FttH has evolved significantly since 2010. Approximately 2.4 million homes have access to ultra-fast FttH offers: this means that their occupants can subscribe to commercial offers of at least one Internet access provider using this technology. In addition, fibre has been deployed to the foot of buildings representing 3 million dwelling units, the latter being described as ‘ready-to-be-connected’. The number of homes covered is up about 33% compared to 30 June 2010. Moreover, about 4.2 million homes are eligible for ultra-fast optical fibre offers based on coaxial cable, of which just over 1.2 million are outside the very dense areas.
11.11 Market dynamics
The retail broadband market is dynamic and competitive thanks to innovative offers and productive efficiency. Business models have been defined by the market based on infrastructure-based competition.
On the demand side the household penetration rate is about 75%, thanks to:
As to theoretical data rates, over 50% of the population have access to more than 10 Mbit/s and 75% to more than 4 Mbit/s.
More generally, the ultra-fast broadband market is characterized by the following three main trends: (1) the decline in fixed voice lines due to the growth in broadband and mobile minutes; (2) customers becoming more demanding of increasing data rates; and (3) competition moving from pure price competition to service- and segment-specific offers.
11.11.1 Decline in fixed voice and growth in broadband and mobile services
Mobile networks were originally developed to provide a mobile communication service. They are now used less and less for voice. There has been a decrease in the average consumption of voice per mobile user since 2007, from approximately 157 minutes per user per month to 140 minutes in 2010. This is particularly due to the widespread use of unlimited voice offerings over fixed broadband lines and the increased popularity of instant messaging. This trend is reflected in the decline in revenues of narrowband services in recent years.
11.11.2 Growing demand for bandwidth
The number of mobile users has been increasing steadily since the early 2000s. With the mobile penetration rate being defined as the ratio of the number of active SIM cards to the size of the French population, the penetration is more than 108%, with 73.7 million users in 1Q 2013.
Among the users of mobile services, it is necessary to identify two types of use:
– historical use, corresponding to interpersonal communications services such as voice and SMS;
– new use, corresponding to the transmission of data services and media at large (Internet, MMS, e-mail, but also streaming, mobile TV, etc.) via sophisticated terminals10 that is made possible by the development of 3G networks.
Indeed in the installed base there is a strong growth of terminals providing access to mobile data services (Internet and multimedia). In the first quarter of 2011, three-quarters of handset sales were multimedia-capable, half of which was composed of smartphones.11
As the number of mobile phone users is growing moderately, the number of mobile users exclusively focused on use of data continues to increase in turn, representing a more and more important share in the overall number of mobile users. Thus, early in 2011, nearly one SIM card out of ten is a non-voice SIM card.
11.11.3 Price competition issues and mobile market sustainability
Despite the sector’s concentration, competition is still going strong. Since 2008, the three main operators have had a more than 90% market share, while Orange alone is just under 50%. Even if the growing market turns into a churn market, purchase rates vary widely because of new players (Free Mobile, Bouygues, Darty) and a greater diversity of offerings (quadruple-play, etc.). Moreover, nowadays there are thirty-nine mobile virtual network operators (MVNO) and three trademark license agreements.
The retail market is characterized by volume growth and a downward trend in prices resulting in lower revenues: -2.2% in 2011.12 Accelerating smartphone adoption is driving data revenue growth. Mobile network operators’ revenues and EBITDA margins are more and more under pressure, while data services are growing quickly. Voice and SMS still represent the lion’s share of revenues. Regulatory pressure is exercised on termination rates and international roaming.
The existing mobile tariff structure is highly leveraged on voice and SMS revenues, while operators are competing on ‘all you can eat’ data downloads at unsustainable costs. It is not possible to monetize demand for heavy data entertainment content because consumers value content, not gigabytes per month. The current solution tends to restrict mobile broadband use rather than embrace growing demand. This is actually a dilemma for mobile network operators (MNOs) because 85% of their revenues come from voice and 70% of their costs come from data. For example, the average usage is more than 400 MB/month/user for Orange.
MVNOs can be distinguished in four categories, each having its own specific marketing strategy. The first category can be called ‘ethnic MVNO’; operators in this category target a specific nationality or origin, specific border residents or tourists. This category differs in offering aggressive rates for international calls. With this position, an ‘ethnic MVNO’ obtains higher revenue per user than the average by handling a higher proportion of international calls.
The second category is designated as ‘low-cost MVNO’, whereby operators offer more aggressive pricing by focusing on tightly controlling customer acquisition and operating costs. Various strategies are used to achieve the lower costs: customer acquisition via Internet, dematerialization of administrative support (invoicing, payment processing) and use of voice servers.
The third category is called ‘brand operator’; this type of operator targets a specific population group based on a well-known brand name. Here we find the media (radio, television), the retail stores, banks, etc. Additional value-added services may be offered to attract the target population and to improve the revenue per subscriber: e.g., downloading music, variety show results, SMS votes or vouchers as a lump sum. Their targets are specific demographic niches: e.g., to attract young people, as applied by Breizh Mobile, Universal Music Mobile, Virgin Mobile, MTV, NRJ Mobile. However there are also major retail distributors, such as Mobile Leclerc, Carrefour Mobile, Auchan Mobile, banks and major service providers.
The issue of mobile tariffs is becoming more prevalent in public opinion. Indeed, three-quarters of people believe that individuals who have very low incomes should be eligible for a lower social tariff in order to connect to the Internet at home. The idea of a social tariff is defended by all population groups: youth, seniors, managers, workers, employees, high income users, middle class, low-income users, non-Internet users (CREDOC, 2013).
However, mobile tariffs are still relatively high in France. Mobile operators try to get consumers involved in binding offers over 12 or 24 months and intend to make consumers pay 15 eurocents per minute on average. On the tariff issue, Free has shaken-up the retail market by proposing non-binding offerings only, to address the demand of users to call ‘without counting’ as in the fixed telephony market.
In September 2011 Orange launched a ‘low cost’ brand called ʻSoshʼ to try to compete with Free. The Sosh brand has lower rates than those typically charged by Orange. It is distributed via the Internet and has a subscription model with no commitment. Sosh targets the ‘digital natives’ who are using their smartphones more for data than for voice.
The new brand of Orange can be compared to ʻB&Youʼ, launched by Bouygues Telecom in early July 201113, and to that of SFR which was unveiled in June 2011. The SFR offer called ʻCarréesʼ is without commitment and without handset subsidy. As for Free, it offers an unlimited mobile package for Freebox subscribers and another one for the non-Freebox subscribers.
The Free offering is a promotional offer only, reserved for a few millions of people. The issue is about the sustainability of the mobile market.
11.11.4 Regulation of the value chain
Successful long-term deployment of broadband networks raises the question of the underlying economic model. Indeed, the deployment of ultra-fast broadband makes possible the explosion of new uses. Conversely, the existence of attractive content stimulates the appetite of consumers for ultra-fast services and supports the deployment of networks. In this context, the question naturally arises of sharing the value and of financing networks between the various links in the value chain.
Actors seek to position themselves in the value chain based on extending their traditional role as suppliers developing service platforms; service providers are developing operating systems for mobile devices; and, finally, some telecom operators are investing in content. These strategies are reflected in particular through policies of exclusivity, which are not reprehensible in themselves but which raise competition issues. The Competition Authority has, by its opinion of 7 July 2009, set out the framework and limitations of these exclusive mechanisms (Competition Authority, 2011).
Beyond issues related to strategies implemented by the actors, there is the more general topic of relations between the various links in the chain, including between ‘contentʼ and ʻcontainers’. This problem then joined the issue of neutrality of the Internet, and more generally of network neutrality.
11.12 Case analysis
If the French situation in matters of broadband can be taken as an example, the penetration of ultra-fast broadband seems still to be insufficient. In fact, the dynamics and quality of the existing broadband networks seem to hinder the development of ultra-fast broadband in France. The challenge is now to incite financially and organize more clearly the deployment of optical fibre local loop.
The coverage of France by ultra-fast broadband networks will not only result from the strength of market players, but will be achieved through a combination of several actions:
– First, at the strategic level: the parliament intervened in laying down the principles and objectives for the fight against the Digital Divide; then, the government and the regulator determined the scope of the regulation and, finally, local authorities, usually the ʻdépartementsʼ have completed the development of regional planning networks. Local authorities, as well as the various state bodies and policy makers, have taken responsibility as planners;
– Second, at the operational level, are the initiatives of the private operators and local authorities as operators;
– Third, at the tactical level: The government has provided for regulation to reduce the costs and increase the funding to close the digital divide.
Neutrality and flexibility of the regulation mechanisms are aimed at balancing the investment and financing on the more-or-less centralized deployments, regardless of the political choices made.
11.12.1 Lessons learned
Next to the impulse from public authorities and utilities, the regulatory policy is essential and has a major impact on the features of the French broadband market, even if embedded within the European regulatory framework.
An infrastructure-based competition must gain a significant geographic footprint in areas where dynamic competition is possible. The regulatory framework has to be clear and provide incentives to invest in those zones. The first roll-outs have helped to measure consumers’ willingness to pay for new services and enabled the industrialization of the roll-out processes.
At the same time, roll-outs in less densely populated areas must be prepared by promoting shared investment, the deployment of networks open to all operators and local authority involvement when private investment is insufficient.
At the European level and across member states, public authorities could build or finance sector-specific infrastructure in line with the State aid Broadband Guidelines, allowing fair and non-discriminatory access to broadband operators, thereby triggering the take-off of competitive service provision in areas that would otherwise be uneconomic to serve.
11.12.2 Possible generalizations
Local authorities should also consider using fibre core networks that have been or are being constructed to link up public entities (schools, libraries, clinics) in order to bring ultra-fast connections to unserved communities.
In order to speed up the use of state aid for broadband, member states should notify the EC of their national framework schemes and thereby avoid multiple notifications of individual projects.
As actions are undertaken predominantly at local level, it is necessary to develop and improve mechanisms to enable local actors to obtain relevant information to reduce investment costs.
11.12.3 Some recommendations
Could the results achieved in the French context be transposed to other countries, and under what conditions?
The regulator should enable operators to invest in ultra-fast broadband under equal conditions, which means:
– access to existing infrastructure, especially civil engineering which is the largest cost item;
– sharing new investments, especially in the last mile.
Sharing the last mile allows:
– operators to limit overall roll-out costs;
– only a single installation in buildings, instead of multiple ones by different operators;
– the prevention of local monopolies;
– building residents to have a choice of ISPs for their ultra-fast services.
To define the rules for ultra-fast broadband regulations, different aspects have to be tackled with the stakeholders:
– relations between property owners and network operators (using a sample agreement);
– technical aspects (definition of the engineering rules for infrastructure sharing, based on the principle of technological neutrality);
– assessing the cost of the different solutions;
– establishing pricing principles.
To support PPPs, it would be necessary to mobilize the know-how as well as to channel existing and future technical assistance funds to project preparation and to structuring complex multi-party financial transactions in a rapidly changing environment.
To match the needs of investment projects in terms of flexibility, maturity and risk, it would be necessary to set up concrete proposals for financing instruments to complement existing means of financing broadband infrastructure. Such instruments could be of debt, guarantee or equity type or a combination thereof. These instruments should also be designed to serve as conduits for funds earmarked by local and regional authorities and by private sector investors for financing the roll out of broadband infrastructure.
To unlock the financing for the higher-risk infrastructure projects, such instruments would require dedicated financial resources. To illustrate the potential impact, a financial contribution is likely to attract other funds from public or private sectors which could underpin gross investment depending on the financing needs and the risk profiles of the underlying projects.
References
1 Outsourced jobs (related to purchases or investments): call centers, fibre installers, service companies in computer engineering: 150,000; direct employment of the five main operators (Orange, SFR, Bouygues Telecom, Iliad Telecom and OMEA): 126,000; Other direct employment. All other listed companies under the NAF Code 6420 Telecommunications: other operators, manufacturers, etc.: 34,000.
2 Since February 2012 and the passage of fixed-line telephony under the Orange brand, all solutions marketed by France Telecom uses this brand, which on July 1, 2013 became the new name of the group.
4 See www.arcep.fr/collectivités.
5 The law introduced in the General Code of Territorial Communities (CGCT) in article L.1425–1 defining the conditions for communities to intervene in the area of the electronic communications sector. Communities can be an operator: that is to say, establish and operate networks. Except in case of failure of private initiative, their activity is limited to the wholesale market and does not directly address end customers. The involvement of communities should respect the principles of equality and free competition in the electronic communications market. The network deployed at the initiative of a community does not enjoy a legal monopoly: that is to say, established by an Act or regulation. Private operators are thus likely, in some jurisdictions, to deploy networks in competition with those built at the initiative of local authorities. The converse is also possible under some conditions.
6 Source: Club collectivités territoriales de la Mission Ecoter, Colloque Comment maîtriser les risqué dans les montages très haut debit, 8 novembre 2013, Paris.
7 See www.numericable.fr.
8 The call for applications invited candidates to make commitments to improve competition in the wholesale market and increase the commercial autonomy of MVNOs on the retail market. It also invited them to offer MVNOs greater technical autonomy and better economic conditions.
9 Source: Déploiement des réseaux très haut débit sur l’ensemble du territoire national: rapport d’étude technologies et coûts de déploiement, mécanismes de soutien possibles. Etude réalisée pour le compte de la DATAR par les cabinets Tactis et Seban & Associés, janvier 2010.
10 According to the UMTS Forum, one phone out of two sold in France will be a smartphone in 2014. In addition, Cisco expects that, within the mobile fleet, one phone out of three in 2014 is a smartphone, an increase greater than 100% over 2009.
11 Source: GroupM / SFR Régie, 3rd Observatory of Mobile Internet, April 2011.
12 Source: 12th DigiWorld Yearbook.
13 This offer without commitment and without mobile terminal is designed for independent users with a developed technological culture and using the Internet freely.
12 Spain
12.1 Introduction to the case study
As in other EU countries, the dynamics of the broadband market in Spain have broadly followed the three main stages of the electronic communications regulatory framework set out by the EU1: initial liberalization, first stages of competition and introduction of next-generation networks (Gómez-Barroso and Feijóo, Reference Gómez-Barroso and Feijóo2010). Broadband had a merely token presence in the residential market before the first stage of liberalization, which took place in Spain during 1999 and 2000. From 1999 to around 2004, the market was dominated by ADSL technology – provided by the incumbent Telefónica and a number of ISPs that used bitstream access regulation. Cable modem technology was also relevant, but only in those places where cable operators were already present in the market2. The overall broadband penetration (subscriptions per 100 inhabitants) was just 5% in 2003, a slow and relatively delayed departure point compared with other EU countries. From 2004 to the present, service-based competition has significantly increased with the adoption of local loop unbundling regulation and new measures to ease bitstream access, still with ADSL as the dominant technology. In contrast, facilities-based competition has stagnated mainly due to the financial difficulties of cable operators that have almost completely stopped the deployment of new infrastructures since around 2006. However, with modest investments in upgrading existing networks, a relevant proportion of cable broadband connections already comply with the DOCSIS 3.0 standard, and this has fuelled competition in the next-generation access networks (NGAN) domain, at least in those zones where cable operators are present. As a consequence, NGAN based on fibre (FttX) technologies have been deployed slowly from 2010 in Spain, led by the incumbent operator. On the wireless side, 4G mobile technologies (LTE) started their deployment in mid-2013 in some of the main cities through mobile operators Vodafone and Orange, a move supported by the huge success of 3G mobile technologies and devices in Spain.
As a summary of the current situation in the fixed broadband market, the latest data available (April 20133) from CMT, the National Regulatory Authority, display an overall fixed broadband penetration of 25.5% (11,763,025 fixed broadband subscriptions), showing a 1.1% growth year-on-year. The breakdown of the number of broadband lines displays 79.1% of xDSL lines (network coverage: 99% of the population), 17.4% cable modem lines (60.2% coverage) and 3.5% fibre-to-the-home (FttH) (12% coverage). In the mobile domain, 3G and beyond network coverage reaches up to 83% of the population with 22.42 million broadband mobile accesses (54% of all mobile accesses in Spain).
This case study on Spain, therefore, examines in detail the industry structure and dynamics that have led to the current situation in broadband and its distinguishing features. The main hypothesis of the case rests on the influence of the economic, political, social and cultural context in the development of broadband markets, therefore creating unique paths for each country or region. To this end, the case investigates the competitive dynamics through empirical research, paying special attention to the investments in infrastructure upgrades, the regulatory and competitive decisions during the process, the use of structural funds and public aid, and the peculiarities of market demand. Of special interest in the case study are the evolution of the limitations (population, coverage, technologies) of broadband market forces, the role of public administrations (national, regional, local) in the development of broadband and their practical approaches to ‘market failures’ (regional differences are examined throughout the case), the role of wireless technologies and spectrum management, and a view on the deployment of next-generation networks.
With this logic in mind, the case study is structured into seven main sections. This introductory section is followed by some background on the origins of Internet access (narrowband) in Spain–Section 12.2. From there, a detailed account of the evolution of fixed broadband markets and regulation is presented in Sections 12.3 through 12.6. Section 12.7 is devoted to mobile broadband. The interplay between national and local/regional administrations is discussed in Section 12.8. The evaluation of the achievements of the Digital Agenda is captured in Section 12.9. A summary of the main conclusions of the case analysis and some reflections on the future of broadband close the chapter in Sections 12.10 and 12.11.
12.2 The origins of Internet access and broadband markets in Spain: the pre-liberalization days
The development of the Internet in Spain began in the 1980s in the context of scientific and technological research. Early developments were conducted in experimental projects, mostly at the Technical University of Madrid jointly with other universities outside Spain. It was also at that time when the first connections between major universities and research centres in the country were made as a first step towards the creation of RedIris4 in 1988, a public research network especially designed to support the increasing needs of the Spanish R&D community.
The first commercial provider of Internet services appeared in 1991: Goya Servicios Telemáticos, a university spin-off. Three years later, the market started to show an increasing commercial interest in the Internet and some early competition arose: Spritel, which had been providing an email service via RedIris, acquired its own connections and started to offer services, and Servicom appeared shortly thereafter. However, the turning point in Internet development took place in 19955 following the entry into the Spanish market of the Internet transit services of large telephone (Telefónica, BT and Sprint) and computer (IBM, ICL-Fujitsu) companies. As a direct consequence, more than twenty new suppliers appeared in the market (Sarenet, Cinet, Intercom, Abaforum, Asertel, Off-Campus, etc.). Within this scenario, international operators facilitated high-capacity lines (usually 64 kbit/s) so Spanish Internet providers could receive calls from access customers. Sprint, BT Telecom and France Telecom were the first networks to be fully operative. Later, Telefónica Data Transmission (Telefónica Data) began to provide services to ISPs, offering a cheaper alternative to overcome the main obstacle to the growth of the commercial Internet in Spain: the high cost of international connectivity. With this objective, Telefónica launched InfoVía6 in 1995, a service that would greatly boost the development of the Internet in Spain (and also in Latin America, where Telefónica has shares in many incumbent telcos), conceived both as an independent (private) network similar to the Internet but ʻin Spanishʼ and as an alternative access to the Internet at the price of a local call. As a direct consequence of the release of InfoVía, there were more than 400 ISPs in the market in 1997. Consolidation also began in 1997; for example, EUnet acquired Goya Servicios Telemáticos, which was acquired two years later by KPNQwest.
The second element of interest prior to the full liberalization of telecommunication markets was the decision of the Spanish government to create a second national operator, Retevisión, to crowd the market as much as possible since there were considerable fears of the consequences of other countries’ incumbents entering the national market. This second operator obtained the most widespread alternative networks not commercially available at that moment: the audiovisual distribution system for terrestrial television. Interestingly, this was a broadband transport network as it was prepared to carry several television channels across the Spanish territory. Thus, in early 1998, coinciding with the entry of Retevisión in the fixed telephony market, the growing interest of operators (Telefónica, Retevisión and BT) to integrate Internet access into their portfolios increased the number of main ISP acquisitions. Thus, Retevisión acquired Servicom and RedesTB, BT took control of Arrakis, CTV and Jet Internet became part of Uni2 (a France Télécom brand), and Telefónica launched Terra. In September 1998 Retevisión launched its own Internet access platform, Iddeo, to compete with Telefónica’s InfoVía service.
The next step in the evolution of Internet access took place with the advent of telecommunications liberalization in December 1998, when the market was opened to competition and the Spanish NRA set the end of the InfoVía service provision as 1 December of that year to avoid the monopolistic behaviour of the incumbent operator7.
Flat rates were introduced by Retevisión in July 2000 and followed by Telefónica in November of that year. With this new business strategy, Retevisión caused considerable disruption to the business model of connectivity provision and subsequent ruin for many ISPs used to simply charging a per-minute telephone tariff. Therefore, although the number of users had grown tremendously since the launch of InfoVía, the introduction of a flat rate at an affordable price meant a new surge in the use of the Internet. Thus, the number of users increased by three million in just one year, reaching seven million in total by 2001.
12.3 Development of fixed broadband in Spain: general guidelines
As mentioned in the previous section, on 1 December 1998 the Spanish telecommunications market was opened to the introduction of full competition. At that time, Internet access represented 0.3% of the sector’s overall turnover. It consisted of traditional telephone line access and until 1999 no commercial high-data-rate (broadband) access service was offered.
Indeed, it was in 1999 when two events marked the start of the commercial broadband offer in Spain. On one hand, a decree was passed forcing the former monopoly (Telefónica) to provide indirect access to its clients’ subscriber loops. On the other hand, cable operators, who had won their (regional) licenses through tenders awarded in 1998, started their commercial operations.
The next year, the regulator continued its work to promote the broadband market with two new actions. In March 2000 public tenders awarded licenses to operate wireless fixed access (WLL, wireless local loop) systems in the 3.4–3.6 GHz and 24.5–26.5 GHz frequencies. Furthermore, during the last days of the year, the access regulation was modified to define fully-unbundled subscriber loop access. With these two new actions, the basic framework for the development of broadband was defined in a stable manner.
The market developed quickly and during 2002 the first million broadband accesses were reached. However, it must be noted that until the first months of 2004, there continued to be fewer broadband users than switched Internet users. Between 2002 and 2006, the growth curve was steep. Growth slowed from that moment on and in 2010 the market started to show the first signs of maturity with modest growth rates.
The 9.8 million broadband lines operating in 2009 represented a penetration of 20.7 lines per 100 inhabitants, a value below that of the EU average at the time (24.8). Three years later, in 2012, there were 11.5 million broadband lines and penetration was 24.9 lines per 100 inhabitants, still below the EU average of 26. Considering the number of households instead of inhabitants, penetration rose to 51% (as compared to 56% in the EU) in 2009 and reached 66.9% in 2012, again below the EU average of 72.5%. The geographical distribution of access is notoriously uneven and thus, for example, in 2012 penetration in the Madrid municipality was 32.9% and it was 38.7% in Barcelona, well above the national and European averages. Penetration in municipalities with more than 100,000 and fewer than 500,000 inhabitants was 27.2%, still above the average, while municipalities of 1,000 to 5,000 inhabitants had a meagre 17.9% penetration and municipalities of fewer than 1,000 inhabitants a 12.6% penetration.
Despite the early awarding of licenses for fixed wireless access and the subsequent introduction of other technological options, the indisputably predominant access technologies were – and still are – xDSL and cable networks. Together they represented 96% of the total number of broadband lines in December 2012.
Cable access (HFC) represented 20% of the market at the end of 2009 and 18.7% in 2012. During recent years, cable has slowly lost some share to xDSL accesses (the cable share represented 25.2% in 2003 and 21.6% in 2006), and now to FttH. However, HFC is the main component of the installed base of NGAN. Of the 12.8 million lines installed, 9.6 million belong to cable (2.4 million active) and the remaining 3.2 million to FttH.
The remaining 4% of broadband lines (460,000 lines) is composed of FttH with 337,000 lines (2.9% of the total number of lines, double the number for the preceding year) and mostly wireless fixed access (123,000 lines). As a summary, Figure 12.1 depicts the evolution in broadband lines by technology.
Figure 12.1 Evolution in broadband lines by technology, Spain, 2003–2012
Another main trend in the evolution of broadband is the increase in lines with higher data rates. Technological evolution in the shape of the update of HFC to DOCSIS 3.0, usage of VDSL instead of ADSL and emergence of FttH were mostly responsible for this trend. In particular, at the end of 2012, 63% of broadband lines enjoyed data rates higher than 10 Mbit/s compared with 54% a year before. Moving the threshold to 30 Mbit/s, namely into the NGAN domain, 10% of broadband lines had at least this data rate, a growth of 64% compared with the year before. Of these, 60% corresponded to DOCSIS 3.0, 27% to FttH and 13% to VDSL.
Another trend that has progressively defined itself over time is the bundling of broadband with other services. In 2005 three out of every four broadband clients also purchased one or more additional services. By the end of 2007 this percentage exceeded 90% and in 2009 it represented 95.6% (75.1% purchased broadband with voice calls, 1.6% with television and 19.0% with both voice calls and television). In 2012, an additional trend emerged, from triple-play to quadruple- or quintuple-play (adding mobile voice and data), with 10% of total broadband lines being packaged in this manner.
Lastly, it is necessary to note that broadband is not a cheap service in Spain. The average expense per household for a bundle including broadband and voice calls was EUR 42.808 in 2009 (per month, line fee included). This price has dropped continually in recent years and in 2012 it was EUR 36.10 for the same bundle with broadband data rates of 10–15 Mbit/s. In the case of data rates higher than 30 Mbit/s, the average effective price was EUR 41.10 in 2012.
12.4 Analysis by technologies: xDSL and FttH
The Decree of March 26th, 19999 heralded the start of the commercial introduction of ADSL. Its declared purpose was to force the incumbent operator (Telefónica) to provide other operators with indirect access to subscriber loops in order to include ADSL. This access was to be offered in three modalities with a maximum binary flow of 256 kbit/s, 512 kbit/s or 2 Mbit/s in the operator-to-user direction. This Decree was valid for only eighteen months given that the Royal Decree 3456/200010 abolished it completely by establishing fully-unbundled subscriber loop access. The second temporary provision established that the conditions for the commercial offer of wholesale loop access resulting from the abolished Decree would be maintained (except for the price) for at least two years.
Initially heavy-handed intervention was the norm and deployment requirements were established. The 1999 Decree established in its first additional provision a national ADSL coverage plan. For each of the 109 districts defined, a single indirect access point to the subscriber loop was established; this is where the flows of information from local switches located in that area were to be concentrated. These switches were in charge of progressively providing the usage of ADSL technology. However, the Royal Decree on local loop unbundling (LLU) terminated all ADSL deployment requirements, as it moved the possibility of installing a DSL-switch (DSLAM) in the local telephony office.
The implementation of ADSL proved to be a fast commercial success, particularly from the summer of 2001 onward, when Telefónica was authorised to provide the service directly. It is important to remember that previously only ISPs using the network of Telefónica were allowed to provide these services. From 2000 to 2004, in spite of the regulation on local loop unbundling, it was bitstream access which created competition in the xDSL market. It was only from 2005 on that LLU started to have some importance as a means of alternative xDSL operators reaching the end user. The slow uptake was caused by the conflicts raised by the incumbent regarding the practical implementation of local loop unbundling. In addition, a reduction in fully unbundled loop wholesale prices in 2006 helped in the following years to emphasise the trend of changing the wholesale access modality. However, the introduction at the end of 2009 of a new wholesale access modality, obviating the need to purchase a telephone service with Telefónica, allowed operators to market new offers, and wholesale access requests grew again. As shown in the summary depicted in Figure 12.2, the incumbent operator kept a relatively constant market share from 2004 until about 2010. During this period, the ʻladder of investmentʼ theory held for the first rungs, translating indirect access into local loop unbundling. However, the situation changed from 2010 to 2012, when there was a well-discussed decline in the incumbent’s market share for the first time.

Recently, there have been new developments in this part of the broadband market. First, a new regulation was put in place during 2012 (ʻNew Ethernet Broadband Serviceʼ) to allow indirect access without replicating the quality of service (QoS) offered by the incumbent, thereby introducing greater flexibility into alternative operators’ market offers. It is still too soon to draw conclusions about future prospects.
Second, VDSL, FttC/B and FttH have been available in the market since 2009, but mostly from the incumbent operator. In this sense, the last rungs in the ladder of investment concept remain unfulfilled. Regulation for FttH remains light with provisions mainly for duct sharing and network sharing inside buildings – a domain where Spain has been cited as the EU reference. Lately, during 2013, operators have announced co-investments in fibre deployment: on one side, Telefónica and Jazztel (the main alternative fixed operator) and, on the other, Vodafone and Orange.
In fact, uncertainties about the deployment of fibre-based NGNs together with their role as basic infrastructures of the Information Society knowledge economy have prompted a growing number of studies, reports and papers from the industry, regulation authorities and academia about the circumstances of their deployment. The Spanish NRA issued a report on prospective of fibre deployment in Spain (CMT, 2009) to be used as the basis for a fibre-based NGN regulatory framework. The report assumes the usual hypothesis of these studies: sharing public works and infrastructures (trenching and ducts, as well as in buildings) where possible and deployment carried out progressively as demand for FttH services increases. The main conclusion of the report is that the deployment of FttH networks will be carried out gradually, starting in areas where deployment costs are lower and estimated income is higher, with an advantage for operators who arrive first in terms of their investment recovery periods. It is expected that by 2023 (a 15-year period since the investments in fibre optics were supposed to begin in 2008), between 43% and 46% of Spanish households will have FttH Internet access supplied either by Telefónica or by other operators. At the end of 2012, 18.4% of households were passed by fibre. Main cities, such as Madrid and Barcelona, were expected to sustain two to three alternative fibre optic networks in addition to Telefónica’s. However, according to the report, there may not be sufficient demand to incentivize the presence of any alternatives to Telefónica in less populated areas. In such cases, owing to the lack of attraction in terms of investment, actions from public authorities would be desirable11. Alternative operators would have practically no presence in smaller municipalities (those with fewer than 1,000 inhabitants) and, if they were present, they would take more than 15 years to recover their investments. Municipalities with populations between 1,000 and one million inhabitants could have FttH network access provided by an alternative operator in competition with the incumbent within 15 years. In municipalities with more than 50,000 inhabitants, alternative operators that deploy fibre optic networks would be able to recover their investments within 9 to 12 years at most. The investment recovery period for municipalities between 5,000 and 50,000 inhabitants would be between 13 and 15 years.
12.5 Analysis by technologies: hybrid fibre-coaxial cable
In Spain, cable television had not been developed and no specific regulating framework was in force prior to 1990. Therefore, when, later than in other EU countries, the first initiatives for deploying cable networks appeared in the early 1990s, their regulation encountered a legal vacuum. Initially, the government prosecuted these initial installations; the jurisprudence backed this approach until 1994, when the Constitutional Court found this situation to be unacceptable. Although its repercussions were modest12, it was blatantly obvious that the legal vacuum needed to be filled.
The government’s answer was the Cable Telecommunications Act finally published in December 199513. This Act regulated the cable telecommunications service but not the cable television service. At that time, the European Commission had not yet abolished the restrictions on provision of soon-to-be-liberalized telecommunication services over cable television networks.
The 42/1995 Act organised the cable telecommunications service into unspecified territorial districts, with a scope that could swing from part of a municipal area to groups of several municipalities, always with a minimum of 50,000 and a maximum of two million inhabitants. Following the setting up (and subsequent extension) process, the Spanish map was divided into 43 districts, 14 of which did not exceed the territory of a municipal area and the rest including several municipalities with geographic extensions of extremely different nature. The regulations allowed two operators to provide services in each district: Telefónica Cable (a new branch of the incumbent) by default and the winner of a public tender. The first tenders were awarded at the end of August 1997, but it was in 1998 when most authorizations were awarded and concession agreements signed. Generally, new operators started their roll-out and service implementation in 1999. Telefónica Cable, on the other hand, needed to comply with an 18-month moratorium, later increased to 24 months, before starting to provide services. This moratorium became eternal since Telefónica, despite having stated in the media that it maintained its interest in the cable business, focused its strategy on developing ADSL and never used the cable license as such.
One of the criteria used for awarding the license responded to the coverage predictions of the district and the periods required fulfilling them. The twelve initial cable operators included in the schedules submitted to the tenders a series of commitments for network deployment that would be not only universal but also very fast. Fairly soon, it was obvious that such expectations would not be met. The economic situation of the ICT industry, the deployment of ADSL by Telefónica14 and factors such as the occasional slowness of local governments in awarding the civil works licenses soon changed the scenario. After some hard bargaining15, in October 2002 the government ʻadaptedʼ the obligations and commitments of cable operators in order for them to approach their investment decisions ʻin a more rational way and better adapted to the conditions of their marketʼ.
Despite these considerable initial problems, broadband market dynamism allowed for the number of cable modem lines to grow strongly up to 2006. However, since that year, the growth has been much more modest and, in fact, cable is now losing market share as shown in Figure 12.2. During this time, a series of mergers and purchases have led to a single operator (Ono) holding 75% of cable access lines and a 14.8% share of the broadband market, leaving out some regional operators mostly in the north of Spain (R in Galicia, TeleCable in Asturias and Euskaltel in the Basque country). Ono also holds most of the assets of the former ‘second national operator’ Retevisión.
Cable has pioneered two main developments in broadband markets in Spain, later to be followed by the incumbent operator. First, by 2009 approximately 45% of cable users had already purchased triple-play (as opposed to 15% of Telefónica’s broadband clients and 5% in the case of the remaining operators at that time). Second, cable launched higher data rates early. Again by 2009, 15.9% of cable subscribers already enjoyed throughputs of 10 to 20 Mbit/s and 1.4% above 20 Mbit/s. Later in 2011 and 2012, they launched DOCSIS 3.0, advertising data rates of at least 50 Mbit/s, a key trigger of the subsequent FttH deployment. As mentioned before, in 2012 cable technologies in Spain accounted for 60% of NGAN subscribers and 62% of installed access lines.
12.6 Analysis by technologies: fixed wireless access
The tenders for awarding six so-called ʻloop via radioʼ licenses (WLL), three in the frequency band between 3.4 and 3.6 GHz and another three in the 24.5 to 26.5 GHz band, were published in October 199916 and awarded five months later. The tender-winning consortiums were made up of companies with experience in the sector, as well as many others who intended to take positions in the telecommunications market that was then considered to be more than promising. In addition to the six awardees, the second and third telephony operators, which in 1998 had already received authorization to operate in the higher band (Uni2) or in both (Retevisión), were awarded licenses by default. The geographic scope of the licenses covered the whole national territory.
As was the case with the cable tenders, the winners published projects that were much more ambitious than the minimum required by the call for tenders. For example, one of the consortiums that won a license in the 26 GHz band promised to cover ʻat leastʼ all the Spanish cities with over 50,000 inhabitants in less than four years. In reality, the situation never matched the forecast in the companies’ plans. In the case of WLL, it can be said that it was never even remotely close. In 2002 all operators combined had just 818 clients and the residential sector provided no income whatsoever. Continuing with the parallels with cable, the Ministry for Science and Technology decided to relax the commitments of WLL technology operators (ʻto allow them to optimise their deployments and design them according to demand criteriaʼ). Here as well, a merger process occurred, leaving only a few surviving companies.
The replacement of the TRAC system (Telefonía Rural de Acceso Celular, cellular access rural telephony, launched originally to complete the universal service obligations on voice telephony) seemed to be able to lend some strength to WLL operators. It provided services to 260,000 clients located in remote rural areas. The replacement of TRAC became unavoidable to meet the provisions of the 2002 universal service Directive, since the existing TRAC did not provide functional access to the Internet. It was suggested that WLL technology was the most suitable to replace TRAC lines, but the operator ultimately required to carry out the replacement (Telefónica) did not hold a license to use this technology. Nonetheless, Telefónica did call for tenders to select interested operators. The award process was delayed and it did not end until late 2008. Ultimately, the replacement process was carried out using a mix of technological options (with GPRS as the main ingredient) among which WLL (in the shape of LMDS) was included although with no significant role.
Lacking other external stimuli, the fixed wireless access offer is only present today in a handful of cities. During 2009–2011, it seemed that WiMAX, as the next-generation technology in WLL, could become at least a niche solution for those areas lacking a proper wired broadband connection, such as suburban or spread out residential areas. As of 2012, WLL lines amounted to just 120,000, suggesting that it is not (and never has been) an alternative to the traditional loop or to cable in Spain.
12.7 Analysis by technologies: mobile broadband
It stands without question that the deployment of new generations of mobile communications technologies, 3G and beyond, has changed substantially the scenario of broadband access. In practice, mobile technologies have become a platform able to complement – but also increasingly to compete with – traditional fixed broadband access.
From about 2000, Spanish mobile operators have been well aware of the opportunities involved in mobile broadband services. In fact, the Spanish government was the second EU member state after Finland to attempt to launch UMTS 3G technology: the process for granting four licenses for the new technology was initiated on 10 November 1999. The government opted for a beauty contest (with a fee per license of EUR 129.2 million), which resulted on 10 March 2000 in the three existing operators at the time – Telefónica, Airtel (now Vodafone) and Amena (now Orange) – receiving 3G licenses and a fourth new license for Xfera (now Yoigo). As specified in its offer, Xfera scheduled the beginning of its operations for 1 August 2000 with a total investment of about EUR 7,800 million in a brand new mobile network. However, the unavailability of suitable terminals for 3G technology and the financial difficulties derived from the dotcom bubble delayed sine die the launch of its services (as well as two new licenses that were considered for the DCS-1800 band).
Owing to these difficulties in early UMTS deployment, the ‘leap to the next generation’ took place through smaller steps using several intermediate extensions of the existing 2G technologies, generically called 2.5G. Telefónica started its WAP service in March 2000, its e-moción platform for content and applications three months later and launched WAP over GPRS during January 2001. In June 2001 Amena opened a similar service for business customers and in November made it available to all users. In December 2001 Vodafone (which took control of Airtel in early 2001) followed. The MMS (Multimedia Messaging System) appeared in the market in 2002. Officially, the launch of UMTS services had been delayed by the government from 1 August 2001 to 1 June 2002. In practice, there was no commercial offering until February 2004 and, even then, it was only addressed to laptop computers (using PCMCIA cards) since no other terminals were available. In July 2005 Amena was sold to France Telecom, changing its name to Orange in October 2006. In December 2006 Yoigo began its activities after the majority of Xfera shares were sold to TeliaSonera.
During 2007 the new 3.5G technology was launched (HSDPA, later followed by HSUPA to configure the full HDPA standard), improving the available data rates, mainly for urban users. Also during 2007, commercial offers for mobile data access were already generally available. At the end of 2008, ten operators (the four network mobile operators and six additional mobile virtual network operators) were offering flat monthly fees (always with a data cap) for mobile Internet access. At this point, the number of mobile broadband subscribers (datacards for laptops and mobile devices with a monthly subscription to mobile Internet) was 11.5% of the total number of broadband subscribers (Figure 12.3), reaching 16.7% by the end of 2009.

In fact, based on data from the XIV Implementation Report (EC, 2009), Spain led the penetration of mobile broadband with regard to the total number of mobile subscribers with 25.9%. In April 2013, mobile broadband penetration was 54%, still in the top three of EU countries. Finally, 4G mobile technologies (LTE) started their deployment in mid-2013 in some of the main cities through Vodafone and Orange.
From a regulatory perspective, the model in place has supported the cycle of investment – the renewal of technology. In fact, it can be said (Ramos, Reference Ramos2005) that the competitive scenario of mobile communications in Spain – and in most European countries – has been characterized by a ‘light-handed’ approach where the basic instrument has been the introduction of new operators using the transition between technology generations. Therefore, the level of competition has increased one step at a time as new licenses have been granted: from two operators with analogue 1G (Telefónica and Vodafone), three operators when 2G was installed (Orange), to a fourth mobile network operator with the introduction of 3G (Yoigo). The result so far is Telefónica with four licenses (TACS, GSM-900, DCS-1800, IMT-2000), Vodafone with three (GSM-900, DCS-1800, IMT-2000), Orange with two (DCS-1800, IMT-2000) and Yoigo with just one (IMT-2000). In addition, Telefónica and Orange have obtained licenses to operate in the GSM-900 extended frequency band in exchange for a promise to complete coverage in underserved areas. The difficulties in the re-farming of spectrum in Spain in the presence of these asymmetries in the licensing process should not come as a surprise. Thus, the mobile regulatory model in Spain has been directed to promote facilities-based competition and, as a consequence, the vertical integration (‘silo model’) of infrastructures and services.
Within this model, the necessary conditions have been set for operators to bet on continuous investment in networks and infrastructures, a must for mobile technologies where the lifecycle of assets is much shorter than in fixed technologies. The result has been a ʻvirtuous circleʼ of investments and innovation where prices for consumers have decreased following a soft glide path that has favoured the recovery of investments and innovations in next-generation technology. This level of investment has affected the coverage of mobile communications in terms of both population and territory. In particular, mobile broadband coverage was already at 85% of the population in 2007 (IDATE, 2008) and beyond 90% in early 2010. Coverage of the territory is among the highest of the ‘large’ countries in Europe (only the UK does slightly better) and it is above the average of EU15 (at 83%) and well above the average of EU27 (at 77%) despite the comparatively low density of population and its dispersion in Spain.
However, in the case of LTE, the mobile industry’s virtuous cycle of investment, innovation and adoption of services has been broken, being replaced by a cycle that runs in the opposite direction. Now the innovation and adoption of services require investments from mobile operators although these will not necessarily lead to an increase in operators’ revenues. Moreover, both forces will remain strong during the period considered, fuelled by pre-existing utility and the established habits of mobile broadband consumers. Therefore, the pressure on operators to make the required investments and increase available data rates will only increase.
As a final summary of the mobile markets in Spain, Figure 12.4 displays the evolution of total revenues for mobile network operators. It is interesting to note the positive evolution of the fourth mobile network operator and mobile virtual network operators, proving that the market still had margins for higher levels of competition, at least in the short run. In addition, the total size of the market has been shrinking since 2009 due to the economic crisis, increasing levels of competition and the substitution of services (SMS by instant messaging, voice calls by flat data rates).

Figure 12.4 Total revenues in the mobile market by operator, Spain, 2001–2012
12.8 The public perspective on the deployment of broadband infrastructure: efforts towards universal broadband
As shown in the previous sections, the euphoria with which enormous investments in new networks were planned was soon buried under the reality of their slow progress. Outside metropolitan areas, the actual basis for extending fixed broadband infrastructures geographically has been (and continues to be) the improvement of the initial infrastructure and not the deployment of new networks. Since in Spain, as stated above, no cable networks have been deployed in the past beyond urban areas, the result is that in any area with a low population density the evolution of broadband geographic coverage has depended almost exclusively on ADSL. The adaptation of exchanges to provide ADSL was initially very fast but slowed as the most potentially profitable areas were covered, leaving a map of areas (basically rural ones) that the European Commission would call ʻwhite areasʼ, namely those without broadband connectivity.
Public administrations were aware of the delay with which broadband would reach rural areas, even if the most optimistic plans were met. In fact, since relatively early – January 2001 – there have been calls to extend broadband coverage into rural areas: during the presentation of the master guidelines of the first Spanish programme (Info XXI) for promoting the information society17, one of the ten strategic objectives included was the extension of broadband access networks to cities with fewer than 50,000 inhabitants. Those municipalities joining the so-called ʻRural Internetʼ programme were promised the installation of a ʻpublic broadband access pointʼ based on satellite technology. In addition to the connection, the equipment for the community space and expenses generated during three years would be financed.
The lack of correspondence between the objectives of this ‘first-generation’ development plan for the information society, the resources actually available and the objectives achieved resulted in the creation of the so-called ʻSoto Commissionʼ18 to review what the main lines of action should be to promote the information society in Spain. As a result, a new plan, ʻEspaña.esʼ, was passed in July 2003. The programme provided three ʻhorizontalʼ guidelines: strengthening the offer of content and services to promote demand, improving accessibility, particularly by establishing public access points, and communication efforts addressed to the society. It already included a specific plan for extending broadband into rural areas, but it was not started within the lifespan of the overarching plan because of the complexity of arrangements with both EU structural funding and regional governments.
In any case, again this plan only partially fulfilled its main goals on information society development and a new plan was sought. In 2005, while the European Commission was designing a European framework strategy for the following five-year period – the i2010 initiative – the Spanish government prepared a new convergence plan to re-attempt to speed up the transformation of the country into an information society. The convergence referred to the distance as regards the other European countries, but also aimed to correct domestic inequalities. The new Avanza plan19 boasted the ʻNational Programme for the extension of broadband access in rural zonesʼ (PEBA). The activities for the start of the programme were based on the cooperation of regional governments and local municipalities, although only those regional governments interested in coordinating their actions with those of the Ministry participated in the programme in practice.20
The PEBA programme managed a high degree of objective achievement. It was formulated using public-private cooperation models, where beneficiary operators invested EUR 85 million, while the central administration added EUR 8 million in subsidies and EUR 17 million in refundable credits. The tenders, based on the technological neutrality principle and on competition between operators, required that users receive at least 256 kbit/s in the most unfavourable cases and that a service be offered with a maximum monthly fee at a ‘reasonable’ price. When the programme concluded in 2008, broadband coverage had reached 98% of the population. Obviously, wireless technologies were already present in the market when the projects were developed and in addition to ADSL, WiMAX, satellite and 3G/HSDPA were also used.
It is also worth highlighting that by 2010 almost every regional government had its own development plan, usually including specific strategies for broadband development21. Further, a considerable number of municipalities had launched their own strategies and plans (Ramos, Arcos, and Armuña, Reference Ramos, Arcos and Armuña2009). These were largely based on structural funding that has lately vanished.22
These strategies ranged from complementary plans to those of PEBA previously discussed to the launch of public operators aimed at bridging the gaps in provision by commercial operators. Typically, regional initiatives were based on public ownership with public network management, such as Asturias, or with private management, such as Catalunya and Consell Insular de Menorca. The Asturcon network was the first public FttH network in Spain. The management of the network is public and customers can choose among four private operators. This network has been deployed with European structural funding for industrial restructuring. The case of Xarxa Oberta in Catalunya uses the concession model. The regional government is the owner but a private operator manages the network.
Two main policy objectives emerge in these regional and local initiatives: territorial balance and social equity. A number of the broadband network deployment projects with public participation aim to provide services that are broadly available in other parts of the country but that are not available in a specific ʻwhite areaʼ, in order to reduce the eventual disadvantages suffered by the businesses and consumers of the area. Other projects aim at the early development of advanced electronic communications infrastructures and services (such as the deployment of NGAN or municipal wireless networks) as a means to create potential competitive advantages in their region, thus increasing the economic development of that geographical area.
Obviously, these strategies were not always aligned with national plans or market rules, creating frequent discussion or even intervention from regulatory bodies23. Moreover, there was little data about potential demand or the sustainability of business models in this first wave of initiatives. In addition, and according to Spanish regulations, any electronic communications action provided by public administrations must guarantee compliance with the provisions of the LGTel24 and compliance and enforcement of the principles set forth in it, particularly maintaining effective competition in telecommunications markets. In addition to this general principle, the CMT states that the provision of electronic communications services by public administrations must be financed by the revenues generated from commercial exploitation, it not being allowed to compensate for losses using public funds (the private investor principle). Further, structural separation is required between the public body providing the services and those bodies in charge of passing rights of way for network deployment. In addition, the benefits of public intervention compared with its costs must be proven. As a consequence of these rules, it seems that the deployment of open access infrastructures (‘neutral operator’) and management by an independent entity is (almost) the only possible solution, while the provision of final customer services seems to be a much more difficult case to prove. However, and as a final summary, it can be said that regional plans have succeeded in contributing to the extension of broadband availability in white areas. Therefore, in parallel with the growing importance of the information society concept over the past decade and a half, a transition has been made from public administrations’ main regulatory role to considering the diverse – and practical – public intervention patterns that ensure the deployment of broadband infrastructures and services and increase of data rates (Feijóo and Milne, Reference Feijóo and Milne2008).
12.9 Achieving the Digital Agenda targets
From 2009–2010, public strategies for the universal provision of broadband in Spain forked in two separate directions. On one side was the continuation of information society development to achieve ultra-fast broadband for the majority of the population; on the other was the extension of universal service obligations to include a minimum broadband data rate for the whole population, particularly in those areas with a lack of appropriate infrastructures.
The continuation of the Avanza Plan – Avanza2 – set out rather ambitious objectives: 70% of the population with broadband availability at 50 Mbit/s or higher and 60% of the population with broadband availability at 100 Mbit/s or higher by 2015. No specifications on quality of service (QoS) or distribution of data rates between upstream and downstream were available. There were also no indications of how and why market competition was going to achieve these levels of broadband availability. Thus, as of 2013, achieving these targets with a serious QoS looks relatively improbable.
The latest information society development plan in Spain – fifth generation – called the Digital Agenda for Spain points in the same direction, considerably reducing the objectives of the previous plan and aiming at full coverage for households with at least 30 Mbit/s by 2020, with 50% of households having adopted data rates higher than 100 Mbit/s by 2020; these are the same targets as in the Digital Agenda for Europe (DAE). Again no specifications on QoS were available and, therefore, it is unclear, for instance, whether 4G mobile communications availability alone would be considered enough to meet this goal. This part of the Digital Agenda for Spain is developed through a National Strategy of Ultrafast Networks25 published in June 2013 that strangely contains specific objectives only for 2015, although the general objectives are set for 2020. It expects availability of 100 Mbit/s connections for 50% of the population by 2015 and considers the departure point of 2012 with 46% availability of HFC and 9% of FttH. Interestingly, then, cable is counted as able to provide 100 Mbit/s and, as new deployments of cable operators are improbable, meeting that goal depends either on the fibre deployments of the incumbent operator or in enhancements in the provided DOCSIS standard. The second objective is achieving 25% NGN penetration – above 30 Mbit/s – by 2015, although again the potential contribution of mobile communications is unclear and remains unspecified. The third objective consists of achieving a 70% (75% in other texts) penetration rate for 4G by 2015. According to the plan, the main tools to achieve these goals lie in reforms to the regulatory framework to decrease deployment costs, the use of public funding in white and grey areas, coordination of the various administrations involved in network deployment, allocation of the available spectrum and diverse measures to encourage demand. However, most of the secondary regulations required to implement these tools remain unpublished at the time of writing.
Regarding universal service obligations, after several previous attempts, in January 2012 operators started to provide broadband of at least 1 Mbit/s, thereby in practice including a modest degree of broadband among the objectives of universal service. In the most remote rural locations, the technologies used to comply with this regulation are mobile communications, fixed wireless access and satellite. Some regional governments had already declared this type of broadband to be a universal service (Andalucía famously) as early as 2009. The Digital Agenda for Spain also mentions achieving at least 30 Mbit/s in municipalities of fewer than 5,000 inhabitants by means of wireless technologies. No QoS is mentioned at the time of writing.
As a summary from the perspective of the DAE, all of its main actions are included in the new Digital Agenda for Spain. Regarding their status, the inclusion of basic broadband connections at 1 Mbit/s in the universal service obligations has already been achieved; see above. Legal and institutional support for NGN deployments was already foreseen in Plan Avanza 2 (Action 46 of DAE). In fact, financial support targets have been put in place in the Spanish version of DAE, although with budgets according to current financial constraints in Spain and using structural funding where possible. On the regulatory side, a new version of the General Law for Telecommunications is under parliamentary discussion as of October 2013, its main aim being to foster the deployment of NGA networks. Some measures (e.g., setting at 6 months the maximum delay to grant rights of way to operators) have already been approved in Royal Decree-Law 13/2012, transposing the revised Directives approved in 2009. However, in practice this is seldom achieved and competences scattered across levels of administrations are still a main bottleneck in telecom infrastructure deployment. Also, coverage maps are developed annually, as they are a critical tool for the design and implementation of potential broadband aid schemes. Along the same lines, the Spanish NRA has issued detailed regulation for sharing of civil works and ducts. In this regard Spain had since the early 2000s a pioneering regulation for access to in-building infrastructures that has been updated to cope with technological developments. Ongoing revision of the Telecommunications Law will include provisions fostering the re-use of available infrastructures (Action 47 of DAE). In addition, the digital dividend spectrum auction took place in 2011, although television spectrum has still to be fully re-farmed at the time of writing to allow its use for next generation mobile communications. The 900 MHz, 1800 MHz and 2.5–2.69 GHz frequency bands are available and authorised for third- and fourth-generation mobile services use, with the 3.4–3.6 GHz frequency band under way. Spain also implemented the transfer or leasing of right of use in the harmonised bands although detailed regulation is still pending (Action 49 of DAE). As a general note on the DAE achievements, Spanish performance is better in those actions that are linked to legal or direct administrative action in one specific level of administration. However, when multiple stakeholders are required or multiple jurisdictions are involved, its performance tends to be weaker.
12.10 Case analysis
The dynamics of the broadband market in Spain have followed the stages of the electronic communications regulatory framework set out by the EU. However, within this broad picture, Spain has a number of distinct features described in detail in previous sections but impossible to understand without first acknowledging some of its distinct geographical, social and economic features.
From the geographical perspective, Spain is one of the most mountainous countries in Europe, only behind Switzerland and Austria26. This fact has caused many difficulties for the extension of every type of infrastructure and, obviously, the broadband telecommunications case has been no different. As a main instance, universal service for voice telephony was only completed in the 1980s with the use of wireless solutions (the previously-mentioned TRAC system) – in reality, the deployment of 1G analogue mobile telephony. When Internet access was included as a universal service in the early 2000s, this system for rural areas had to be upgraded, again using wireless technology, because of the difficulties of rolling out wired solutions. As another main instance of the influence of geography, during 2004 a plan for broadband extension in rural areas (the previously-mentioned PEBA) was started using regional funding to update local exchanges to be prepared to provide DSL services.
Related in part to geographical factors, the distribution of the Spanish population is highly heterogeneous. The twenty-nine municipalities with populations over 200,000 inhabitants represent 29.7% of the total population, but only 1.71% of the total surface area. At the same time, municipalities that fall within the definition of rural, i.e., population density lower than 300 inhabitants/km2 (EUROSTAT, 2010), account for 7,401 municipalities of the total 8,112, encompassing 33.6% of the total population and 94.8% of the territory. This simple fact, as well as the previously mentioned geographical barriers, explains rather convincingly why many infrastructures easily reach about 60% of the population in Spain and why it is considerably more costly to reach the remaining 40%. Cable deployment is a good example of this case.
Another decisive element is the irregular distribution of wealth across regions in Spain. For example, the autonomous region of Madrid, with 13.7% of the total Spanish population and 18% of Spain’s GDP, takes up just 1.59% of the total surface, while Navarra, a region with a similar surface (2.05% of the total) has just 1.35% of the total population and its contribution to total GDP is a meagre 1.7%. Broadband deployment is obviously affected by this heterogeneity: while the average penetration of broadband in households in Spain is 66.9%27, Madrid, the region with the highest penetration (77. 3%) is 10 points above the average while Extremadura – the poorest region – has a penetration of 10 points below it, at 57.9%. Table 12.1 and Table 12.2 summarise the regional differences in Spain, showing that the averages are not a good indicator of the real situation.

These factors, in combination with the market structure, have resulted in a peculiar combination of below-average adoption28 and an above-average level of availability of broadband connectivity (but based on legacy technologies, basically DSL) in comparison with similar countries29.
In fact, the structure of the market, and the competition within it, is distinctive for Spain. Telefónica, the national incumbent operator, retained a market share in broadband higher than the average of comparable cases30. Cable in Spain (composed of Ono as the main operator and other smaller regional operators) has only been deployed since the mid-1990s and it remains limited, fundamentally to urban areas with relatively high population densities. The resulting competitive panorama in fixed broadband technologies is a blend of infrastructure-based and service-based competition (alternative operators using the infrastructures of the incumbent) in urban areas and almost a lone presence of the incumbent in suburban and rural areas (with some interesting regional exceptions). As a consequence, facilities-based competition in the form of a duopoly is intense in those areas where cable is present, while in the remainder of the territory competition only happens through the incumbent’s infrastructure. This has always called for considerable discussions in Spain on the benefits and drawbacks of this situation and consideration of potential remedies, either through market forces or of regulatory nature. In any case, and as an overall result of these features of the market, broadband prices in Spain have been traditionally higher than the average in comparable EU countries31 and the most frequently used data rates are also lower32.
Another feature of broadband markets in Spain of particular interest is related to wireless technologies. With a similar competition structure to that of other EU countries, the coverage and penetration of mobile broadband, particularly the penetration of smartphones, is among the highest in Europe (and in the world)33. There is no obvious explanation of this fascinating result, although some available evidence point to specific features of Spanish demand and lifestyles.
A final relevant characteristic of broadband markets is linked to the structure of the actual competition and the three-layered public administration structure. This consists of the considerable involvement of some local and regional administrations in all forms of broadband encouragement and even deployment, to a certain extent irrespective of the economic crisis, and at the same time a number of relevant difficulties for deployment derived from lack of coordination and excessive red tape from these same three layers of government.
In summary, and from the particular perspective of broadband, Spain has a number of distinct features in comparison with similar countries: lower fixed broadband penetration, higher fixed broadband coverage, the pre-eminence of DSL technologies, delay in high-data rate broadband connections in both supply and demand, and higher mobile broadband coverage and penetration.
The market dynamics to arrive at this situation have been characterized by some particularities of the Spanish case: geographical elements (higher costs of deployment in rural areas); administrative features (three-layers of conflicting competences for network deployment on one side, but also the involvement of regional and local governments in broadband provision on the other); the socio-economic profile of Spanish customers (lower income but with a preference for mobile solutions); a mostly service-based competition on incumbent facilities in fixed broadband, but with an important role for cable operators as a key force for the provision of ultra-fast broadband services; the successful use of structural funding for the inclusion of (modest) broadband as a universal service; the general lack of achievement of more ambitious information society development plans; and relatively intense competition between mobile providers.
12.11 Reflections on the future
From this scenario, it is interesting to examine briefly the implications of the current situation when looking at the next steps in the evolution of broadband: the deployment of NGNs in Spain. In fact, the conditions for the deployment of the access part of NGNs (NGAN) are currently at the forefront of the debate about the role of telecommunication markets, the best regulations for them and the level and modes of potential public involvement (see Gómez-Barroso and Feijóo, Reference Gómez-Barroso and Feijóo2009, for a discussion).
In the case of Spain, the uncertainties about NGNs are influenced by the diverging paths of industry technology roadmaps and possibly by some doubts about the implementation of the regulatory scenario, as well as, especially, by the economic uncertainties about return on investment.
First, and the datum is no less important despite being expected, it is clear that any NGN requires major investment. As a consequence, the general economic situation has a huge influence on deployment as well as uncertainties in demand. In addition, the recovery of these investments implies that the prices charged for access and usage of the services should not differ much from current prices. Every available study agrees on this point (Analysis Mason, 2008, 2009; De-Antonio, Feijóo, Gómez-Barroso, Rojo, and Marín, Reference De-Antonio, Feijóo, Gómez-Barroso, Rojo and Marín2006; Jeanjean, Reference Jeanjean2010). In the words of Noam (Reference Noam2010):
…a competitive fiber-based network industry is potentially even more unstable than the preceding industry structure, since the ratio of fixed-to-variable cost is higher than before. Investors remember the calamitous impacts of the previous downturn […] these factors are likely to reduce governments’ previous emphasis on competition and lead to a greater emphasis on stabilization.
In addition, it is worth remembering that, should demand for large bandwidths appear, it could happen that no access technology by itself, at least with the technical and economic conditions expected today, could present the optimal characteristics for satisfying all the requirements demanded by users in every circumstance. Therefore, the various advantages and drawbacks for each technology, backed by the need to achieve a return on investment, lead operators to create platforms capable of integrating different access technologies over the same backbone network. The future market of the ICT sector, characterised by ʻcomprehensiveʼ operators, would be quite different from the current one where there is clear separation between technologies.
However, the departure point for the different types of operators in Spain (historic, cable, wireless, alternative and even potential new agents) is not the same. These initial differences are conditioning the path followed for the transformation of their networks into NGNs and will continue to do so in the future. As a consequence, each operator has a different set of drivers for migrating to NGNs. These drivers are dictating their basic timeframes for investing in this advanced infrastructure and subsequently migrating services from existing networks.
In a previous study (Feijóo and Gómez-Barroso, Reference Feijóo and Gómez-Barroso2013), the authors considered the scenario for ultra-fast broadband infrastructures and calculated in some detail the costs of deploying a NGN through the main technologies. This work, together with the previous discussion on the development of broadband in Spain, allows us to forecast a baseline for ultra-fast broadband market behaviour. Thus, by 2015 it would be relatively possible for Spain to enjoy a ‘2+’ infrastructure-based competition (incumbent, cable operator and mobile operators) for NGNs at about 50% of premises: that is, roughly nine million households and businesses. Beyond this point, the required investment would be much higher. The cheapest choice would be for a ‘1+’ infrastructure-based competition (incumbent using VDSL-type technology plus mobile operators) for an additional 10% of the population. For the remainder of the population, the most probable option would be no access to NGNs except maybe some scattered local initiatives and mobile 4G deployments, very dependent on the conditions of spectrum licences. These figures seem to be lower than those stated in information society development plans. However, in general, no regulatory ‘carrot’ seems able to easily increase investment in the required zones, and a huge public effort to compensate for the lack of pure market action seems to be impossible under the current economic conditions.
Indeed, operators invest in areas that are profitable. As densely populated areas are more profitable than rural ones, dense areas will be served first. The available data on the NGNs roll-out in Spain confirm this hypothesis. If we consider geographic density as a continuum, there is a point where operators stop investing because it is no longer profitable. In fact, in most rural areas low population density and high deployment costs discourage private investment, creating negative feedback about limited capacity, high prices and low service demand. As a consequence, there is little or no commitment to connect areas that include smaller towns and rural villages (Pereira, Reference Pereira2007). In fact, the data collected by the OECD shows that among developed countries, those with a large urban population such as South Korea, Japan, France and the Netherlands are more likely to achieve a higher rate of broadband penetration than those with significant rural communities such as the US and Canada (Sherif and Maeda, Reference Sherif and Maeda2010). In the case of Spain, the transition seems to happen between zones V34 (zones I–V include 57% of the population and just 1.4% of the surface area) and VI (zones VI–X include the remaining 43% of the population and 98.6% of the surface area). In other words, the discontinuity in potential profitability seems to be at the 500 inhabitants/km2 population density where the ʻgrowth of costs overcomes the growth of the consumption of households in broadband communicationsʼ (Rupp and Selberherr, Reference Rupp and Selberherr2010). Thus, as the profitability of these areas depends on infrastructure costs, which tend to decrease slowly over time, there is some potential for less dense areas to become profitable over time. However, this effect could be too slow and would affect equity significantly in territorial terms for a potentially long period. However, the picture on the investments required to cover less dense zones looks rather different when just a small area is considered. It would be possible to deploy a NGN in a small town or village at an affordable cost, especially if the slow development of the market in these areas is taken into consideration. Therefore, we are confronted with a patchwork of local initiatives that aim to solve the market failures by their own means.
Some additional notes on this future baseline are discussed in the following. First, there are good chances of sharing infrastructure to reduce costs and accelerate roll-out. In fact, as discussed previously, during 2013 the main operators have announced their intentions to share network investments and deployment.
A second relevant feature is the role of copper lines. With new technological developments, copper lines will continue to be a strategic asset well into the mid-term. Not only are they able to provide data rates that would fall into the NGN category right now but, in addition, they also allow for a smoother and more scalable path in the transition from ADSL to FttH. In principle, in Spain the incumbent operator has favoured VDSL only for those customers close enough to local exchanges (about 20% of the total number of fixed telephone lines in Spain). However, it remains to be seen if the deployment of FttH exceeds the urban footprint.
The role of cable networks in Spain has been already stressed in this chapter, and they have proven to be the cheapest alternative for the rapid deployment of NGNs in Spain. Moreover, the authors consider, following Siciliani (Reference Siciliani2010), that ʻthe lack of actual competitive restraint from cable operators precludes the replication [in Europe] of US-like regulatory forbearance, as it might lead to the (re-)monopolization of broadband markets by telecom incumbentsʼ. However, cable operators in Spain have another highly relevant asset from the perspective of NGNs: almost 40% of premises have, in addition to coaxial cabling, a copper wire deployed in parallel with the former. Owing to the architecture of cable networks, this copper line typically runs for the last 500 m to user premises. Therefore, there would be (commercial and regulatory) possibilities to reuse this copper (using VDSL2, for instance) to provide an additional means of deploying NGN for interested parties. Thus far, no one has considered this possibility for increasing competition in Spain.
Wireless technologies (mainly 4G) could play a fundamental role in Spain: not only are they the cheapest solution for rural areas, but they can also complement or even replace fixed broadband in urban and suburban areas, especially as these technologies fit Spanish lifestyles better. Therefore, the usage of spectrum for wireless solutions seems to be a main element in configuring the future broadband landscape.
References
1 Given the monopolistic situation in fixed telephony in Spain before 1996 – when plans for a second national operator were launched – it would have been extremely difficult to introduce competition in such a short period without the interjection of the EC. In general, at the national level the action taken has been rather reactive than proactive in terms of the impact of regulation on telecommunications markets.
2 About 45% of total premises at the end of this period, according to data from CMT.
3 Data accessed in July 2013.
4 RedIris is the public ISP offering connectivity and advanced services to universities, research centres and other parts of the public administration in Spain. It is the Spanish partner in the European Geant network. RedIris administratively is part of Red.es, the Spanish public agency for the development of the information society, in turn belonging to the Ministry of Industry, Energy and Commerce.
5 At that time, Spain was still lagging far behind other countries in Internet development given the high cost of connectivity fees. Thus, a user, in addition to the supplier’s invoice, had to pay the cost of the call to the closest node, which for most meant the payment of international charges. This prevented mass adoption and it was the main reason why in 1995 Spain only had 30,000 Internet users.
6 At the national level, InfoVía seemed to have greater features than the direct access to the Internet at the time for three main reasons: access to the Internet and its services through more than 100 providers competing on this network, costs through InfoVía were much lower than the cost of direct access to the Internet provider (since only a local call was required) and access quality seemed to be better as InfoVía was specifically designed and sized by Telefónica.
7 Telefónica reacted by launching InfoVía Plus with the objective of solving the bandwidth problems due to the significant increase in Internet users. However, the loss of monopolistic status and introduction of competition accelerated a pace of change that clashed with the traditional management scheme of InfoVía, which had practically disappeared two years later.
8 As a reference, the legal minimum wage in Spain in 2013 was EUR 645.30 per month.
9 Order of March 26, 1999, which establishes conditions for provision of indirect access to the local loop of the fixed public telephone network (BOE 10/4/1999).
10 Royal Decree 3456/2000, of December 22, adopting the Regulation that establishes the conditions for local loop access to the incumbent’s fixed public telephone network (BOE 23/12/2000).
11 All the figures mentioned above are the most conservative estimations from the report; they look at deployment across the whole country, namely from non-niche operators with deployment plans for the country as a whole, and the estimates take into consideration the low uptake for premium services (with added-value services that are only supported by fibre optic). Cable operators have not been taken into consideration in the feasibility analysis despite being the obvious form of competition for fibre optic services and alternative network being present. Furthermore, the study assumes that all alternative operators deploy their FttH networks by purchasing ducts and infrastructure from Telefónica.
12 The scope of each of these networks was modest since many of them were simple ʻcommunity VCRsʼ that did not go beyond the scope of a resident’s associations. However, it was not as modest as regards the number of households involved, which in 1993 reached 1,600,000.
13 Law 42/1995, December 22, for cable telecommunications (BOE 23/12/1995).
14 By the end of 2001, cable reached 17.9% of households, while 82.1% of the switched telephone networks were prepared to use ADSL.
15 Which included cable operators’ peculiar request for Telefónica’s investment into cable at the same conditions applicable to them.
16 Order of October 7, 1999 approving the contract documents for the award of three C2 type individual licenses for the establishment and operation of fixed public radio access networks in the 3.4 to 3.6 GHz band (BOE 9/10/1999). Idem for the 26 GHz band (same BOE).
17 The ʻInfo XXI: la Sociedad de la Inform@ción para todos, 2000–2003ʼ programme was passed over a year earlier, on 23 December 1999, almost at the same time as the first document of the eEurope initiative. Its spirit was in line with the European programme that stated that political support was required for developing broadband, particularly in cases where market dynamics would not be enough to achieve an adequate deployment of these infrastructures along with a package of offers that would be attractive to users.
18 Special Commission for the Study of the Information Society, chaired by Mr Juan Soto-Serrano, president of HP Spain at the time.
19 ʻPlan 2006–2010 para el desarrollo de la Sociedad de la Información y de Convergencia con Europa y entre Comunidades Autónomas y Ciudades Autónomasʼ.
20 This means that other communities maintained their own independent programmes, that broadband extension initiatives have not been exclusively initiated by the central government and that there exists a series of regional (and even local) plans seeking the same goal.
22 See the analysis of FEDEA at www.crisis09.es/redes/aapp.html.
23 In local government projects, the main purpose at the time was providing free Wi-Fi Internet access to citizens. This was a main source of conflict among local municipalities and the CMT, as the regulator did not allow this form of service provision (for free) on a permanent basis, but only for limited periods or limited services.
24 Telecommunications Regulatory Framework in Spain i.e., ʻGeneral Law on Telecommunicationsʼ.
26 Mountain areas in Europe: Analysis of mountain areas in EU Member States, acceding and other European countries. European Commission. January 2004.
27 ONTSI report ʻLa Sociedad en Red 2012ʼ.
28 According to CMT data from April 2013, broadband penetration in Spain (number of broadband subscriptions per 100 inhabitants) was 25.5% compared with an average of 26% in OECD countries at June 2012 (OECD Broadband Portal), and an average of 28.8% in the EU (Digital Agenda Scoreboard at December 2012).
29 According to OECD data from 2009, Internet access through DSL technologies was available in Spain for 99% of the population, while the OECD average remained at 92%. Using Digital Agenda Scoreboard data from 2010, Internet access through broadband technologies was available in Spain for 99% of the population, while the EU average remained at 95.3%.
30 In January 2013, the incumbent operator had a market share of 48.8%, above the 42.3% average in the EU (Digital Agenda Scoreboard).
31 The latest data available on broadband pricing in Spain covering 2013 (Digital Agenda Scoreboard – Broadband Internet Access Cost) indicate that the median offer for broadband at low data rates (8 Mbit/s to 12 Mbit/s) was EUR 30.10 at prices adjusted for purchasing power parity, slightly more expensive than the EUR 29.80 average for the EU. At data rates above 12 Mbit/s and below 30 Mbit/s, the difference was not significant in the median offer, and in the range of offers for data rates over 30 Mbit/s, the EUR 43.00 in Spain is well over the average in the EU (EUR 35.20).
32 According to Digital Agenda Scoreboard data (as of December 2012), Spain had 54.2% of lines with a data rate above 10 Mbit/s (5% lower than the EU average and far from Bulgaria, the leading country with 92.2%) and only 10.2% with data rates above 30 Mbit/s (lower than the 14.8% average of the EU and far below the 58.4% of Belgium). Finally, only 1.9% of lines had a data rate of more than 100 Mbit/s, while the average in the EU was 3.4%, with Sweden the reference country with 24.6% of total lines above this data rate.
33 In terms of the adoption rate of smartphones, Spain was only below Sweden, Norway and Denmark in 2012 with 44 smartphones per 100 inhabitants (Fundación Orange, Reference Orange2013).
34 Zone V: 500–1000 inhabitants/km2; Zone VI: 100–500 inhabitants/km2.
13 Greece
13.1 Introduction to the case study
Greece’s programme for regulatory reform in the telecommunication sector has been guided by the principles prescribed by the European Union (EU) directives. However, its slow implementation of market liberalization in the voice segment occurred on 1 January 2001, several years after the target date of 1 January 1998. This late start allowed Greece to draw on the experiences of other countries regarding the actual pace and effects of regulatory reforms, as well as the policies pursued by member states regarding the development of advanced broadband networks and services, the so called next-generation networks (NGNs) – a major objective of the EU telecom policy for over a decade now.
Greece has been lagging behind in the availability of alternative infrastructures. This is partly due to the lack of a cable network and partly to the reluctance of alternative operators to invest in network infrastructure. This slowed down the development of access competition, in particular platform competition (i.e., the availability of different systems offering high speed access to the Internet). In many other countries, cable has been an important means of creating effective competition with technologies that function over the traditional public switched telephone network (PSTN), in particular xDSL. In the early 2000s it had become apparent to most Greek stakeholders (policy makers, academics and advisors to policy makers) that the lag in Greek telecoms, in both demand and supply, was there to stay unless a serious effort was made by all the actors involved. The intrinsic characteristics of the local market1 combined with the lack of serious competition in the access market (with the exception of mobile) did not allow for a rapid development of broadband access, as was happening in the other EU countries. In early 2000, Greece was the only country in the EU (among the fifteen member states at the time) where the spread of fast, always-on and cheap Internet access was close to 0%!
In the light of this situation, a major initiative took place under the auspices of the Ministry of Transport and Communications, with the involvement of the Greek Research and Technology Network (GRNET). The initiative was led by a Scientific Committee of academic researchers and its primary objective was to initiate a public consultation with all main stakeholders in order to propose a set of ambitious, albeit realistic and manageable, interventions that would enhance broadband in Greece. A starting point for the members of this initiative was the belief that the development of broadband networks and access to broadband services would not be a result of the telecommunications market’s operation at the time. Rather, a new set of business models, tools and practices were required that would bring together, in an innovative way, private and public sector actors to realise a common objective. The initiative was well-timed, as Greek authorities were considering using European structural funds available under the 3rd Community Support Framework for Greece to improve broadband penetration in the country, and therefore were in need of concrete guidance and advice.
This chapter concentrates on broadband developments in Greece that have taken place since this initial consultation in 2000. The aim is to provide a detailed account of the broadband market dynamics over this period, highlighting the strategies and tactics of main actors involved (dominant players in the telecoms market, mobile operators, public entities, regulators, and policy makers), as well as their outcomes that influenced the course of events in the Greek broadband market up to mid-2013. To do so, information was retrieved and gathered primarily through desk-based research from a variety of sources, including:
official web sites of major Greek telecommunications service providers;
official public documents and Internet sites that relate to broadband in Greece;
academic articles and publications as well as deliverables of specialized studies.
In addition, a number of interviews were conducted with key players involved in the conceptualization and design of relevant policies at the time.
Prior to this analysis, however, it is important to place the evolution of the telecommunications sector in Greece into a historical perspective. Thus, this chapter is structured as follows: Section 13.2 presents the historical background to the Greek telecommunications sector. First, it looks at the process of modernization of the telecommunications infrastructure led by the incumbent operator OTE. Next, it continues with an overview of the liberalization process and the role of regulation. The section also discusses the state-of-the-art in the Greek telecommunications market, including alternative operators and mobile service providers. Section 13.3 discusses the case focus of broadband. It starts with an overview of the recommendations of the early consultation process, which led to a number of broadband initiatives funded by public sources (Greek government funds and European structural funds). The section also discusses the implementation of these actions and provides an account of the early results. Section 13.4 discusses the case of municipal broadband networks in Greece and the prerequisites for their successful operation, which are currently scarce. Section 13.5 presents the more recent developments in broadband investments and infrastructure, as well as progress towards the realization of the Digital Agenda targets. Finally, Section 13.6 concludes with an analysis of the main findings of the case.
13.2 Greek telecommunications in retrospect
13.2.1 Overview and milestones in the development of Greek telecommunications.
The first telecommunications operator in Greece, the Greek Telephone Company S.A. (GTC) was established in the early 1930s with Siemens-Halske as its main shareholder. GTC developed local networks in twenty-three Greek towns. In 1946, after the end of World War II, 75% of GTC’s shares were handed over to the Greek state as a compensation for war damages. The Hellenic Telecommunications Organisation (OTE) was founded in 1949 and was given exclusive rights for the operation of telecommunication services in the country. In 1973, a Presidential Decree elucidated OTE’s relationship with the state. In particular, it was clarified that: (a) the state should not interfere in OTE’s management; (b) OTE’s investment programmes should conform to the annual and five-year government investment programmes; and (c) OTE’s agreements, contracts, and tariffs had to be approved by the Ministry of National Economy and the Ministry of Transport and Communications before their launch. Still, despite these clarifications, a period of intensive commingling between OTE and the state started. This was further intensified when Pasok’s socialist government came to power in 1981. In 1985, OTE became a public utility company, which called for an increased representation of employees on its Board of Directors (Constantelou, Reference Constantelou1998).
Until the late 1980s, the telecommunications sector in Greece operated as a natural monopoly. However, in the early 1990s the country’s entry into the European Union and the deteriorating performance of the public network resulted in pressure for a shift towards a more liberalized market environment. At the same time, technological advances in communications systems and services offered ‘windows of opportunity’ for engagement in new service areas, which were attracting the interest of both Greek and international investors (OECD, 2001, p.10).
In their study on Greek telecommunications, Caloghirou and Darmaros (Reference Caloghirou, Darmaros, Bohlin and Grandstrand1994) identified three phases in the history of Greek telecommunicatiosn policy-making: The first phase (1949–1980) was characterized by massive investments in network infrastructure aiming to extend basic service provision across the country. During this time, OTE was purchasing switching and transmission equipment from a variety of vendors. This tactic resulted in OTE ending up with twelve different types of analogue switches which in the 1980s were becoming increasingly obsolete. The second phase (1981–1990), was initiated when the Socialists came to power and was characterized by an increased involvement of the state in OTE’s affairs, leaving the organization with very little room for independence and autonomy in its organisation and management. A third phase in Greek telecoms history started in 1991 and lasted until the opening of the voice market to competition in 2001. During this time, a duopoly was introduced in the provision of digital mobile telephony whereas OTE’s emphasis was on the modernization and digitalization of its fixed network infrastructure. This period was also characterized by significant delays in the formulation of policies and actual decisions that would prepare the ground for the upcoming liberalization of the sector. Towards the end of this period, OTE launched its ISDN service, at a time when all major operators in the EU had already moved into ADSL. Still, for OTE, which during the previous years had invested heavily in building intelligence into its network, skipping the ISDN phase and moving directly into ADSL seemed like the wrong decision at the time. Such a strategy would not allow for a payback of the investments made; moreover, it would make those investments obsolete, requiring extra financing for the new technology to be introduced.
The opening of the voice market to competition on 1 January 2001 marked the beginning of a fourth phase in Greek telecommunications development. In fact, in June 1996, the Greek state and OTE entered into negotiations with the European Commission for an extension of the EU’s 1 January 1998 deadline for full liberalization to 1 January 2003. The arguments on the Greek side were that inherent national financial constraints, OTE’s costly modernization program and the increased pressure of pending demand for basic service throughout the country had put extra burdens upon OTE. Therefore, full digitalization could only be achieved if OTE was further guaranteed sufficient revenues by maintaining exclusive rights for a longer period of time. The Commission rejected the arguments of the Greek side and granted OTE an extension only until 31 December 2000, to allow OTE sufficient time to rebalance its tariffs. The OECD was even stricter in its judgement of the situation: as OTE was making significant strategic investments in the Balkans throughout the 1990s, it seemed well positioned to bear the cost of universal service in Greece, given the resources available for foreign investment. To which it added: ʻhad OTE operated in a competitive environment, there would have been no reason to question its external investmentsʼ (OECD, 2001, p.7).
The full opening of the Greek telecommunications market to competition made the 2000s a decade of rapid technological and institutional changes. These were also driven by the political will of the new Socialist government and the euphoria associated with the positive international financial climate and the prospective organisation of the 2004 Olympic Games in Athens. During this time, all actors involved were going through a learning process, each in its own domain; OTE was investing in its network, while defending its position as the incumbent operator, making life difficult for new entrants who were heavily depended on OTE to roll out their networks. At the same time, the national regulatory authority (NRA), EETT, began to take an open approach in decision-making by initiating public consultations on matters such as the unbundling of the local loop, the allocation of fixed-wireless access licenses, etc. Despite criticisms by some market participants that these processes were not managed properly and ended up being cumbersome and time-consuming, the need to catch-up after years of indecision and delay made an open and effective consultation procedure an indispensable part of the way forward.
It was in early 2000 that discussions on the creation of a strategic framework for the development of broadband started with great enthusiasm among industry experts and policy makers. The spirit in these discussions (and in the ones that followed) was always in favor of state involvement in network financing through national and/or European funds (e.g., EU structural funds). In contrast to the situation in other European countries (e.g., Denmark, see Chapter 6), the future of broadband in Greece has always been seen as a ‘market failure’ problem which demands state intervention in some form of public (co-)financing in the roll-out of infrastructure. In this vein, in 2010 the idea was put forward for the development of Fibre-to-the-Home (FttH) by creating an independent, passive fibre-optic network open and available on equal terms to all undertakings providing electronic communications services as an alternative to OTE’s nationwide network. This next-generation access (NGA) network would be co-financed by public sources. The argument was that without public intervention (legislative and co-financing) no provider – not even OTE – would undertake the cost of developing such a network entirely on its own. To this end, a public-private partnership (PPP) agreement was proposed, in which private entities would undertake the cost and risk of the necessary investments in exchange for the commercial exploitation of the NGA network through the wholesaling of local loop fibre optic at affordable prices. However, as will be discussed later in this chapter, the financial crisis put these plans on hold for an undetermined period.
In the following sections developments in the Greek telecommunications market are discussed in more detail by theme: first the regulatory developments, followed by a discussion of the role of the operators. The section concludes with a discussion of the developments in the mobile sector.
13.2.2 Telecommunications policy and regulation in the 1990s and 2000s
In the 1990s, Greece derogated from nearly all deadlines set by the European Commission regarding the gradual opening of markets to competition. For example, value-added networks and services over leased lines appeared in Greece in the early 1990s, offering services to closed user groups and corporate customers. However, OTE was given special permission by the European Commission to maintain its exclusive rights over public data networks and services until 1997, whereas data and satellite communication markets in other EU countries had opened to competition as early as 1994. The use of alternative network infrastructure for the provision of data and other value-added services was liberalized in October 1997. Some utility companies, such as the National Railways and the Public Electricity Company, expressed interest in deploying dark fibre through their existing country-wide infrastructures. However, none of these companies went further to become an alternative network provider.
This situation should be seen in the light of the political climate of that period. For the most part of the 1990s, the Socialist government maintained a defensive and inactive stance to the structural changes to be introduced into the sector and it considered liberalization as a rather intrusive force to the established status-quo serving the interests of OTE, state authorities and OTE’s main equipment suppliers. On its part, the European Commission exercised a carrot-and-stick policy towards Greek authorities. For example, in 1997, it suspended subsidies to OTE on the grounds that there were serious delays in the harmonization of Greek legislation to EC directives (OECD, 2001). Nonetheless, on the eve of opening the full market to competition in January 2001, the Greek authorities managed to put in place most of the key pieces of legislation required, including provisions for universal service obligations, draft licenses for alternative operators, and provisions for interconnection charges. OTE also adopted current, rather than historical, cost accounting principles, as a first step towards the adoption of the long-run incremental cost (LRIC) methodology for the calculation of interconnection charges to alternative operators.
On the regulatory front, the National Telecommunications Commission was established in 1995 as an independent regulatory authority for the sector. In 1998 the Commission took under its jurisdiction the supervision of the postal sector and was renamed National Commission for Telecommunications and Posts (EETT). However, throughout the 1990s, government’s sluggishness left EETT severely understaffed, with the majority of its personnel being seconded from OTE. In the 2000s, this situation gradually changed and EETT was in a position to recruit over 250 scientific staff and external associates as members of various working groups (EETT, 2006). In 2006 EETT assumed the role of the Competition Committee on issues pertaining to electronic communications.
EETT took regulatory measures on local loop unbundling (LLU) as early as 2002. However, over the period 2002–2006, the majority of alternative providers remained on the first and second rung of the ‘ladder of investment’2 providing services based on OTE’s infrastructure, using either carrier pre-selection or bitstream access.3 It was not until early 2007, with the enactment of Law 3431/2006, that actual unbundling of the local loop took place and alternative operators started to move to the third rung of the investment ladder. In 2007, Greece experienced for the first time an annual broadband growth rate higher than the EU average (EETT, 2008b). Furthermore, in 2009, following ΕΕΤΤ’s Decisions on OTE’s Wholesale Line Rental Offer, wholesale leased lines (WLL) were introduced to the Greek market, permitting alternative providers to lease a subscriber line from OTE on wholesale terms and to resell it to the end-user, in combination with the Carrier Pre-selection service. Since that time, however, alternative operators have gradually abandoned reselling and have moved to investing in collocation infrastructure taking advantage of LLU regulation and reducing their dependence on OTE.
In the 2000s EETT also showed particular interest in wireless technology for enhancing broadband access. Fixed wireless access (FWA) networks in particular were regarded as a suitable alternative to copper wire or optical fibre networks in inaccessible or sparsely populated areas of the Greek territory, where the installation of wired networks was economically unattractive. Hence, EETT carried out an auction for the award of a FWA license of the 3.5 GHz band, which would enable deployment of a wireless access network based on WiMAX technology in August 2006. The license was granted to the highest bidder, Cosmotelco Telecommunications Services, for the amount of EUR 20,475,000. However, until March 2011 the bidder had neither taken any significant initiative for the installation of the WiMAX network nor had it paid a residual amount of 20% of its bid. Therefore, EETT revoked its license and the WiMAX network was never completed.
13.2.3 The role of telecom operators
As soon as the market for voice telephony was liberalized in 2001, a number of alternative operators entered the market aspiring to obtain a piece of OTE’s market share. However, the large number of operators and their small size raised concerns about their future viability. These alternative operators mainly built their business on using OTE’s network. During the first years of their operation their business model was based on the margin between the wholesale price they were paying for leasing lines from OTE – which has always been regulated – and the retail price they were charging their customers. As this practice was the norm for most of the 2000s, it did not lead to investments by alternative operators that would differentiate their network development strategy from OTE’s.4
In 2001, apart from the four major market players (OTE and the three mobile operators), there were more than 200 telecommunication service providers operating in the Greek market. Most of them were active in the market for Internet services, while a significant number of companies offered the so-called ‘value-added’ services to closed user groups.
In 2012, the picture was completely different, as shown in Table 13.1. However, it should be noted that not all licensed operators in the voice telephony and fixed network segment provide commercial services to the public. Some of them are licensed to provide services to closed user groups and/or are corporate members who serve their own communication needs.

At the end of 2012, OTE had retained its dominant position in the fixed access market for the provision of public telephone services, albeit with a decline in market share from 72.7% in 2010, through 66% in 2011 to about 62.4% in 2012. The decline reflects the ongoing competitive pressure by alternative operators. However, the penetration rate of access lines in fixed telephony has been on a downward trend in recent years, from 46.7% in December 2010 to 43.4% in December 2012) This has been the result of increased substitution by mobile telephony and the gradual disconnection of telephone lines in resort homes around Greece.
OTE has been regarded as the leading integrated telecommunications operator in southeastern Europe, providing voice, mobile and broadband services in contiguous markets. More specifically, since 1997, the ΟΤΕ group of companies has been active in Romania (through its affiliates Romtelecom and COSMOTE Romania) and in Albania (through its affiliate AMC).5 OTE is one of the five largest companies on the Athens Stock Exchange, with its shares also traded at the London International Stock Exchange. Since 1996 the Greek government has been gradually reducing its shareholding in OTE. On 14 May 2008 an agreement was signed between the Greek government and Deutsche Telekom (DT) on a major participation in OTE’s share capital by DT. After additional sales of shares and voting rights by the Greek government, the stake of Deutsche Telekom in OTE reached 40% in July 2011, reducing the Greek government’s participation to 10%. The remainder of OTE shares are held by Greek and international institutional investors.
Table 13.2 summarizes key events in OTE’s broadband agenda for the period 2005–2012.
Table 13.2 Milestones in OTE’s Broadband Agenda, 2005–2012
The backbone network of OTE is fully based on optical fibre, consisting of more than 35,000 kilometers of optical fibres, complemented with satellite, terrestrial and underwater links to connect to international networks.
The access network of OTE has been supporting the entire broadband development in Greece, as copper-based xDSL has been the major technology for broadband access in the country. Its access network is mostly copper-based (with over 5.3 million pairs) with optical fibres gradually and steadily replacing the copper network in the course of OTE’s strategic investments in next-generation access (NGA).
In the beginning of the liberalization process, private companies were reluctant to invest in alternative technologies because of the high risk associated with such investments, the instabilities that prevailed in the market and competition from OTE. Instead, they tried to build their own clientele, offering phone services using infrastructure leased from OTE. In order to compete with OTE, they were leasing large-capacity circuits at wholesale prices controlled by the regulator. As prices for telephony services dropped significantly in recent years, a number of bankruptcies of and mergers between private telecommunications firms have taken place, thereby reducing the number of key players to around five. These alternative providers base their service offerings mainly on the use of local loop unbundling (LLU) rather than on other types of wholesale broadband access. See Figure 13.1 for the division of LLU market shares of the major players.

Figure 13.1 LLU-based market share of alternative operators (full and shared LLU), Greece, 1 January 2011
Initially, alternative service providers mainly offered broadband access services and no content services. The latter were limited and were offered by a minority of telecommunications services providers (mainly the bigger ones). Also, there was not a common pattern or business model in the provision of content service. As gradually significant investments in optical backbone infrastructures were made by the competing network operators to leverage the LLU regulation for broadband access, they are now able to offer and support innovative products such as double-play, triple-play, etc., at competitive prices.
13.2.4 The mobile communications sector
Following an international tender in 1992, a duopoly was established in 1993 between Panafon SA (today Vodafone) and STET Hellas (later TIM, and today Wind) for the provision of GSM 900 services. In 1995 a third license was granted to OTE to install and operate its own GSM 1800 network through its subsidiary COSMOTE. The company started operations in April 1998.
In 2002 a fourth license was granted to Q Telecom, which in 2007 merged with Wind Hellas. Table 13.3 below summarizes milestone events of the last ten years in the Greek mobile sector. Of particular significance are the mergers and acquisitions that have taken place among operators, as well as the strategic alliances among different types of operators and service providers (mobile, alternative, ISPs, and TV platform providers).
Table 13.3 Milestone events in the mobile sector, Greece, 2001–2012

The development of the mobile industry has been impressive. The Greek mobile industry has invested a total of EUR 7.012 billion in networks, base stations and telecommunications equipment over the period 1993–2012 and has contributed significantly to economic growth and public revenue of the country (Association of Mobile Communication Companies, 2013).6
From 1998 to 2002, the annual growth rate of mobile penetration was more than 10%, whereas in 2005 the penetration reached 100% of the population. By mid-2013, mobile penetration reached 141%, a figure which is close to the European average.7 However, as Figure 13.2 suggests, there was a sharp drop in the total number of subscribers after 2009 which can be linked to the economic crisis. In 2012 the number of subscribers took an upward turn again.

Figure 13.2 Number of mobile subscribers, Greece, 2000–2012
The rapid growth of the sector during the first fifteen years of operation is reflected in the evolution of the sector’s turnover. More specifically, the industry had a turnover of EUR 12 million in 1993 and reached EUR 4.5 billion in 2006. However, from 2008 onwards the saturation of the industry, combined with the economic downturn, reduced termination fees and tax increases led to a cumulative drop in turnover of 36%. At the European level a decline in revenues also can be observed – but this remains modest, at -1.9% per year from 2007 onwards reflecting losses being offset by the development of new services, including mobile broadband – whereas in Greece, the economic downturn and the delay in the take up of mobile data services have led to a more significant drop (-10.2% per year from 2007 onwards).
In November 2011 the mobile industry reinvested EUR 298 million in the renewal of mobile phone licenses and EUR 82 million for the acquisition of new rights in the frequency bands of 900 MHz and 1800 MHz.8 Mobile broadband is the future of the sector, as the uninterrupted growth in mobile data services suggests: from 4.2 billion MB in 2009 to 10.8 billion MB in 2012 (EETT, 2012). Mobile operators in Greece continue to invest heavily to upgrade their networks even at the time of economic crisis. According to the Association of Mobile Communication Companies (2013), over the period 1995–2001 the sector invested approximately 30% of its revenues in building network infrastructure, whereas over the current maturity period (2002–2012) the sector managed to maintain investments at an average of 11%.
Today, the Greek mobile sector is a prime contributor to the achievement of the Digital Agenda targets, as it provides high data rate Internet access through its mobile broadband networks, including 4G LTE (long-term evolution).
13.3 Case focus: early public consultation on broadband, recommendations and actions
This section focuses on the public policy agenda for the development of broadband in Greece, which started soon after the publication of the White Paper ʻGreece in the Information Societyʼ in 1999. In early 2000 a consultation took place over the future of broadband in the country, led by a committee of experts. A number of similar initiatives and strategic documents prepared in other countries were reviewed and the committee reached a number of conclusions, the most important of which are summarized below:
A need was identified for the state to set up an appropriate institutional, regulatory and business framework that would allow the exploitation of synergies between the public and private sectors, and develop a spirit of cooperation among providers;
Participants expressed their concern over the price levels at which broadband services would become available in the future, and over the lack of ʻbroadband cultureʼ among the majority of Greek citizens. A question was subsequently raised as to whether, and under which conditions, acceptance of and participation in those services could be foreseen;
Providers in the market acknowledged OTE’s position in the market as crucial for providing interconnection services at reasonable prices to other companies if the latter were to develop their services locally, and viewed positively actions for the development of common infrastructure (community broadband networks and condominium fibre);
One in two participants believed that there should be financial support (in the form of subsidies and/or tax benefits) from the state provided there were clear rules of operation and investment; and
Participants strongly supported the view that demand for broadband services could be fueled primarily by the public sector, through initiatives that would enhance demand in the education and healthcare sectors, while further expansion could be achieved by training citizens in the new technologies.
All in all, the results of the consultation process strongly suggested a policy-making role for the state, setting the institutional and regulatory framework for the implementation of novel business models and practices, in which the private sector participates along with the state in the roll-out of broadband. The state should also act as a major user of network services, and as an enabler and manager of direct and indirect interventions in this area through programs which would anticipate and correct possible market failures.
These observations were in line with the best practices found in Europe and in other parts of the world. Normally, the role of central governments in broadband developments has been to set the framework within which public involvement could be achieved. This included: (a) ensuring broad social acceptance of the benefits and opportunities of the information economy, such that the allocation of significant public funds to build optical networks would become socially acceptable; (b) designing programs that help people gain skills, such that they could be successfully integrated into the digital economy; (c) encouraging entrepreneurial innovation in online services and applications which enhance demand for broadband connections and services; and (d) forming a clear framework of entrepreneurial activity that would guide telecommunications providers’ strategies in the development of optical access networks.
In early 2000 the Greek telecommunications market depended on OTE’s optical fibre backbone network, which was available and suitable for broadband development. However, the optical network arteries at the national and regional level and the availability of broadband infrastructure at the local access level were missing. The geography of the country has been a significant obstacle to the development of regional and municipal metropolitan networks in areas other than the densely populated economic centers of Athens and Thessaloniki. The mountainous terrain and the large number of islands make connectivity difficult and expensive. Due to the small population of towns and the small size of most business enterprises, only a limited number of cities present significant prospects for broadband. This is the main reason that the market for backhaul in Greece has remained monopolized by OTE. Even if the circumstances could justify investments in remote areas, such decisions were discouraged by the fact that the only option for investors to interconnect over long distances was through the dominant carrier. As a result, the provision of broadband connections outside the densely populated city-areas of Athens and Thessaloniki has remained very limited and broadband penetration extremely low.
Under these circumstances and in the light of the targets set in the eEurope 2005 Agenda, which was prepared at the time, the Scientific Committee made the recommendations to the State authorities shown in Table 13.4.
Table 13.4 Priorities and recommendations for the broadband era, Greece
It is obvious that the best possibilities for high broadband penetration were to be expected in large metropolitan centres, whereas in most of the regions this would be unlikely. It was therefore of paramount importance that the state find ways to boost broadband evolution in these regions. The opportunity arrived through the “Information Society” Operational Programme. The Greek government, with support from the European Union through the 3rd Community Support Framework (CSF), set up an innovative, multi-sector and horizontal programme as a response to the attainment of eEurope objectives and the achievement of digital convergence with the rest of Europe. The programme ran over the period 2000–2006 and included a series of initiatives that targeted broadband penetration beyond the two main metropolitan centres of Athens and Thessaloniki. These initiatives can be grouped in three areas of intervention as follows (Troulos, Reference Toulos2012):
Development of broadband infrastructure: This intervention was implemented through six separate actions;
Development of broadband services: This intervention was implemented through five separate actions;
Strengthening demand and ‘broadband awareness’ among the population: This area of intervention was implemented through three separate actions.
These areas of intervention had a total budget of over EUR 450 Million. In particular, the following fourteen actions targeted broadband development across the country. Each of these actions corresponds to a call for tenders issued by the Administrative Authority of the Information Society Programme, see Table 13.5.
Table 13.5 Areas of intervention and proposed actions, Information Society Program, Greece

Among these actions, the following are of particular interest for the current state of broadband in the country:
At the metropolitan level, the interest lies in the Calls for Proposals Nos 93, 145 and 192 of the Operational Programme for the Information Society. These were intended to subsidize the construction (capital expenditure) and operation (operational expenditure) of metropolitan fibre networks (metropolitan access networks – MANs) during the early years of the investments in more than seventy Greek cities beyond Athens and Thessaloniki. The initial aim of the MANs was primarily to support the operation of public sector establishments, as this could guarantee their immediate deployment and use, as well as raise awareness and subsequent demand for broadband by citizens. Overall, seventy-five cities received the right to develop metropolitan networks in their territories. As the financing of these networks was through EU structural funds9, the municipalities involved in the building of these MANs had (a) to comply with the European framework for public funding of telecommunications infrastructures, which requires that the networks co-financed by EU funds provide wholesale services only and are governed by clear rules of open access; and (b) set up detailed business plans which would comply with the respective guidelines and the regulatory framework of the European Union and would ensure a fair and adequate level of competition in the market and a viable future for these investments. The municipalities participating in these initiatives would become the legal owners of these infrastructures.
At the peripheral level, Call 105 was aiming to further promote the development of local access broadband networks in areas less populated than those covered by Call 93. The main beneficiaries of this Call were local unions of municipalities and small communities (LUMSCs) and the ʻΑ’ class of local government organizations (LGOs), as well as the operators of the Greek School Network. The implementation of Calls 105 and 93 were expected to dramatically change the broadband map of the country due to the construction of network infrastructure independent from that of the incumbent operator (OTE).
At the regional level, Call 157 ʻEnterprise financing for the development of broadband access in Greek regionsʼ was mainly addressed to private telecommunication operators10 and aimed at the development of DSL and Wi-Fi services to users in rural areas, possibly using the metropolitan fibre networks. The call also included provisions for high data rate Internet and advanced content services to end-users. It also provided for subsidies to end-users to further stimulate demand.
It was envisaged that by the end of 2008 over 60% of the Greek territory would be covered by broadband networks which would serve over 90% of the population.
For the purposes of the action, the eligible areas of the country were divided into seven geographical areas. Four companies were awarded the contracts for the completion of projects (Hellas On Line (HOL) S.A., Forthnet S.A., Tellas S.A. (now Wind) and Cyta Hellas S.A.) with a total budget of EUR 206.6 million. In the beginning, most companies planned to use a combination of wired and wireless technologies, including Wi-Fi and mobile links. However, during the roll-out phase it became clear that this solution was not feasible due to deficiencies in the legal framework and bottlenecks in the licensing procedures set by regional authorities. As a result, the initial plan was replaced by optical networks only. These projects were completed by November 2009.
Most of the aforementioned actions were completed, in terms of installing the infrastructure, by the end of 2010. Meanwhile, in 2009, the Greek Ministry of Transport and Communications (MTC) announced an ambitious plan to build a Fibre-to-the-Home (FttH) network of 2,000,000 households. The project, with an initial budget of EUR 2.1 billion and a plan for completion in seven years, was expected to cover fifty-four large Greek cities, including Athens and Thessaloniki. However, the economic crisis in the country has put this plan on hold.
To summarize the outcomes of this development, it was obvious from the early start of the discussions on the Greek broadband agenda that because of the geography of the country several rural and scarcely populated areas would remain underserved. Thus, in line with the international experience, Greek policy makers considered public funding for infrastructure in these areas a remedy to resolve the anticipated market failure in the development of broadband across the country. By mid-2000, Greece had shown a significant increase in broadband penetration but retained the lowest position in Europe, exhibiting an overall 2.66% broadband penetration in July 2006, while the equivalent figure for the EU15 was 14.46% (Bouras, Reference Bouras, Gkamas, Papagiannopoulos, Theophilopoulos and Tsiatsos2009).
By 2006, broadband infrastructure provision could be distinguished in three categories:
Public broadband networks: These were the Greek Research and Technology Network (GRNET), the Greek Network of National Government (‘Syzefxis’), which interconnects all ministries and public authorities, the Greek Universities Network (GUNET), and the Greek School Network (GSN). The last two networks interconnect research and academic institutes and public schools;
Private broadband networks: Very limited new broadband infrastructures had been developed by alternative providers in only the two major cities of Athens and Thessaloniki; and
Municipal optical networks, providing dark fibre in support of broadband access, were underway in the major cities, in small towns and in non-urban and remote areas of the country. The development of these infrastructures was guided by regional strategic objectives, taking into account the physical particularities and socio-economic conditions of the regions.
In the last case, policy makers adopted a model also found in other European countries (e.g., France, see Chapter 11) allowing municipalities to become telecommunications network providers, but not operators, in places where no private investments were to be expected. Thus, they assigned to local authorities the role of ‘facilitators’ in the deployment of Fibre-to-the-X (FttX) roll-out strategies (A. T. Kearney and Planning S.A., Reference Kearney and Planning2008).
However, this has not been an easy task for municipalities to handle. Several questions arose regarding the operations phase of these networks that demanded serious discussion. For example, what would be the role of the municipalities in these initiatives, to what extent should the central government bodies intervene, how could competition in the market be promoted, and – above all – how could the viability of the networks be ensured for the years to come? Thus, a key issue of concern for policy makers and local authorities since the late 2000s has been the selection of an appropriate business model to ensure the optimal exploitation of municipal optical networks. This issue is discussed in the following section.
13.4 Municipal optical networks: a Greek tragedy?
The use of optical MANs in the Greek periphery, exclusively by the public sector, raised a number of issues concerning the economic viability of these networks. As the cost per optical link was estimated to exceed EUR 500 per month, with a positive ROI to be achieved in 25 years, their economic viability would depend to a large extent upon their extension into the backbones of FttH networks and the provision of services to residential and business customers (Troulos, Reference Toulos2012).
The need for municipalities to take an active role in the operation of these networks was understood from the beginning. Prior to the implementation of a MAN in a particular city, a relevant study had to take place that would summarize the situation in the city and highlight all the challenging points that might require special attention. In addition, for each city, a business model for the efficient operation of the network had to be proposed that would take into account the possibility of providing optical fibre on cost-based prices, so as to cover the operational and maintenance costs of the infrastructure. Thus, two issues remained pending and demanded the attention of the technical consultants who were commissioned to provide their suggestions for:
a) the business model(s) for the optimal exploitation of the municipal optical networks; and
b) the appropriate management structure for the operations and management of the metropolitan networks on behalf of the municipal authorities.
Following Henderson and Ball (Reference Henderson and Ball2005), the proposed business models had to take the following requirements into account (Bouras et.al, Reference Bouras, Gkamas, Papagiannopoulos, Theophilopoulos and Tsiatsos2009):
determine the role of the municipality and the region;
ensure healthy competition;
define the degree of involvement of the private sector;
ensure the viability of the metropolitan community-owned optical network;
secure the resources for its operation, maintenance and expansion;
promote competition for offering better and cost effective services to the citizen.
The technical consultants in their studies of alternative business models considered the following characteristics and limitations of the Greek case (Bouras et. al. Reference Bouras, Gkamas, Papagiannopoulos, Theophilopoulos and Tsiatsos2009):
The majority of service providers were not in a position to build their own infrastructure as investment in telecommunications infrastructures in the periphery was not envisaged as being profitable;
There has been a lack of a clear regulatory framework that would ensure equal treatment of the competitive alternative providers at any network level11;
Unbundling by OTE was proceeding slowly and competition in network infrastructures and services provision was limited;
European regulations for structural funds state that beneficiary municipalities should offer open access, cost-based services and be prohibited from exercising monopoly powers over their infrastructures;
Full state control (in all three layers of the network, from the infrastructures to the services level) would inhibit competition;
Each telecommunications provider has its own active equipment that may be a source of competitive advantage.
As the MANs are owned by the municipalities, the prevalent approach that resulted from the studies was a ‘passive infrastructure model’ (Bouras, et. al. Reference Bouras, Gkamas, Papagiannopoulos, Theophilopoulos and Tsiatsos2009; Kyriakidou, et.al. Reference Kyriakidou, Katsianis, Orfanos, Chipouras and Varoutas2010). According to this approach, the passive network equipment (first network level) should be managed by a public authority (at the municipal, regional or national level) and be offered in a cost-effective way to the telecommunication providers who would then make the investments to set up their own active equipment at the second network layer in order to provide different broadband services to the end-users (at the third network layer).
The next question that was raised concerned the management structure of these networks; i.e., who should manage, maintain, exploit and expand the passive infrastructure. Here, the technical consultants made a thorough review of prevalent models in order to inform the municipalities of the business practices and strategies available in Europe and elsewhere. The results indicated three prominent options: (a) establishment of a municipal enterprise to operate the business at the municipal/community level; (b) establishment of a regional enterprise to operate the business at the regional level, and (c) establishment of a centralized enterprise that would operate at the national level.
All three options were extensively discussed in the literature (Bouras, et. al. Reference Bouras, Gkamas, Papagiannopoulos, Theophilopoulos and Tsiatsos2009; Troulos, et.al Reference Troulos, Merekoulias and Maglaris2010, Troulos 2012). In particular, Troulos, et.al (Reference Troulos, Merekoulias and Maglaris2010: 81) summarized the disadvantages of establishing a municipal enterprise at one extreme of the spectrum and a national enterprise at the other as follows:
Both approaches exhibit some limitations. The city-wide FttH network reaches a small market size making the effort financially risky; thus inhibiting private investments. Also, most municipalities do not have the human resources or experience for such endeavors, nor can they afford the management and operational overhead. On the other extreme, the case of the countrywide NetCo is marked by increased complexity to coordinate municipal efforts (especially in view of conflicting local priorities), and may result into increasing agency costs and bureaucracy. The efficiency of a centralized NetCo may be affected by the distance between its rigid planning center and the local communities’ needs. Finally, this approach may be in conflict with European Union’s and [the National Regulatory Authority’s] EETT’s policies that aim to reduce the national monopoly bottlenecks in electronic communications, i.e. the access networks.
To mitigate these drawbacks, the authors proposed the establishment of regional broadband companies (RBC) on a voluntary basis, where each participating municipality would contribute to the company’s revenues and to the broadband development of the region according to its size and capacity.
In the light of these discussions, several municipalities and neighboring cities started to organize their next steps in terms of evaluating collective ways to offer fibre access and services to their citizens and leverage the already-installed municipal fibre MANs. To this end, by 2010 four regional groups had been formed (Troulos, Reference Toulos2012):
1. Digital Cities of Central Greece, led by the mainland city of Trikala;
2. Broadband Network of Southwest Greece, led by the city of Patras, the third largest city of Greece;
3. Ikaros Network, led by the city of Heraklion and municipalities of the Aegean Islands and Crete, and
4. Broadband Network of Northern Greece (covering the regions of Macedonia and Thrace), led by the municipality of Kavala.
However, the outbreak of the economic crisis in early 2010 and the political, administrative, and bureaucratic burdens that have been encountered in the formation of municipal network companies have put the commercial exploitation of these networks on hold. Despite the early euphoria regarding the prospects of municipal broadband throughout the 2000s, the situation today is almost stagnant and hardly shows signs of recovery. The initiative of setting up broadband companies at the regional level proved very demanding for the local and regional authorities. In the meantime, the economic and political priorities of the country have changed dramatically, as the financial crisis hit the public sector and imposed severe budget cuts across all sectors and regions. The current National Strategic Reference Framework (known as ESPA), which describes the strategic priorities of the country for the period 2007–2013 and which is co-funded by European Union funds (Cohesion Funds), has put digital convergence high on the political agenda. To this end, a new operational programme called ʻDigital Convergenceʼ has been running, but it mostly targets ʻsoft measuresʼ which would enhance the use of ICTs within the public and private sectors, rather than the exploitation of broadband infrastructures.12
Whether there will be a catharsis in the modern municipal broadband drama that will relieve the tensions and agonies and provide policy makers and municipal authorities a clearer and renewed vision, as was the case in the ancient Greek tragedy, remains to be seen, ideally in the not-so-distant future.
13.5 Realizing the Digital Agenda targets
The Digital Agenda is one of the seven pillars of the Europe 2020 strategy of the European Commission, endorsed by the member state governments, and sets out the objectives for the optimal exploitation of Information and Communication Technologies (ICTs) to foster innovation, economic growth and progress in Europe. Initially, the Digital Agenda identified seven priority areas where member states should concentrate their efforts in order to stimulate growth and competitiveness. One of these areas concerned the development of the financial, regulatory and technological environment for the development of broadband infrastructures across Europe.13 This section reviews the progress made in Greece in the attainment of the Digital Agenda objectives, particularly with regard to the development of broadband infrastructure.
Overall, Greece has made significant progress but lags behind the EU average on important Digital Agenda indicators.14 Although Greece, with 99.1% fixed broadband coverage, scores above the EU27 average of 95.5%, it is below European average in broadband penetration by households: the uptake was 24% compared to the European average of 28.8% at the end of 2012. See also Figure 13.3. Urban centers in Greece enjoy full broadband coverage, while in suburban and rural areas broadband coverage is 85% and 50%, respectively. This disparity also relates to the uneven distribution of population across the country, with more than 70% of the population living in the three major cities (Athens, Thessaloniki and Patras).

Figure 13.3 Households with a fixed broadband connection, Greece and EU, 2003–2012
Next-generation access (NGA) networks were available to 21.9% of homes (as compared to 53.8% in the EU), whereas the uptake of high data rate connections was also low: 0.1% compared to 14.8% in the EU. Ultra-fast connections of at least 100 Mbit/s are not provided yet.
Nonetheless, there is significant progress, and the gap is closing. The total number of broadband lines reached 2.7 million in 2012, registering a 9.1% increase compared to 2011.
By December 2012, the incumbent operator OTE had a broadband market share just above the European average: 43.3% compared to 42.3%. Broadband is provided almost 100% on the basis of ADSL. The ADSL market share of OTE decreased from 55.4% in January 2009 to 43.4% in January 2012. The ADSL share by the OLOs is almost 100% based on LLU (European Commission, 2013). Unbundled broadband access is provided almost exclusively using fully unbundled access lines: 99.7% of the connections by December 2012, compared to 73.8% in the EU.
On the regulatory front, EETT took significant steps in the promotion of wireless broadband in 2012. Through its radio spectrum management policy, it conducted an auction of spectrum in the 900 and 1800 MHz bands and thereby opened the way to the development of 4G networks by mobile operators. Further auctions for spectrum licensing were expected in 2014. EETT also completed all preparations for the transition to VDSL. Following a decision by EETT, and soon after the launch of its own retail VDSL services, OTE was obliged to launch wholesale VDSL services to alternative operators as a ‘fully functional’ product at a standard quality of service, with established procedures for the recovery of failures, a clear and detailed pricelist, etc., in order for them to develop their own competitive VDSL offerings. This was the result of pressure exercised by alternative operators upon EETT to demand OTE make a similar wholesale product available to alternative operators.
Moreover, the regulatory framework for NGA is awaiting the full transposition of recent laws passed by the Greek parliament that address critical problems in the licensing procedures for new antenna installations.15 Such a framework is necessary to further boost the development of mobile broadband. Other areas where public policy could enhance developments in broadband through regulatory interventions include: (a) strengthening the role of municipalities in the development of broadband; (b) encouraging the use of common public utility infrastructure; and (c) establishing standards and/or provisions regarding the internal wiring of buildings.
On the policy front, a new broadband development project was put to a public consultation in August 2013 aiming to reduce the ‘broadband divide’ and improve access to broadband in currently underserved rural areas. The project, with a budget of EUR 160 million co-financed by structural funds, will subsidize the development of broadband access networks by alternative operators in 6,145 remote rural villages. These represent 50% of the total rural area and correspond to 80% of the rural population. At the same time, it plans to enhance the level of competition among different operators in these areas which are currently served only by OTE. The project prescribes 30 Mbit/s services to villages with over 400 inhabitants using Fibre-to-the-Cabinet (FttC) technology, and 8 Mbit/s to villages with fewer inhabitants, with a capacity to increase to 30 Mbit/s by 2020. The technologies proposed for these purposes are FttC, fixed wireless access (P2P Ethernet links, P2MP WiMAX) and mobile networks (2G, 3G, LTE). For its part, OTE argues that the project is overpriced in providing broadband service in rural areas where little real added value is expected, and that the state could save public money and avoid duplication of investments if OTE was allowed to extend its broadband network to these remote areas under its universal service obligations. Although the result of the consultation process was unknown at the time of completion of this chapter, it is unlikely that OTE’s claims will be considered seriously.
On the mobile front, Greece performs above the European average in the availability of mobile broadband. At the end of 2012, third-generation mobile broadband was available to 99.4% of population, compared to 96.3% in the EU, whereas 4G availability reached 42.4% of the population (26.2% in the EU). However, the uptake rate of mobile broadband (subscriptions as a percentage of population) was 44.8%, a figure that is below the EU average of 54.5%. Driven by shrinking revenues, the two mobile operators Vodafone and Wind agreed to share equipment and network infrastructure for mobile 2G/3G, following approval by EETT.
13.6 Case analysis and concluding remarks
Greece has been a typical case of a country where state authorities, through the exercise of targeted subsidy programs, have advanced developments in broadband coverage and uptake. Unlike other EU member states, where the first priority has been to boost services and applications delivered over broadband, the Greek policy agenda concentrated on initiatives to foster actual infrastructure development and country-wide expansion. There has been a general consensus in the political system that such investments, if left to operators alone, would not materialize to the extent envisaged by European bodies, either because demand was not there yet or because the operators did not consider such investments to provide a sufficient financial return. Therefore, the expected market failure called for public money (national and European) to be used in building up the broadband infrastructure, mostly but not exclusively in remote and rural areas of the country.
The argument has been that the take-up of broadband would come as a natural next step as long as citizens were convinced of the benefits of high-speed Internet connections at their homes and businesses. However, to make this happen, the state had an important role to play, first in creating the conditions and providing the incentives to the (reluctant) market players to invest in infrastructure development; and, second, in making the state the primary user of services delivered over these networks. Thus, the main drive behind the development of MANs in major Greek cities was to support the operations of the public sector, in the provision of basic public services such as e-prescriptions, e-taxation, and the issue of electronic certificates and documents following citizens’ on-line requests. Citizens were expected to go through a learning curve that would raise their demand for broadband and subsequently accelerate the take-up of services and applications. This ‘adoption ladder’ has proved itself in practice, despite not being as pronounced as operators might wish. Based on the data collected by OTE, it has been estimated that as soon as broadband is established in a region, about 20% of the population in the region take up the service within the first month of operation.16
By mid-2013, the main providers of broadband services in Greece have been: (a) the fixed line operators (including the incumbent OTE) who provide direct access to the Internet mainly through wired telephone lines; and (b) the mobile operators who provide wireless Internet access through their cellular networks. However, as is the case worldwide, such a distinction becomes increasingly blurred. On the one hand, fixed-line operators gradually adopt wireless technologies in order to reduce capital expenditure in fixed installation costs and, on the other hand, the popularity of smartphones, especially among the young ages, and the personalized nature of the service results in mobile broadband gradually overtaking wired connections at home. The municipal networks that were built by mid-2000 have not managed to become fully operational. Despite the early euphoria regarding their prospects, the majority remain inactive and their deployment remains in question. The initiative of setting up broadband companies at the regional level proved very demanding for the local and regional authorities.
OTE has remained the dominant operator and is the sole provider of universal service in Greece. For over a decade OTE has invested heavily in broadband infrastructure by building up a network of 30,000 km of fibre across the country, putting an emphasis on urban areas where the take-up was expected to be more rapid. Following the state-led initiatives for building subsidized broadband infrastructure, and under the threat of being put at a disadvantage compared to the recipients of funds to implement these actions, OTE further accelerated investments in broadband in suburban and rural areas, thereby largely achieving the early targets set in terms of geographical and population coverage. With respect to FttH/B, some time will pass before OTE starts building an NGA network in a more systematic way. This delay is caused by: (a) the severe economic conditions the country is facing, which put into question the expected rate of return on investment in broadband access; (b) the economic vulnerability of households, which has put on hold domestic demand for broadband; and (c) the lack of any serious competitor in the fixed network market. Moreover, the unfavourable economic conditions in the country have made OTE change its investment preferences. Until 2010 OTE was investing heavily in fibre optics, whereas in recent years it shifted to deploying wireless systems because of the significantly lower installation costs compared to fixed infrastructure. In the case of Greece, with its particular geographical terrain, wireless technology is considered the most suitable option for inaccessible and/or geographically isolated areas and islands.
DSL has become the most popular technology for broadband access in Greece. As OTE dominates in the fixed network market, the majority of alternative operators have become dependent on OTE for their position in the market. This does not imply that alternative operators have not made their own investments in network infrastructure. The action plan Call 157, which was addressed to telecommunication operators and aimed at the development of DSL and Wi-Fi in rural areas, provided them an opportunity to develop subsidized infrastructure in the regions: i.e., in addition to the metropolitan centres where they had already established points of presence. This action plan changed the model by which these providers sought to compete with OTE. While by 2006 alternative operators were mainly relying on OTE’s wholesale services, with their own minor infrastructure developed in the urban centers of Athens and Thessaloniki, the action plan subsidized the development of over 6,000 km of optical network in peripheral regions and prepared the ground for a change in the level of competition across the country. By setting up their own transmission infrastructure, alternative operators have been able to reduce their dependency on OTE. However, as OTE owns all local loops across the country, there are limits to their disengagement from OTE. On the other hand, this particular action plan made a model of cooperation among these alternative operators commercially and economically attractive. Given that each final recipient enjoyed the privilege of establishing subsidized infrastructure in specific parts of the Greek territory, the final recipient in one region could provide facilities to other operators in return for access to the infrastructures in the other areas. The result has been the creation of a number of subsidized networks by different operators, which may give rise to the prospect of their forming a single rival to OTE in the near future.
OTE has seen its share in the fixed broadband market shrinking over the last years. Hence, its strategy has been to concentrate on the upgrade of its DSL network to VDSL, increasing the data rates and thereby bringing it closer to the Digital Agenda targets. However, following EETT’s decision of September 2012 to permit the launch of OTE’s VDSL retail products into the Greek market on the condition that the respective wholesale product was also available to alternative operators, OTE’s first-mover advantage was being challenged.
Mobile operators have become important players in broadband access, as their wireless infrastructure complements fixed broadband networks across the whole country. Although the take up of mobile broadband remains below the EU average, it is gaining momentum, and the mobile operators, with their ongoing investments in LTE networks, are expected to make a significant contribution to the attainment of Digital Agenda objectives. Given the difficult economic times and in an attempt to control costs, mobile operators have chosen the strategy of network sharing, a practice that is already implemented in other countries. Of crucial importance to the operation of mobile broadband, as to all wireless infrastructures, is the full transposition of recent laws regarding the simplification of licensing procedures for installation of mobile base stations and antennas (under the new one-stop-shopping licensing framework) and the acceleration of decisions on spectrum management. For example, as EETT has not yet assigned bands for P2MP fixed wireless access, OTE may face problems in its plans to use this technology for broadband connectivity in remote rural areas. These transpositions are expected to remove the barriers often raised by local community councils and the lobby of citizens against the installation of mobile infrastructure and will further accelerate developments in mobile broadband.
13.6.1 Reflections on expected future developments
Despite the severe economic crisis, Greece has made significant progress in its broadband agenda and is slowly but steadily catching up with respect to realizing the Digital Agenda targets. OTE started upgrading its network from ADSL to VDSL. Alternative operators are expected to increase competitive pressure, including areas outside the three main cities. The next phase will be the transition from FttC/FttB (Fibre to the Cabinet/Building) to FttH (Fibre to the Home), replacing the remaining copper access and ensuring high quality broadband services to households.
To this end, and given all the public financial support given to broadband, the next step in the policy agenda could be the creation of conditions for the effective combination of all forms of subsidized infrastructure. In this way, a new network infrastructure could emerge as a mix of all publicly subsidized networks including the metropolitan fiber networks (MANs) located in seventy-five municipalities and the fibre and wireless networks developed in the remote and rural areas of the country. Thus, MANs could safeguard their future viability through their evolution into FttH/B services to local communities.
This scenario, however, may not be as straightforward as one might expect. A number of important issues need to be considered including the following:
a) To what extent and under which terms and conditions can OTE’s current fibre infrastructure (which stops at the local switch) be used for the roll-out of FttH?
b) What would be the ownership structure of a possible mix of all publicly subsidized networks? Who would manage such a network and under what conditions?
c) In the event of such a coalition among alternative operators, how would the terms of use and lease of OTE’s infrastructure – upon which alternative operators have based their businesses – be affected?
d) How is the broadband market going to evolve? Is the current model of fully integrated companies (operators that provide both infrastructure and services) likely to be maintained in the future? Or will the open access model as part of the MAN deployments provide a window of opportunity for the separation of network and service provision, and become the new norm?
e) How will the evolution of mobile broadband affect developments in the fixed broadband market? At the moment, there is a general consensus that fixed and mobile broadband complement each other, especially in areas where fixed broadband is too costly and/or too risky to establish. With the rate of mobile broadband growth, however, will it soon evolve into a real competitor to fibre-based infrastructure?
f) Also, with network sharing becoming popular among mobile operators, how is competition in mobile broadband going to be protected?
It is too early to predict what the outcome of these debates will be or whether real infrastructure competition will eventually emerge. This is even more so given the current financial and social turmoil in the country, which makes any future predictions risky. What can safely be said is that the broadband era brings along new challenges for policy makers, regulators, and other stakeholders in the market that will demand their increasing attention in the years to come.
References
1 The Greek market is small in size with a distinctive geographic landscape (many mountainous areas and dispersed islands). Moreover, at that time, there was a wide digital divide and a lack of a clear regulatory framework regarding access conditions.
2 The ‘ladder of investment’ concept was introduced by Cave (Reference Cave2006). The first rung can be perceived as pure resale using carrier pre-select, the second rung as using bitstream and the third rung as using unbundled local loop.
3 According to EETT (2008a, p.8) in mid-2006, the number of unbundled local loops provided by OTE was almost 16,000. Of these, only one alternative operator had more than 2,000 local loops.
4 It should be noted that OTE benefited from an extension of the deadline under EU regulations for the introduction of number portability and carrier selection and pre-selection to 1 January 2003.
5 OTE was also active in the Bulgarian market but on 26 April 2013 it announced the sale of its 100% subsidiaries Cosmo Bulgaria Mobile EAD (Globul) and Germanos Telecom Bulgaria (Germanos).
6 This amount does not include the license fees paid for the allocation of frequency spectrum.
7 A study funded by the Association of Mobile Operators published in September 2013, indicated that if the holders of two or more connections were counted as one, mobile penetration rate reached 84% of population, covering more than the entire adult population in the country.
8 According to the Association of Mobile Operators (2013), mobile operators have not yet exploited the entire frequency band available to them due to problems they experience in the licensing procedures for the installation of antennas and base stations. According to the operators, Greece has the longest time-lag among all European countries and the highest number of interfering authorities during the consultation periods prior to the issue of a license.
9 75% of the financing would come from European Union funding and 25% from national sources.
10 OTE decided not to participate to this Call, although it was not formally excluded by the authorities issuing the Call.
11 The open access infrastructure can be modeled in three layers: the passive, the active and the service layers. The passive layer consists of the ducts, the microducts and the dark fibres. The active layer includes any type of active network equipment (switches, routers, modems, optical multiplexers, etc.). The service layer includes basic, advanced and value-added network services.
12 The programme aims at promoting the use of ICTs in enterprises, business process re-engineering of the public sector, the promotion of entrepreneurship in ICT sectors, the development of digital public administration services for citizens, and the improvement of everyday life through ICTs.
13 This is according to the new Digital Agenda priorities adopted in December 2012.
14 See Digital Agenda Scoreboard2013, available at https://ec.europa.eu/digital-agenda/en/scoreboard/greece (last access November 2013).
15 The new institutional framework introduces key elements for the simplification of the licensing procedures for new antennas and base stations by creating one-stop shopping processes at EETT.
16 The source of information does not explicitly distinguish take up rate between urban and rural areas.
14 Poland
14.1 Introduction to the case study
Following its return to independence in 1989, Poland joined the EU in 2004 and according to the January 2013 EC broadband scoreboard the country took sixth position in total number of broadband lines. However, in terms of penetration it still is one of Europe’s least developed broadband markets. It stands second-to-last with a broadband penetration of 19.6% of population, followed by Romania at 16.6%. The good news is that in recent years the gap with the EU average has been reduced significantly. From a historical point of view, the functioning of the fixed telephony market, especially the persistence of a monopoly structure in this market, has been extremely important in explaining the development of the broadband market. The lack of effective competition over the years and the protective nature of state policy towards the incumbent operator Telekomunikacja Polska SA (trading as Orange Polska1; also known as TPSA or just TP), keeping its monopoly position in tact, allowed the company to set the pace of development to suit its own terms of business. This situation changed for the better in early 2006, with a change in the application of regulation.
14.1.1 Liberalization and regulation
Poland was the first Central European country to enact a competition law and establish a competition enforcement agency after the collapse of communism in the first half of 19872. The first law concerning telecommunication regulation, in the context of Poland’s restructuring toward a market economy, was adopted on 23 November 1990. The Communications Act of 1990 ended the state monopoly in domestic services, but it retained the state monopoly in international services and its control over domestic long-distance services. But the end to the monopoly on local lines did not mean the immediate emergence of competition, as telecom policy has taken many turns since 1990: starting from attempts to build a model based on free-market competition principles in the period 1990–1994, followed by a period of support for the monopoly of the dominant operator (1995–2000), which led to a period characterized by inefficient regulatory interventions (2001–2005), to be replaced by a period of strong and effective involvement by the telecommunications regulator with a clear focus on increasing service competition (2006–2009), which provided the basis for the current period characterized by stimulating the development of the market through the use of pro-investment stimuli, primarily aimed at increasing infrastructural penetration (2010–2013). These changes in telecommunications policy coincided with the changes in political leadership in the Parliament (Sejm).
The policy changes over the period 1990–2013 are reflected in a succession of regulatory organizations. The independent regulatory authority in the telecommunications business and radio frequency management was established by the Telecommunications Act and began its operation on 1 January 2001 under the name of Telecommunications Regulatory Authority (Urząd Regulacji Telekomunikacji – URT)3 – as required by European Union directives. With the establishment of URT, the National Radiocommunications Agency and the National Telecommunications and Postal Inspection were liquidated. On 1 April 2002 the URT was liquidated and, the Office of Telecommunications and Post Regulation (Urząd Regulacji Telekomunikacji i Poczty – URTiP) was created. URTiP took over all the tasks, powers and duties of the URT in the telecommunications field. This transformation took place under the Act of 1 March 2002 on changes in the organization and functioning of central government authorities and their subordinate units and the amendment of certain laws (Journal of Laws No 25, item 253 of 20 March 2002). Significant activity of the regulatory body has been noticeable only since January 2006, when UKE was set-up to replace URTiP, and the new President – Anna Streżyńska – took its helm.4 (See Section 14.4 for a detailed discussion).
The replacement of the former President of URTiP by the new President of UKE following the 2006 elections cast doubts on the Polish NRA’s political independence. In addition, as URTiP ceased to exist in January 2006 and the President of UKE was officially appointed only in May 2006, the legality of the decisions issued in the meantime have been questioned. The independence of the Polish regulator was further weakened when Poland adopted the law on state personnel resources and key state administration officials that entered into force on 26 October 2006. According to this law, the five-year term of office for the President of the NRA was repealed and the President of the Council of Ministers was granted an unlimited right to dismiss the President of the NRA at any time and without the necessity to indicate reasons. This raised the concern that the changes introduced might influence the impartiality of the NRA, given the state’s holdings in various electronic communications operators.
The liberalization process initiated in 1990 with the local networks was followed in 2000 by the liberalization of inter-city networks and, finally, in 2003 the international networks. Hence, by January 2003, TP had formally lost its monopoly to provide telephone services on the fixed network.5
Figure 14.1 provides an overview of the most important events in the regulatory environment in Poland.

Figure 14.1 Timeline of most important events in telecom development, Poland, 1990–2013
This case study is structured as follows: In Section 14.2 we discuss the historical developments of the telecommunciations sector. In Section 14.3 the focus turns to the development of broadband. Section 14.4 is dedicated to the regulatory intervention. Mobile broadband developments are covered in Section 14.5. Section 14.6 provides the broadband market overview as of 2013. Section 14.7 addresses the deployment of EU funds. Section 14.8 reflects on the realization of the Digital Agenda targets and Section 14.9 provides the case summary and conclusions.
14.2 History of telecommunications developments
14.2.1 Development of the fixed network
In 1990, the rural areas in Poland had fewer than 2.4 phones per 100 inhabitants, compared to 8.2 for the country at large, and new initiatives were needed to rectify forty years of neglect in bringing telephone service to rural areas. The post-communist reform government encouraged the formation of village telephone committees for self-help efforts to build rural systems. The idea to operate a public telecommunication network independently from the state was born in southeast Poland, where local governments and village-level telephone committees established two independent telephone operators: District Telephone Cooperatives (DTC) Tychy and WIST6. Within 3 years, both were profitable and able to pay back loans and finance additional equipment for expanding their network. This type of public-private partnership in financing was one of the most important innovations for the region and the country in the early 1990s and led the way for the development of forty-four other independent telecommunications systems of this kind7, 8. Moreover Tyczyn and WIST were pioneers in establishing interconnection and revenue sharing arrangements with TP, which was a precedent in the framework of Polish legislation. The telephone cooperatives served as a model for bringing telephone service to rural areas and as a model for member-owned, democratic business organizations.
In parallel, TP had expanded and improved its access network capacity and was in the process of digitalization of the switching systems, which meant that at the start of the full liberalization of the telecommunications market and the privatization of TP in 2000, TP had a reasonable budget and relatively modern facilities and modern technological infrastructure, able to provide services to a broad range of consumers. Despite the ongoing improvements, the problem that remained was the low capacity of the access network in the rural areas. Even by the end of 2000, in some rural areas telephone connections were still made using manual switchboards.
14.2.2 Development of the cable network
Similar to the telecommunication market, the television market in Poland was controlled by the state (i.e., the communist government) for many years. The first cable television networks began to appear at the local level (apartment buildings) and the municipal level by the end of the 1980s. Although the Polish government took no specific measures for the development of the cable television market in the period from 1990 to 2000, the number of CATV operators continued to grow strongly.
The process of consolidation of operators started in 1992 and is ongoing today. The largest acceleration of this process was evident in the period 1996–1999. Currently, the consolidation process has slowed down and takes place through the full acquisition of smaller operators, or through various forms of co-operation between operators. According to the Polish Chamber of Electronic Communication over 60 per cent of the market belongs to the three largest operators combined: UPC Telewizja Kablowa, Vectra and Multimedia Polska. The large cities have a high penetration, and competition between CATV operators takes place in particular local markets, not nationwide.
14.2.3 Development of wireless communication
PTK Centertel, as a subsidiary of TPSA, began to offer mobile services based on NMT450 in December 1991. In 1996 Centertel introduced GSM. The market was subject to significant changes in 1996, when the monopolist PTK Centertel was faced with two new GSM-based competitors: Polkomtel S.A. (using the trade name Plus GSM) and Polska Telefonia Cyfrowa S.A. (Era GSM)9. The first UMTS networks in Poland were launched in 2004–2005 by Plus GSM and Era GSM but coverage was limited to Warsaw. By January 2006 most of the major cities were covered by Era GSM, Plus GSM and PTK Centertel. At present, the Polish mobile market is well developed with seven mobile network operators, all operating at the national level.
The legacy of a very low teledensity resulted in mobile communications to substitute for fixed lines, resulting in fixed penetration reaching its peak at 31% in 2003.
14.2.4 Emergence of the Internet: narrowband developments
The Internet has been available in Poland since 1991. The first international link based on the TCP/IP protocol was established between Warsaw University (through NASK – Research and Academic Computer Network) and the Computer Centre of the University of Copenhagen in August 1991.
The first commercial Internet services were offered by the ATM Manufacturing Company in 1993. In 1994 the company was carrying out pioneer implementations of ATM (asynchronous transfer mode) technology. The launch of TP’s dial-up access number (0–20 21 22) in 1996 was a crucial moment in the development of Polish Internet.
14.3 Development of fixed broadband
The first services of fast Internet access (using SDI10) ensuring data rates of up to 115 kbit/s were offered by TP in 1999. In 2002 TP extended its offer with a new Internet access service provided via ADSL modems. In the following years the broadband offer has been substantively extended. Two factors contributed to such a development: the digitalization of the TP network, which was completed in 2005, and the enhanced activity of cable operators, which also started to offer broadband Internet access. Table 14.1 provides an overview of Internet access by technology in 2005 and in 2012.

14.3.1 Initial development of competition in fixed broadband
Alternative operators have had the opportunity to develop their own access networks since 1990. However, achieving success has proven to be very difficult in practice. The investments by alternative operators could only become successful when aimed at those areas not yet served by the access network of TP, thereby capturing unserved demand. Moreover, nascent success was hindered by TP imposing unfavorable settlement terms (interconnection rates) and using a series of monopolistic practices towards operators entering the market. This, along with the significant financial outlays necessary for the construction of their own networks, limited the activity of new entrants and thereby adversely affected the development of infrastructure and of infrastructure-based competition. Only a few companies succeeded in overcoming the barriers. In 2004 the telecommunications enterprises with the biggest DSL market share were TP with 91%, Netia S.A. and Telefonia Dialog S.A. each having 3%, Telenet with 1% and all others combined with 5%.11
Netia is the largest alternative operator in Poland. It operates on the basis of its own backbone network, connecting the largest Polish cities, and on the basis of local access networks. The operator provides a wide range of telecommunications services, including telephone services, Internet and data transmission services. Historically Netia has been an active acquirer and consolidator of local operators.12 Netia made twenty-five acquisitions between mid-2007 and the end of 2009, of small local players specialized in FttX/Ethernet LAN services. In 2007 the company began to provide services on the basis of TP’s infrastructure.
Telefonia Dialog S.A. was incorporated on 12 August 1997 under the name of Telefonia Lokalna S.A. The company pursued activity within the scope of fixed telephony services and Internet access. Telefonia Dialog S.A. also has been providing broadband Internet access services using its own network. Since mid-2007 the company has offered Internet services on the basis of TP S.A. infrastructure using bitstream access. In 2008 Telefonia Dialog began to provide wholesale line rental (WLR) services. In 2008 they started to offer IPTV as a new service.13 Telefonia Dialog was acquired by Netia in 2011.
Wholesale broadband access
To stimulate competition the UKE introduced wholesale access, both bitstream (BSA) and wholesale line rental (WLR) in 2006. The pricing for the services was attractive – the BSA tariff was reduced from EUR 7.74 in 2006 to EUR 5.86 in 2007 – and the wholesale market developed reasonably well, reaching 15.8% of access lines for BSA and 19.5% for WLR, by the end of 2012.14
In 2005 unbundling was introduced. However, in the following years alternative operators did not migrate to LLU (unbundled local loop) on any significant scale, remaining focused on the use of BSA and WLR, which were more attractively priced than LLU and did not require any significant investment outlays. The situation changed when the price was reduced in 2006–2007 to below the EU average; see also Table 14.2. In 2012 the number of unbundled local loops had reached 5.9% of all access lines.
Table 14.2 Wholesale price, LLU – Monthly rental, Poland, 2006–2011

Cable-TV-based broadband
The development of cable TV towards broadband services can be observed from 2000 onward. The Telecommunications Law of 21 July 2000 had laid the foundations for increased liberalization of the sector and had removed the (formal) obstacles to entry by new operators. Cable-TV companies were allowed to compete with telecommunications operators for the provision of telecommunications services. The cable-TV and data communications (Internet access) markets were open for competition, but they did not have to provide access to other operators. Since then, the media market has gone through significant changes. Cable networks were consolidated and three large networks developed: (1) UPC Telewizja Kablowa Sp. z o.o.; (2) Telewizja Kablowa Vectra S.A.; and (3) Multimedia Polska S.A.
In 2001–2002 CATV operators started providing Internet access services. In 2005 cable television subscribers accounted for about one-third of the close to 1.6 million people who had broadband access to the Internet in Poland.
Multimedia Polska S.A. was the first operator in Poland which introduced the triple-play package service, namely cable TV, Internet and telephone on a commercial scale, under the trade name of ʻmultipackʼ in 2005. In 2006 TP also introduced triple-play. Triple-play services are now offered by CATV-based operators as well as by the PSTN-based operators.15
Figure 14.2 provides an overview of the most important events in broadband development in Poland.

Figure 14.2 Timeline of most important events in broadband development, Poland, 1991–2013
14.4 Regulatory intervention
While market factors have been important, regulatory factors have played a decisive role in setting the competitive conditions and prospects for the development of the broadband market. These regulatory factors include:
activities of UKE (Urząd Komunikacji Elektronicznej – Office of Electronic Communications), the national regulatory authority (NRA);
legal acts that constitute principles of operation of the telecommunications market.
While predictability and stability of legislation and actions taken by the regulatory authority are of particular importance, the actions of UKE, which were associated with responding to problems in the market, have often led to lengthy disputes (including litigations). According to operators, uncertainty about the future actions of the regulator, prolonged disputes and problems with the enforcement of regulatory obligations imposed a significant increase in risks for entrepreneurial activities in the telecommunications market and thereby reduced their willingness to develop the broadband infrastructure.
14.4.1 TP–UKE agreement
In 2006 the new President of UKE started a debate on the applicability of an extraordinary remedy in the form of functional separation of TP. The formal reason provided was the limited competition in the markets of fixed telephony and Internet access caused by the significant market power (SMP) of TP. The analysis conducted confirmed the existence of several barriers to the development of these markets, in particular:
a strong market advantage of TP, resulting from its size and market share;
anti-competitive behaviour of TP that hindered cooperation with alternative operators and the flow of information within the TP Group that facilitated and favoured such behaviours;
lack of appropriate price relationships between the charges for wholesale services (WLR, BSA and LLU) and retail services, which meant, for example, that provision of retail services based on LLU was not profitable for alternative operators (i.e., margin squeeze);16
ineffectiveness of regulatory activities undertaken so far to eliminate market barriers and lack of prospects for their elimination.
Recognizing that the functional separation of the incumbent operator (IO) would eliminate a major barrier in the form of anti-competitive behavior by TP and would also reduce the negative effects on development of competition that result from the weakness of the legal system in Poland (including a change of TP’s attitude, looking to exploit loopholes and weaknesses of the legal system), the President of UKE announced the initiation of functional separation proceedings: i.e., the creation of two companies, whereby one would be responsible for the provision of access to the infrastructure for all parties concerned and the other would focus on selling services to end customers, as of 15 December 2008.
However, the Telecommunications Law of 16 July 2004 (Prawo telekomunikacyjne – Pt) did not explicitly provide for dividing a telecommunications firm or arranging functional separation as a method of regulating the telecommunications market. Nor did the EU regulatory framework in force at that time bestow such rights on the national regulatory authorities.
The lack of clear rules on the separation meant that the UKE was criticized and that the proposal was treated reluctantly by TP. Nonetheless, recognizing that functional separation is a far-reaching regulatory measure, TP began negotiations with the participants in the telecommunications market to improve the conditions for cooperation. In November 2008, TP presented the President of UKE with proposals for actions aimed at reducing the market problems as indicated by the regulatory authority without the need for functional separation.
The proposal, entitled the Equivalence Charter (Karta Równoważności), assumed the resolution of the problems by voluntary actions and cooperation of TP with the regulatory authority and the alternative operators (AOs), thereby avoiding administrative orders. In addition, implementation of the Equivalence Charter would be less expensive and the effects were to be achieved within a shorter time frame than would be the case with functional separation. According to TP, the introduction of a comprehensive solution in the form of the Equivalence Charter was to ensure the stability of the telecommunications market in Poland and to be a starting point to improve cooperation amongst operators. The provisions of the Equivalence Charter assumed:17
implementation of rules of conduct that guarantee the same treatment to other operators as to the retail branch of TP;
transparency of TP’s actions in the sector of wholesale customer service, through a system of monitoring using key performance indicators (KPI);18
implementation of a ‘culture of non-discrimination’ in the organization through comprehensive training of employees in the field of non-discriminatory treatment of operators and modification of the incentive system;
improvement of the customer process with respect to alternative operators and of the quality of wholesale services (simplification, transparency, shortening of the process);
development and implementation of regulated services, involving all stakeholders (regulatory authority, alternative operators and TP);
the possibility of reaching agreement and looking for effective operational arrangements between the different stakeholders in the market – by establishing the Telecommunications Forum.
After public consultation on the proposal submitted by TP, and gathering a series of opinions on the possibilities and consequences of functional separation, the President of UKE informally halted work on the functional separation of TP in August 2009. As a result of negotiations between the operator and the regulatory authority, an agreement was signed on 22 October 2009 in which TP committed itself to the proper performance of all regulatory duties imposed on it and to the implementation of a series of actions to ensure transparency and non-discrimination in its relations with other operators, in return for the withholding of measures undertaken by UKE towards functional separation of the company.19 The main parts of the agreement included such issues as implementation of the Equivalence Charter, freezing the level of wholesale prices (only for LLU and WLR) for a period of three years20 and signing bilateral agreements with operators. See Table 14.3 for the LLU price agreement.
Table 14.3 Wholesale prices of LLU, WLR and BSA for the three-year period, Poland (per month)

* price ceiling on BSA
Under the agreement, TP also committed to building and modernizing the fixed network infrastructure and to connecting at least 1.2 million new broadband lines (including one million lines with the capacity of at least 6 Mbit/s and two hundred thousand lines with the capacity of at least 2 Mbit/s) within three years (by 31 December 2012).
During the first twenty-four months of the Agreement, TP built a total of 683,933 lines, including 100,700 in the so-called ʻwhite areasʼ – locations where, due to the economic balance, the investment would not have been made by any other operator. In January 2012, the time frame for investments was extended from 31 December 2012 to 31 March 2013 in exchange for higher data rates (220,000 lines at 30 Mbit/s instead of 6 Mbit/s, including 70,000 fibre lines).
Under the agreement, TP committed to ensuring that, within its own organizational structure, a new branch would be created to be responsible for the provision of wholesale services. Under conditions of non-discrimination it would provide these services to the TP branch responsible for retail services, other companies of the TP Group (including PTK Centertel) and alternative operators. In addition, the incumbent operator would regularly provide the President of UKE with information on the degree of conformity to the non-discrimination principle in its organization, using indicators (KPIs) specially developed for this objective. Moreover, TP would provide quarterly reports to independent auditors.
Further measures to ensure equal treatment of all market participants by TP include diversification of the incentives system for employees involved in the provision of wholesale services and for employees who deal with retail services (salaries of employees of TP’s wholesale branch would depend only on the results achieved by that branch, without taking into account the results of the retail branch or the results of the whole company) and the introduction of a new corporate culture for employees engaged in the provision of wholesale services, particularly in terms of application of the non-discrimination principle.
TP was also committed to reducing the flow of illicit information both within the company itself and between entities that belong to the TP Group. Limitation of the flow of information was to be achieved on the one hand by separating the workers engaged in the provision of wholesale services from those of the retail branch and through the introduction and application of rules of conduct (a new code of practice) and, on the other hand, by separation of information systems within TP.
As a result of the actions taken by TP, the incumbent operator’s information systems are to operate in such a way as to ensure both transparency of the internal organization of TP and the companies belonging to the TP Group and equal access to information for all operators. They also prevent discriminatory flow of illicit information within the TP Group. Wholesale services are provided by the wholesale branch of TP using separate information systems, to which other branches of TP and the TP Group companies have no access.
Under the agreement, at the request of alternative operators, TP is obliged to conclude separate agreements to establish the conditions of cooperation between TP and other telecommunications entrepreneurs and help to reduce disputes that arise in this respect.
The agreement also regulates many other issues related to, inter alia, the resolution of almost 200 litigations between TP and the President of UKE and between TP and alternative operators, as well as monitoring the implementation of the commitments made by TP.
Effects of the TP–UKE Agreement and projected actions
Monitoring the implementation of commitments undertaken by TP in the Agreement is based on monthly reports by TP which include the status of implementation of measures, assessment of the risk of delays in the implementation schedule of individual solutions and any information about actual delays. So far, thirty eight reports have been presented and published on the website of UKE. Additionally TP submits a quarterly report which informs the President of UKE on the progress of investments in the network.
Verification of the information submitted by the operator is based on quarterly audits of the implementation of the Agreement. All reports and results of independent audits are publicly available on the web pages of UKE.
The UKE’s report published in October 2011, summarizing the effects of two years of operation of the new regulatory measure, shows that there were still problems to be resolved and concerns associated with the level of implementation of some commitments TP had made. Among the indicated problems were:
inadequate quality of data used to determine the expected throughput of the access lines in TP’s network. For this reason, AOs are not able to determine which data rate they can offer to their customers;
SLAs offered by TP to its own customers contain shorter damage repair times than those offered to AOs;
lack of full implementation of technical solutions in the field of remote diagnostics and reconfiguration of lines, such that AOs using infrastructure of TP could offer their customers support services comparable to those of TP; and
protracted work on a new system of KPIs (key performance indicators) to be used to assess the quality of business processes provided by the wholesale branch of TP to AOs. Work on the new system of KPIs commenced in January 2011 and its completion was planned for September 2011.
It should be noted, that these problems are mainly technical in nature and their number has decreased gradually. Given all the goals and aspects of the Agreement, both the regulatory authority and AOs assess its implementation and effects on the market as positive.
One of the most important elements enabling the impact assessment of the Agreement is the state of implementation of TP’s investment commitments associated with the development of broadband infrastructure. During the first twenty-four months of the Agreement, TP has built a total of 683,933 lines, including 100,700 in the so-called ʻwhite areas’. The vast majority, 93%, are lines with a data rate exceeding 6 Mbit/s. A positive phenomenon is the fact that investment proceeds more quickly in the least cost-effective locations in rural areas.
Table 14.4 shows the schedule for development of broadband infrastructure and the status of its implementation as of 30 September 2011.
Table 14.4 Status of implementation, agreement between TP and UKE after two years, Poland

www.uke.gov.pl/uke/index.jsp?place=Lead01&news_cat_id=168&news_id=7301&layout=3&page=text
With respect to the competitiveness of the market, the improvement in KPIs showing the level of support for AOs by TP should be assessed very positively. The largest leap in quality took place in the first period after the signing of the Agreement – from November 2009 to September 2010, when the average score for selected KPIs improved by 4 percentage points, reaching a stable value of 96%. Currently, the average hovers around 97%.
Improvement of business processes involving the provision of services to AOs is confirmed by the results of a survey conducted by UKE among AOs. When asked for an overall assessment of the effectiveness of the agreement, most operators21 reported that it was an effective solution. Giving examples of the effectiveness of the Agreement, the entrepreneurs indicated facilitating access to TP’s infrastructure, greater promptness on the part of TP in the delivery of orders and more serious treatment of AOs by TP. However, according to AOs the most important positive effects of the Agreement are:
TP keeping (in most cases) to contract deadlines in RLLO (reference leased lines offer) and RIO (reference interconnect offer) services;
removal of illegal clauses from existing contracts;
TP’s inability to refuse the lease of ducts if the technical conditions exist;
preventing TP from putting additional clauses in the contracts;
an easier process of concluding wholesale services contracts with TP; and
the development and implementation of good practices (so-called Chinese walls).
This created a positive environment for all players to compete in the market under the same, non-preferential conditions for development, as well as for the withdrawal by TP of appeals from decisions of the President of UKE, which has improved the legal certainty of wholesale services provided by TP.
The agreement also significantly improved the ability to perform public tasks in the field of telecommunications by local government entities. The local government, before planning its investments, may request access to information about infrastructure owned by TP. This information is very important in the context of obtaining EC approval for public intervention undertaken in the form of investment.
Despite the positive effects that have resulted from the agreement to date, it remains difficult to determine whether functional separation of TP would have been a better option and what further steps the regulatory authority might have taken.
14.4.2 Legal acts constituting principles of operation of the telecommunications market
On 7 May 2010 the Polish parliament passed the Act on Supporting the Development of Telecommunication Services and Networks22. The purpose of the Act was to facilitate investment related to telecommunications infrastructure roll-out and to help to achieve higher levels of competition. Due to the fact that accessibility and range of the telecommunications infrastructure were at a very low level, especially in comparison with the other member states of the EU, the President of UKE has created an administrative and legal framework to encourage local governments to invest in telecommunications infrastructure. The Act has introduced many changes in the field of preparing spatial development plans. The new rules authorize UKE to provide opinions on draft local plans and studies of conditions and directions of spatial development in the field of telecommunications.
Extremely important parts of the Act are the provisions regulating the access to buildings, cable ducts and telecommunications cable. They aim to eliminate the phenomenon of monopolies in multi-family buildings. Three basic rules can be distinguished. First, the Act requires the owner, operator and property manager to provide a telecommunications entrepreneur access to the property and building, including the place in the building where the indoor cables are terminated. Secondly, the owner of cable ducts on the property is obliged to provide access to these ducts to any entrepreneur who has no alternative of using other (existing) cable ducts to provide telecommunications services. Thirdly, the owner of a telecommunications cable connected to a building or distributed in a building is required to provide access to any telecommunications entrepreneur to all or part of this cable if there is no possibility of connecting another telecommunications cable.
In the Act, in response to identified barriers to investment, amendments were made to the so-called rights of way. For new investments and new operators, in particular those building fibre-optic networks, access to existing ducts and dark fibres, as well as transparent and efficient conditions regulating laying one’s own infrastructure on land owned by others, are a matter of vital importance. Until now, the problem in this area was that existing local plans contained numerous prohibitions and restrictions, often factually unjustified (e.g., prohibitions on an investment location just because it has been formally classified as a ʻproject likely to significantly affect the environmentʼ), which thus form areas unavailable for the development of telecommunications networks. In addition, access to land of local government units and legal entities must be improved, in particular access to public roads which are administered by these entities. At the same time, it is necessary to open to investments those areas where disproportionate and inadequate restrictions and prohibitions were established by local plans, and also to establish the limits of freedom of planning with respect to telecommunications infrastructure.
When roads are built or upgraded, technology ducts will have to be made available for placing telecommunications cables. The Act imposes an obligation on road managers – the General Directorate for National Roads and Motorways and local governments – to construct such ducts. Moreover, municipalities will not be able to place prohibitions on telecommunications investments in their spatial development plans without providing a specific reason. Such a prohibition would have to be justified by specific regulations: e.g., on the protection of health or the environment.
Given the high level of investments required, the Act introduces an innovative solution for conducting joint investments by several operators and the establishment of separate ownership of individual optical fibres in fibre-optic cables, as well as wires in cables other than fibre-optic and ducts for laying telecommunications cables in multi-opening ducts.
New powers for local authorities in the field of telecommunications investment
The Act also introduced a new competence for local government entities. The Act stipulates that these entities may build as well as operate telecommunications networks, as part of their own public utility tasks. These tasks will be financed from the entities’ own budgets. The entities may build telecommunications infrastructure, in particular its passive elements (cable ducts, cable collocation facilities, poles, masts, cables) and prepare them for use as a basic layer for telecommunications networks. They can also build telecommunications networks and operate such networks, as well as acquire the rights to already-existing infrastructure. Moreover, they can provide such infrastructure and telecommunications networks to other operators. To build a network, local government entities can also use facilities of electrical power, gas and sewage companies.
New regulations stipulate that local governments can provide telecommunications services to end-users. However, this is permitted only when local entrepreneurs are unable to meet the demand for the telecommunication services, especially Internet access. Moreover, the activities undertaken by local governments must be proportionate and non-discriminatory, so as not to undermine the principles of fair competition in the local telecommunications market. Provision of telecommunications services to residents may, in exceptional circumstances, be free of charge or at reduced prices. However, each commencement of such activity requires the written approval of the President of UKE, expressed in the form of a decision. The decision of the President of UKE shall detail the conditions for the provision of services by the local government entity.
From the perspective of telecommunications companies, the guarantees of competitiveness of services provided by local government entities in the Act are of crucial importance. Under the Act, local governments can both create telecommunications infrastructure and provide access to the Internet. Moreover, the Act expressly provides that the activities of local governments in dealing with digital exclusion are not an economic activity – as a consequence of which local governments are not allowed to gain profit from their activities.
The Act introduces a number of conditions that are designed to preserve the principles of fair and free competition. The networks built by local governments must be compatible and interoperable with other networks, and telecommunications companies are granted the possibility to access and share the network. Compliance with specified requirements is controlled by the President of UKE and, in the case of failure to comply, the President of UKE may order rectification of the non-compliances, indicating the measures to be applied in order to implement this obligation.
The Act also allows local governments to work with telecommunications entrepreneurs. Provision of Internet access services using infrastructure financed by local governments may be entrusted to telecommunications entrepreneurs. If it is not possible for entrepreneurs to run a financially profitable telecommunications business in the area, local government entities may provide the infrastructure or telecommunications network to telecommunications operators for a fee lower than the direct cost of building that infrastructure or network, or co-finance the costs incurred in the provision of telecommunications services to end-users or telecommunications businesses for the provision of those services.
The local government entity is obliged to allow telecommunications companies to share or access telecommunications infrastructure in accordance with the principles of equal treatment and fair and free competition.
In practice, it is likely that both business models will be exercised by local governments – provision of Internet access services directly by local governments, as well as financing infrastructure and making it accessible to telecommunications companies. It seems that the Act is a reasonable attempt to deal with the problem of digital exclusion while keeping a guarantee of competitiveness of the telecommunications market.
14.4.3 Improved local loop unbundling
The market for local loop unbundling (LLU) in Poland started functioning in 2005, following the intervention by UKE.
Even though TP had been aware of upcoming access obligations for LLU, BSA and WLR since 2003 when the Polish Telecommunication Law identified TP as an SMP operator, until 2009 TP used various delaying tactics throughout the access negotiation process.
According to the European Commission, TP has been abusing its dominant position by refusing to provide access to its network and supply BSA and LLU wholesale products since 3 August 2005. TP rejected a high number of BSA and LLU requests on formal and technical grounds, at least until 2007. Furthermore, TP proposed unreasonable conditions governing alternative operators’ access to the wholesale broadband product. For example, TP proposed exaggerated costs estimates for LLU collocation, which often resulted in a very high percentage of locations not being accessed by AOs despite the positive outcome of the technical verification. Moreover, TP delayed the implementation of orders and executed certain collocation works with delays.23
As a result, for the first four years alternative operators did not use LLU on a large scale, remaining focused on the use of TP’s infrastructure through bitstream access (BSA) and wholesale line rental (WLR) services, which were cheaper than LLU and did not require any investment outlays. (See also Section 14.3.1 Wholesale broadband access for detailed prices)
After changing the framework offer for LLU in 2008 and the signing of the Agreement between TP and UKE in October 2009, alternative operators, reassured by TPs changing approach to regulatory obligations and completion of actions that were blocking the development of wholesale markets, started using the wholesale LLU services more willingly. Due to this intervention the number of unbundled loops started to grow from 2009, to stabilize in 2011 and to reach 6.94% of total lines by 2012. See also Table 14.5 reflecting the number of alternative operators by (main) wholesale product of TP. Note that 99.6% of LLU lines are used by a single alternative operator – Netia.24
Table 14.5 Number of alternative operators using TP infrastructure, Poland, 2006–2011

http://blog.orange.pl/uploads/mail/raport_rozwoj_rynku_telekomunikacyjnego_w_polsce.pdf.
The development of services based on LLU has a negative impact on the size of BSA and WLR markets, mainly replacing BSA, while WLR still has the largest wholesale share. The investments by alternative operators in network elements necessary for the provision of LLU-based retail services reflect the next rung of the investment ladder. As WLR and BSA wholesale services introduced mechanisms for price competition, LLU-based service introduced mechanisms of competition that are also based on innovation. The strategy of the President of UKE in the period 2006–2009 was based on enabling service-based competition between telecommunications companies, so that benefits to consumers were both high and extremely quick. The current strategic objective is focused on service-based competition using LLU and infrastructure-based competition with the CATV-network operators.
However, the development and popularity of the LLU service depends on creating competitive offers through innovation, increasing the number and range of services. A lack of ability to offer advanced services (e.g., HDTV, VOD) due to low penetration and the long sections of TP’s copper access network involved – limiting the data rates that can be offered – are major barriers to the purchases of LLU services.
Also TP is affected by the low quality of the copper network and limited in offering converged services: that is, bundles including TV. Therefore, TP is currently investing in the network in order to obtain higher data rates. The attractiveness of LLU-based services should increase after TP finishes its investments. The systematic modernization of the incumbent operator’s network provides the possibility of offering more advanced services to its own customers and to wholesale buyers using the LLU service25. By the end of 2012 the TP share of DSL-lines was 71% and the share of alternative operators 29%. Of the DSL market of the alternative operators, 39.8% was provided based on their own networks, while 60.2% was based on wholesale, including 43.7% based on bitstream, 4.8% on shared access and 11.7% on full unbundling.26
14.5 Development of mobile broadband
On the broadband services market in Poland, the greatest dynamics of development are currently observed in the segment of mobile access. Since 2011, the role of mobile data transfer has been steadily increasing, driven by higher smartphone penetration. The penetration of mobile broadband continued to be slightly above the EU average with 10.36% for dedicated data cards and modems in January 2013, representing over 4.1 million users.27
Mobile broadband penetration, which refers to Internet access on third-generation technologies and higher data rate mobile technologies (i.e., HSPA or LTE), including modems and dongles reached 41.4% in 2012, only 1.7% below the EU average.
14.6 Broadband market overview: status in 2013
14.6.1 The supply side
The providers of broadband Internet access in Poland are fixed telephony operators, cable television operators and operators of GSM/UMTS mobile networks.
The largest fixed network operators are: TP and Netia SA. The network of TP covers an area of about 312,000 km2, which means the coverage of almost the entire Polish territory. However, with PSTN penetration peaking at 31% the household coverage is approximately 85%. The coverage of the fixed networks of Netia SA is just over 30,000 km2 and 2.9 million households or approximately 20% of households.
There are about 500 cable television operators, which serve about 4.6 million subscribers. The largest operators are: UPC Telewizja Kablowa Sp. z o.o., Telewizja Kablowa Vectra S.A. and Multimedia Polska S.A, which together account for about 67.5% of the cable television market.
Table 14.6 shows the largest cable network operators, the number of subscribers and market share.
Table 14.6 Overview of the largest cable network operators, Poland, 1Q 2013

Cable television networks are built and operated only in regions with a high density of inhabitants: i.e., primarily built-up urban areas consisting of multi-family buildings. A consequence of this is the low coverage of the geographical area of the country, with CATV networks reaching only about 8,000 km2.
Mobile network operators include those which provide Internet access services via GSM/UMTS technologies. At the end of 2012, the shares of the operators in the total number of 2G/3G modem users were as follow: T-Mobile 29.3%, PTK Centertel 27.6%, Polkomtel 25.6%, P4 16.2% and others (MNOs and MVNOs) 1.3%.28
Among the alternative operators, the largest group are small local ISPs, of which there are about 8,500 (90% of which serve fewer than 1,000 subscribers). To provide broadband services to consumers, they primarily use LAN, Ethernet and WLAN technologies. For the backbone connections they make use of the infrastructure of other operators including TP.
Despite the ongoing convergence of services towards bundled offers such as triple-play, the traditional services remain fundamental in terms of revenue for the major players in this market: i.e., fixed telephony services and cable television services, respectively.
By technology
On the retail market, broadband data transmission services are provided by telecommunications operators using different technologies or transmission media. The most popular of these by far in terms of revenues is the xDSL technology related to the strong position of TP, the former monopolist and largest telephone service provider. In 2012, TP had direct control of approximately 71.2%29 of xDSL lines. The remaining 28.8% of the lines were operated by alternative operators, 11.5% directly owned and 17.3% through wholesale. xDSL technology held more than a 36.8% market share of total fixed broadband in 2012.30
The second most popular access technology is DOCSIS, used by the operators of cable TV networks.
The market structure of Internet access technologies in Poland in terms of the number of subscriber lines in the year 2012 is shown in Table 14.7.
Table 14.7 Internet access technologies by number of subscriber lines, Poland, 2012

Among the other technologies, a major role is played by wired LAN (Ethernet) and wireless LAN (WLAN) serving about 2.25 million people. These remaining technologies constitute 4.6 per cent in terms of market share. It is important to point out that by 2010, there were only 25,500 lines subscribed using optical fiber technology (FttH), which accounted for 0.4% of all fixed lines. The pace of deployment appears to be increasing, with the installed base nearly doubling by mid-2011. By 2013, FttH/B subscription was estimated at 100,000 lines.
In Poland as in other EU countries, there is a new trend in the Internet services market: the increasing market share held by local ISPs, cable TV operators and mobile operators. The reason for the migration of consumers between technologies is the ability to reduce charges for telecommunications services by combining them in a package of services (service bundling) from one operator. The report published by the President of the Office of Electronic Communications (UKE) in 2013 showed that the offer of cable television operators was always the cheapest. Subscribers who chose access through a CATV modem paid an average of 40–50% less than customers of Telekomunikacja Polska and other providers offering Internet through the infrastructure of the incumbent operator.
14.6.2 The demand side
Due to the increase in consumer interest in new services, and due to provision of bundled services which lowers the cost to consumers, the degree of market penetration of broadband services in Poland continues to grow. Figures 14.3 and 14.4 reflect the growth and penetration per 100 inhabitants of fixed and mobile broadband, respectively. At the end of the 2012, broadband access to the Internet was used by more than 11 million users – approximately 7.6 million connected via fixed lines and 4.1 million via wireless access using GSM/UMTS mobile phone networks (dedicated data service cards, modems and keys).

Figure 14.3 Fixed broadband lines (left axis in thousands) and penetration (right axis), Poland, 2005–2012

Figure 14.4 Mobile broadband modems (left axis in thousands) and penetration (right axis), Poland, 2008–2013
Usage
Analysis and research on the availability of the Internet in Poland indicate a continually growing number of Poles using the networks. It is estimated that in December 2012 the Internet was used by 62% of Poles aged over 15 years31, which is 17.1 million Poles32. It is worth noting that the vast majority (69.4%) of the respondents declare that they use it daily or almost daily, and 21.3% use the Internet several times a week33, 34
It should be noted, however, that despite the increase in Internet activities, there are still significant barriers which limit the demand for network access services in Poland. About 38% of Poles do not use the Internet, and half of them explain this fact by a lack of need and interest: 83% of people aged over 60 years do not use the Internet. This is true for both private individuals and entrepreneurs and does not result solely from financial or infrastructural obstacles but more from lack of motivation and from competence barriers. Social research shows that 38% of Poles are computer illiterate.35 An additional element that limits demand is a very weak level of development of public services in the area of e-administration and e-health. The implementation of such services and appropriate promotional and educational activities can significantly increase citizens’ Internet activity as exemplified by the system initiated in 2008 to submit annual tax returns.36 Unfortunately, such initiatives are still rare, both from the private sector and from public authorities. As a result, the demand for the digital economy offer is smaller than might be expected from the existing demographic potential in Poland.
14.6.3 Market drivers
A key factor in the growth of demand for Internet access services is an increase in the number of households equipped with computers. Their number is growing fastest among the wealthiest households and is the highest in families with children and in households of three or more people. The smallest increase in the number of computers is in single-person households without children. Fewer and fewer people indicate economic grounds as the reason for not having a computer and not having access to the Internet.
The survey conducted shows that the number of new connections implemented using DSL technology continues to grow, but the rate of growth is slowing. The shares of each fixed technology remain at a similar level. However, the share of mobile access soars as a result of, inter alia, aggressive marketing policy, an increasing perception by customers of mobile Internet access as being equal to fixed service, the increase in sales of portable computers and the fashion for mobility, especially among young people.
However, for many people, mobile broadband access is not so much the choice of a modern approach to the consumption of services but rather a necessity due to lack of alternative access technologies. The same was true of mobile telephony, which has become a substitute for fixed-lines for many subscribers in areas where a fixed line network has never been built.
Mobile broadband access is perceived by a significant proportion of Poles as a substitute for fixed broadband access, rather than as additional access. Depending on the profile of Internet use and household wealth, mobile broadband access can be complementary to fixed broadband access, or may be its substitute because of:
growing number of mobile devices with access to the Internet (smartphones, tablets, PCs, notebooks, netbooks, etc.);
greater difficulties in obtaining fixed broadband access in rural areas than in highly urbanized areas;
low requirements for bandwidth and volume of data transmitted by most of the users, who almost exclusively take advantage of applications that do not require broadband (e-mail, text messaging, occasional web browsing without watching movies simultaneously);
lower price of mobile access in relation to fixed access (subscription to fixed telephony is often perceived as unnecessary);
increasingly better transmission performance in mobile networks.
The increase in revenues of mobile operators from mobile Internet is also the result of the emergence of new models of smartphones, tablets, and also of equipping mobile devices with 3G modems.
The increase in the number of mobile devices with network access is accompanied by a steady decline in the prices of mobile Internet access. The charges for domestic data transmission ranged from PLN 13.98 (EUR 3.33) to PLN 32.02 (EUR 7.62) per month for 2 GB. See also Figure 14.5.

Figure 14.5 Average monthly cost of service and percentage drop in prices, Poland, January 2012 and March 2013
All these factors lead to an increased demand for mobile data. The volume of traffic carried over the Polish mobile networks is increasing dramatically. In 2010, 37.3 billion MB of data was carried over the mobile networks. In 2011, it was already 73 billion MB, and in 2012 approximately 157 billion MB.
Bundled services market
In 2010, bundling services was one of the main trends in the Polish market. Its attractiveness results mainly from lower usage costs for the full bundle. The development of competition opened up the prospect of choosing an offer tailored to the users’ individual needs. In 2013, a total of forty-one companies provided bundled offers from which about 2.6 million users benefited, generating revenues for operators at the level of PLN 3.8 billion (EUR 900 million). Double-play packages were the most popular: 79.5% of subscribers have chosen this option. Over 19.7% of consumers have chosen the variant of triple-play. The package of four services was used by only 0.9% of users, which was associated with the small number of quadruple-play offers and less favorable conditions than in other packages for mobile phone services by mobile operators.
The solution combining Internet and cable TV was the most successful among the packages including two services. In 2012, more than 50 per cent of users decided on this package, whose popularity stemmed from the highly competitive offers of CATV operators that provide their services using high-bandwidth connections. The main actors in the market were TP, UPC and Vectra. See also Table 14.8 showing the demand for bundles in 2011 and 2012.
Table 14.8 Market share of bundles, Poland, 2011 and 2012
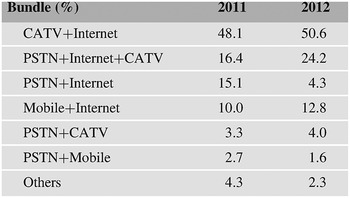
14.7 Deployment of EU funds
Until 2012 the level of absorption of EU funds for development of infrastructure for the Information Society under various programs left much to be desired. For example, out of PLN 2.3 billion (EUR 549 million) granted to Poland in 2007–2013 within the framework of sixteen regional programmes, only 8.8% of the funds available had been spent and cleared as of mid-2011.
Since 2012 there has been an increase in the utilization of the European Regional Development Fund. This is due to local authorities becoming involved in the implementation of projects aimed at the development of Information Society infrastructure. These projects seek to build modern fibre-optic networks for the provision of broadband services. In particular:
Eastern Poland Broadband Network
Lower Silesia broadband network
The Eastern Poland Broadband Network is the largest ICT investment in Europe funded by the European Union. Its value is more than PLN 1.4 billion (approximately EUR 300 million), of which EUR 255 million will come from the European Regional Development Fund. Other costs will be financed by the local governments of the voivodeships (provinces). Its aim is to increase access to broadband Internet in the macroregion of Eastern Poland consisting of: Lubelskie, Podkarpackie, Podlaskie, Swietokrzyskie and Warmia and Mazury. As a result of the project, fibre optic infrastructure will be deployed, allowing the development of telecommunications services including next-generation services.
The broadband network project in Mazovia is estimated at PLN 475.6 million (EUR 115.5 million) for the almost 3,700 km fibre optic network. A significant part of the funding will come from EU funds – PLN 340 million (EUR 82 million) – and the remaining amount will come from the budget of the Masovian voivodeship regional government. This project is interesting because it envisages the construction not only of transmission and distribution networks but also of an access network based on fibre-optic technologies (FttB).
The Lower Silesia broadband network project includes a 1,700 km fibre network, including 700 km of backbone, to be deployed in southwestern Poland. The total cost of the project is estimated at PLN 342 million (EUR 83 million).
Currently, broadband networks co-financed with the European funds are being deployed in many different regions of Poland, to close the broadband gap due to a lack of private investment in broadband network infrastructure.
14.8 Realization of the Digital Agenda targets
Regulatory actions taken by the President of UKE have increased the pace of development of the Polish telecommunications market. However, the low penetration of fixed networks and lack of investment in existing and new networks remain the most important barriers to the development of broadband networks.
Attempting to meet even the first of the Digital Agenda objectives – coverage of 100% of Europeans with conventional broadband by 2013 – has not been realized due to the low population density in rural areas (rural 50/km², urban 1105/km²; average 122/km²) and gaps in coverage by fixed networks in rural areas which are very expensive to cover. A report published by the European Commission has revealed that most of the unconnected households in rural areas in Europe are in Poland (37%), followed by Germany (9%) and Italy (6%).37
Broadband penetration (fixed plus mobile) per household shows a steady growth over the period 1H 2010 to 2H 2012, from 61.0% to 83.5%. The numbers per 100 inhabitants are 21.3% and 29.3%, respectively. As a result, according to data from the European Commission (January 2012), Poland assumes the antepenultimate place, with fixed broadband Internet penetration at 19.6% (the average for the EU27 is 28.8%).38
For many years, broadband lines in Poland were characterized by a much lower data rate than in other EU countries; the range of 144–2048 kbit/s being dominant until December 2010 (50.9%). In recent years this has improved significantly. By December 2012, more than 53% of broadband lines had download data rates in the range from 2 to 10 Mbit/s, while nearly one-third had 10 Mbit/s or more. See Figure 14.6 for the progression in data rates.

Figure 14.6 Downstream data rate trends, Poland, 2012
Note: From December 2011 the chart shows the share of broadband lines within the range 10–30 Mbit/s and >30 Mbit/s to replace the previously used >10 Mbit/s.
Even though broadband connections are becoming faster, ultrafast Internet access is still rare in Poland – only 8.8% of fixed broadband connections are above 30 Mbit/s and only 1.2% are above 100 Mbit/s. This indicates that Poland is still far away from achieving the high-end target of the Digital Agenda for Europe, which is 50% subscription of broadband access technologies with at least 100 Mbit/s in 2020.
The second, more qualitative factor in the development of this market is the growing competition in the market for broadband Internet access, understood as the increasing share of alternative operators. In recent years, the share of the incumbent operator TP in the total market for provision of Internet access has been decreasing. Cable television network operators achieved significantly greater penetration of broadband services in households than TP. This means that in Poland, in big cities where cable TV networks operate, penetration of broadband services is significantly higher as a result of infrastructure-based competition in those areas. However, in the medium-sized and small cities and suburban areas, there is only TP’s infrastructure. This means that in non-urban areas, TP often remains the only operator, with a relatively modest level of service-based competition. Moreover, there are still ʻwhite areasʼ where there is no or very limited potential to provide users with fixed access to the Internet. Often such areas are also not within the UMTS network coverage of mobile operators, which results in digital exclusion. An important feature in these areas remains the local ISPs, providing services within a small area, responding to local demand. A further qualitative factor is the development of competitive retail markets for broadband services on the basis of BSA and LLU contracts. They provide great opportunities for alternative operators to compete with the incumbent operator for individual clients. Analysis of indicators of BSA and LLU penetration shows that in Poland this segment is still in early stages of development.
An important recent step towards removing barriers to broadband Internet access was the adoption of the ʻAct on supporting the development of telecommunications networks and services.ʼ The new regulations are expected to significantly accelerate the development of telecommunications investments and facilitate the process of disbursement of EU funds for development of broadband Internet access.
Even though, Poland is already working to close the rural gaps by creating an LTE network to deliver fourth-generation mobile broadband and using structural funds to finance the development of high-speed networks, the roll-out of ultra-fast broadband in Poland may take longer than desired.
Essential for further development of the market is for the regulatory authority to take significant steps to support the development of the broadband market in Poland. It is also important to stress the activities of the government in development of this market, especially during the economic downturn and while the incumbent operator is unwilling to invest in the development of the company and its infrastructure assets. The coming years should therefore be devoted to implementing the provisions of the Act on supporting with development of telecommunications networks and services, which condition the effective provision of access to modern infrastructure for clients. Continued support for the local authorities in the development of telecommunications networks will also play a major role in improving the climate for investments. By increasing the efforts of local governments in the acquisition and spending of EU funds for development of broadband infrastructure, it will be possible to implement not only small projects (hotspot access networks) but also the large investments associated with construction of fibre-optic NGA networks.
The initiative of local authorities may be an alternative way of influencing the level of development of broadband infrastructure. The growing number of projects involved in the construction of regional broadband networks in Poland, as well as the recent investment measures, appears to confirm this observation. However, most of these projects are currently in the early stages of implementation and at this stage it is difficult to determine the financial and market effects that will be achieved after they have been completed.
The involvement of local authorities in projects related to the construction of broadband networks presents an interesting topic for further research. Further research should also be done to investigate the possibilities of implementation of more flexible regulations that will facilitate and promote an appropriate environment for large-scale network investment in FttH technology. The Polish experience shows that at a very early stage of the development of FttH, the imposition of regulatory obligations on operators, and even fear of the imposition of such duties, might effectively discourage operators from building their own fibre-optic access networks. Analysis of the results of these changes could provide the most efficient tools to support the construction of fibre-optic networks.
14.9 Case summary and conclusions
The case summary is provided with reference to the research questions formulated in Chapter 2 – Research context and perspective.
14.9.1 Starting conditions
A highly relevant starting condition in terms of comparing broadband development in Poland with other member states of the European Union is the return to independence of the state in 1989. The starting position in 1989 was a teledensity of 8.2% on average and 2.4% in rural areas, on the low end of the spectrum compared to other East European countries (Hungary: 10%; Czech Republic: 16%; Latvia: 26%), and significantly lagging the West European countries (e.g., Germany: 40%; UK: 44%; Sweden 68% as of 1990). (OECD, 1999).
14.9.2 Role of the central government
The liberalization of the telecommunications market started in 1990 with local access. The long-distance network was liberalized in 2000, to be followed by international networking in 2003.
Since 1990, the public telecommunications policy and regulations have reflected different objectives to be pursued: starting from attempts to build a model based on free-market competition principles in the period 1990–1994, followed by a period of support for the monopoly of the dominant operator (1995–2000), which led to a period characterized by inefficient regulatory interventions (2001–2005), to be replaced by a period of aggressive and effective involvement by the telecommunications regulator with a clear focus on increasing service competition (2006–2009), which provided the basis for the current period of stimulating development of the market through the use of pro-investment stimuli primarily aimed at increasing infrastructural penetration (2010–2013).
The Act of 2010 regulated the access to buildings, cable ducts and telecommunications cable, thereby making an end of the monopoly on indoor access.
14.9.3 Role of municipal government
The Act of 2010 allows local government entities to build and operate telecommunications networks as part of their public utility tasks. These tasks are to be financed from the entities’ own budgets. However, this is permitted only when private operators will not be able to meet the demand for Internet access. Moreover, the activities undertaken must be proportionate and non-discriminatory so as not to undermine the principles of fair competition. The networks built by local governments must be compatible and interoperable with other networks, and telecommunications companies are granted the possibility to access and share the network. The Act provides that the activities dealing with digital exclusion are not an economic activity – as a consequence of which local governments are not allowed to gain profit from these activities. The Act sets conditions designed to preserve the principles of fair and free competition.
14.9.4 Role of the regulator
Five years after full liberalization, no action had been forthcoming from the government on improving the conditions conducive to the development of effective competition. This situation changed in 2006, when Anna Streżyńska took the helm as the President of UKE (Urząd Komunikacji Elektronicznej – Office of Electronic Communications), the national regulatory agency, and challenged the monopoly position of TP. Due to her proceedings towards functional separation, TP changed its strategy from blocking entry to enabling entry and making a commitment to improve the PSTN infrastructure. In return the UKE promised not to reduce the wholesale rates for the next three years. In this way, the President of UKE initiated a new era in the relationship between the regulatory authority and the incumbent, an era of dialog formalized through the Equivalence Charter, with monitoring of TPs commitments based on KPIs.
14.9.5 Achieving the Digital Agenda targets
The low penetration of fixed networks and the lack of investment in existing and new networks remain the most important barriers to the development of broadband networks. As a result, Poland assumes the antepenultimate place, with fixed broadband penetration at 19.6% (the average for the EU27 is 27.7%).
The penetration of mobile broadband continues to be slightly above the EU average with 10.36% for dedicated cards and modems in January 2013, representing over 4.1 million users.
The deployment of high data rate broadband lines is still limited, with about 20.4% of fixed broadband lines providing more than 10 Mbit/s, and ultrafast Internet access is still rare in Poland – only 8.8% of fixed broadband connections are above 30 Mbit/s and only 1.2% are above 100 Mbit/s. This indicates that Poland is still far away from achieving the high-end targets of the Digital Agenda for Europe.
14.9.6 Salient items in this country case
The salient items in this case are:
– The reverse sequence of liberalization as compared to most other countries – first the local networks, followed by the inter-city network and finally the international network access – which may be explained by the importance of international settlements in hard currency;
– The frequent changes in objectives pursued through telecommunications policy and regulation, as a consequence of changing political forces in Parliament;
– The changes in the organization of the regulatory office, from its start in 2001 as URT, to URTiP in 2002 and in 2006 to UKE;
– The role given to municipalities as ‘lenders of last resort’ to build and operate telecom infrastructure in those areas that are not served by commercially oriented operators.
– Technology-based catch-up in mobile but not in fixed broadband. The substitution of mobile communications resulted in teledensity of fixed lines reaching its peak at 31% in 2003;
– Infrastructure-based competition limited to the major cities where CATV-cable is deployed;
– The lack of transition in access-based competition, from BSA and WLR to LLU, despite unbundling regulations in place;
– Leapfrogging technology, moving towards FttH/B without the interim solution of VDSL, of which deployment is hindered by the quality of the existing copper loops;
– The challenge of closing the gap between urban and rural developments, Poland representing 37% of unconnected households in rural areas in Europe.
14.9.7 Experiences that might benefit other member states in realizing the Digital Agenda for Europe targets
– The personal intervention of the president of the regulatory authority in achieving a change in the attitude of the incumbent operator towards its competitors;
– The role given to municipalities as ‘lenders of last resort’ to build and operate telecom infrastructure in those areas that are not served by commercially oriented operators. With the change of law in 2010, the role of municipalities is still in a very early stage;
– EU funding of NGA projects in sparsely populated regions.
References
1 Telekomunikacja Polska was renamed Orange Polska in April 2012, in line with France Télécom’s international telecommunications branding.
2 Act of 28 January 1987 Law on Counteracting Monopolistic Practices in the National Economy (Act on Combating Monopolistic Practices), Dz.U. 1987, Nr 3, poz. 18.
3 The establishment of an NRA was in anticipation of the joining the EU.
4 Since 27 January 2012 the President of the Office of Electronic Communications (UKE) is Magdalena Gaj.
5 It is important to point out that before the privatization process of TP started, the State Treasury tried to maximize the sales value of TP shares by maintaining TP as a monopoly for many years.
6 Tyczyn and WIST received support from US-based National Telecommunications Cooperative Association (NTCA) volunteers who provided practical expertise in managerial, organizational and technical issues.
7 District Telephone Cooperative (DTC) Tyczyn: Partnership for Local Economic Development, United Nations Development Programme, September 2007.
8 By 2003 the independent telecommunications companies were investor-owned, except for Tyczyn and WIST.
9 ERA GSM – currently T-Mobile – the sole owner of PTC is the Deutsche Telekom (DT) Group.
10 SDI – stały dostęp do Internetu (fixed Internet access)
11 Source: Report on the telecommunication market, URTiP, 2005.
12 In 2008 Netia acquired Tele2 and over the next few years it started buying up smaller, local ISPs. The acquisition of Dialog took place in 2011.
14 Source: Report by A.T. Kearney, October 2012.
15 Poland’s telecommunications industry, Polish Information and Foreign Investment Agency, 2006.
16 On 22 June 2011 the Commission imposed a fine of EUR 127.5 million on TP for refusing to supply wholesale broadband products to alternative operators. The decision found that TP’s behaviour aimed at hindering alternative operators’ access to TP’s wholesale products applied at every stage of the process.
(Commission Decision of 22 June 2011 relating to a proceeding under Article 102 of the Treaty on the Functioning of the European Union, Case COMP/39.525 – Telekomunikacja Polska (notified under document C(2011) 4378).
18 KPIs – key performance indicators that enable assessment of the objectives’ realization in areas such as finances, customer service, product quality. Analysis and publication of indicators developed by TP and concerning the quality of wholesale and retail services is to allow the statement whether the company discriminates against alternative operators. In a set approved by the President of UKE, 55 indicators have been defined along with their required level. See: Annex No. 5 to the Agreement. KPI List together with their reference level www.uke.gov.pl/uke/ redir.jsp?place = galleryStats & id = 23644.
19 The agreement between TP and the President of UKE. Communication of 22 October 2009 www.uke.gov.pl/ uke / index.jsp?Lead02& place = new s_cat_id = 19& news_id = 4750&layout = 1&page = text.
20 Wholesale prices of LLU, WLR and BSA have remained the same into 2013.
21 49% of the operators agreed somewhat, 11% agreed completely, and only 4% of the operators disagreed, while 36% of the respondents said they did not have an opinion on this issue.
22 The Act of 7 May 2010 on supporting the development of telecommunications services and networks, Journal of Laws No. 106, 2010.
23 Commission Decision of 22 June 2011 relating to a proceeding under Article 102 of the Treaty on the Functioning of the European Union, Case COMP/39.525 – Telekomunikacja Polska (notified under document C(2011) 4378.
24 Source: The analysis of market development of LLU, The President of the Office of Electronic Communications, Warsaw, 2010 and KPI report, Q3 2012, Warsaw 2013.
25 Analysis of the development of LLU service, Warsaw, October 2010, www.uke.gov.pl/uke/index.jsp?place=Lead01&news_cat_id=188&news_id=5899&layout=3&page=text.
26 Source: Report on the telecommunications market in Poland in 2012, UKE, 2013. Fast and ultra-fast Internet access – analysis and data, Broadband indicators, Digital Agenda Scoreboard key indicators 2013, http://ec.europa.eu/digital-agenda/en/fast-and-ultra-fast-internet-access-analysis-and-data.
27 Digital Agenda Scoreboard, January 2012. According to UKE mobile internet penetration is 8.64%.
28 Report on the telecommunications market in Poland in 2012, The President of the Office of Electronic Communications, Warsaw, June 2013.
29 Report on the telecommunications market in Poland in 2011, Office of Electronic Communications, The President of the Office of Electronic Communications, Warsaw, December 2011.
30 Report on the telecommunications market in Poland in 2012, The President of the Office of Electronic Communications, UKE, 2013.
31 World Internet Project 2013.
32 According to Internet World Stats percentage of Internet users in Poland in 2010 exceeded 58%, or more than 22 million people. www.internetworldstats.com/top25.htm.
35 Narodowy Plan Szerokopasmowy, – perspektywa 2020 r., Warszawa 2012.
36 The tax refund system was canceled in 2012, mainly due to budget constraints.
37 Digital Agenda Scoreboard, January 2012
38 Digital Agenda Scoreboard, January 20123
15 Latvia
15.1 Introduction to the case study
Latvia has a longstanding competence in telecommunications (telecom), producing telephone sets already before the First World War. Moreover, the VEF factory (established in 1932) produced 40% of local and regional telephone exchanges in the Soviet Union in the 1980s. The Riga Technical University was the only educational institution in the Baltic area that trained telecom engineers. Hence, high skilled telecom professionals were available in the labour market in Latvia when independence was restored in 1991.
The major problem – as in other Eastern European countries – was underinvestment in the network. Although the telephone density, with about 26 main lines per 100 population, was fairly high by Eastern European standards, the public network was based mainly on analogue technology. The telephone waiting list included more than 140,000 applications, with waiting times up to twenty years.
In this chapter we capture the quick catch-up that Latvia was able to realize. In this section the early developments are described, including the emergence of the Internet and the role of mobile communications. Section 15.2 is focused on the regulatory developments and Latvia joining the EU. The development of fixed broadband is discussed in Section 15.3 and mobile broadband in Section 15.4. The realization of the Digital Agenda targets is the topic of discussion in Section 15.5. The quality of broadband service and broadband usage are covered in Section 15.6 and 15.7, respectively. Section 15.8 explores developments expected in the near future. Section 15.9 provides the case analysis and conclusions.
15.1.1 Basics of the normative and regulatory environment
In 1993 the Supreme Council of Latvia passed a comprehensive Law ‘On Telecommunications’, which established the basis of the legal framework for telecom activities in Latvia (Virtmanis, Reference Virtmanis1997a); see Figure 15.1 for a timeline of major events. According to the law, the Department of Communications of the Ministry of Transport was responsible for the overall telecom policy in Latvia, including radio frequency management, mobile licensing and relations with international telecom organizations.

Figure 15.1 Formation of the normative, regulatory and technological environment
In the same year, the Telecommunications Tariff Council (TTC), the de facto regulatory body, was established. Its task was setting tariffs and rates for basic telecom services (moving to cost-based prices), as well as control of the quality of services.
The government established the national telecom company in 1992 (from 2006 called Lattelecom)according to the country’s general political and economic transition strategy. The public telecom institutions and the whole infrastructure falling within the framework of the Ministry of Transportation were placed under its responsibility. The law granted Lattelekom an exclusive right to provide the basic public voice services, as well as the leasing of circuits, for 20 years. The provision of ‘universal service’ was coupled with granting the monopoly to Lattelekom.
The market segments of mobile, satellite communications and paging (all under a licensing regime) as well as value-added services were opened to competition (under the responsibility of the Ministry). See Table 15.1 for an overview of the current major operating entities1.
Table 15.1 Main telecommunications operators and their shareholders, Latvia, 2013
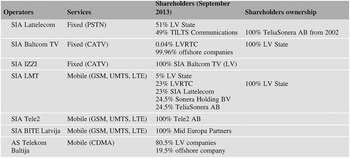
Starting from 1994 the state telecom policy was updated several times (Lauks & Berzins, Reference Lauks and Berzins1998) in response to issues arising. Latvia joined the WTO in 1998 and the government already had signed the Association Agreement with the EU. Discussions with the European Commission (EC) on various levels were intensive in the second half of the nineties (Karnitis, Reference Karnitis1999). Therefore it became necessary to harmonize the 20-years monopoly granted to Lattelekom with the general trend towards competition. On the other hand, because of a weak economy and low purchasing capacity, there was no place for another serious investor in the relatively small fixed market in Latvia. Modelling of the situation showed that opening-up the fixed market would have a significantly negative impact on the network upgrade plans.
15.1.2 Development of the fixed network
Modernization and upgrade of the Latvian fixed public telecom network was a critical precondition for the creation of an advanced infrastructure with independent access to international communications. The establishment of a full four-level hierarchy of the digital network, which is prescribed by international standards, was envisaged by the modernization project to replace the star-shaped centralized infrastructure of the analogue PSTN network2.
A partial privatization of Lattelekom was chosen to ensure the necessary investments, to provide telecom modernization and stimulate rapid growth in the sector, to gain access to advanced technologies and services, to introduce private sector management practices, to improve network performance and the quality of services, and to make Latvia a major telecom hub on the eastern shore of the Baltic Sea (Karnitis Reference Karnitis1996, Virtmanis Reference Virtmanis1996). The TILTS Communications consortium (70% Cable & Wireless, 30% Telecom Finland) was selected as Lattelekom’s strategic investor because of a higher value bid, better inward investment, shorter time frame for implementation, lower tariff basket and equal priority to both corporate and technical modernization. The International Finance Corporation joined the TILTS with a 10 per cent stake in 1994. The Umbrella Agreement among shareholders defined their responsibilities as: technical network modernization, management of Lattelekom and its development, inward investments and principles of tariff setting. The Umbrella Agreement covered the period 1994–2013; to start market liberalization, the government shortened the monopoly to 2003, maintaining the validity of the agreement.
Lattelekom’s obligations (bound by the Law and the Umbrella Agreement) did not allow it to act purely for profit: the company was required to digitalize the telecom system completely (including remote rural areas) and in the meantime to maintain the quality of the existing analogue network.
The construction of the fibre trunk network with international connections was the key element of the modernization. A western and an eastern optical loop were built; communications between Riga and all twenty-six district centres were provided using SDH multiplexing technology. The submarine cable connecting Latvia and Sweden, the microwave link between Riga and Tallinn and satellite communications via the EUTELSAT system (later connections to Lithuania, Belarus and Russia) provided reliable and sustainable international connections.
The OPGW (optical ground wire) technology3 was chosen for development of the Western optical ring. For the implementation Lattelekom concluded a long-term agreement with energy company Latvenergo, which later was enabled to equip and explore a parallel nationwide optical trunk network. Another such network was constructed by the national railway company following railway tracks and connecting the capital with the country’s larger cities. All-in-all, three competing fibre core network infrastructures were developed in the country.
In the first years of the modernization, some commitments were accomplished or even exceeded, while others remained unachieved. Lattelekom was successful in developing the digital access network in Riga, as well as in laying international fibre connections that sharply improved Latvia’s capability of carrying transit traffic. The new fibre telecom backbone covered the major cities within the territory of Latvia.
1995 was the year when customers felt the impact of the benefits of the modernization of Lattelekom; thousands of them were connected to digital switches, including those from the waiting list. Half of Lattelekom customers were connected to digital switches by 2000; moreover, the people had the opportunity to use digital payphones.
At the same time a higher level of capital expenditures for the upgrading of local lines, combined with lower tariffs set by the TTC, resulted in the delay of some capital expenditures: e.g., the extension of the eastern leg of fibre backbone, development of rural radio systems and payphones.
A significant growth of fixed phone density in Latvia was forecast; however, in practice it never happened and fixed phone density in Latvia never exceeded the 31% threshold. The main reason was the substitution of mobile for fixed lines, which happened in the country thanks to the successful roll-out of mobile networks, as well as changes in the pricing policy of the incumbent operator.
Before liberalization and interference by the regulator, the incumbent cross-subsidized domestic telecom services with revenue from international services; in addition, users of services on the analogue network historically paid only a fixed monthly fee. A huge customer loss resulted after setting new prices for local telecom services; the so-called tariff rebalancing was not completed in Latvia by the deadline because of the low purchasing power of consumers.
The full switchover of analogue customer lines to digital, as one of the modernization goals, was finalized by 2008.
15.1.3 Development of the cable TV network
The CATV segment developed rapidly in parallel with the modernization of Lattelekom. According to EU regulations, no classic CATV licence was granted to Lattelekom to stimulate infrastructure-based competition.
CATV provider Baltcom TV was established in 1991; another CATV company IZZI has existed since 1994, while the company’s shareholders and name changed several times. In 2013 Baltcom TV acquired a 100% stake in IZZI, although the companies remain operating separately.
Both companies worked according to the Law on Radio and Television, without any further regulation during the 1990s. They were licensed by the NRA in 2003; currently both CATV companies have developed to become nation-wide providers of classic CATV services (digital since 2003). They could become strong competitors in the broadband market if the Cable-TV operators used more aggressive marketing of Internet services and could change the traditional Latvian perception of them solely as TV providers: currently less than 10% of CATV consumers are also using CATV-based Internet access services.
Furthermore, more than fifty firms are operating as city or local providers of CATV services, but their share in the telecom markets (both TV and broadband) remains quite marginal.
Lattelecom started to provide digital TV (Internet TV and interactive TV) in 2007. Currently more than 100 interactive TV programmes are offered, as well as virtual video rentals, time-shift service, choice of language and other services.
15.1.4 Emergence of the Internet: narrowband development
The academic community anticipated the necessity and advantages of information networks earlier and better than other specialists. As a result, the Latvian Academic Network was created; it started operations in 1992, when a 2.4 kbit/s connection to Tallinn (and further to NORDUNET) was constructed utilizing Lattelekom’s network which reached 19.2 kbit/s from 1993 on. External access for academic, governmental and commercial institutions was organized immediately supporting e-mail, FTP, Gopher, Listserv, WWW, etc. services; the Latvian Academic Library was the first organization to be connected by means of a leased line in early 1993.
IP networking was spread to other centres in Latvia; some thirty-five Internet service providers (ISPs) operated in 1999 using Lattelekom’s network according to special agreements on delegation of exclusivity rights to ISPs. Major providers were linked by fibre with the national Internet exchange centre GIX in Riga already before 2000. Handling international traffic was the main goal of the primary development of the Internet services. Due to its rapid growth a direct connection to Stockholm was created (at 128 kbit/s from 1995, 256 kbit/s from 1996). The gradual increase of total capacity of international connections to 60 Mbit/s in 2000 shows the unabated growth of the Internet traffic.
The major technologies applied initially for Internet access were 56 kbit/s dial-up and ISDN connections. Point-to-point radio-links (up to 11 Mbit/s) were popular Internet access channels when wired connections were not economically rational. Cable modems (64–256 kbit/s) were also introduced in the late 1990s by the CATV operators. Baltcom TV has developed an optical infrastructure in some districts of Riga, providing Internet services to its customers. It was estimated that the Internet was accessible to approximately ten per cent of the Latvian population by 2001; about one third of all businesses used the Internet.
Although the introduction of Information Society services started in the 1990s (Virtmanis Reference Virtmanis1998), the year 2000 may be considered as the start of e-commerce in Latvia, as the majority of Latvian commercial banks started to introduce Internet banking services then. The creation of public access points to the Internet in less-developed regions according to the Information Society targets started in late 1999. During the year 2000 an Internet connection was provided to every secondary school, and in the following years to local self-governments and public libraries, too. In 2000, ADSL technology (up to 2 Mbit/s) was offered in the market; marking the beginning of broadband development.
In less than a decade, Lattelekom had turned from a simple voice service operator into a provider of modern integrated telecom and information technology services.
15.1.5 Development of wireless communications
Satellite services became the first real international communications technology exploited by business and foreign embassies, the VSAT user-licenses being issued by the Ministry. Paging was also a progressively growing service in Latvia in the early 1990s. By 1994 four paging licenses had been issued, and the user base grew significantly by the end of 1995. Nevertheless, soon both services were overpowered by rapidly growing mobile communications.
Mobile services were introduced as an enhanced alternative to fixed network access. LMT (Latvijas Mobilais Telefons) – a consortium of domestic and foreign players – was the first NMT-450-based operator in Latvia, introduced in 1992. NMT offered coverage of mobile communications to up to 90% of the residents. There were roaming services for NMT customers through eleven NMT networks in ten countries.
The Ministry also issued LMT the first licence for GSM services. By the end of 2001, the LMT’s GSM network covered more than three-quarters of the territory of Latvia, including all major economic and cultural centres, providing coverage to around 90% of the Latvian population. By that time LMT had entered into roaming agreements with more than 150 GSM operators in 83 countries. From 1999 LMT started to operate both GSM-900 and GSM-1800 networks. In addition to voice transmission LMT offered an extensive range of value-added services, including WAP services.
By 1995 Latvia remained the only Baltic state where a mobile monopoly existed. Therefore it became a natural decision to issue two more GSM licences. The company Baltcom GSM (now Tele2) won the international tender in 1997, and the company Bite Latvia won the tender in 2005. Competition in the Latvian mobile market prompted a considerable drop in tariffs; in addition, discounted handsets and mobile prepaid cards made mobile communications affordable for many Latvians.
Low data rate fixed wireless connections (up to 256 kbit/s) for customers in remote, sparsely populated rural areas to the basic network had been created in 2007–2009 using cellular technology – CDMA. This development is considered a very successful public-private partnership project of the Ministry of Transport and AS Telekom Baltija. Unfortunately, the latency in this case (up to 400 ms) is higher than when using a fixed connection.
15.2 Regulatory developments: joining the EU
Latvia – like other new EU member states – was expected to accept the acquis4 before joining the EU. In the case of telecom it was necessary to transpose the EU 1998 regulatory framework into national legislation (Virtmanis, Reference Virtmanis2002).
The liberalization date for the fixed telecom market in Latvia – 1 January 2003 – was set in the Telecommunications Sector Policy document (SM, 1998); the date was approved earlier by WTO agreement (Virtmanis Reference Virtmanis1997b) and through the pre-accession negotiations with the EU. The transition to a liberalized telecom market was envisaged by issuing a new telecom law and by the creation of a strong independent national regulatory authority (NRA) whose role would be market supervision, tariff and interconnection regulation and other functions, which later (in due time) would be replaced by supervision of the competition authority. The Ministry of Transport, besides the responsibility for policy and law-making tasks, would retain the licensing of undertakings and the granting of frequency usage rights, as well as the creation of a ‘universal service’ fund.
To improve the regulatory system, the regulatory model was reviewed in-depth. In 1997–2000 the global experience was analysed and the new multi-sector regulatory concept was elaborated in cooperation with World Bank experts. The concept is based on the idea that in essence the basic processes in all sectors providing services of general economic interest (with the corresponding regulatory activities) are similar. Taking into account these considerations, the multi-sector regulatory model was developed and the relevant NRA – the Public Utilities Commission (PUC) – was established in Latvia in 2001 by the Law on Regulators of Public Utilities (Karnitis, Reference Karnitis and Gilhooly2005; Karnitis & Virtmanis, Reference Karnitis and Virtmanis2011). By establishing a strong multi-sector NRA Latvia tried to avoid both the political influence of the government on regulatory procedures and the pressure of powerful utility companies that would result in regulatory capture.
Only a few arguments in favour of sector-specific regulation were provided, of which twelve-years of experience revealed their weakness.
Problems could arise due to differences in the legal frameworks for the sectors and in the policies of the sector ministries, as well as due to a lack of coordination among the DGs of the European Commission. Our experience shows that it is precisely the unified strategic approach of multi-sector regulation that to a great extent reduces those differences and facilitates the creation of a pan-sector harmonized business environment in the country.
Another set of arguments relates to potential lack of sector-specific competence in the multi-sector regulator that would result in a lower quality of regulation. There is some concern that regulatory failures in one sector could be transferred to other sectors. In reality Latvia’s multi-sector experience shows inter-sector benefits and experience sharing. Harmonization problems of multi-sector regulation are much lower than those with a lot of uncoordinated sectoral regulations: e.g., the weaknesses of the unbundling strategy in the electricity market very much helped to fight against initiatives for a mandatory structural separation of integrated telecom companies.
In addition, some institutional aspects have to be mentioned: in order to better handle sector individualities, several sector departments were created in the organizational structure of the PUC, supported by common economic and legal services. The competence level achieved shows that unified regulation can be more competent and even cheaper than the alternative.
The status of PUC’s institutional independence was defined by the law. The decision-making body of the PUC (the commissioners) has a strong mandate to make principled decisions. The five commissioners of the PUC are nominated by the parliament (Saeima) for five years; nobody (including the Saeima) can dismiss them prematurely. Although formally the PUC was operating under the supervision of the Ministry of Economy, the supervisor’s power to affect PUC’s decisions and activities was limited to the formal one mentioned in the law. The PUC’s decisions become valid without requiring any approval from a minister or anyone else. At the same time, any decision of the PUC can be appealed in court within a defined time period.
This new approach of independence in the creation of the NRA was also the basis for regulation of the telecom sector in the new law ‘On Telecommunications’. Unfortunately, the adoption of this new law was postponed several times; it became valid only in late 2001. The reason was a request for arbitration against the government of Latvia submitted by TILTS in the international court in 2000 on the timing of Lattelekom’s privatization, investments being compromised and dividend distribution (Dombrovskis et al. Reference Dombrovskis, Feijoo, Karnitis and Ramos2004). The case was resolved only in 2004, when the disputing parties came to an agreement.
The new law redistributed the regulatory functions between the Ministry of Transport and the PUC. The ministry was entrusted to elaborate policies for the development of the sector and to set out principles for the financing of universal telecom service; it was obliged to monitor radio frequencies and to elaborate new laws and regulations of the Cabinet of Ministers for the sector. The PUC was to be engaged in all practical aspects of regulation of the sector. The new law contained the basic principles for regulation of the telecom sector – competition where possible and regulation wherever and as much as necessary – that have been included in EU directives over the previous decade:
establishment of a telecom licensing regime for the liberalized market;
frequency and numbering planning to develop and optimize numbering resources as well as to manage frequencies that are available for telecom operations;
elaboration of a proper methodology for setting telecom tariffs;
establishment of a sector-wide interconnection regime;
ensuring universal telecom service;
quality-control functions, including the handling of complaints about poor quality of telecom services;
avoiding potential conflicts of interests between licensed utility companies (especially publicly owned) and the government;
representation in international telecom regulation organizations and working groups.
It was over a ten-year period that the older member states implemented the telecom market liberalization principles step-by-step; see Figure 15.2 for a timeline of events. This absolutely necessary, gradual market development (segment by segment) period was dramatically reduced in Latvia. The European Commission noted in 2002 that Latvia ‘had made good progress’ in aligning with the acquis in the area of telecom; nevertheless this did not mean full preparedness. Only a two-year transition period for the preparation of the secondary legislation was provided for the PUC by the law, while the density of secondary legislation in Latvia’s normative system is high; nevertheless the market was liberalized on 1 January 2003, even without having a full legal environment in place.

Figure 15.2 Development of the regulatory framework in the EU and in Latvia
Moreover, a reconsideration of the EU legislation was already under way: in 2002, the New Regulatory Framework of the EU (NRFW), which was based on competition law principles, was approved. The new member states were required to adapt their internal normative acts by the date of their entry in the EU – 1 May 2004.
In an extremely short period, significant efforts had been applied to open the market and to introduce as many rules as possible to favour competition. To transpose the NRFW’s rules of the game, the PUC drafted around thirty secondary regulatory acts by the end of 2004. Of course this resulted in a high regulatory burden with a long list of related problems.
The EU 2002 regulatory framework was legally implemented in Latvia only sixteen months after market liberalization (SM, 2004). Due to the lack of time for the development of competition, the market was not fully prepared for this new framework which introduced more general rules on competition; the movement from a monopoly to true (not merely nominal) competition in any country requires more support than the simple establishment of a favourable legal framework. The market must inevitably go through a series of stages (allowing time for participants to develop business models according to the changing normative and regulatory environment) in which flexibility in implementation of the EU rules should increase, allowing for tactical diversity in the implementation of the EU regulations and directives according to particularities in the member state5; in our case the presence of a competent and strong NRA (see, e.g., Karnitis, Virtmanis Reference Karnitis and Virtmanis2011) and its active role stood out as a key factor.
In hindsight, the implementation of the 2002 package of regulatory directives in Latvian legislation by 1 May 2004 has to be appraised as a premature action, as it resulted in nine infringement procedures opened by the EC against Latvia in the period 2005–2011 over incorrect implementation of the framework; three of them concerned the PUC competence.
The revised EU telecom reform package adopted in 2009 was intended to ensure more effective competition and better rights for consumers. The revised framework was only partly transposed in Latvia by the deadline that was set in the directives (25 May 2011); therefore Latvia was one of the member states against which the EC opened an infringement procedure (in July 2011). The transposition measures (regulations by the Cabinet of Ministers and the PUC) were adopted in the following months and the EC notified, after which the various infringement proceedings against Latvia were closed in October 2011.
The amendments of 2011 to the ‘Law on Regulators of Public Utilities’ reinforced the independence of the PUC; particularly in budgetary matters and by eliminating the supervision of the Ministry of Economy. Due to demands of the 3rd Energy Regulatory Package, the telecom sector also obtained the advantages of a fully independent regulator: 11 August 2011 was the PUC’s first Full Independence Day.
Twelve years of experience have shown the advantages of harmonized regulation for both service providers and consumers. With a number of sector-specific regulatory bodies, it would have been impossible to manage all the processes and to perform all activities, to achieve the current level of efficiency of regulation, as well as the current level of authority and competence (technological, economic, legal), nor the level of independence. The multi-sector model can be appraised as the most advanced and efficient one, especially for small and medium-sized countries (i.e., for the majority of EU member states). Also, recent global and European trends show a movement towards the harmonized multi-sector regulatory model.
15.3 Fixed broadband
15.3.1 Development of fixed broadband
A number of academic activities (e.g., the academic network LATNET since 1992) and corporative activities (e.g., a country-wide data network for the Latvian postal company since 1995), together with the governmental approval of political initiatives (the National Informatics programme in 1999, the socio-economic e-Latvia programme in 2002) which led to budget co-financing of the ICT projects and development of ICT based applications (e.g., in education, banking, health care, library and many other sectors) were raising the overall demand for advanced data services.
In 1998 Lattelekom started to offer ISDN and LAN-to-LAN services to the business sector, which represented the first fixed broadband (FB) solutions. Co-operation agreements on Frame Relay service provision were concluded with the foreign partners in 2000. Internet access based on ADSL technology (up to 2 Mbit/s) was introduced by Lattelekom in spring 2000. Several new services were introduced subsequently – ‘Ultra DSL’ (up to 2 Mbit/s), ‘Fast Data Net’ (up to 1 Gbit/s, using Gigabit Ethernet technology), ‘E-Call’ (a service for owners of Internet home page) and the ‘Unified Data Business Network’ (a virtual private data transmission network service providing customers’ transmissions at the IP level) together with service level agreements (SLAs).
In 2000 the overall demand for digital leased lines in the country grew by 44% and the number of dial-up users by 108%; the amount of time that dial-up customers spent on the Internet increased by 128%. However, very high Internet access costs (the highest in peak time and the second highest in off-peak time among the EU candidate countries) were a significant barrier to further growth.
Lattelekiom introduced ADSL2 technology in 2005. Since 2007 Lattelecom’s business model includes the active development of FttH (sometimes FttB) connections to all apartment buildings with more than twenty apartments. FttH is applied instead of intermediate VDSL to save on capital expenditures. GPON technology providing up to 1 Gbit/s access is available to 60% of households since October 2013. Lattelecom’s middle-mile fibre network is also used; for the development of FttB + Ethernet connections, mostly by alternative operators. The result is a high penetration of very fast Internet: 50.8% of broadband lines at data rates at or above 30 Mbit/s and 35.6% above 100 Mbit/s (see also Table 1.3 in Chapter 1 Introduction). Lattelecom is also an active developer of Wi-Fi hotspots, many of them free of charge for everybody.
The development of mobile broadband (MB) has an impact on the development of fixed broadband (FB) (see Figure 15.3). The much higher penetration figures in comparison with PSTN and a high quality of basic voice (e.g., average unsuccessful call ratio 1.0–1.2%, call set-up time 6–7 sec) provided a good starting position for the introduction of mobile data transmission services in general and for 3G development in particular. The capacity of 3G for everyday use (e.g., 4–6 Mbit/s on the downlink) is good enough for many consumers, while the price is more affordable (see also Section 15.7.2) which is an important, if not the most critical, issue.

Figure 15.3 Uptake of fixed and mobile broadband, Latvia, 2004–2013
15.3.2 Infrastructure competition vs unbundling in the fixed broadband market
The opening of the market led to a significant increase in the number of service providers: around 200 providers were licensed by the PUC by the end of 2003, the majority of them for provision of Internet services. As of January 2013 a total of 415 firms were recorded in the PUC register as providers of telecom services; approximately 80% of them are active in the market; more than 240 firms provide broadband services. Hence, it is no surprise that mergers and acquisitions of telecom companies are ongoing; for instance, Baltcom TV acquired six smaller companies and its main competitor IZZI during 2013. More competent and more competitive providers with growing network capacity should be considered a positive factor for the market and for customers.
Infrastructure competition among 240 FB operators is typical of the Latvian market today. Local providers are competing with the main actors, as well as amongst themselves, mostly in limited areas, even within one apartment block. A number of technological platforms are used: see Table 15.2. The wide use of Ethernet technologies by small companies for last-mile broadband provision in apartment buildings remains habitual for Latvia even today. The broad introduction of NGA is expected to change the market situation, as providers will need to adapt their business models.
Table 15.2 Fixed broadband market shares by technology, Latvia, January 2013.

However, the introduction of bitstream access and unbundled local loop (ULL), as part of the market liberalization in 2003 did not raise the interest of potential access seekers, notwithstanding a price of around EUR 8.40 for full unbundling in 2005. The main reason was the ambition of Lattelekom to stay an exclusive provider. It was unwilling to accommodate retail competitors at the wholesale level, trying to avoid the development of VoIP service using various tactics. Other reasons include the lack of legal requirements for the construction of communications networks, the sparsely populated countryside and the comparatively low quality of the legacy copper network. Market entrants preferred to use fixed wireless access based on the license-exempt use of the 2.4 GHz (later 5 GHz) spectrum (RLAN technology). Because competitive infrastructure was already developed (although not very solid in many cases), this approach continued even after 2007, when the PUC applied wholesale access obligations to Lattelecom, having concluded it had SMP in the first round of market analysis.
Infrastructure sharing among operators to reduce expenditures instead of infrastructure competition will have to be an important principle for realistic and profitable NGN developments in the coming years because of the weak purchasing power of consumers, hence a low average revenue per user (ARPU), as well as the EU’s increasing demands to facilitate access to NGNs.
Lattelecom’s share in the provision of DSL and FttH services is close to 100%, but the competing infrastructures using other technologies – Ethernet in the building connected to fibre (mostly that of Lattelecom) – captured more than half of the total broadband access market within a few years. Ethernet networking in apartment buildings and CATV network access (using the DOCSIS-3 standard) became widely used alternative fixed infrastructures as the demand for Internet services grew. The compound annual growth rate (CAGR) of the broadband market over the period 2008–2013 was 20.8%; see Figure 15.4 for the development and distribution of the technologies used in the period 2005–2013.

Figure 15.4 Fixed broadband market development by technology, Latvia, 2005–2013
An interesting feature is the increasing FB market share (as well TV market share) of the incumbent Lattelecom since 2007 (see Figure 15.5) – i.e., since the implementation of its fibre-related strategy. As a result of these developments the concentration of the telecom market remained quite high: the Herfindahl-Hirschman Index (HHI) for the fixed voice market was 8067 in 2012, and for the mobile voice market 3607; only the Internet market is moderately concentrated with an HHI of 2111.

Figure 15.5 Fixed broadband market shares by type of operator, Latvia, 2004–2012
15.4 Mobile broadband
15.4.1 Mobile services
On the one hand, the mobile market development in Latvia is analogous to global and European trends (Cernakovs-Neimarks et al., Reference Cernakovs-Neimarks, Karnitis, Rutka and Virtmanis2013). Four sequential generations of technology since 1992 have resulted in an evolution from a circuit-switched, low-quality analogue voice network to digital packet-switched broadband networks that ensure secure voice, messaging and data communication services. Following the global pioneers, LMT launched commercial LTE pilot projects in several major urban areas (Riga, Liepaja, Jurmala) using the 1800 MHz band in May 2011. Meanwhile, LTE/4G service provision had expanded to more than thirty-five cities by 2013.
More and more people are using mobile services. The CAGR of mobile subscriptions in the last decade was close to 14%, leading to an official penetration rate of 190% in 2012, which was the highest in the EU27 (see Table 15.3) and double the global level of 91%. However, growth by more than 20% was not a realistic figure in 2012, as recalculation of population by the Population Census has a direct impact of more than 10% on penetration. In addition, crisis-related emigrants and tourists do not close their prepaid SIM cards, which means more than 20% of additional subscribers are fictitious. Therefore, the actual mobile penetration level would be around 160–165%.

MB penetration in Latvia is lagging slightly behind the EU27 average. Nonetheless, mobile data traffic grows sharply; e.g., Tele2 stated that its total mobile data traffic exceeded mobile voice traffic for the first time in 2012.
At the same time the average revenue per user (ARPU) of mobile operators as well as their total revenues have declined since 2008. One of the reasons is the strong regulatory measures initiated by the EC: i.e., the gradual decrease of roaming and interconnection tariffs. It represents a serious risk factor for the development and sustainability of mobile services in the future: it may result in scant investments in network infrastructure and a possible decrease of quality of communications and services.
On the other hand, there is a principal difference from Western European countries, where mobile services entered the market of voice services at a comparatively high fixed line penetration. In Latvia, as in other post-USSR countries and most Central and Eastern European countries, mobile services became available for users when the fixed telecom network was still underdeveloped. This was a significant accelerating and driving force for the development of mobile services during the 1990s; the connection of new consumers, who preferred mobile, was the basis for the rapid growth of mobile subscriptions.
One of the cellular operators, Telekom Baltija, has developed a country-wide MB network by exploiting CDMA2000 technology in the 450 MHz band; the quality of voice and data services using a lightly-loaded CDMA network is in between the average indicators of low data rate (GPRS, EDGE, UMTS) and high data rate (HSPA technologies) provisions of GSM-based operators (see also Section 15.7.3.). The CDMA service was the first form of MB Internet access in Latvia. Currently it is a complicated task for the company to compete with the strong GSM operators; there is a very limited CDMA handset range and the interconnection with GSM subscribers is expensive. As a result there are only few CDMA consumers remaining and their share in the mobile market is marginal.
It is difficult to predict the future of CDMA services. Currently there are no signs of growth. A migration to LTE is unlikely. The company has invested to modernize the infrastructure in 2013, to upgrade all base stations towards using the advanced CDMA technology EV-DO Rev. B2. It is projected to achieve peak download data rates of up to 24.5 Mbit/s and peak upload rates up to 9 Mbit/s.
15.4.2 Drivers and risks
Generally accepted key factors influencing the development of mobile communications (e.g., increasing data rates, supply of advanced mobile devices, more and richer offer of media content and applications) are, of course, valid in Latvia, too. Nevertheless, a number of specific aspects apply.
The most critical driver from the demand side is a sharp increase in uptake and usage of mobile equipment – smartphones, media tablets, dongles (PCs, laptops, notebooks), and M2M devices. These advanced consumer devices are becoming available at affordable prices. In a pool of respondents, smartphones were used by 44% in Q3 2013; among the younger generation (15–29 years) smartphones are even more popular with 65% of respondents. Samsung and Nokia handsets are the most popular in Latvia. The number of mobile-connected laptops and tablets in the LMT network, for instance, grew by 78% in 2012 and the amount of transferred data by 152%. M2M constituted 1.4% of all active mobile subscriptions in Latvia in 2011; LMT has noticed more than 50% growth in M2M applications for its business customers in 2011.
Leading Latvia’s MB market for the foreseeable future will be the 3G and also 4G technologies. Strong market consolidation and/or arrival of new competitive local mobile players is neither observed nor expected. The impact of alternative mobile technologies (e.g., CDMA, WiMAX, satellite-based) is low. At the same time, social networking applications and the entry of global over-the-top content providers (OTTs) are changing the whole value chain and will have a significant impact on the MB market.
The impact of mobile communications at a macroeconomic level is a source of direct motivation for the national and local governments to be interested in mobile roll-out (see, e.g., Van Ooterghem et al., Reference Van Ooterghem, Lannoo, Casier, Verbrugge, Tanghe, Joseph, Martens, Colle, Pickavet, Moerman and Demeester2009). The annual contribution of MB to the growth of GDP of Latvia was evaluated from the very beginning as being considerable at 0.29%: e.g., through business mobility, remote monitoring of processes, increased productivity due to time savings when information is searched or any Internet application is used (Gruber & Koutroumpis, Reference Gruber and Koutroumpis2011). Another conclusion is that municipalities are interested in supporting the deployment of MB suitable for the implementation of their public functions – smart transport management, utilities services, public safety, etc.
The ongoing parallel development of fixed fibre expansion has to be mentioned as a potential source of serious impact on the roll-out of mobile networks (Schejter et al., Reference Schejter, Serenko, Turel and Zahaf2010; Thompson and Garbacz, Reference Thompson and Garbacz2011); this will be the case in Latvia, too. The EU broadband policy drives investments in optical access networks (FttH and FttB) and, in addition, requires the availability of unbundled metallic access lines. This takes place alongside the EU radio spectrum policy which supports high data rate MB through the roll-out of LTE. The continuing implementation of nationwide middle-mile optical network projects may cause different scenarios to unfold (from successful cooperation to strong competition in the use of fibre-to-the-base station); growing FB supply will affect mobile service demand and possible future investments in MB networks. At the same time, fixed network developments are not expected to become a real threat to the sustainability of Latvia’s mobile market.
15.4.3 Radio spectrum policy and usage
An increase of demand is closely related to the qualitative improvement of the access to the network in terms of services and the quality of these services (EC, 2011). The trend of development of mobile networks in Latvia is a bright illustration: two decades of dynamic growth reflect two decades of new services being introduced, which in turn became possible after assigning new spectrum licences (see Figure 15.6). The availability of spectrum is the essential factor for development of all wireless broadband services; any delay in awarding licenses hinders the broadband roll-out.

Figure 15.6 Development of mobile market: spectrum licences issued and services provided, Latvia, 1992–2012
The radio frequency assignment process in Latvia is realized according to the EU telecommunications policy (BEREC 2012) and in compliance with the National Development Plan. In this regard the PUC has created a favourable climate for development of broadband services – that is, the PUC has assigned all attractive spectrum allocated for wireless broadband networks in the EU (see also Table 15.4).
Table 15.4 Frequency bands assigned for wireless broadband services, Latvia, October 2013

The last of the popular bands – the 800 MHz ‘digital dividend’ – was auctioned in October 2013; with a slight delay for a reason common to all countries bordering Russia and Belarus – the intended use of this band (preferred in sparsely populated rural areas) conflicts (especially in a 10–15 km border zone) with the use of these frequencies for radio navigation services (RNS) in Russia and Belarus until July 2015. It is hoped the migration of the RNS systems out of this part of the spectrum will happen, as according to an Analysys Mason study its use for mobile will provide an estimated benefit of EUR 19 billion for the Russian economy over the period 2015–2030.
Network development strategies and improvement of communications capacity are now the key challenges for operators to create a growth driver from the supply side.
Basic GSM and UMTS mobile communications frequency bands have been awarded to mobile operators in quite equal portions6. Moreover, single portions of bands are allocated, which is a significant precondition for the development of an optimum broadband network topology with increasing network efficiency and provision of broadband services. Smart network strategy and the upgrade of infrastructure are the basic tools to achieve efficient use of the allocated bands.
So far, consumers’ uptake of the pilot LTE services (1800 MHz band) is quite low. Nevertheless, the current dynamics and the projections indicate that in 3–5 years the currently assigned spectrum bands will not be able to satisfy the growing MB traffic demand. This means that operators have to start network planning and make provisions for investments in infrastructure now; the PUC is convinced that having awarded spectrum licences is a prerequisite for the inception of these activities.
To achieve a return on their investments in LTE, spectrum licences operators are in the first place interested in covering areas with high potential traffic: i.e., with a large number of concentrated and solvent consumers. This is facilitated by the generally high urbanization level in Latvia, which is near the EU27 average, while gross income of urban households exceeds that of rural residents by 10–35%.
The majority of solvent consumers are concentrated in the seventeen major and medium-sized cities, with more than 10,000 residents and a population density higher than 1,000/km2 (in total 56% of the population). These cities become the priority for LTE network deployment. Therefore it made sense to auction the 2.6 GHz band, a typically urban spectrum, first; this was done in the very beginning of 2012 (Karnitis et al., Reference Karnitis, Virtmanis, Rutka and Jelinskis2012). The auction was based on the following principles:
to attract all three existing GSM/UMTS operators in order to ensure sustainability of mobile services provision;
to provide three equal basic lots (defined frequency blocks) to guarantee an environment for fair competition in the future;
to ensure space for additional bidders as local (niche) operators.
Three 20 MHz paired FDD blocks formed the auction kernel; in addition one 2x10 MHz FDD licence was successfully auctioned. The auction (based on the simultaneous multi-round auction format) included the requirement for operators to cover 55% of the population by 2018 (equivalent to covering the 17 cities mentioned above). The spectrum became available from 2014, because of its previous use for TV provision by Baltcom TV (using MMDS technology)7.
In analysing the fiscal proceeds from the European 2.6 GHz auctions, we found a quite strong correlation between the ARPU and the number of MB subscriptions in the country (rather than the habitual number of population) on the one hand and, on the other, the amount that the bidders have invested in obtaining the licenses for the spectrum blocks (see Figure 15.7). Radio spectrum auction fees in Latvia reflect the current mobile market situation. The significant investment by Latvia’s operators in spectrum licences is connected with serious competition among the bidders (as is the case in Sweden and Belgium).

Figure 15.7 Investments in 2.6 GHz spectrum licences in relation to anticipated revenues, Europe
15.5 Realizing the Digital Agenda targets
Despite the dynamics and prospects of mobile communications with LTE being launched, FB access is the key for the achievement of the Digital Agenda broadband policy targets – ‘download rates of 30 Mbit/s for all citizens and at least 50% of European households subscribing to Internet connections above 100 Mbit/s by 2020’. Due to active deployment of fibre connections8, Latvia is well ahead of the EU27 average and well on the way to the general availability target for very fast FB; Latvia occupies second place in the EU for share of FB subscriptions above 100 Mbit/s and fourth place for share of subscriptions above 30 Mbit/s in 2012. Table 15.5 shows the basic FB market indicators for Latvia and the EU27.
Table 15.5. Digital Agenda indicators of the fixed broadband market, Latvia and EU27, 2012

Coverage of the population (territory) continues to lag behind the EU27 average level; its increase is slow – the CAGR over the period 2005–2010 was only 0.8%. The major reason for the backwardness in FB is the low coverage of rural areas (39.8% of rural households by standard FB and 24.4% by NGA FB). The low general population density in Latvia combined with a quite high urbanization level (68%, near the EU27 average) results in the population density in rural regions being much lower. The FB services are primarily viable in economically active and densely populated urban and suburban areas and therefore mostly supplied in these areas.
The detailed analysis of the situation showed that there is sufficient capacity in the optical trunk networks. The primary bottleneck is a lack of middle-mile networks in the rural areas for the provision of high speed broadband access, especially at data rates above 30 Mbit/s (SM, 2012). The fixed CDMA access mentioned above and some other low speed FB connections are currently the only real possibilities for the rural population. This is reflected by the Internet statistics on broadband uptake in the regions (Table 15.6). In addition, in these areas the access costs are high in comparison with the purchasing capacity of the population, becoming unaffordable for the majority of customers; these prices are a serious barrier to the use of the Internet.
Table 15.6 Fixed broadband (>256 kbit/s) uptake in planning regions as percentage of households, Latvia, 2011

In these areas, high data rate FB service provision will not be realized in the foreseeable future without public support (EU funds and/or public investments). Focused public intervention without giving any competitive advantage to any provider (see more detail in Section 15.9) is a realistic tool to reduce the existing regional gap. In reality, it means the development of a form of ‘universal service’.
Although broadband demand is more dynamic than supply, currently only around 30% of people with access to FB services have actually subscribed. (The EU27 average figure is not much better.) There is, of course, the impact of the economic crisis: where Latvia lagged behind the EU27 in FB penetration by 1.5 years in the period 2004–2007; the gap had become 4 years in 2011; fortunately, the after-crisis recovery has started. There are two other reasons for the low FB uptake: the inadequate supply of national content, as described in more detail in Section 15.7.1 and the higher prices of FB compared to MB offers, as shown in Section 15.7.2.
FB is and will be the base for achievement of Digital Agenda targets. The high data rate connections (> 30 Mbit/s) will have to be provided by fixed networks, as measurements show that under realistic operational conditions the download data rate of LTE will not reach 30 Mbit/s.
15.6 Quality of broadband services
Consumers’ evaluation of the telecom market, in particular their satisfaction with the services provided, is a principal factor for the development of the demand for services.
The level of satisfaction of Latvian consumers ranks above the EU27 average (EC DG Health and Consumers, 2012); especially as it relates to telephone services (see Table 15.7). The comparatively lower uptake of Internet services is connected with the broadband coverage gap between major cities and rural areas mentioned above. In addition, when evaluating the services provided by mobile operators, only 11% of the users fully agreed that their Internet data rate corresponds to what the operators announced.
Table 15.7 Consumers’ assessment of telecom services, Latvia and EU27, 2012

There are also significant technological peculiarities and differences between metallic and fibre solutions on the one hand and wireless broadband access to the Internet on the other hand. It is an extremely hard task for mobile access providers to compete with the quality provided by FB networks. Currently service providers do not explain the advantages and disadvantages of wire and wireless technologies to consumers; this will have to be done in the near future to avoid further confusion and increasing dissatisfaction. A critical mass of uneducated and unhappy customers could become a significant risk factor for mobile market development. Understanding how low the satisfaction of consumers is with mobile and Internet services in many EU countries provides a substantive indicator of the underlying problems.
15.6.1 Regulatory activities
There are several regular activities of the PUC directed towards control and improvement of the quality of telecom services – setting quality requirements for the ‘universal service’ provider, mandatory quality declarations for other providers and annual quality assessment reports. The PUC draws the attention of service providers to customer-oriented quality criteria. According to the ‘General Authorisation Rules’ issued by the PUC, from 2008 there has been a mandatory requirement to set the guaranteed Internet download and upload data rates in the customer’s service contracts. From 2012 on, these guaranteed data rates cannot be less than 20% of the promised peak connection rates. A guaranteed minimum download rate of 144 kbit/s is also set for MB connections.
The PUC conducts regular quality control of the telecom services. An innovative system for measurement of quality was developed and introduced by specialists of the PUC to obtain objective, credible information on quality and to be able to inform providers and end-users accordingly. Since 2007 the testing of voice telephony quality parameters is performed by an automatic system, which includes fixed and mobile phone terminals serving as call simulators. The widely accepted PESQ9 algorithm for end-to-end connections is used to perform objective data measurements on voice telephony. The speech quality in mobile networks can also be verified during drive tests.
The Internet control system, called ITEST, has been used since 2007. This Internet access testing device also was provided to the service providers, permitting them to check the actual parameters of their customers’ Internet connections. As of 2009 public access makes it possible for any consumer to test his or her Internet connection. The ITEST carries out measurements of quality (download and upload data rates, packet loss, jitter and latency) of data transmission between two points – the quality control server is connected directly to the national GIX and the consumer’s terminal.
This system has become quite widely used: more than 3% of consumers tested their connections in 2012; operators tested more than 2% of their connections. Purposeful measurements have demonstrated their efficiency and have a positive impact, including increasing the discipline of operators. The quality control is continued and expanded for early detection of quality risks and for the promotion of sustainability of broadband services: e.g., 24-hour testing of MB access was started in 2012. Further improvement of the ITEST will include the possibility of measurement for smartphone users.
15.6.2 Quality of fixed services
The PUC’s measurements show the splendid quality of emerging FB fibre networks; very high Internet data rates have been achieved with excellent latency (<10 ms) and jitter (<3 ms) levels.
The penetration of high data rate broadband lines is increasing more rapidly than the general broadband penetration rate; the number of existing subscribers who migrated to high-speed connections in 2011 was more than quadruple the number of new customers. For instance, Lattelecom regularly increases the data rate of the various connections for the same price: e.g., 50 Mbit/s instead of 20 Mbit/s was implemented in 2012.
International fixed broadband quality studies regularly rank Latvia among the global leaders (Oxford University, 2009; Akamai, 2012; Pando Networks, 2012: see also Table 15.8) Already in 2009, Oxford University researchers classified Latvia as a country ‘already prepared for the Internet applications of tomorrow’: e.g., for Internet TV and high-quality video communications. At the same time, the researchers identified the basic fixed Internet problem for Latvia: the third biggest quality gap between the major cities and the rest of the country. The middle-mile project mentioned in Section 15.8 is directed at closing this gap.

15.6.3 Quality of mobile services
The actual quality of mobile services in comparison with the advertised figures is one of the reasons for dissatisfaction of mobile consumers and is a key challenge for the operators. Only 20.7% of the tests performed by the PUC throughout territory of Latvia in 4Q 2012 (PUC, 2013) showed actual download data rates above 4 Mbit/s (see Figure 15.8). At the same time 55% of tests showed data rates below 2 Mbit/s. Moreover, the indicators for the three mobile operators were very different – 40%, 40% and 86%, respectively.

Figure 15.8 Mobile download data rates, Latvia, 4Q 2012
Operators, of course, pay more attention to the major cities where consumers’ density and traffic is much more profitable. The rapid deployment of HSDPA technology in 2012 significantly improved the situation in the major cities: the measurements showed 91.7% above 2 Mbit/s and 68.6% above 4 Mbit/s (65.2% and 21.7% respectively in 2011). The supply of mobile broadband in medium-sized regional centres is on the level of the country’s average, which is not adequate for these centres, which the National Development Plan for 2014–2020 defines as development centres (PKC, 2012), given their concentrated business entities as well as educational and public institutions. All of the above applies equally to the upload data rates.
The measurements also confirm the efficiency of 4G technology – the download rates ensured by medium loaded cells are reaching 14–18 Mbit/s. Currently there are no indications on the possibility of realizing 100 Mbit/s.
These multi-annual measurements allow the early recognition of potential serious risks related to mobile service quality degradation in the near future.
An issue for the 3G MB supply is the sometimes very high level of latency (up to 500 ms) and especially jitter, which sometimes is up to 200–300 ms, depending on the traffic. The measurements of the CDMA network indicated a much lower jitter than the GSM network – 60 ms on average. This issue does not influence the quality of downloaded content from different sources or surfing on websites. Problems will occur with jitter over 50 ms for applications requiring correct sequencing of packets: e.g., still pictures or unsynchronised picture and sound as for using Skype or as part of IPTV, etc. (ITU 2008). This represents a serious risk, as according to LMT video applications already generate 30% of the total traffic.
The typical ratio between download and upload data rates for MB access is around 2–3 to 1, with a tendency to increase when the download rate is increasing. A characteristic problem is that mobile operators prefer to use the scarce frequency resource to connect as many customers as possible. Providers emphasise the high download data rates without providing for the adequate increase of upload rates; for example, some measurements show 4G upload rates lower than 1 Mbit/s, implying that the ratio in this case is more than 15 to 1. Such situations, with a high level of asymmetry between download and upload rates, become critical above all for content-creative applications: e.g., educational and health care services, social networking and online games.
15.7 Broadband usage
15.7.1 The practice
Latvia has defined the knowledge and wisdom of its inhabitants, and the ability of each individual to make use of them, as the basic resource for growth. The development of an innovative economy is a principal component of such a growth model. This means a radical increase of cooperation and sharing of information is required. These activities are supported by the active use of advanced telecom technologies in business. In this respect there are no notable particularities in broadband usage by enterprises in Latvia as compared to other EU countries (Karnitis Reference Karnitis2008):
a similar proportion of enterprises use FB connections – 85.6% in Latvia, 89.6% in EU27 (2012) and all basic services defined at the EU level for enterprises are available on-line;
similar usage of FB and MB for various business transactions and activities in a networked environment within the enterprise and in co-operation with partners;
large enterprises are the most active users of broadband, while smaller enterprises use it less and most micro enterprises are just beginning.
The residential segment is much more nuanced, although the indications of Internet usage and non-usage in Latvia are very similar to the EU27 average. All basic broadband e-services have been well developed in Latvia – e-governance, e-healthcare, e-commerce, e-education, etc. Of the basic public services defined for citizens, 90% are available. In addition, specialized mobile applications are also used, some of them developed by Latvian specialists for general usage (e.g., m-parking) or corporative use (e.g., for banks, exchanges); several ideas are extremely innovative: for example, a patent was granted to a resident of Latvia in 2010 on a coffin equipped with mobile phone.
However, the usage patterns of individual Latvians are rather different from the EU27 average (see Figure 15.9). Latvian Internet users are recognized as very qualified ones: more than 60% of them have high-or medium-level skills, putting Latvia in second position in the EU27 in 2011. Evidently, services of general interest are therefore very popular. Social networking has become an attractive online activity. Latvians are among the most active participants in social networking in the EU: 90% of smartphones are regularly connected to one of the social networks. A Latvian phenomenon that should be mentioned is that the most-used social networking application on mobile phones is for the locally developed site draugiem.lv (57% of polled users) with Facebook in second (51%) and Twitter in third (25%) place. People over 50 years of age typically communicate in one social network only, while the younger generation is active in several of them.

Figure 15.9 Usage of broadband services, % of individuals (age 16–74), Latvia and EU27, 2012 or last available
Other popular online activities are reading news, job seeking, etc. The use of more specific services such as e-government and e-health services is on the EU27 average level.
However, the population of Latvia is much more cautious in use of the Internet for any purpose related to e-commerce and online payments (except e-banking). Some 67% of the polled users reported they are afraid of a possible leak of information and are concerned about the security of transactions. Obviously, there is an impact of the still-fresh memory of widespread dishonesty and fraudulent e-commerce transactions in the 1990s (non-delivery of goods, defective goods, etc.).
Internet usage is strongly affected by the availability of local content in the national language. The lack of national content – such as e-books (including classics), e-periodicals, e-textbooks, digitized cultural heritage collections, and advanced applications (e.g., e-signature, e-voting, civil construction procedure, registration of cars) which are in high demand by the majority of users is a serious barrier to the further development of both FB and MB. The CAGR of Internet hosts in Latvia was 38% over the last four years; nevertheless, the number of local hosts (representing the availability of local content) remains quite low, with only 165 hosts per 1000 population in 2012 (compared to more than 300 hosts/1000 for the EU27).
Evaluation of content usage shows that current broadband networks are ready for much higher data flows. As the market for national content is small, public subsidies are necessary for the development of content in the national language.
When looking at the usage of MB, it is critical to evaluate the actual use of advanced MB applications and services. LMT reported that the number who used mobile Internet with smartphones grew by 55% in 2012, while the amount of data sent and received quadrupled. The amount of mobile data on the Tele2 network doubled every 8–12 months in recent years. In 2012, 72% of smartphones in Latvia were connected to the mobile Internet at least once a week. Smartphones, MP3 players and game consoles are popular in the group aged 15–24 and desktop computers and e-books with those aged 35–44 while low-end phones are most used by those aged 45–54 years.
Nonetheless, a lot of subscribers do not use the capacity of the devices in full. The younger generation is the most active user of new opportunities; for example, in the group aged up to 39 years, advanced applications are used by no less than 40% of the polled smartphone users; the number falls by more than half in older age groups. E-mail (40%) and Internet browsing (32%) remain the most popular activities among mobile Internet users. Around 30% of the smartphone users exploit only the basic functions such as voice calls, SMSs, address book and camera; the significance of these services remains high. Operators noted that the introduction of bundled mobile tariffs, which contain unlimited voice and messaging services, substantially increased the number of messages sent per subscriber: by 56% in the LMT network and by 23% in the Bite network in 2012.
Around two-thirds of users of mobile applications are exploring only the free applications and have never purchased one. The use of applications subject to a fee by one-third of mobile users is highly dependent on their income level: 15% of users in the income group up to EUR 200/month in comparison with 47% in the income group of EUR 600–850/month.
Regarding the prospect of network usage, several socio-economic factors constrain the demand for advanced mobile applications. Global and European economic prognoses are not optimistic yet, which is an alarming signal for Latvia’s very small (GDP was only 0.17% of EU27 GDP in 2012) and very open economy (total export and import of goods and services was 126% of GDP). The purchasing capacity of users is an important factor, which of course influences the customers’ willingness to pay for services and applications. The impact of the economic crisis on the purchasing capacity of the population has been very strong, reducing it by 20–40%.
Demographic processes also have a strong impact. The level of emigration during recent years due to the economic crisis is a noteworthy characteristic of the Baltic states and especially of Latvia, which also has a low birth rate and an ageing population. According to official statistics Latvia has lost close to 12% of its population since 2005. Even more significant is the reduction in persons below or at the active working age – those being the most active users of advanced telecom services and applications.
15.7.2 Investments
There is a close relation between developments in the telecom sector and general economic development: economic growth means increasing investments in telecom services, which in turn strongly supports the rapid development of all economic sectors, an increase of productivity of businesses and capacity of administration, and gains in the strength and scope of competitiveness of enterprises and of the country as a whole. The telecom sector serves as a catalyst for economic and social activities (Dombrovskis et al. Reference Dombrovskis, Feijoo, Karnitis and Ramos2004). Both technological and financial accessibility of high-quality telecom services are also important for the quality of life – for health, even for life itself, as well as to eliminate social exclusion, which results in an increase of wellbeing (Karnitis Reference Karnitis and Mackie2006). In this sense there are specific national interests in the development of the sector (see also Lam & Shiu Reference Lam and Shiu2010).
The fundamental reorganization of the telecom sector after the restoration of independence, the full liberalization of the market and the change of several technological generations provided the potential to improve telecom services radically and to become an integrated part of the international telecom system. Huge investments were necessary to perform all the activities. Latvia’s providers of telecom services are among the most active investors in the EU until today, with 15.8% of turnover (2.87% of GDP) against 12.8% for the EU27 (2.56% of GDP) in 2011 (DA, 2013). In 2010 53.5% of total investments were devoted to fixed networks, 32.5% to mobile networks.
15.7.3 Tariffs
The level of revenues of the sector are determined by the tariffs. In Latvia the tariffs for fixed and mobile broadband services are in general approximately half of those in Western Europe for services of the same quality (see Table 15.9).
Table 15.9 Tariffs for broadband services, Latvia, 2013

The usage of fixed, bundled offers (two or three services) stands at 30% of inhabitants in Q3 2012 and was slightly above the average in the EU27 with 28%. Prepaid mobile, with 50% of subscriptions, is also close to the average level in the EU27 of 48%.
Pilot tariffs for 4G connection are very high at present: TeliaSonera’s partly owned operator LMT charges a flat rate that is 4.6 times higher than Telia/Sonera’s tariff in Sweden. Such price levels are unaffordable for the majority of customers and will be a strong barrier for further development of 4G services.
Consumers looking for more appropriate services and tariffs can migrate to another provider using the number portability service. Porting subscriber numbers has become increasingly popular: during the last four years the CAGR of ported consumers was 41% for fixed and 35% for mobile services.
Real household spending for telecom services is not very high today. Nevertheless, the payments for services remain a significant share of consumers’ budgets. The statistics show that low-income households (first and second quintiles) are limiting their use of services; in addition they are spending a larger share of their comparatively lower budgets (see Table 15.10). The average spending per capita for all telecom services combined (fixed, mobile, voice, data, TV, etc.) was EUR 13.00/month in 2012. This shows that only the mobile subscriptions with medium data rates and medium traffic are fully affordable for the majority of the population.
Table 15.10 Usage of telecom services and payments by income quintile, Latvia, 2012

The attractiveness of, and therefore consumers’ willingness to pay for, new advanced telecom services and applications is higher than the general decrease of tariffs. As a result, consumers’ payments for services have increased by 33% since 2003. Combined with an increase in personal income by 97%, the share of payments for telecom services in consumers’ budgets has decreased from 6.84% to 4.61%.
Nonetheless, revenues in the telecom sector have decreased year over year since 2008; by 2011 revenues had dropped by more than 20% in comparison with 2008. Nearly all of the reduction relates to the voice market. As a result of low tariffs, Latvia has the lowest mobile ARPU in the EU and had the third-lowest mobile average revenue per minute (ARPM), in 2011.
Global and local socio-economic factors have a major impact on the demand-side, on the purchases of advanced applications. Although the general development trend will continue, lower-income consumers will economize on applications subject to fees and on films, video and music online; they will not require superfast FB nor 4G subscriptions.
At the same time, next-generation networks (NGNs) and the transition to 4G require huge investments. For instance a 100% deployment of the 4G network will require investments of nearly twice the turnover of a typical mobile provider in 2012. It is difficult to see how ARPUs which are less than EUR 100 per year can provide for sustainable development. How sustainable is the current investment rate? A slowing down in the growth of personal income and a lower willingness to spend more for telecom services represent a serious risk factor. The design and introduction of sustainable business models will be the big challenge for the mobile operators.
15.8 Reflections on the future
Projections of telecom market development have not always been fulfilled. For instance, as part of the sector policy the government forecasted a fixed penetration level of 65% and mobile penetration of 75% in 2008 (SM, 2005). In fact, fixed penetration reached only a 30% level, while mobile subscriptions exceeded 90%. Our assumptions will not be fully accurate either, due to the uncertainties around the economic developments (GDP and personal income level), because of demographic issues (emigration and aging society) and the effects of state aid for the development of telecom networks. Nevertheless, the general patterns and trends can be identified.10
FB coverage has grown slowly in recent years – 0.8% year over year; the early rapid-growth phase based on coverage of the cities is being replaced by coverage of sparsely populated areas which are inhabited mostly by low-income consumers.
In order to support the achievement of a more complete FB coverage, the Ministry of Transport has coordinated with the EC on state aid for the development of middle-mile fibre communications networks and optical access points up to 2018 (SM, 2011). These networks will be created step-by-step, in municipalities where none of the private providers is planning to create such connections in the next 3–4 years; scaling up from 38.8% of municipalities having high data rate connections to the trunk network in 2011, to 54.9% in 2016 and 100% in 2020. The program intends to provide the Internet backbone for last-mile operators which can use various wired and/or wireless technologies to ensure data transmission rates of at least 30 Mbit/s at the subscribers’ access channels. Installation of the middle-mile network was launched in Q2 2013 in the Latgale region – a region with the greatest amount of white areas. An important feature of the project is forbidding the middle-mile network owner to develop last-mile connections, thus ensuring equal possibilities for all last-mile competitors.
An immediate impact of the gradual state aid policy should not be expected, as the planned fibre connection to the trunk network is not a guarantee of last-mile coverage offers from any of the operators. The activities of the last-mile providers will be evaluated after a few years and a decision will be made on the need for state aid in development of the access networks. The PUC will also periodically evaluate the capacity of the trunk networks.
All in all, there is no reason to forecast a more rapid growth of coverage: it may increase by 3–4% until 2020 to reach 92–93%.
The analysis of development of the fixed market shows that the FB penetration trend corresponds surprisingly well to the ideal S-curve, especially in the pre-crisis period (see Figure 15.10). The slowdown since 2008 reflects the impact of the economic crisis. Approximation of the pre-crisis development trend with the ideal sigmoid function suggests that the FB penetration saturation level of around 30% will be achieved around 2017. The crisis has resulted in a delay of 3 years and slowed down further developments, too. The penetration level will increase by 4–6%, mainly due to the gradual support for development in the rural areas, so we can predict an FB uptake of around 28% in 2020.

Figure 15.10 Forecast of fixed broadband penetration up to 2020, as % of population, Latvia
This forecast 30% FB penetration level will not be enough to achieve the Digital Agenda target. With the average size of the Latvian household at 2.4 members, it means that to reach the high data rate target, a penetration level of 42% is necessary for the coverage of all households. Adding the connections to businesses and educational and public institutions, a total penetration level closer to 60% would be necessary to achieve the target of 100% household coverage.
As reliable MB penetration statistics are available only for the last three crisis years, an indirect benchmarking is used, comparing the current MB penetration level in EU countries with the combined MB penetration and FB penetration as indicator (see for more detail Cernakovs-Neimarks et al., Reference Cernakovs-Neimarks, Karnitis, Rutka and Virtmanis2013)11.
Such benchmarking gives a line of general relevance (see Figure 15.11). In this case, saturation is still far away: only Sweden, Finland and Denmark are already near saturation, while Latvia is still in the growth phase. Forecasts show that a MB penetration of around 60% will be achieved in 2020.

Figure 15.11 Mobile broadband penetration in relation to the combined mobile and fixed broadband penetration rates, EU countries, end of 2012
Mobile traffic trends show that the growth will continue. The various future projections differ as to growth rate (CAGR 60–90%) and factors that slow down growth are appearing but there are no signs of approaching the saturation phase.
The projected average monthly traffic per subscription would be around 4.0–4.2 GB/month in 2020, the total monthly mobile traffic volume in Latvia will grow to 14–16 PB/month.
15.9 Case summary and analysis
The case summary is provided with reference to the research questions formulated in Chapter 2 Research context and perspective.
15.9.1 Starting conditions
A highly relevant starting condition in terms of comparing broadband development in Latvia with other member states of the European Union is the return to independence of the state in 1991. For most economic sectors, it implied a catch-up process, which for telecommunications was completed in a relatively short time. The starting position was a teledensity of 26%, a position very favourable compared to other East European countries (Poland: 9%; Hungary: 10%; Czech Republic: 16%), but significantly lagging the major OECD countries (Germany: 40%; UK: 44%; USA 54%; Sweden 68% as of 1990). (OECD, 1999). The waiting list for a telephone included 140,000 applications, with waiting times up to 20 years.
15.9.2 Role of the central government
Recognizing the need for a catch-up in telecoms, the government decided on a strategic partnership to introduce private sector management practices and quality of services. This was enabled through a partial privatization (49%) of the incumbent operator Lattelekom. The incentive was the grant of a twenty-year monopoly on basic public voice and data services, including leased lines; the condition was the obligation to invest – reducing the waiting list – and modernize the network according to the Umbrella Agreement. Through a tender process, the consortium of Cable & Wireless (70%) and Telecom Finland (30%) was selected as the strategic partner. Tariffs were controlled through the Telecommunications Tariff Council, the de facto, partly independent regulatory body. By 2000 the waiting list had been reduced to zero and 50% of the subscribers were connected to digital switching systems. The highest level of teledensity reached, measured by fixed line connectivity, was 31%. The predicted growth of fixed lines was not realized as the success of mobile rapidly closed the connectivity gap, reaching a density of 190% of population.
The incumbent operator Lattelecom had turned from a simple voice service company to a provider of modern integrated telecom and information technology services in less than a decade.
15.9.3 Catch-up in next generation technologies
The catch-up process led to a leap-frog in technologies being deployed and to embracing new technologies as soon as these became available. The long distance and international connectivity was realized based on the construction of optical backbone networks.
In contrast to many other countries, the first mobile license was not granted to the fixed-line incumbent, but to LMT – a consortium of domestic and foreign players. The NMT-450 system introduced in 1992 – the 1G cellular system – was succeeded by GSM – the 2G cellular system – in 1992, the first license being granted to LMT. A second GSM license was granted in 1997 through a tender process to Baltcom GSM (now Tele2). WAP-based services were launched in 2000. ISDN was introduced in 1998 and ADSL in 2000. By that time the technology gap with the leading countries in the EU had disappeared. 3G was introduced in 2005 and 4G is being deployed now, having started in 2011.
15.9.4 Cable network development
Cable networks had developed as city or local networks, with two providers (Baltcom TV and IZZI) being granted NRA licenses to operate telecommunications services throughout the country in 2003 at the time of market liberalization. Cable coverage is near 100% of urban households (70% of total). There was a significant mergers and acquisitions process among cable operators in 2009–2011. Nevertheless, with more than fifty city and local CATV operators remaining, it seems that a second consolidation wave has started in 2013.
15.9.5 Joining the European Union and the application of the Regulatory Framework
Leading up to the EU accession in 2004, an independent national regulatory authority was established in 2001 and the telecommunications market was liberalized in 2003. The incumbent operator was already partially privatized in 1993.
The twenty-year monopoly granted to Lattelekom was shortened at the time of implementing the EU Regulatory Framework and market liberalization. This led to court proceedings initiated by Lattelekom’s owner TILTS in 2000, to be resolved by 2004.
The short interval available to transpose the EU regulation into national law led to nine infringement cases initiated by the European Commission in the period 2005–2011 referring to incorrect implementation of the Framework. The transposition of the New Regulatory Framework issued in 2009 was completed in 2011. In 2011, too, the PUC became fully independent as to budget matters and freed from supervision by the Ministry of Economy.
In 2007 wholesale access obligations were applied to Lattelecom, including local loop unbundling.
15.9.6 Narrowband developments
Access to the Internet was organized by the academic community in 1992 with a connection to NORDUNET; this was some five years after the first Internet connections were established by academic institutions in Western Europe. By 1999 some thirty-five ISPs served the Latvian population in the major cities, providing access to the global Internet via the Riga Internet Exchange (GIX) established in 1995. End-user access started with dial-up and ISDN-based access. In the late 1990s CATV – cable-based – Internet access was introduced. The year 2000 may be considered as the start of e-commerce in Latvia as the majority of Latvian commercial banks started to introduce Internet banking services. In 2000, ADSL was introduced by Lattelecom. This provided the basis for infrastructure-based competition in narrowband Internet access, albeit, given the limited coverage of the CATV networks, this competition was a practical reality in the cities only. Notwithstanding, cities represent 68 per cent of the population,
Reaching the remaining 30% of the population in the rural areas is the major network developmental bottleneck in Latvia, requiring state aid for its development.
The adoption of mobile technologies as a substitute for the lack of fixed connectivity also prompted the development of mobile Internet access. Tests executed by the PUC in 2012 showed that only 45% of the access tested had download rates of 2 Mbit/s or more. The rapid deployment of HSDPA technology in 2012 significantly improved the situation in the major cities; the measurements showed 91.7% over 2 Mbit/s and 68.6% over 4 Mbit/s (65.2% and 21.7%, respectively, in 2011). With these rates mobile Internet access provides an alternative to fixed access, as reflected by the development of broadband market shares over the years 2005–2013. Traditional fixed broadband is being marginalized by FttH and mobile, first reducing the role of cable and secondly the role of ADSL. With an average spending of EUR 13.00/month for all telecom services it appears that for most Latvians fixed and mobile are substitutes rather than complements.
15.9.7 Intensity of competition
The intensity of competition is very high, as reflected by the high churn rates: CAGR for the last four years of 41% for fixed and 35% for mobile. This may be explained by the relatively low willingness or ability to pay, indicated by the relatively low average spending per month and the low uptake of applications subject to additional fees. Also the low teledensity rates when competition was introduced suggest that the number of captive users was relatively small from the outset. Hence, most end-users tend to search for the best value for money available.
15.9.8 Type of competition
At the time of independence, licenses to operate the cable network were granted to entities other than the PSTN incumbent. This enabled the competition for Internet access in the later part of the decade. However, with market liberalization in 2003 (shifted five years relative to old member states), the PSTN incumbent had a head start with ADSL and, as a consequence, infrastructure-based competition (PSTN vs cable) had a much smaller role to play.
The preference by alternative operators to invest in alternative wireless infrastructure can be explained first of all by the exclusivity ambitions of Lattelekom, as well as the lack of good quality PSTN lines and shortage of PSTN lines given a density of only 31%). Unbundling introduced in 2007 did not lead to any significant uptake of access-based service provision by alternative operators. This was despite an attractive wholesale price set at EUR 8.40 per month for full unbundling.
Infrastructure competition among 240 fixed broadband operators is a typical Latvian market characteristic: local providers are competing with the main actors as well as with one another, mostly in limited areas, even in one apartment block. Nevertheless the FB market share of Lattelecom was near 55% in 2012.
Mobile competition was introduced in 1997 with the tender and award of the second GSM license to Baltcom GSM (now Tele2). The third operator Bite entered the market in 2005 as a result of a radio spectrum auction.
The competition is both price based and based on increasingly higher data rates at roughly constant prices. The low price levels, typically half of the EU average, are a result of intense competition and facilitated by relatively low operating costs as well as lower construction costs, both due to lower labour costs.
The development of price levels should be considered in the context of the higher level of ARPU (up 33% since 2003) and higher personal income (up 97%). This has led to a decrease in the share of discretionary spending for telecommunication services from 6.84% to 4.619%.
15.9.9 Broadband developments
Standard fixed broadband coverage has reached 83% of households, some 10% below the EU average, with rural households as the main communication users lacking coverage. Uptake is at 55% of households, some 20% below the EU average. The low uptake is explained by strong competition from mobile, at least in the 2–5 Mbit/s data range.
Mobile broadband plays a major role in standard broadband supply; in 2013 it had a broadband market share near 74%. This is based mainly on 3G deployment with HSDPA. Deployment of LTE/4G reached all major cities in 2013.
NGA coverage leads the EU average by a wide margin, 79% of households against 53%. This also applies for the uptake of data rates of over 30 Mbit/s, 24% against 11%, and for data rates of over 100 Mbit/s, 11% against 2%.
NGA deployment consists of cable with DOCSIS-3 modems and FtttH. There is no VDSL deployment, which can be explained by advanced business model of Lattelecom avoiding double investments in the infrastructure.
While new entrants had been able to grow and capture 55% of the broadband market by 2007, the roll-out of FttH/B by Lattelecom has allowed the incumbent to regain market share, which stands at 55% in 2012.
15.9.10 State aid
State aid and regional funds will be required to close the digital access gap in the rural areas. Hence, the dynamics of the broadband market in the rural areas is distinctly different from the dynamics that can be observed in the cities.
15.9.11 Other actors
While the case identified a large number of fixed broadband operators active in smaller parts of cities, no other – unconventional – actors have been identified as having contributed to the broadband dynamics in Latvia.
15.9.12 Achieving the Digital Agenda targets
Despite the need for a catch-up in the early 1990s Latvia is well positioned for achieving the Digital Agenda targets where they apply to the urban areas. The deployment of FttH/B with a current coverage of 90% of households in the cities (68% of household nationwide), to which we should add the non-overlapping DOCSIS-3 coverage, allows the uptake of data rates in excess of 100 Mbit/s. There is no technological barrier to the deployment of higher data rates, as no VDSL is deployed and the incumbent is leading in fibre deployment.
The tariffs set for NGAs (around EUR 15.00 for a range of 25–250 Mbit/s) are comparable with the current level of total telecommunications spending (on average EUR 13.00 per capita per month). There is no price barrier that prevents the migration towards higher data rates. However, the current spending level includes fixed and mobile and hence there is the question of how many people can afford to add a fixed NGA subscription to their mobile one. Given the current price levels, lower prices should not be expected; thus much will depend on the growth of income, which is very much subject to economic developments in the coming years.
While content is said to drive the need for higher data rates, the relatively low willingness and ability to pay for services and applications supplied for additional fees may reduce the demand-side pull of content.
For the rural areas, the situation is much less favourable. The costs of supplying high data rate access are much higher, while the income levels are lower. The realization of the ‘middle mile’ project with state aid may lead to last mile solutions being provided in the future. The ‘middle mile’ project will also facilitate mobile backhaul and hence 3G-based solutions may become viable, along with community-based Wi-Fi solutions with dedicated backhaul. With a longer horizon, and some favourable developments, the 2 Mbit/s target may be realized for all citizens and the 30 Mbit/s target may be realized for at least parts of the rural communities.
Based on performance measurement of 4G, medium-loaded cells provide for downlink data rates of 14–18 Mbit/s. This suggests that mobile broadband will not contribute materially to the realization of the two high-end targets of the Digital Agenda.
The modelling of developments suggests that the economic crisis has had a delaying effect of three years compared to the momentum observed in the period 2005–2007.
15.9.13 Salient items in this country case
The salient items in this case are:
– The catch-up process since independence in 1991;
– The accelerated adoption of mobile to compensate for the lagging development of the fixed network, where fixed never achieved more than 31% teledensity;
– The infrastructure-based competition among 240 fixed broadband operators is a typical Latvian market characteristic;
– The lack of any access-based competition, despite unbundling regulation being in place;
– Leapfrogging technology, moving towards FttH/B without taking the interim solution of VDSL;
– The challenge of closing the gap between urban and rural developments;
– The involvement of the state in the sector is still very high, with a 51% direct ownership of Lattelecom and approx. 40% (direct and indirectly) in mobile operator LMT.
15.9.14 Experiences that might benefit other member states in realizing the Digital Agenda for Europe targets
– Reasonable lead-times should be set for the process of transposing the EU Regulatory Framework. When starting from scratch, a two-year interval is too short to assure a good quality outcome.
– Public subsidies will be necessary for development of NGA networks in sparsely populated regions and also for development of content in national languages in small countries.
– To achieve more dynamic development and catch-up, and to save capital expenditures, some technological steps can be omitted: e.g., intermediate VDSL.
– Innovative Internet quality measurement systems can be recommended.
– A multi-sector NRA is more competent and authoritative than sector specific regulators, being more independent and less prone to political impact, regulatory capture and populism.
– Reliable statistical data on telecom markets are needed for more accurate analysis of trends, including the early identification of risks; it is in the common interest and a task of government, regulators and operators to achieve harmonized collection of data.
References
1 SIA Baltcom TV and SIA IZZI finished a two-year-long M&A process in 2013.
2 The kernel of the PSTN was the Moscow hub, which was connected by trunk-lines with second-level hubs in the capitals of the Republics and provinces. Long-distance calls were routed through the Moscow hub and international direct dialling was available only from the Moscow hub. Second-level hubs were connected with local hubs in the regional centres, which in turn were connected with local crossbar and step-by-step exchanges in towns and villages. Only local calls were routed directly; calls requiring settlement were routed through the star system.
3 An optical ground wire, or in the IEEE standard an optical fibre composite overhead ground wire, is a type of cable that is used in the construction of electric power transmission and distribution lines. Such a cable combines the functions of grounding and communications.
4 The EU community acquis or acquis communautaire, sometimes called the EU acquis and often shortened to acquis, is the accumulated legislation, legal acts and court decisions which constitute the body of European Union law.
5 EU legislation is mainly directed at strategic issues (although sometimes it is too detailed and painstaking). Tactical activities and measures to implement strategic trends have to be chosen by the member states according to the real situation in the corresponding country as well as to the traditions and mentality of the people.
6 GSM bands were assigned to the LMT as an administrative decision, while the assignments to Tele2 and Bite were the result of auctions of previously-defined single spectrum blocks. UMTS and LTE spectrum blocks were fully auctioned.
7 More than five years before the planned introduction of LTE, Baltcom TV was required to end its MMDS service. According to national law compensation for the move is not envisaged if changes in spectrum plans (refarming) are announced at least two years before the move. Instead of this band the company required a position at the 10.5 GHz band on FCFS base, which was granted by the PUC.
8 Lattelecom’s strategy is to upgrade the existing copper networks by fibre in apartment buildings with twenty or more households (especially in the major cities and regional centres), while FttH (FttB) is used for connection of all new buildings.
9 PESQ: Perceptual Evaluation of Speech Quality is a family of standards comprising a test methodology for automated assessment of the speech quality as experienced by a user of a telephony system.
10 There are several possibilities for modelling the development of telecom markets (see, e.g., Arvidsson, Hederstierna and Hellmer, Reference Arvidsson, Hederstierna, Hellmer, Mason, Drwiega and Yan2007). We are using a sigmoid model for modelling the fixed and mobile penetration, as adoption of new technologies typically reflects the sigmoid (S-shaped) curve. The sigmoid model, based on the Gompertz function which can be appropriately parameterized, provides sufficient flexibility for predicting penetration (e.g., Rouvinen, Reference Rouvinen2006, Zheng Yan, Reference Zheng2009). Therefore, based on inputs from the study of past trends and market development scenarios, we are applying Gompertz distributions to forecast the subscription growth.
11 Forecasting telecom markets has to be done regularly. It calls for reliable market data (see, e.g., Krizanovic, Zagar & Grgic, Reference Krizanovic, Zagar and Grgic2011; Zarmpou, Vlachopoulou & Patsioura, Reference Zarmpou, Vlachopoulou and Patsioura2011). The problem is in the small number of reliable input values and the large number of output values (medium-term prediction is necessary to evaluate development trends) which can cause the over-learning effect of these models. Although a variety of institutions are publishing various statistical data on telecom development, official statistics have not stabilized yet. In addition, trends are typically distorted by an economic crisis. Therefore benchmarking is also applied to raise the credibility of the potential forecasts.


