
When the previous edition of A Handbook of Primary Commodities was written (mainly in 2005 and 2006), the world commodity markets were still in the early upward phase of the latest commodity boom. In that edition of the book, commodity booms did not warrant a specific chapter. However, at the time of writing this edition, mainly during the second half of 2015, the latest forceful and unusually enduring commodity boom appears to have come to an end. The phenomenon of commodity booms has lately attracted a lot of attention from academic researchers, but also from producers, industry investors, and other actors with an interest in the production and consumption of primary commodities. Considering the large impact on commodity markets and, more widely, on the world economy, from the occurrences of booms, a whole chapter has been devoted to this phenomenon in the present edition. This chapter draws heavily on Radetzki (Reference Radetzki2006, Reference Radetzki2013b) and Radetzki et al. (Reference Radetzki2008).
6.1 Definition of Commodity Booms
Commodity booms are defined for the purpose of the present analysis as sharp simultaneous increases in the real price of a broad group of commodities. Using this definition, it is possible to detect three such booms in the period since the Second World War, beginning in 1949, 1973, and 2004, respectively (see Figure 6.1). They were all triggered by demand shocks caused by unusually fast macroeconomic expansion. In all three cases, commodity producers were unable to satisfy the rapid growth in commodity demand, and prices exploded as a consequence.
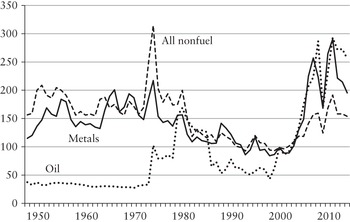
Figure 6.1 Commodity price indices in constant US$ 1948–2014. 2000 = 100
Note: UN's US dollar index of manufactured exports from industrialized countries is used as deflator.
The statement that demand is the typical cause of broad commodity price moves, should not be surprising, even if analysts have attempted alternative explanations (Labys et al., Reference Labys, Achouch and Terraza1999; Pindyck and Rotemberg, Reference Pindyck and Rotemberg1990). After all, alterations in supply are specific to individual commodities. Booming or slumping macroeconomic conditions, in contrast, will impact on demand across most commodity groups. We can think of two exceptions to this general rule of demand being the mover. The first is widespread crop failures caused by extreme weather events. The second is strong simultaneous additions to production capacity stimulated by a period of high prices.
The importance of macroeconomic conditions in explaining the commodity booms is clearly apparent from the numbers in Table 6.1. Note that the latest boom is presented for selected years between 2002 and 2014, and that data is provided globally and for OECD and Emerging and Developing Asia separately. The latter region is of particular interest on account of its speedy growth and its substantial weight in the global economy in recent years. A common trend in all commodity booms is that the years just preceding or marking the beginning of the respective boom were characterized by very high growth rates in GDP and industrial production. It is also noteworthy that the first two commodity booms were short and collapsed in 1952 and 1974, as the world economy experienced a sharp growth deceleration and commodity demand shrank in consequence, but that the latest boom lasted for much longer than its predecessors, importantly on account of the strong and enduring performance of Emerging and Developing Asia.
Table 6.1 Growth patterns during three booms (%)
| 1949 | 1950 | 1951 | 1952 | |
|---|---|---|---|---|
| North America and Western Europe | ||||
| GDP | 2.6 | 9.2 | 7.2 | 2.1 |
| Industrial production | −0.3 | 8.1 | 9.3 | 3.2 |
| International inflation (US$) | −3.5 | −12.1 | 15.2 | 4.9 |
| 1972 | 1973 | 1974 | 1975 | |
| OECD | ||||
| GDP | 5.4 | 6.0 | 0.8 | −0.2 |
| Industrial production | 6.5 | 8.1 | −1.5 | −4.3 |
| International inflation (US$) | 9.1 | 16.0 | 21.9 | 11.1 |
| 2002 | 2006 | 2010 | 2014 | |
| World | ||||
| GDP | 2.9 | 5.6 | 5.4 | 3.4 |
| Industrial production | 0.4 | 5.3 | 7.2 | 2.3a |
| International inflation (US$) | −1.2 | 2.5 | 3.7 | 0.3 |
| OECD | ||||
| GDP | 1.7 | 3.2 | 3.0 | 1.8 |
| Industrial production | 0.1 | 5.2 | 4.4 | 1.2a |
| Emerging and developing Asia | ||||
| GDP | 7.0 | 10.1 | 9.6 | 6.8 |
| Industrial production | 6.3 | 9.3 | 9.7 | 7.1a |
a Industrial production numbers for 2014 are preliminary, and marked.
Notes: OECD represented 68% of world GDP in 1973. In 2014 OECD represented 47% of world GDP, while Emerging and Developing Asia represented 29.5% all in PPP terms.
International inflation depicts the development of UN's Manufactured Unit Value (MUV) export index, denominated in US$.
The prolonged duration of the latest commodity boom has attracted a lot of attention and discussion regarding whether it represents a so called super cycle (Cuddington and Jerrett, Reference Cuddington and Jerrett2008; Heap, Reference Heap2005). According to this literature a super cycle is defined as a prolonged price cycle for a broad range of primary commodities, with an upward trend for roughly 10–35 years, making a complete cycle last for about 20–70 years. It is further argued that the super cycle is demand driven, and that it will last for as long as the strong demand growth continues. The authors identify at least two earlier super cycles, the first at the end of the nineteenth century, driven by the expansion of the US economy, and the second between 1945 and about 1970, caused by the postwar reconstruction in Europe and Japan. The proponents of the super cycle thesis see the industrialization and urbanization of China as the main cause for the current super cycle.
Our view of the prolonged duration of the latest commodity boom is rather that an extended investment cycle has been the main driver (Radetzki et al., Reference Radetzki2008, Reference Radetzki2013b). We thus argue, in line with standard microeconomic theory, that the high commodity prices prevail until sufficient capacity to meet the accelerated growth in demand is installed. When using a simplified example of different investment cycles, Radetzki et al. (Reference Radetzki2008) illustrate that a resource boom can last for 12–15 years at a maximum, due to investment lags and persisting capacity constraints. We can conclude today, in late 2015, that the boom is over and that the high prices lasted until 2014, when sizable new capacity was finally brought to the market for many important commodities, e.g., iron ore. The reduced demand growth caused by a slowdown in China's economic expansion in recent years has, of course, also helped to punctuate the boom.
Table 6.2 details the timing and level of the peak prices for broad commodity categories during the three booms. It can be seen that the first two booms had peaks that basically centered on a single year, but that for the latest boom two peaks occurred, in 2008 and 2011 (see Figure 6.2). The main explanation for this is the occurrence of the recession of 2008–09, triggered by the financial crisis that hit the world economy in late 2008. Even though this crisis has been described as the largest setback to the world economy since the 1930s depression, it made only a short-run impression on the major commodity price indices. This is explained by the fact that the recession mainly afflicted the advanced economies, while economic growth among the recently dominant commodity consumers of Emerging and Developing Asia experienced only a short-run dip followed by an impressive recovery.

Figure 6.2 Quarterly commodity price indices in constant US$ 2003Q1–2015Q1. 2005 = 100
Table 6.2 Peaks in constant dollar commodity price indices during three booms
| First boom, 1949 = 100 | Second boom, 1971 = 100 | Third boom, 2005 = 100 | ||||
|---|---|---|---|---|---|---|
| Peak | Date | Peak | Date | Peak | Date | |
| Aggregate index | 145 | Q151 | 207 | Q174 | 203 | Q208 |
| Metals and minerals | 134 | Q451 | 155 | Q274 | 249 | Q111 |
| Energy | 117 | Q451 | 326 | Q174 | 224 | Q208 |
| Food | 125 | Q350 | 140 | Q474 | 188 | Q211 |
| Agricultural raw materials | 187 | Q151 | 159 | Q174 | 165 | Q211 |
6.2 The First Commodity Boom
The first boom was strongly related to the Korean war, which broke out in June 1950, with an armistice reached in July 1953. The direct impact of the war on commodity markets arose from the insecurity felt about industrial materials supply, amplified by the painful shortages of the Second World War, which were fresh in the memory. This prompted a widespread build-up of strategic inventories, which added to demand and pushed up prices. The indirect impact arose from the boost to economic growth and industrial output that resulted from the war operations.
The inflationary performance during the first boom follows a somewhat unusual path. The MUV index presented in Table 6.1 shows very little inflation for the whole of the four-year period, considering that the index increased from 23.2 in 1948 to 23.8 in 1952 (2000=100), a rise of only 2.6%. The details depict a far less stable price development, as we note a sharp fall in the 1950 dollar prices of manufactured exports. This is mainly the consequence of devaluations in Europe in late 1949. The prices are then adjusted to the new dollar parities, which is illustrated by the strong rise in prices in 1951.
Agricultural raw materials and, to a lesser extent, metals and minerals, carried the first commodity boom. As is apparent from Table 6.2, the first group peaked at an index of 187 early in 1951, and the latter at 134 somewhat later. In contrast, the war and the macroeconomic spurt during these years had little impact on the prices of energy and food. The constant dollar index for energy never reached 120, while that for food attained 125 during two quarters of 1950. An important explanation for these weak reactions is that the major consuming countries were relatively self-sufficient in energy and food. The OPEC cartel had not yet come into existence, the USA was still a net oil exporter, and domestic coal dominated Western Europe's energy needs (Darmstadter et al., Reference Darmstadter, Teitelbaum and Polach1971). No significant harvest failures were reported at the time. The aggregate commodity price index, too, peaked early in 1951 at 145, making it the weakest of the three booms.
Neither was the boom particularly durable. By the second quarter of 1952, the price increases had by and large petered out, as it became clear that the Korean war would not spread into a worldwide conflict and because of the sharp slowdown in economic growth recorded in that year. In addition, dramatic strategic destocking added to supply, thus contributing to the ensuing price weakness (Rowe, Reference Rowe1965). By the end of 1952, the only remaining real impact of the commodity boom was a metals and minerals price level 20–30% higher than in 1949. All other commodity prices, measured in constant dollars, were roughly the same in 1952 as they had been in 1949. For all practical purposes, the boom was a transient phenomenon.
6.3 The Second Commodity Boom
The second boom was much stronger than the first. It was also much more pervasive. The prices of all commodity groups rose sharply. As in the first boom, a very strong macroeconomic performance during 1972 and 1973 constituted an important trigger for the rise in commodity prices. But there were two additional triggers. One was that the boom had been preceded by two consecutive years of widespread crop failures. The scarcity of food led to substitution in land use, e.g., from cotton or jute to grains, which cut the agricultural raw materials supply. In 1973, deficient inventories for both food and agricultural raw materials were therefore recorded (Radetzki, Reference Radetzki1974). The second trigger was unrest in the Middle East in 1973, which resulted in a cut in the supply of oil that later in the year permitted several oil exporting countries to declare hefty price increases, which the importers could not resist. This had strong repercussions for the aggregate commodity index given the heavy weight of oil in international commodity trade.
In contrast to the first commodity boom, very high inflation was recorded throughout the second boom. In 1971 the MUV index (2000=100) settled at 30.7, and in 1975 it landed at 52.5, indicating an inflation for the whole boom period of an impressive 71%. The rapid pace of inflation, which at times resulted in negative real interest rates, yielded a sizable difference in the outcome of the boom when measured in nominal and real terms. Furthermore, not only did the period record strong price rises, these years were also characterized by large changes in the parities between major currencies. This was mainly due to the breakdown of the Bretton Woods system, which determined international exchange rates. The result was freely floating currencies after the dollar anchor had been removed. The high inflation coupled with chaos in currency markets, along with poor performance on the stock markets in the early 1970s (Shiller, Reference Shiller2000), led investors to move out of bonds and shares and into real estate, art, and commodities. The demand for commodity inventories as a “safe” store of value was a further contributory factor to the commodity boom (Cooper and Lawrence, Reference Cooper and Lawrence1975).
The constant dollar aggregate commodity price index reached a maximum at 207 in the first quarter of 1974. The individual commodity groups all attained their constant dollar peaks early in 1974: the energy index at about 330, and all the other commodity indices around 150. In the course of 1974, under the weight of the recession, importantly prompted by the oil crisis that was manifested by disturbed oil supply and exploding oil prices, the constant dollar metals and agricultural raw materials indices fell back sharply, ending the year at 100: the level in 1971 just before the beginning of the boom. Prices remained at that level through 1975, when the recession deepened. The metal prices were additionally depressed by large sales between mid-1973 and mid-1974 from the US government's strategic stockpiles, and in late 1974 from excessive commercial stocks in Japan that had been built up in the preceding year (Cooper and Lawrence, Reference Cooper and Lawrence1975). Food prices fell too, though less steeply, given their lower sensitivity to the business cycle.
The energy price index stands out from the other commodity groups. Energy prices rose significantly only at the end of 1973, later than the prices of other commodities, but by early 1974 they had increased by much more than any other commodity group, and they remained 150–200% above the base year through 1975 and beyond. The supply effects of the political unrest in the Middle East explain the difference. Oil dominates the energy price index, and several oil exporters adjusted supply to the falling demand in 1974 and 1975, caused by the combination of deepening recession and the price shock (Radetzki, Reference Radetzki1990a,b) so the elevated oil prices persisted.
6.4 The Third Commodity Boom
The third commodity boom started about 2004 and has just recently run its course, as is apparent from Figure 6.1. Like the preceding booms, it was triggered by a demand shock. To illustrate, the global demand growth for oil and copper recorded in 2004 was the highest on record for over 20 years. Producers were caught unaware, with little spare production capacity, so prices in many markets exploded. As in the earlier booms, the demand shock was mainly due to rapid macroeconomic expansion in the early years, as is illustrated in Table 6.3.
Table 6.3 Growth patterns during the third boom (%)
| World | OECD | Emerging and Developing Asia | |||||
|---|---|---|---|---|---|---|---|
| MUV index | GDP | Industrial production | GDP | Industrial production | GDP | Industrial production | |
| 2002 | −1.2 | 2.9 | 0.4 | 1.7 | 0.1 | 6.9 | 6.3 |
| 2003 | 5.2 | 3.6 | 3.4 | 2.1 | 1.1 | 8.1 | 6.8 |
| 2004 | 6.8 | 4.9 | 6.3 | 3.2 | 4.1 | 8.5 | 10.2 |
| 2005 | 3.1 | 4.6 | 3.2 | 2.8 | 1.9 | 9.5 | 9.1 |
| 2006 | 2.5 | 5.6 | 5.3 | 3.2 | 5.1 | 10.4 | 9.3 |
| 2007 | 6.1 | 5.7 | 4.6 | 2.7 | 4.1 | 11.2 | 10.2 |
| 2008 | 7.8 | 3.1 | 0.7 | 0.3 | −1.2 | 7.3 | 5.2 |
| 2009 | −6.2 | 0.0 | −5.2 | −3.4 | −9.0 | 7.5 | 3.1 |
| 2010 | 3.7 | 5.4 | 7.2 | 3.0 | 4.4 | 9.6 | 9.7 |
| 2011 | 8.9 | 4.2 | 3.3 | 1.9 | 2.0 | 7.7 | 7.5 |
| 2012 | −1.2 | 3.4 | 2.3 | 1.3 | −0.8 | 6.8 | 7.9 |
| 2013 | −1.4 | 3.4 | 2.3 | 1.4 | −0.4 | 7.0 | 7.4 |
| 2014 | 0.3 | 3.4 | n.a. | 1.8 | 1.2 | 6.8 | 7.1 |
The inflation during the period covered by the table is strikingly lower than that recorded during the second boom. When measured by the MUV Index in US dollars, international inflation works out at an anemic annual average of 2.6%. This is noteworthy, since the 13-year period displayed has been characterized by historically high global economic growth, averaging 3.9% for the world as a whole. It is clear that the third commodity boom has been forcefully driven by Emerging and Developing Asia, and not by the more mature economies. The average yearly growth in the OECD region between 2002 and 2014 has been a moderate 1.7%, compared to the rampant expansion in Emerging and Developing Asia, where economic expansion attained an annual average of 8.3%.
There is another reason for the dominant role of Emerging and Developing Asia in triggering and maintaining the boom. Although this area accounted for only 29.5% of global GDP in 2014, compared with the OECD's 47% as noted above, it has been in a development stage much more intensive in primary materials use than the dematerializing mature OECD economies.
If a dollar added to the GDP in Emerging and Developing Asia absorbs twice the quantity of commodities as does a corresponding dollar's growth in the OECD countries, the two regions would contribute about equally to commodity demand growth provided that both expanded at the same rates. But since Emerging and Developing Asia's economies expanded at almost five times the OECD rate, it follows that the region's contribution to commodity demand growth completely overwhelmed that of the OECD.
China especially stands out in this respect. The country's share of global GDP in 2014 (PPP terms), was assessed by the IMF (biannual, 2015) at 16.3%, but its share of global demand growth between 2006 and 2013 was 52% for petroleum, 100% for aluminum, and incredibly 133% for nickel and 131% for copper (see Table 2.7). The nickel and copper figures imply not only that all demand growth occurred in China, but that, additionally, demand shrank significantly in the rest of the world.
The aggregate commodity quarterly price index experienced a steady increase from 2003 and onwards, and reached a peak at 203 (2005=100) in the second quarter of 2008, just before the onset of the financial crisis. The energy index also reached its peak in the same quarter, as is illustrated in Table 6.2 (though the oil price peaked in 2011). However, the other major indices had their peaks in 2011, after the recession of 2008–09. In particular, the metal and mineral price index was not severely disturbed by the financial crisis, as is evident from Figure 6.2, which supplements Figure 6.1 by providing further detail on the third boom. The index dipped from 192 in the second quarter in 2008 to a low of 108 in the first quarter of 2009. It then rose quickly to attain an even higher peak in the first quarter of 2011. It is further noted that the aggregate price index almost reached its peak level from 2008 in the second quarter of 2011 (at 202).
A closer scrutiny of the recession throws some light on its weak and brief price impact. First, on a global scale, the recession, even if it hit hard in the end of 2008, was short and not very deep, as is evident from Figure 6.3. Only in 2009 did global output contract, but in 2010 it had already bounced back to growth over 5%. Second, only mature economies were seriously afflicted, with two consecutive years of growth substantially below trend. Third, the recession was much weaker in Emerging and Developing Asia (which, as noted, has for some time dominated commodity demand growth) and in the other developing countries of the world.

We have asserted above that accelerating and/or high economic growth has been an important trigger for all three commodity booms. We have also suggested that near-recessionary conditions and the ensuing destocking quickly punctured the first two booms, but that the third boom persisted for considerably longer, despite the occurrence of the 2008–09 recession, because of continued fast growth mainly in Emerging and Developing Asia. Some clarifications to the developments in the latest commodity boom are called for.
First, not all events of sharply accelerating macroeconomic performance give rise to booming prices in commodity markets. Other preconditions must prevail, e.g., a tight production capacity situation and relatively small inventories. Such preconditions typically emerge after prolonged periods of weak commodity prices which discourage investments in capacity expansion and instill a sense that supply is secure, and that there is limited need for inventory holding. This was clearly the case for many primary commodities prior to the beginning of the twenty-first century. Many commodity prices had been severely depressed for nearly three decades (Humphreys, Reference Humphreys2015), and especially so for agriculture, something which is noted in Figure 6.1 but also discussed in Baffes and Haniotis (Reference Baffes and Haniotis2010).
There is a common perception that it takes about five years on average for new green field capacity to be in place in minerals and metals and fossil fuels industries. The argument then is that five years should be enough to rectify any market imbalance caused by unexpected spurts in demand. However, this assumption has proved wrong in the latest commodity boom. Investments are subject to a variety of perception and decision lags, comprising the time to bring together the necessary financial packages and to overcome various regulatory impediments, including increasingly restrictive environmental legislation in recent times. Adding to this the time needed to overcome the investors’ unpreparedness to act, due to the history of depressed prices and general lack of interest in the industry, it is clear that the latest commodity boom has lasted longer not only due to persistent strong demand, but also due to a slow response in supply. By 2014, when new supply had entered many commodity markets, the fundamentals between supply and demand seem to be more in balance, thus resulting in downward pressure on the previously elevated commodity prices.
The boom in agricultural prices clearly requires a somewhat different explanation. First, most agricultural commodities are one-year crops, so do not require greenfield investments that take five years to mature. Tropical beverages and other tree crops constitute exceptions that, like minerals, require some five years between investment and the ensuing output growth. Elsewhere, increasing production usually takes less time, even if it is obviously not met instantly.
In their interesting study, Baffes and Haniotis (Reference Baffes and Haniotis2010) discuss the causes of the 2006–08 agricultural commodity boom. Interestingly, they find no evidence that food demand growth in large emerging nations such as China and India accelerated during the food price boom. There was some evidence that the growing demand for biofuels affected the food price spike, but considering the small share of the land area under grain/oilseeds (1.5% worldwide), the authors conclude that it was not the main cause of the price spike. They then investigate the hypothesis that excess liquidity, or speculation, was the main driver of the price boom in agricultural products. The empirical evidence regarding this issue is mixed. Gilbert (Reference Gilbert2010a) comes to the hesitant conclusion that there is no evidence that speculation has been a cause of the metals and minerals price boom, but that food commodity prices have been inflated by index-based investors under the 2008 food price boom. Baffes and Haniotis (Reference Baffes and Haniotis2010) conclude that a dominant cause of the 2006–08 food price spike was a stronger link between energy and nonenergy commodity prices.
6.5 Summary and Reflections
Some of the major conclusions and reflections from the chapter are summarized below:
1. Commodity booms are defined as a major deviation from long-run equilibrium prices. Three such booms are identified in the period after the Second World War, and all have been triggered by exceptionally strong commodity demand increases caused by rapid growth in the world economy. Prices return closer to equilibrium when the boom ends, either because of recession and slow demand growth, or because new capacity has been brought on line.
2. It is important to point out that high and steady growth in demand on its own will not normally result in a commodity boom, because in such situations capacity growth will have been adjusted to even very rapidly expanding demand. A boom thus ordinarily occurs in a situation when demand growth surprisingly accelerates and it takes time to bring new capacity into production to satisfy the new demand conditions. A disequilibrium may then emerge and may be quite durable. The latest commodity boom illustrates that it can take up to a decade before new capacity is brought to the market, thus resulting in an extended period of elevated prices. However, we do not share the belief in a so-called super cycle, where high prices remain throughout a long period of high (but steady) demand growth.
3. A reflection regarding commodity booms is that misguided beliefs regularly develop during the period of elevated prices, i.e., that we now have a new, normal, and much higher equilibrium price level. This belief will typically lead to over-investment and an ensuing period of depressed prices once the excessive investments mature. This phenomenon is clearly visible in a scrutiny of historical commodity prices.
4. The chapter has revealed how China has replaced the rich OECD world as a dominant force in commodity markets. China's economic growth may be slowing and its economic model shifting from emphasizing investment toward consumption, both resulting in a slowdown in the country's commodity demand. But other emerging economies are likely to take over China's dominant role as fast-growing voracious commodity consumers (Humphreys, Reference Humphreys2015). Even though the rich countries still dominate global GDP, their influence on commodity markets will likely continue to decline. The historical shift just described may involve an increase in historical demand growth for commodities, but is unlikely to push up equilibrium commodity prices to a more elevated level.


