
Discovering Mislocalizations with Moving Stimuli
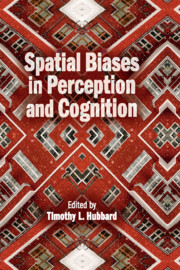
A note in a book by Friedrich W. Fröhlich (Reference Fröhlich1929) stated that in 1894 the Norwegian astronomer O. Pihl noticed a perceptual illusion when localizing the onset position of a moving target: Typically an observer did not notice the target at its physical onset position, but rather at some later position on its motion trajectory. In other words, a localization error in the direction of motion occurred (Figure 7.1a).
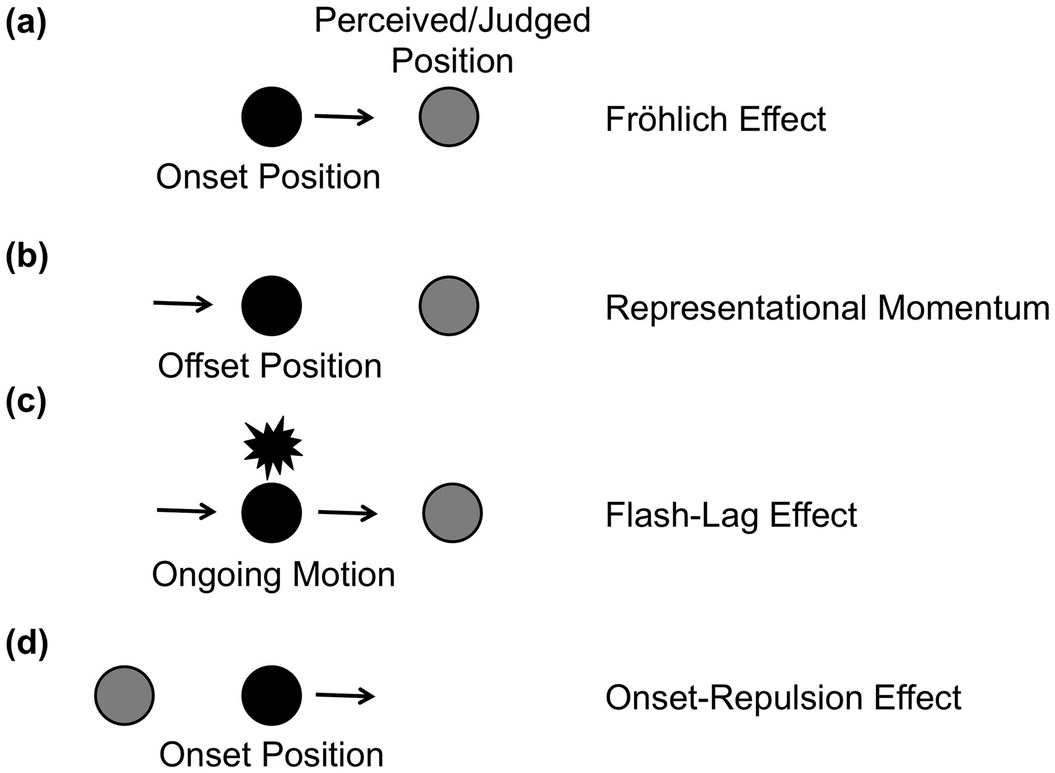
Figure 7.1 Four localization errors with moving stimuli. When the onset position (a) or the offset position (b) of a moving target is localized, observers typically make localization errors in the direction of movement. Similarly, when they judge a moving target that is presented in alignment with a flash, the target appears to lead the flash (c). These errors are known as the Fröhlich effect, flash-lag effect, and representational momentum. In the onset repulsion effect (d), the onset position is judged opposite to the direction of motion.
It took some time before the scientific community dealt with this phenomenon. Almost 30 years later, the same author (Fröhlich, Reference Fröhlich1923) was the first to publish systematic experiments on the mislocalization, and in the subsequent scientific debate the illusion was termed the Fröhlich effect. Nowadays, the Fröhlich effect is typically observed on a computer display, on which the moving target appears suddenly out of nowhere. At the time of Fröhlich (Reference Fröhlich1923), such an experimental setup was difficult to implement. Instead, he used a mechanical device with a moving bar entering a window. In this case the target is not perceived at the position adjacent to the edge of the window, but at a later position within that window.
In fact, Fröhlich (Reference Fröhlich1923) reported not only the mislocalization but also other phenomena. For instance, he reported that the perceived width of the moving bar appeared larger than that of the physical stimulus and that the bar looked brighter at its leading than at its trailing edge (for details, see Fröhlich, Reference Fröhlich1923; Kerzel, Reference Kerzel, Nijhawan and Khurana2010). The mislocalization and its first explanations were amply discussed in the 1930s (e.g., by Fröhlich, Reference Fröhlich1925, Reference Fröhlich1929, Reference Fröhlich1930, Reference Fröhlich1932; Metzger, Reference Metzger1932; Müller, Reference Müller1931; Rubin, Reference Rubin1930), but were neglected after World War II.
Interest in the Fröhlich effect was revived in the 1990s together with two further mislocalizations in motion direction. First, Nijhawan (Reference Nijhawan1994) presented a moving target in alignment with a stationary flash and observed that the target appears to lead the flash (flash-lag effect, Figure 7.1c; for an overview, see Hubbard, Chapter 9 in this volume). In fact, Nijhawan rediscovered an observation made in follow-up studies of the Fröhlich effect (cf. Metzger, Reference Metzger1932; Rubin, Reference Rubin1930; for details, see Kerzel, Reference Kerzel, Nijhawan and Khurana2010). Second, when observers localize the offset point of a moving target, they also tend to judge it to be ahead of the target’s motion trajectory. Unlike in the previous illusions, the target never reached the judged position. This observation was termed representational momentum (Figure 7.1b), as it was seen as evidence for a mental analogue to the momentum of moving physical objects (Freyd & Finke, Reference 394Freyd and Finke1984; for an overview, see Hubbard, Chapter 8 in this volume).Footnote 1
Beside these errors in motion direction, another error was reported at the beginning of the present century that was opposite to motion direction: In several studies, the target’s onset was found to be consistently mislocalized away from the physical onset position opposite to the direction of motion (onset-repulsion effect, Figure 7.1d; Thornton, Reference Thornton2002; see also Actis-Grosso & Stucchi, Reference Actis-Grosso and Stucchi2003; Hubbard & Motes, Reference Hubbard and Motes2002; Hubbard & Ruppel, Reference Hubbard and Ruppel2011; Kerzel, Reference Kerzel2002; Kerzel & Gegenfurtner, Reference Kerzel and Gegenfurtner2004). As in representational momentum, the target was never presented at the judged position, and this mislocalization has also been explained with reference to mental analogues of physical laws (Thornton, Reference Thornton2002).
The present chapter deals mainly with the observation of displacements of the perceived onset position. We will first give an overview about interpretations and findings of the Fröhlich effect. Then, we take into account the conditions and findings that resulted in the error opposite to motion direction (the onset-repulsion effect), and show how the conflict between the illusions might be resolved. We end the chapter with an outlook on the possible contributions of these phenomena to our understanding of perceptual processes in general.
The Mislocalization in Motion Direction: The Fröhlich Effect
Explanations of the Fröhlich effect can be roughly divided into four accounts: the sensation-time account, the metacontrast or lateral-inhibition account, the attentional account, and the mental extrapolation account.
Sensation Time
One main finding of Fröhlich was that the size of the mislocalization f increased with movement speed v, and that the ratio f/v proved to be fairly constant (Fröhlich, Reference Fröhlich1923). The fixed ratio f/v turns the spatial error into a temporal error, and Fröhlich interpreted the time constancy as an expression of the sensation time (“Empfindungszeit”). The sensation time was understood as the time between the retinal impact of light and the corresponding visual sensation (see also Kreegipuu & Allik, Reference Kreegipuu and Allik2003). Fröhlich saw the finding that the sensation time varied with the brightness of stimuli as plausible evidence for his explanation. It was, as expected, on the order of 100 msec with faint stimuli and about 50 msec with bright stimuli.
At first glance, the idea of sensation time appeared attractive to explain the localization error. However, the explanation was criticized early by the contemporaries of Fröhlich, both empirically and theoretically. Rubin (Reference Rubin1930), for instance, noted that reducing the size of the window (i.e., reducing the trajectory length) shortened the Fröhlich effect (see also Müsseler & Neumann, Reference Müsseler and Neumann1992) and thereby should also shorten the sensation time. Also, Metzger (Reference Metzger1932) proposed that the sensation time might be longer at motion onset than at positions further along the trajectory (similar the latency differences discussed to explain other spatiotemporal phenomena; e.g., see Bachmann, Reference Bachmann1999; Hubbard, Reference Hubbard and Ruppel2014; Whitney, Reference Whitney2002). However, these variations are not consistent with the basic idea of sensation time and are therefore theoretically problematic. Metzger (Reference Metzger1932) pointed out correctly that the concept of sensation time has to be applied not only to the onset of motion but to the entire motion trajectory. In this case, an observer should perceive the moving stimulus with a corresponding temporal delay, but at all positions of the trajectory.
Thus, the concept of sensation time could not provide a satisfactory answer to the question of why only the first positions were excluded from perception. Furthermore, at the time of Fröhlich it was not clear at all whether the first positions were perceptually missed or whether the first positions were simply displaced in the direction of motion.Footnote 2 Only later studies revealed that observers have indeed no access to the first positions: In experiments of Müsseler and coworkers (Müsseler & Aschersleben, Reference Müsseler and Aschersleben1998, Exp. 5; Müsseler & Tiggelbeck, Reference Müsseler and Tiggelbeck2013, Exp. 1), observers failed to detect brief pattern changes at motion onset but were better in detecting the change at positions further along the trajectory (see also Ansorge, Carbone, Becker, & Turatto, Reference Ansorge, Carbone, Becker and Turatto2010 for evidence from reaction time studies). Thus, a mechanism is called for that prevents the very first positions from being perceived.
Metacontrast Masking and Lateral Inhibition
At first sight, accounts of the Fröhlich effect based on metacontrast masking and lateral inhibition seemed to explain the low visibility of the initial part of the trajectory (cf. Carbone & Ansorge, Reference Carbone and Ansorge2008; Geer & Schmidt, Reference Geer and Schmidt2006; Kirschfeld & Kammer, Reference Kirschfeld and Kammer1999; Piéron, Reference Piéron1935). Metacontrast masking was first described by Stigler (Reference Stigler1910) and refers to the observation that the visibility of a stationary, flashed target is reduced when it is followed by a mask in its spatial vicinity (visual backward masking). Backward masking is optimal when target and mask share common stimulus boundaries, for instance, when the target is a disk and the mask is a surrounding ring. Optimal stimulus onset asynchronies (SOAs) between target and mask are between 40 msec and 100 msec and are thus within the range of the temporal error in the Fröhlich effect. Piéron (Reference Piéron1935) was the first to hypothesize the Fröhlich effect to be caused by masking mechanisms.
Lateral inhibition has been used to interpret metacontrast masking (e.g. Bridgeman, Reference 376Bridgeman2006). The basic assumption is that the presentation of a stimulus elicits excitatory and inhibitory neuronal activity in a retinotopic (cortical) map, for instance in the form of a simplified Mexican-hat function (Figure 7.2a). The inhibitory parts could be crucial for the Fröhlich effect, and Geer and Schmidt (Reference Geer and Schmidt2006) proposed that multiple inhibitory connections from neighboring space have a cumulative masking effect on early parts of the target trajectory (Figure 7.2b). The authors interpreted the effect of trajectory length accordingly by assuming that inhibition from adjacent stimulus positions accumulates across the trajectory. Therefore, the Fröhlich effect increases with trajectory length.

Figure 7.2 Simplified assumptions (a) of lateral inhibition with stationary stimuli, (b) cumulative lateral inhibition with moving stimuli with regard to Geer and Schmidt (Reference Geer and Schmidt2006), and (c) metacontrast and visual focal attention with regard to Kirschfeld and Kammer (Reference Kirschfeld and Kammer1999, fig. 6). The latter figure illustrates only the additional excitatory and inhibitory neuronal activity, which is elicited by the motion of the stimulus.
However, if the area of lateral inhibition or any other masking mechanism just moves across a retinotopic map (cf. Figure 7.2b), there is no way to explain why only the first positions are excluded from the perception. This explanatory gap was already encountered by the sensation time account. As a matter of fact, the masking account predicts that most of the trajectory (except for the last position) should become invisible, because each stimulus presentation is masked by the subsequent stimulus presentations. Clearly, that is not the case. Therefore, an additional component is needed, which explains why the target becomes visible at all. In the subsequent accounts, this function was assigned to visual attention.
Visual Attention and Its Neuronal Implementation
At the end of the 1990s, two independently developed accounts refer to attentional mechanisms to explain the Fröhlich effect. Kirschfeld and Kammer’s (Reference Kirschfeld and Kammer1999) masking-plus-focal-attention account assumed that positions on the trajectory behind the target are masked (cf. Figure 7.2c), similar to (Reference Piéron1935) ideas and nowadays postulated by Geer and Schmidt (Reference Geer and Schmidt2006). The new assumption was that positions on the trajectory before the target are pre-activated by the target itself (cf. Figure 7.2c). The authors associated this pre-activation with mechanisms similar to cue-induced visual focal attention. Thus, the approach combines mechanisms of metacontrast masking and visual focal attention.
With regard to Kirschfeld and Kammer (Reference Kirschfeld and Kammer1999), focal attention ensures that masking does not occur along the entire trajectory. However, focal attention must first be shifted to the moving stimulus, and that is why the first positions of the trajectory are excluded from perception (the Fröhlich effect). Once attention has reached the moving stimulus, it becomes visible because masking is counteracted and overcome.
To support their view, Kirschfeld and Kammer (Reference Kirschfeld and Kammer1999) presented a rotating rod that was continuously illuminated and was additionally flashed with far higher energy when it first appeared. The resulting percept was actually of two bars: a flashed bar at the correct initial position, and a moving bar that was displaced in the direction of motion (the Fröhlich effect). The interpretation was that the transient, flashed illumination of the initial orientation was strong enough to overcome masking, while the initial portion of the moving bar’s trajectory was suppressed until the pre-activation (focal attention) was established. Further, Kirschfeld and Kammer concluded that perception of the moving bar had a shorter latency than perception of the stationary flashed bar, because the moving bar appeared ahead of the flashed bar and both bars appeared simultaneously (cf. the flash-lag effect; Metzger, Reference Metzger1932; Nijhawan, Reference Nijhawan1994; Rubin, Reference Rubin1930). The conclusion that moving stimuli have shorter latencies than flashed stimuli has also been confirmed in reaction-time experiments (Aschersleben & Müsseler, Reference Aschersleben and Müsseler1999).
The other attentional account was originally developed without reference to masking mechanisms.Footnote 3 Müsseler and coworkers (Müsseler & Aschersleben, Reference Müsseler and Aschersleben1998; Müsseler & Neumann, Reference Müsseler and Neumann1992, Exp. 6) simply started from three well-accepted attentional mechanisms used to explain effects with stationary stimuli (e.g., spatial cuing effects), but which should be equally applicable to situations in which stimuli are in motion (see also Ansorge et al., Reference Ansorge, Carbone, Becker and Turatto2010; Carbone & Pomplun, Reference Carbone and Pomplun2007; Kerzel & Gegenfurtner, Reference Kerzel and Gegenfurtner2004; Müsseler, Stork, & Kerzel, Reference Müsseler, Stork and Kerzel2002): (1) the presentation of a stimulus in the visual field elicits an attentional shift toward that stimulus; (2) an attention shift takes time; (3) a phenomenal representation of a stimulus is not available before the end of the attention shift. Applied to the Fröhlich-effect situation, this means that with the presentation of a moving stimulus, a visual focus shift is initiated, and while this shift is under way, the stimulus continues to move. The first phenomenal representation of the stimulus is available at the end of the focus shift, and this is what is observed in the Fröhlich effect.
Both attentional accounts were able to explain the main findings observed with the Fröhlich effect, for instance, that the Fröhlich effect increases with increasing target velocity. The effect of stimulus brightness (or stimulus contrast; Fröhlich, Reference Fröhlich1923) can be plausibly addressed by assuming that establishing focal attention or eliciting an attentional shift is more effective with bright than with faint stimuli. Further, both accounts predicted that cuing the onset position with a stationary stimulus reduced the Fröhlich effect. The observed reduction effect was small but reliable (Adamian & Cavanagh, Reference Adamian and Cavanagh2017; Kerzel & Müsseler, Reference Kerzel and Müsseler2002; Müsseler & Aschersleben, Reference Müsseler and Aschersleben1998; Whitney & Cavanagh, Reference Whitney and Cavanagh2000a). Finally, they explain why mislocalizations are more pronounced in the Fröhlich effect than in the flash-lag effect: At the beginning of the movement, attention is far from the moving object and a large mislocalization results. As the motion progresses, attention catches up with the moving object and the mislocalization is reduced (Müsseler et al., Reference Müsseler, Stork and Kerzel2002).
However, the attentional accounts have also serious problems with some findings: for instance, that an increase of trajectory length led to an increase of the Fröhlich effect (Rubin, Reference Rubin1930; Müsseler & Neumann, Reference Müsseler and Neumann1992, Exp. 6). The authors of the masking-plus-focal-attention account (Kirschfeld & Kammer, Reference Kirschfeld and Kammer1999) might integrate Geer and Schmidt’s (Reference Geer and Schmidt2006) assumption that inhibition from adjacent stimulus positions accumulates across the trajectory, which leads to larger Fröhlich effects with longer trajectories. The attention-shifting account of Müsseler and Aschersleben (Reference Müsseler and Aschersleben1998) has more difficulties to accommodate this finding. The solution could be a modification of their third assumption, which claims that a phenomenal representation of a stimulus is not available before the end of the attention shift. This claim may be too strong. Note that shifting attention toward a stimulus implies at least coarse knowledge of the stimulus location prior to the start of the shift. What happens when an attention shift cannot be successfully completed, as would be the case when the moving target has a short trajectory and has already disappeared from the screen? Taking the third assumption literally, no stimulus should be perceived at all. It is more likely that the coarse representation of the stimulus at the beginning of the attention shift together with the incoming position information during the shift establishes what is seen. In any case, the perceived position should be closer to the starting position, i.e., the Fröhlich effect would be decreased.
Another point is that both attentional approaches use different levels of description. While Kirschfeld and Kammer (Reference Kirschfeld and Kammer1999) selected a neuronal level of description to address masking and attentional processes, the attention shifting account of Müsseler and coworkers (Müsseler & Aschersleben, Reference Müsseler and Aschersleben1998; Müsseler & Neumann, Reference Müsseler and Neumann1992) was framed in a functional formal way, which leaves the neuronal processes unspecified. Therefore, Müsseler et al. (Reference Müsseler, Stork and Kerzel2002; see also Müsseler & Tiggelbeck, Reference Müsseler and Tiggelbeck2013) attempted to identify the attention-shifting component in the neuronal models of Kirschfeld and Kammer (Reference Kirschfeld and Kammer1999) and particularly in the dynamic-field account of Jancke and Erlhagen (Jancke et al., Reference Jancke, Erlhagen, Dinse, Akhavan, Giese and Steinhage1999; Jancke & Erlhagen, Reference Jancke, Erlhagen, Nijhawan and Khurana2010). The dynamic-field account, originally developed to explain the activity of neuronal populations in the primary visual cortex of the cat (Jancke et al., Reference Jancke, Erlhagen, Dinse, Akhavan, Giese and Steinhage1999) and then successfully applied to perceptual mislocalizations with moving stimuli (for an overview, see Jancke & Erlhagen, Reference Jancke, Erlhagen, Nijhawan and Khurana2010), assumes that the presentation of a stimulus forms an activation pattern that is not restricted to the area covered by the stimulus (see also Hubbard, Reference Hubbard1994). Rather, it spreads its activation to and integrates contextual information from the adjacent parts of the visual field. Therefore, in response to an afferent input, the activation is assumed to interact with new incoming information and, thus, modifies suprathreshold activity.
When a stimulus moves through the visual field, it can be assumed that the incoming information contributes to and modifies the activation pattern in such a way that a stimulus-driven bow wave of activity occurs, which moves continuously across the visual scene (Müsseler et al., Reference Müsseler, Stork and Kerzel2002). Depending on velocity, it peaks at or even ahead of the leading edge of the stimulus. Since the Fröhlich effect emerges in the buildup phase of the bow wave, activation is accumulated starting from the resting level. The movement resulted in a skew wave that exceeds the perceptual threshold (distance between resting level and supraliminal activation), and the Fröhlich effect is observed. It has been suggested that spreading subthreshold activation constitutes a neuronal correlate of a cue-induced attentional mechanism that alters the processing of spatial information (Bocianski, Müsseler, & Erlhagen, Reference Bocianski, Müsseler and Erlhagen2008, Reference Bocianski, Müsseler and Erlhagen2010; Kirschfeld & Kammer, Reference Kirschfeld and Kammer1999; Müsseler & Tiggelbeck, Reference Müsseler and Tiggelbeck2013; Steinman, Steinman, & Lehmkuhle, Reference Steinman, Steinman and Lehmkuhle1995). We will return to this point later in the chapter.
Mental Extrapolation (Visual Prediction)
Mental extrapolations often occur in everyday life. When, for instance, a tennis ball flies through the visual scene, a spatial lag between the ball’s position in the real world and its perceived position should emerge from neuronal transmission latencies. In order to hit the ball with a racket successfully, there must be some form of compensation, and this compensation might be in the motor system (e.g., Kerzel & Gegenfurtner, Reference Kerzel and Gegenfurtner2004). It overcomes the lag by predicting the position of the moving target forward.
However, in Nijhawan’s view (Reference Nijhawan1994, Reference Nijhawan2008; see also Hubbard, Chapter 9 in this volume), the lag is compensated not only by motor predictions but also by visual predictions. In this view, the flash-lag effect can be understood as the visualized percept of this prediction. The flash lags because the visual system extrapolates the position of the moving target, and this is what is seen. Thus, in the strong version of the extrapolation assumption, stimuli in motion are perceived at their real-time positions and do not lag behind. Alternative accounts assume different perceptual latencies for the flash and the moving target (e.g., Baldo & Klein, Reference Baldo and Klein1995; Whitney & Murakami, Reference Whitney and Murakami1998).
The extrapolation assumption is controversially debated (see, e.g., the discussion in Baldo & Klein, Reference Baldo and Klein2008; Krekelberg, Reference Krekelberg2008; Nijhawan, Reference Nijhawan2008; Whitney, Reference Whitney2008). Although also seen as an explanation for the Fröhlich effect (e.g., Maus, Weigelt, Nijhawan, & Muckli, Reference Maus, Weigelt, Nijhawan and Muckli2010), it is especially difficult to see how an extrapolation mechanism works at the onset position of moving stimuli. Predicting future positions of a target requires some knowledge about the target’s motion direction and velocity. As there is no preceding motion trajectory at motion onset, it is unclear how extrapolation could account for the Fröhlich effect. Here one must probably recruit mechanisms that have been introduced in the previous sections.
As a last remark, it should be noted here that a predictive component also exists in the masking-plus-focal-attention account (Kirschfeld & Kammer, Reference Kirschfeld and Kammer1999) and in the bow-wave account or dynamic field model, respectively (Jancke & Erlhagen, Reference Jancke, Erlhagen, Nijhawan and Khurana2010; Müsseler, et al., Reference Müsseler, Stork and Kerzel2002). The difference is that visual prediction determines the percept while a pre-activation only prepares an area for the target to be seen.
Taking into Account the Mislocalization Opposite to the Direction of Motion: The Onset-Repulsion Effect
As already noted in the Introduction, some studies also found mislocalization opposite to the direction of motion. Note that this error is contrary to the Fröhlich effect: In the onset-repulsion effect (Thornton, Reference Thornton2002), the judged onset position of the target was found to be consistently mislocalized opposite to the direction of motion (Figure 7.1d; see also Actis-Grosso & Stucchi, Reference Actis-Grosso and Stucchi2003; Hubbard & Motes, Reference Hubbard and Motes2002; Hubbard & Ruppel, Reference Hubbard and Ruppel2011; Kerzel, Reference Kerzel2002; Kerzel & Gegenfurtner, Reference Kerzel and Gegenfurtner2004).
Studies concerned with the onset-repulsion effect sometimes revealed contradictory findings. For instance, some studies found that an increment in velocity shifted the judged onset further opposite to motion direction (Kerzel, Reference Kerzel2002; Thornton, Reference Thornton2002), whereas other studies did not find any effect of velocity (Actis-Grosso & Stucchi, Reference Actis-Grosso and Stucchi2003; Hubbard & Motes, Reference Hubbard and Motes2002; Kerzel, Reference Kerzel2002; Müsseler & Kerzel, Reference Müsseler and Kerzel2004). Some authors found the onset-repulsion effect only with a relative judgment task (Kerzel, Reference Kerzel2002), whereas others did so also with an absolute positioning task (Müsseler & Kerzel, Reference Müsseler and Kerzel2004; Thornton, Reference Thornton2002). Further, the onset-repulsion effect seems to depend on motion type and motion direction. It is largest with smooth, continuous motions and decreases with implied motions (Kerzel, Reference Kerzel2004; Thornton, Reference Thornton2002). Finally, upward motion or right-to-left motion resulted in stronger onset-repulsion effects than downward or left-to-right motion (Thornton, Reference Thornton2002).
It is obvious that accounts in terms of sensation time, metacontrast, or attention simply do not apply to these findings, most obviously because perceptual processes could never have been triggered at positions where the target was never presented (opposite to target motion). Instead, explanations of the onset-repulsion effect often refer to non-perceptual mechanisms. For instance, it is possible that the onset position is accurately perceived but is distorted during the delay before the judgment is made. In this case the onset-repulsion effect would originate from a memory failure, similar to the proposed mechanisms underlying representational momentum (Freyd & Finke, Reference 394Freyd and Finke1984; for an overview, see Hubbard, Chapter 8 in this volume). It is also possible that in this case observers have an imprecise percept of the onset position and tend to estimate the origin of the motion post hoc, which is subject to biases (see discussion below).
However, mislocalizations of the type of representational momentum are in the direction of motion, and a mechanism is needed to explain why the onset-repulsion effect is in the opposite direction. Therefore, it has been discussed that estimations of the onset position run backward along the observed trajectory, as this reflects more natural, physical tendencies (Thornton, Reference Thornton2002). In the same vein, Runeson (Reference Runeson1974) reported that observers perceive an illusory deceleration at the onset of a motion even when the physical velocity is constant. This may result in an opposite error if the post hoc estimation of the onset position is calculated on the basis of constant motion along the entire trajectory.
The most critical point, however, is how to explain the contrary findings of the Fröhlich and onset-repulsion effects. It turned out that the experimental procedures used to measure the mislocalizations were quite different. In reports of the Fröhlich effect, observers were able to predict where the moving target would appear. For instance, the moving target always appeared at the fixed edge of a window (Fröhlich, Reference Fröhlich1923) or at two fixed eccentricities to the left or right of fixation (Müsseler & Aschersleben, Reference Müsseler and Aschersleben1998). In reports of the onset-repulsion effect, however, the moving target appeared randomly in a relatively large area (Hubbard & Motes, Reference Hubbard and Motes2002; Thornton, Reference Thornton2002), and observers were unable to predict the onset positions.
To examine the hypothesis that the error in motion direction (the Fröhlich effect) and the error opposite to motion direction (the onset-repulsion effect) originated from the predictability of onset positions, Müsseler and Kerzel (Reference Müsseler and Kerzel2004; see also Müsseler et al., Reference Müsseler, Stork and Kerzel2008) conducted experiments in which two different trial contexts were used. In the random context, the target appeared mostly at a random onset position in a large area of the computer screen (similar to Thornton, Reference Thornton2002), but in one-sixth of the trials the target appeared about 6.6° to the left or right of fixation (Figure 7.3). Only these trials of the random-context condition were compared with the trials of the constant-context condition, in which the target always appeared at the onset positions to the left or right of fixation (similar to Müsseler & Aschersleben, Reference Müsseler and Aschersleben1998). The judgments showed a huge difference between context conditions: The onset was localized –0.5° opposite to the direction of motion in the random-context condition (onset-repulsion effect) and 1.5° in the direction of motion in the constant-context condition (the Fröhlich effect). Thus, low predictability of onset positions led to the error opposite to the direction of motion, while high predictability of onset positions led to the error in the direction of motion.Footnote 4

Figure 7.3 Trial contexts and findings of Müsseler and Kerzel (Reference Müsseler and Kerzel2004, Exp. 1). In the constant-trial context, the target always appeared at constant onset positions (OP, black dots) to the left or right from fixation. In the random-trial context, the target appeared mostly at random OPs (grey dots) in a 30 x 30° field of the computer screen, but in one-sixth of the trials also at the constant OPs. In the data analysis, only these trials were compared with the trials of the constant context. The results showed that the onset was localized opposite to the direction of motion with the random context (negative localization error of –0.5°; the onset-repulsion effect) and in the direction of motion with the constant context (positive localization error of 1.5°; the Fröhlich effect).
With other authors (Actis-Grosso & Stucchi, Reference Actis-Grosso and Stucchi2003; Kerzel, Reference Kerzel2002; Kerzel & Gegenfurtner, Reference Kerzel and Gegenfurtner2004; Thornton, Reference Thornton2002), we assumed that the difference between context conditions originates from an error in the judgment phase. When positional predictability is low, as is the case in the random-context condition, observers may notice a target relatively late, and with every new trial they might become aware of a possible localization error. To avoid this error, they may overcompensate and point to positions opposite to motion. Consistent with strategic adjustments, differences between the random-context and constant-context conditions were visible after about 15–35 trials (Müsseler & Kerzel, Reference Müsseler and Kerzel2004, Exp. 4).
However, further experiments by Müsseler and Tiggelbeck (Reference Müsseler and Tiggelbeck2013) cast doubts on the overcompensation explanation. With regard to the overcompensation explanation, the error opposite to motion direction is assumed not to be a perceptual one, but to result from the tendency in the judgment phase to correct for the possible spatial error. Consequently, an overcompensation mechanism should mainly affect a localization task, but not a discrimination task. In an experiment of Müsseler and Tiggelbeck (Reference Müsseler and Tiggelbeck2013, Exp. 1), moving targets either started out as squares and changed to circles at different positions on the trajectory, or appeared as circles and did not change (cf. also Ansorge et al., Reference Ansorge, Carbone, Becker and Turatto2010). Observers’ task was to discriminate whether or not they perceived a square during the motion of the target. The overcompensation account expected equal or worse discrimination performance in the random-context condition than in the constant-context condition. This result would point out a response bias, which compensates for a possible localization error in the judgment phase. However, the contrary finding was observed: When the squares appeared in the very first positions of the motion, better discrimination performance was found in the random-context condition than in the constant-context condition. Thereafter, the difference between context conditions vanished.
This finding was somewhat surprising, as it indicated worse perceptual performance in the constant-context condition. And this disadvantage of the constant-context condition was somewhat counterintuitive: When stimuli always appeared at predictable left/right positions, as is the case in the constant-context condition, observers could direct their attention to both positions in advance (parallel allocation of visual attention to two positions; cf. Awh & Pashler, Reference Awh and Pashler2000; Cave, Bush, & Taylor, Reference Cave, Bush and Taylor2010; Franconeri, Alvarez, & Enns, Reference Franconeri, Alvarez and Enns2007; but see also Jans, Peters, & De Weerd, Reference Jans, Peters and DeWeerd2010). Directing attention to a position usually improves spatial localization in this area, as was found in several studies with stationary targets (e.g., Bocianski et al., Reference Bocianski, Müsseler and Erlhagen2008, Reference Bocianski, Müsseler and Erlhagen2010; Tsal & Bareket, Reference Tsal and Bareket1999, Reference Tsal and Bareket2005; Tsal, Meiran, & Lamy, Reference Tsal, Meiran and Lamy1995; Yeshurun & Carrasco, Reference Yeshurun and Carrasco1999). Therefore, observers in the constant-context condition of Müsseler and Tiggelbeck (Reference Müsseler and Tiggelbeck2013) had not directed their attention to the left/right onset positions, or alternatively, directing attention to these positions produced worse localization performance.
To examine the last possibility, Müsseler and Tiggelbeck (Reference Müsseler and Tiggelbeck2013, Exp. 3) used an exogenous cue to direct attention in the random-context condition. The cue was presented at the onset positions, 280 msec before the moving target appeared. If, with moving stimuli, directing attention results in worse localization performance, presenting the cue should result in comparable mislocalizations in both context conditions. And this was what the results actually showed. When the cue preceded the motion onset, the localization error of the random-context condition increased in size relative to the localization error of the constant context.Footnote 5 Thus, Müsseler and Tiggelbeck’s experiments delivered consistent results. When observers allocated their attention to the onset position, worse discrimination performance (Exp. 1) went hand in hand with worse localization precision (Exp. 3).
An issue that remains unexplained is why attention improves discrimination and localization performance with stationary stimuli while it seems to impair discrimination and localization precision at the onset position of moving stimuli. We speculated that, contrary to stationary stimuli, moving stimuli require fast spatial disengagement (Petersen & Posner, Reference Petersen and Posner2012) from the previously attended position in order to follow the stimulus, especially at the onset position. It seems plausible that this disengagement could impair processing.
How to implement this idea in the neuronal dynamic field model discussed in the previous section? Bocianski et al. (Reference Bocianski, Müsseler and Erlhagen2008, Reference Bocianski, Müsseler and Erlhagen2010) already applied the model to an illusion with stationary stimuli and extended it by integrating a top–down attentional mechanism. In the empirical part of their paper, observers were confronted with blockwise presentations, similar to the random and constant context used by Müsseler and Kerzel (Reference Müsseler and Kerzel2004). The authors assumed that the blockwise presentation of a target at constant positions modulates the attentional baseline by arousing a peak at attended locations and by suppressing all other locations (for neuronal evidence see, e.g., Bestmann, Ruff, Blakemore, Driver, & Thilo, Reference Bestmann, Ruff, Blakemore, Driver and Thilo2007; Smith, Singh, & Greenlee, Reference Smith, Singh and Greenlee2000). Empirical and modeling data showed that localization precision was improved when the static target was presented in the attended area (Bocianski et al., Reference Bocianski, Müsseler and Erlhagen2010).
When, instead of stationary stimuli, a moving target is presented at the attended area, the only assumption to add is that the target might have left the region of the attentional peak already before a suprathreshold activity is reached. Moreover, the new incoming information of the target may interact within the previous activation pattern, which may additionally impair localization performance. In a sense, the postulated mechanism is similar to that accounting for effects of spatial disengagement from previously attended positions.
Note that this extension of the neuronal dynamic field model can only account for the observed differences between the random and constant context – that is, for the clear mislocalizations in motion direction in the constant-context condition and the more or less precise localizations in the random-context condition. It cannot account for the onset-repulsion effect per se – that is, for the error opposite to motion direction.
Conclusions
The present chapter focused initially on the Fröhlich effect – the localization error at the onset position in motion direction. In the nearly century-old scientific debate on this illusion, different accounts were considered and discarded, among them the sensation-time account and the masking account. But it is worth emphasizing that these accounts did not simply disappear, but have been modified by additional findings. For instance, the sensation-time assumption is still discussed in the context of the flash-lag effect, with different latencies for the flash and the moving target (e.g., Baldo & Klein, Reference Baldo and Klein2008; Krekelberg, Reference Krekelberg2008; Whitney, Reference Whitney2008), or in the context of the Fröhlich effect, with longer latencies at the onset position than at later positions on the trajectory (e.g., Aschersleben & Müsseler, Reference Aschersleben and Müsseler1999; Kirschfeld & Kammer, Reference Kirschfeld and Kammer1999).
The underlying processing mechanisms in localizing the onset position of moving stimuli were further clarified by the discovery of the onset-repulsion effect, that is, the error opposite to motion direction. As it turned out in several studies, the localization judgments varied strongly with trial context. Perceived starting positions were in the direction of motion in constant-context conditions and opposite to motion direction (or at least essentially reduced) in random-context conditions (Müsseler & Kerzel, Reference Müsseler and Kerzel2004; Müsseler & Tiggelbeck, Reference Müsseler and Tiggelbeck2013; Müsseler et al., Reference Dodds, van Belle, Peers, Dove, Cusack and Duncan2008). It is likely that when stimuli always appear at predictable positions, as is the case in the constant-context condition, observers direct their attention to the positions in advance. However, one would expect that localization precision is improved, whereas the opposite was found. Localization precision and discrimination performance was worse with constant than with random context.
Trial context was also found to affect localization judgments with stationary stimuli (Bocianski et al., Reference Bocianski, Müsseler and Erlhagen2008, Reference Bocianski, Müsseler and Erlhagen2010), but here the findings were as expected (see also Tsal & Bareket, Reference Tsal and Bareket1999, Reference Tsal and Bareket2005; Tsal et al., Reference Tsal, Meiran and Lamy1995; Yeshurun & Carrasco, Reference Yeshurun and Carrasco1999). Localization precision was better with constant-context conditions than with random-context conditions. To account for these differences in the findings between stationary and moving stimuli, we speculated that moving stimuli require a spatial disengagement from the previously attended onset position in order to follow the target. It seems plausible that this attentional disengagement could impair processing. Certainly, this idea needs further confirmation, but if this conclusion proves to be true, attentional disengagement should be at the heart of explanations of the Fröhlich effect.
Memory for the final location of a moving target is often displaced in the direction of anticipated motion, and this is referred to as representational momentum (Freyd & Finke, Reference 394Freyd and Finke1984). Overviews of variables that influence representational momentum were presented in Hubbard (Reference Hubbard1995c, Reference Hubbard2005b, Reference Hubbard2014a), and comparisons of representational momentum with other types of momentum-like effect were presented in Hubbard (Reference Hubbard2014a, Reference Hubbard2015b, Reference Hubbard2017). This chapter consolidates earlier lists of variables that influence representational momentum into a single comprehensive catalog. Such a consolidation should be useful for future studies of representational momentum and other momentum-like effects (e.g., variables that influence representational momentum might be hypothesized to have analogous effects on other momentum-like effects). In addition, suggestions regarding a few properties of representational momentum, and the relationship of representational momentum with other spatial biases, are provided. As theories of representational momentum were addressed in Hubbard (Reference Hubbard, Nijhawan and Khurana2010), and discussion linking representational momentum with other momentum-like effects was provided in Hubbard (Reference Hubbard2014a, Reference Hubbard2015b, Reference Hubbard2017), those issues are not discussed here.
A common stimulus presentation method (implied motion) and response measure (probe judgment) used in studies of representational momentum are illustrated in Figure 8.1. In the top panel, three sequential presentations of a target (inducing) stimulus implying motion from left to right are shown. A fourth (probe) stimulus is shown, and the probe is located behind the final location of the target (i.e., shifted in the direction opposite to target motion), at the same location as the final location of the target, or beyond the final location of the target (i.e., shifted in the direction of target motion). Participants judge whether the probe is at the same location where the target vanished or at a different location. In the bottom panel, probability of a same response is plotted as a function of probe location, and representational momentum is indicated by the greater likelihood of a same response to a probe slightly beyond the final location than to a probe slightly behind the final location. Other methods of stimulus presentation include smooth continuous motion of a target or presentation of a single static target drawn from a longer motion sequence (e.g., a photograph of a dancer in mid-leap). Other methods of response measurement include using a computer mouse to position the cursor at the judged location or touching the display at the judged location.
Figure 8.1 An illustration of a typical methodology and results for an experiment assessing representational momentum. In Panel A, the large rectangles indicate the outlines of the display, and the small black squares indicate the target (left) or probe (right). There are three consecutive appearances of inducing stimuli that comprise the target. In this example, the target exhibits implied rightward motion (typically, each inducing stimulus is presented for 250 msec, and there is a 250-msec interstimulus interval between successive inducing stimuli and between the final inducing stimulus and probe). A probe is presented, and position of the probe relative to the actual final position of the target varies across trials (five potential probe positions are shown in the column on the right). In Panel B, a hypothetical but typical distribution of same responses as a function of probe position is illustrated. The presence of representational momentum is indicated by the higher probability of same responses to probes forward of the final actual target location than to probes backward of the actual final target location.
Variables That Influence Representational Momentum
Hubbard (Reference Hubbard2005b) organized variables that influence representational momentum into categories related to the target, display, context, or observer. A similar scheme is followed here. Some variables have been manipulated in numerous studies (e.g., target velocity), but discussion for each variable is limited to studies that initially demonstrated the effect or an important constraint of that variable.
Characteristics of the Target
Variables influencing representational momentum that are related to the target include (a) velocity, (b) distance traveled, (c) direction, (d) shape, (e) identity and semantic category, (f) size, (g) eccentricity, (h) visual field, (i) involvement of a human form, and (j) nonvisual stimuli.
Velocity. Faster target velocity generally leads to larger forward displacement (e.g., Freyd & Finke, Reference Freyd and Finke1985; Hubbard & Bharucha, Reference 408Hubbard and Bharucha1988; de sá Teixeira, Hecht, & Oliveira, Reference de sá Teixeira, Hecht and Oliveira2013). If final instantaneous velocity is constant, then a previously accelerating or decelerating target exhibits larger or smaller, respectively, forward displacement (Actis-Grosso, Bastianelli, & Stucchi, Reference Actis-Grosso, Bastianelli and Stucchi2008; Finke, Freyd, & Shyi, Reference Finke, Freyd and Shyi1986). Visual targets or auditory targets with an irregular velocity exhibit less representational momentum, presumably due to decreased predictability of the target (Getzmann & Lewald, Reference Getzmann and Lewald2009). Effects of velocity are diminished (a) with increases in implied friction (Hubbard, Reference Hubbard1995b), (b) if a target is initially stationary and subsequent motion is attributed to contact from another object (Hubbard & Ruppel, Reference Hubbard and Ruppel2002), (c) at very high velocities (Munger & Minchew, Reference Munger and Minchew2002), and (d) for single targets exhibiting continuous motion if observers cannot visually track that target (Kerzel, Jordan, & Musseler, Reference Kerzel, Jordan and Müsseler2001). A velocity effect has been found for changes in auditory pitch (Freyd, Kelly, & DeKay, Reference Freyd, Kelly and DeKay1990; see also Hubbard, Reference Hubbard1995a).
Distance. In most studies of representational momentum, distance traveled by the target is not a factor. Targets travel a fixed distance on every trial (e.g., 34 degrees of rotation, Freyd & Finke, Reference 394Freyd and Finke1984) or different distances of travel are counterbalanced or randomized across trials (e.g., Hubbard & Bharucha, Reference 408Hubbard and Bharucha1988). However, representational momentum decreases with increasing distance traveled by a launched target (Choi & Scholl, Reference Choi and Scholl2006; Hubbard & Ruppel, Reference Hubbard and Ruppel2002).Footnote 1 Forward displacement decreases with increases in distance traveled by the target for patients with neglect or patients with right hemisphere damage, but not for control participants (McGeorge, Beschin, Colnaghi, Rusconi, & Della Sala, Reference McGeorge, Beschin and Della Sala2006). Relatedly, forward displacement decreases as a target approaches a boundary (Hubbard & Motes, Reference Hubbard and Motes2005) or edge of the display (de sá Teixeira & Oliveira, Reference de sá Teixeira and Oliveira2011); however, this latter finding probably reflects expected change in target motion rather than distance traveled.
Direction. Horizontal motion in the picture plane leads to larger forward displacement than does vertical motion, and downward motion leads to larger forward displacement than does upward motion (Hubbard, Reference Hubbard1990; Hubbard & Bharucha, Reference 408Hubbard and Bharucha1988). Differences between leftward motion and rightward motion are usually not found (e.g., Cooper & Munger, Reference Cooper, Munger, Eilan, McCarthy and Brewer1993; Hubbard, Reference Hubbard1990), but when a difference is found, rightward motion is larger (e.g., Halpern & Kelly, Reference Halpern and Kelly1993). Forward displacement occurs for target motion in depth (e.g., Hayes, Sacher, Thornton, Sereno, & Freyd, Reference Hayes, Sacher, Thornton, Sereno and Freyd1996) and is larger when motion is away from the observer (Hubbard, Reference Hubbard1996a; Nagai, Kazai, & Yagi, Reference Nagai, Kazai and Yagi2002). Forward displacement along the line of sight occurs with motion of an observer’s viewpoint through a scene (Munger, Owens, & Conway, Reference Munger, Owens and Conway2005; Thornton & Hayes, Reference Thornton and Hayes2004). Forward displacement occurs for objects rotating in depth, and displacement is larger when rotation is around an axis that corresponds to observers’ and objects’ coordinate systems (Munger, Solberg, Horrocks, & Preston, Reference Munger, Solberg, Horrocks and Preston1999). Differences in displacement for rotation within the picture plane are usually not reported, although one study found displacement for a target moving along a rectangular clock frame was larger for clockwise motion than for counterclockwise motion (Joordens, Spalek, Razmy, & van Duijn, Reference Bartolomeo, Urbanski, Chokron, Chainay, Moroni and Siéroff2004), and rotation is larger for targets rotating downward than rotating upward (Munger & Minchew, Reference Munger and Minchew2002; Munger & Owens, Reference Munger and Owens2004). Displacement for a target following a circular path is forward along the tangent and inward toward the center (Hubbard, Reference Hubbard1996b).
Shape. The majority of studies of representational momentum presented stimuli consisting of geometric shapes. If each inducing stimulus within a trial is a radically different shape, forward displacement does not occur; however, if inducing stimuli imply a consistent change of shape of a single object (e.g., growing consistently thinner, taller, larger, etc.), then forward displacement in the direction of implied change occurs (Kelly & Freyd, Reference Kelly and Freyd1987; White, Minor, Merrell, & Smith, Reference White, Minor, Merrell and Smith1993). Implied drag does not influence forward displacement of square or rectangular translating targets or rotating pyramid shapes (Cooper & Munger, Reference Cooper, Munger, Eilan, McCarthy and Brewer1993), although in a more extreme case, a line moving parallel to its major axis (i.e., its smaller edge facing the direction of motion) exhibited larger forward displacement than did a line moving parallel to the direction of its minor axis (Hubbard, Reference Hubbard2005a). Displacement is larger if an object moves in the direction it points (Freyd & Pantzer, Reference Freyd, Pantzer, Smith, Ward and Finke1995) or faces (Nagai & Yagi, Reference Nagai and Yagi2001; Vinson & Reed, Reference Vinson and Reed2002).
Identity. If a target is given a verbal label suggesting a specific direction of motion, displacement is larger in that direction. For example, an ambiguous shape exhibited larger forward displacement for upward motion if that shape was labeled “rocket” than if labeled “steeple” (Reed & Vinson, Reference Reed and Vinson1996). This suggests displacement is influenced by object-specific information, and such information is more likely to influence displacement if the target is prototypical of its category and has a typical direction of motion (Nagai & Yagi, Reference Nagai and Yagi2001; Vinson & Reed, Reference Vinson and Reed2002). Forward displacement is increased if an object moves in the direction of its typical (forward) motion (e.g., an airplane moving forward) than if that object moves in an atypical (backward) direction (Nagai & Yagi, Reference Nagai and Yagi2001).
Size. Implied mass of pyramid-shaped objects that rotate in depth does not influence forward displacement (Cooper & Munger, Reference Cooper, Munger, Eilan, McCarthy and Brewer1993). Larger horizontally moving targets exhibit greater downward displacement than do smaller targets, larger downward-moving targets exhibit larger downward displacement than do smaller targets, and larger upward-moving targets exhibit smaller forward displacement than do smaller targets (Hubbard, Reference Hubbard1997, Reference Hubbard1998); this suggests effects of size (mass) are represented by effects of weight, as weight is experienced in the direction of gravitational attraction (i.e., the vertical axis) and not in the direction of motion. More generally, represented location of a target is influenced by implied gravitational attraction (Hubbard, Reference Hubbard1990, Reference Hubbard1997), and this has been referred to as representational gravity (see de sá Teixeira, Reference de sá Teixeira2014; de sá Teixeira & Hecht, Reference Brendel, Hecht, DeLucia and Gamer2014; Hubbard, Reference Hubbard1995c, Reference Hubbard2005b; Motes, Hubbard, Courtney, & Rypma, Reference Dodds, van Belle, Peers, Dove, Cusack and Duncan2008; Zago, Chapter 10 in this volume). If participants estimate how long it would take to stop a moving target, more dense (massive) targets are estimated to take more effort, but not more time, to stop; this has been interpreted as suggesting mass and velocity might interact in representational momentum (de sá Teixeira, Oliveira, & Amorim, Reference 441Peyrin, Michel and Schwartz2010).
Eccentricity. Some studies reported representational momentum for a continuously moving target did not occur if participants maintained central fixation and could not track the target (e.g., de sá Teixeira, Hecht, & Oliveira, Reference de sá Teixeira, Hecht and Oliveira2013; Kerzel, Reference Kerzel2000), and so there was little initial incentive to look for effects of eccentricity on representational momentum. However, one study reported representational momentum for visual targets and auditory targets increased as final target location moved from central to paracentral regions of the visual field and decreased as the final target location moved from paralateral to lateral regions of the visual field (Schmiedchen, Freigang, Rubsamen, & Richter, Reference Rastelli, Tallon-Baudry, Migliaccio, Toba, Ducorps and Pradat-Diehl2013). For visual targets, the initial increase probably reflects decreases in resolution acuity in paracentral and paralateral regions (cf., increase in forward displacement of blurred targets, Fu, Shen, & Dan, Reference Fu, Shen and Dan2001). The reason for the pattern with auditory targets is less clear.
Visual Field. If a stimulus changing in size is presented on the midline of the visual field, and probes are presented to the left or right visual field, representational momentum for size is larger for probes in the left visual field with a retention interval of 500 msec, but this difference vanishes with longer retention intervals (White et al., Reference White, Minor, Merrell and Smith1993). Similarly, representational momentum for location in the picture plane is larger if targets are in the left than in the right visual field (Gottwald, Lawrence, Hayes, & Khan, Reference Gottwald, Lawrence, Hayes and Khan2015; Halpern & Kelly, Reference Halpern and Kelly1993). When targets are lower in the picture plane, representational momentum is larger for vertically moving objects (Hubbard, Reference Hubbard2001) and horizontally moving objects in the left visual field (Gottwald et al., Reference Gottwald, Lawrence, Hayes and Khan2015).
Human Form. Presentation of animated human figures (Verfaillie & Daems, Reference Verfaillie and Daems2002) or point-light walkers (Verfaillie, De Troy, & Van Rensbergen, Reference Verfaillie, De Troy and Van Rensbergen1994) leads to forward displacement for postures of those figures; however, one study found displacement for point-light characters limited to characters presented on a textured surface or from a static viewpoint (Jarraya, Amorim, & Bardy, Reference Jarraya, Amorim and Bardy2005). Representational momentum occurs for faces changing from a neutral to a more extreme expression (Uono, Sato, & Toichi, Reference 441Peyrin, Michel and Schwartz2010, Reference Lewkowicz and Minar2014; Yoshikawa & Sato, Reference Yoshikawa and Sato2006, Reference Yoshikawa and Sato2008; but see Thornton, Reference Thornton2014). Representational momentum occurs for changes in the direction in which a face is oriented, but is reduced when gaze direction of that face differs from the direction in which the face is oriented (Hudson, Liu, & Jellema, Reference Doricchi, Merola, Aiello, Guariglia, Bruschini and Gevers2009) or emotional expression was inconsistent with approach toward the observer (Hudson & Jellema, Reference Hudson and Jellema2011). Representational momentum occurs for hand gestures in sign language; displacement is larger for gestures in the typical direction of motion than in the reversed direction, but this might reflect differences in awkwardness of motion rather than semantic meaningfulness (Wilson, Lancaster, & Emmorey, Reference 441Peyrin, Michel and Schwartz2010). Such an awkwardness effect does not occur with a static stimulus (Munger, Reference Munger2015). Representational momentum for animation of a human hand is influenced by expectations regarding whether that hand would reach toward or withdraw from an object (Hudson, Nicholson, Ellis, & Bach, Reference Hudson, Nicholson, Ellis and Bach2016; Hudson, Nicholson, Simpson, Ellis, & Bach, Reference Hudson, Nicholson, Simpson, Ellis and Bach2016).Footnote 2
Nonvisual Stimuli. Remembered final pitch of a stimulus changing in auditory frequency exhibits forward displacement in pitch (Freyd et al., Reference Freyd, Kelly and DeKay1990; Hubbard, Reference Hubbard1995a; Johnston & Jones, Reference Johnston and Jones2006; Kelly & Freyd, Reference Kelly and Freyd1987). Remembered location in physical space of a sound source translating in the picture plane is displaced in the direction of motion (Getzmann & Lewald, Reference Getzmann and Lewald2007; Getzmann, Lewald, & Guski, Reference Bartolomeo, Urbanski, Chokron, Chainay, Moroni and Siéroff2004). Forward displacement for location of a moving sound source occurs at the beginning and end, but not middle, of the trajectory (Getzmann & Lewald, Reference Getzmann and Lewald2007). Oculomotor behavior does not influence auditory representational momentum for a moving sound source (Getzmann, Reference Getzmann2005). When pitch rises and falls in a predictable manner, displacement in final pitch is backward when listeners expect direction of pitch motion to reverse (Johnston & Jones, Reference Johnston and Jones2006). Representational momentum for a moving sound source increases as vanishing point moves from central to paracentral regions and decreases as vanishing point moves from paralateral to lateral regions (Schmiedchen et al., Reference Rastelli, Tallon-Baudry, Migliaccio, Toba, Ducorps and Pradat-Diehl2013). Changes in grasp aperture consistent with representational momentum occur when participants grasp opening or closing visual pliers (Brouwer, Thornton, & Franz, Reference Brouwer, Thornton and Franz2005) or two visual spheres moving toward or away from each other (Brouwer, Franz, & Thornton Reference Bartolomeo, Urbanski, Chokron, Chainay, Moroni and Siéroff2004).
Characteristics of the Display
Variables influencing representational momentum that are related to the display include (a) surface form, (b) whether the participant controls target motion, (c) retention interval, (d) prior probability a same response to a probe would be correct, (e) response measure, and (f) contrast between target and background.
Surface Form. The term “surface form” refers to the format in which the target is presented, and three formats have been used. The first is frozen-action photographs, and these are single static images drawn from a larger motion sequence (e.g., a person walking or jumping; e.g., Freyd, Reference Freyd1983; Futterweit & Beilin, Reference Futterweit and Beilin1994).Footnote 3 The second is implied motion (as in Figure 8.1), and this involves a series of separate static stimuli that imply motion in a specific direction (e.g., a series of rectangles at different orientations; Freyd & Finke, Reference 394Freyd and Finke1984). The third is continuous motion, and this involves a target that appears to exhibit smooth and uninterrupted motion (e.g., Hubbard & Bharucha, Reference 408Hubbard and Bharucha1988). No difference between implied motion and continuous motion for displacement in orientation of a rotating rod (Munger & Owens, Reference Munger and Owens2004) or a change in auditory frequency (Hubbard, Reference Hubbard1995a) have been found. Kerzel (Reference Kerzel2003c) reported forward displacement for a target moving along a circular trajectory is less with continuous than with implied motion, and Faust (Reference Faust1990) found displacement for a horizontally moving target is less with implied than with continuous motion. Comparison of displacement across different surface forms is difficult, as direction and other characteristics of motion depicted with each type of surface form are typically different.
Control. If observers control velocity and direction (turning points) of a target, then forward displacement if that target vanishes without warning is less than if observers do not have such control (Jordan & Knoblich, Reference Jordan and Knoblich2004). If observers have control over when the target vanishes, then forward displacement decreases with increases in the latency between when observers indicate the target should vanish and when the target actually vanishes (Jordan, Stork, Knuf, Kerzel, & Musseler Reference Jordan, Stork, Knuf, Kerzel, Müsseler, Prinz and Hommel2002; but see Hubbard, Reference Hubbard2005b). Control over when the target vanishes might interact with oculomotor behavior (Stork & Müsseler, Reference Stork and Müsseler2004). If participants have previous experience controlling a target or observing another person controlling the target, then forward displacement is larger than if participants do not have such experience (Jordan & Hunsinger, Reference Jordan and Hunsinger2008).
Retention Interval. Representational momentum increases during the first few hundred milliseconds after the target vanishes (e.g., Freyd & Johnston, Reference Freyd1987; Halpern & Kelly, Reference Halpern and Kelly1993). This increase occurs with implied motion and continuous motion targets (but has not been examined for frozen-action photographs). Some studies report representational momentum asymptotes (e.g., Finke & Freyd, Reference Finke and Freyd1985; Kerzel, Reference Kerzel2000), and other studies report declines in representational momentum with subsequent increases in retention interval (e.g., Freyd & Johnson, Reference Freyd and Johnson1987; de sá Teixeira, Hecht, & Oliveira, Reference de sá Teixeira, Hecht and Oliveira2013). However, many studies claiming representational momentum asymptotes did not examine representational momentum for extended retention intervals (e.g., Kerzel, Reference Kerzel2000, did not examine retention intervals longer than 500 msec). Studies of retention interval typically use probe response measures (see below), as such measures do not confound time to locate and move a cursor with retention interval per se (although see de sá Teixeira, Hecht, & Oliveira, Reference de sá Teixeira, Hecht and Oliveira2013).
Prior Probabilities. If error feedback suggests prior probability that a same response is correct is relatively small, then overall likelihood of a same response, but not representational momentum, is decreased (Ruppel, Fleming, & Hubbard Reference Doricchi, Merola, Aiello, Guariglia, Bruschini and Gevers2009). If actual or believed prior probability that a same response is correct decreases, the likelihood of a same response, but not the magnitude of representational momentum, decreases (Hubbard & Lange, Reference Hubbard and Lange2010). In other words, decreases in prior probability that a same response is correct on any given trial decreases height of the distribution of same responses but does not influence skew (shift) of that distribution. Decreases in actual or believed prior probability decrease false alarm rates, and decreases in believed prior probability decrease hit rates and beta but not d’ (Hubbard & Lange, Reference Hubbard and Lange2010). Prior probability is most relevant to studies using probe judgment, but it is not clear how prior probability is relevant to studies using cursor positioning or reaching response measures.
Response Measure. Three response measures have been used. The first is probe judgment, in which a stimulus similar or identical to the target is presented after the target vanishes and observers judge whether the probe is the same as or different from the target (e.g., Finke et al., Reference Finke, Freyd and Shyi1986), or, less commonly, whether the probe is to the left or right of final target position (e.g., Kerzel, Reference Kerzel2000). A disadvantage of probe methods is that high numbers of probes and replications of each probe type are required, and this leads to higher numbers of trials (e.g., typically 5–9 probe positions per target position). The second type is cursor positioning (referred to as mouse pointing by Kerzel, Reference Kerzel2003c), in which observers use a computer mouse to position the cursor at the location in a display corresponding to the final location of the target. By clicking a button on the mouse, display coordinates of the cursor are recorded and can be compared with display coordinates of the target (e.g., Hubbard, Reference Hubbard1990; Hubbard & Bharucha, Reference 408Hubbard and Bharucha1988). Cursor positioning typically requires fewer trials than does probe judgment, but some stimulus dimensions are not easily adapted to such a measure (e.g., visual brightness, auditory pitch). The third method is reaching, in which participants touch (with a finger) the location in the display where the target vanished (e.g., Ashida, Reference Ashida2004; Kerzel & Gegenfurtner, Reference Kerzel and Gegenfurtner2003). A disadvantage of reaching is that spatial resolution is typically not as precise as probe judgment or cursor positioning. There haven’t been many comparisons of response measures, but one study found probe judgments resulted in smaller estimates of representational momentum than did reaching (Kerzel, Reference Kerzel2003c).
Contrast. Displacement in remembered luminance of a target changing in luminance is backward (in the direction opposite to representational momentum; Brehaut & Tipper, Reference Brehaut and Tipper1996) and interacts with a bias toward the level of background luminance (Favretto, Reference Favretto2002). If a moving target on a dark background gradually decreases in luminance (decreases in contrast), forward displacement is larger than if a target travels a shorter distance before abruptly vanishing (Maus & Nijhawan, Reference Maus and Nijhawan2006). Weaker motion signals resulting from less contrast between target and background have been suggested to result in smaller displacement (Maus & Nijhawan, Reference Maus and Nijhawan2009), although this does not appear consistent with suggestions that weaker motion signals resulting from less continuous motion result in larger displacement (Kerzel, Reference Kerzel2003c). If a light or dark target is presented on a white or black background, representational momentum for target location is larger if contrast of target and background is high or increasing and lower if contrast of target and background is low or decreasing (Hubbard & Ruppel, Reference Hubbard and Ruppel2014).
Characteristics of the Context
The context includes physical and cognitive elements. Variables influencing representational momentum that are related to the context include (a) physical surroundings, (b) landmarks, (c) shadows and shading, (d) interactions with nontarget stimuli, (e) expectations regarding future target motion, and (f) attributions regarding the source of target motion.
Physical Surroundings. If a rotating target is embedded within a larger surrounding frame, representational momentum for the target is increased if the frame rotates in the same direction or is oriented slightly beyond the final target orientation, and representational momentum for the target is decreased if the frame rotates in the opposite direction or is oriented slightly behind the final target orientation (Hubbard, Reference Hubbard1993). Similarly, if a moving target is near a larger translating grating, representational momentum of the target is increased or decreased if the grating moves in the same or opposite direction, respectively, as the target (e.g., Whitney & Cavanagh, Reference Whitney and Cavanagh2002). If a target moves between stationary distractors (Gray & Thornton, Reference Gray and Thornton2001) or toward a stationary barrier (Hubbard & Motes, Reference Hubbard and Motes2005), forward displacement is decreased. If the target is expected to bounce off a barrier, forward displacement decreases as the target approaches the barrier and reverses at the moment of contact (Hubbard, Reference Hubbard1994; Hubbard & Bharucha, Reference 408Hubbard and Bharucha1988).
If observers view video clips from real-world scenes (e.g., train station, shopping mall), representational momentum for those scenes occurs even if different stimuli in a scene move at different velocities and in different directions (Thornton & Hayes, Reference Thornton and Hayes2004). Forward displacement of an observer’s viewpoint for motion into animated scenes (pyramid landscapes) occurs if probes tested specifically for representational momentum (Munger et al., Reference Munger, Owens and Conway2005). However, if probes were more general, then responses were more consistent with boundary extension (see also DeLucia & Maldia, Reference DeLucia and Maldia2006). Forward displacement of the viewpoint occurs for observers in driving simulations (Thornton & Hayes, Reference Thornton and Hayes2004). If viewpoint of a scene rotates to the left or right, then representational momentum for objects occurs and is larger for objects entering the scene than exiting the scene (Munger et al., Reference Munger, Dellinger, Lloyd, Johnson-Reid, Tonelli, Wolf and Scott2006) even though objects are stationary and it is the viewpoint that moves. Representational momentum for objects in a scene decreases if viewpoint motion involves rotation and translation rather than just rotation (Brown & Munger, Reference Brown and Munger2010).
Landmarks. Examples of context considered above were global in the sense of surrounding a target or occupying a large portion of the surrounding environment. However, context can be local in the sense of an object or landmark providing a single point of reference. If a target moves toward or away from a landmark, forward displacement of that target increases or decreases, respectively (Hubbard & Ruppel, Reference Hubbard and Ruppel1999). This probably reflects a combination of representational momentum with a landmark attraction effect (cf. Bryant & Subbiah, Reference Bryant and Subbiah1994); when representational momentum and landmark attraction operate in the same direction (motion toward the landmark), they sum, and forward displacement is large, whereas when representational momentum and landmark attraction operate in opposite directions (motion away from the landmark), they partially cancel, and forward displacement is small. A target is displaced toward a distractor that is flashed at the moment the target vanishes or during the retention interval, and although consistent with a landmark effect, it has been argued a briefly presented nontarget stimulus should not be considered a landmark (Kerzel, Reference Kerzel2002a).
Shadows and Shading. Information regarding shape or direction of motion provided by shading and shadows influences representational momentum. If the first and third (of three) inducing stimuli are convex, forward displacement is larger if the second inducing stimulus is not concave (cf. coherent motion; Kelly & Freyd, Reference Kelly and Freyd1987), but if inducing stimuli are replaced by luminance-polarized circles (white top-half and black bottom-half for convex; black top-half and white bottom-half for concave), there is no difference in displacement (Hidaka, Kawachi, & Gyoba Reference Doricchi, Merola, Aiello, Guariglia, Bruschini and Gevers2009); thus, effects of shape and shading were due to differences in perceived depth rather than luminance. If the apparent cast shadow of a horizontally moving target diverges from the path of the target, representational momentum is larger than if the cast shadow parallels or converges with the path of the target, and this suggests the diverging shadow is interpreted as suggesting motion toward the observer (Taya & Miura, Reference Taya and Miura2010). If paths of the target and shadow converge, downward displacement of the target is larger, and this was interpreted as suggesting downward motion. Information from shape and shading influences perceived direction of motion, which in turn influences representational momentum.
Interactions with Nontarget Stimuli. A tone that increases or decreases in auditory frequency does not influence forward displacement of a vertically moving visual target, but downward displacement of a horizontally moving visual target is larger if the tone descends than if the tone ascends (Hubbard & Courtney, Reference Hubbard and Courtney2010). If onset of a horizontally moving visual target is accompanied by onset of a tone, representational momentum for the visual target is decreased or increased if the tone terminates slightly before or after, respectively, the visual target vanishes (Teramoto, Hidaka, Gyoba, & Suzuki Reference 441Peyrin, Michel and Schwartz2010). A tone presented just before a visual target vanishes leads to backward displacement of that target (Chien, Ono, & Watanabe Reference Chien, Ono and Watanabe2013; but see Teramoto et al., Reference 441Peyrin, Michel and Schwartz2010). If a tone is presented only to the left or right ear, then backward displacement is larger if the tone is on the same side of space where visual motion originated. If observers are presented with separate visual and auditory targets moving across space, then if the nonjudged modality target vanishes before or after the judged modality target vanishes, displacement of the judged modality target is biased toward the vanishing position of the nonjudged modality target (Schmiedchen et al., Reference Schmiedchen, Freigang, Nitsche and Rübsamen2012). However, if the difference in vanishing times was greater than 2,000 msec, then effects of the nonjudged modality target on the judged modality target only occurred if participants judged auditory targets.
Examples in the preceding paragraph involved target stimuli and nontarget stimuli in different modalities. However, effects of cast shadows, barriers, and landmarks accompanying visual targets suggest nontarget stimuli in the same modality as a target influence representational momentum for that target. In these latter cases, there is no contact between targets and nontarget stimuli (e.g., Hubbard, Reference Hubbard1993), but contact between targets and nontarget stimuli can influence representational momentum for the target. If a target slides along a stationary surface, forward displacement of that target is decreased relative to forward displacement of an otherwise identical target presented in isolation or clearly separated from the larger stationary surface (Hubbard, Reference Hubbard1995b, Reference Hubbard1998). This decrease is referred to as representational friction (Hubbard, Reference Hubbard1995b, Reference Hubbard1995c), and decreases in forward displacement increase as implied friction on the moving target increases (Hubbard, Reference Hubbard1995b, Reference Hubbard1998). Illusory motion of a visual nontarget stimulus might (e.g., Hubbard et al., Reference Hubbard, Piazza, Pinel and Dehaene2005) or might not (e.g., Nagai & Yagi, Reference Nagai and Saiki2005) influence displacement of a visual target. Additional examples of nontarget influences are discussed in the section below on Attributions of the Source of Target Motion (Causality).
Expectations of Future Target Motion. If a target is expected to bounce off a barrier the target is approaching, then forward displacement decreases as the target approaches the barrier, and at the moment of contact, displacement is in the expected (new) direction rather than in the previous direction of motion (Hubbard & Bharucha, Reference 408Hubbard and Bharucha1988). A physical reason for a direction change does not seem to be necessary, as similar patterns occur when visual targets changing in location (Verfaillie & d’Ydewalle, Reference Verfaillie and d’Ydewalle1991), and auditory targets changing in frequency (Johnston & Jones, Reference Johnston and Jones2006), exhibit oscillatory motion in an otherwise blank display. Similarly, forward displacement is larger if a target bounces off rather than crashes through a barrier, as if elastic bouncing off preserved more momentum and rigid crashing-through depleted more momentum (Hubbard, Reference Hubbard1994); interestingly, this difference is stronger if observers received a valid cue (e.g., a cue of “bounce” and the target then “bounced”) than if observers received an invalid cue (e.g., a cue of “bounce” and the target then “crashed”). A similar combination of effects of expected target direction and actual target direction on displacement was reported by Hudson, Nicholson, Ellis et al. (Reference Hudson, Nicholson, Ellis and Bach2016) and Hudson, Nicholson, Simpson et al. (Reference Hudson, Nicholson, Ellis and Bach2016). A spoken mimetic word describing possible target behavior presented during target motion influences displacement (Gobara, Yamada, & Miura Reference Gobara, Yamada and Miura2016).
Attribution of the Source of Target Motion (Causality). If observers attribute motion of an initially stationary target to contact from a moving launcher, forward displacement of the target is less than forward displacement of an otherwise identical target that exhibits autonomous motion (Hubbard & Favretto, Reference Hubbard and Favretto2003; Hubbard & Ruppel, Reference Hubbard and Ruppel2002; Hubbard et al., Reference Hubbard and Blessum2001). The launcher does not need to exhibit physical motion, as illusory gamma motion when a launcher appears adjacent to a target results in a launching effect (Hubbard et al., Reference Hubbard, Piazza, Pinel and Dehaene2005). Choi and Scholl (Reference Choi and Scholl2006) replicated the decreased forward displacement for launched targets found by Hubbard et al. (Reference Hubbard and Blessum2001), but they hypothesized this reflected the presence of two objects and a single motion rather than perception of causality. Hubbard (Reference Hubbard2013c) tested this by comparing displacement of a target in an entraining effect (a launcher continues in motion after contacting the target and appears to carry the target along; Hubbard, Reference Hubbard2013d) with displacement in a launching effect; displacement of entrained targets was larger than displacement of launched targets, and this is inconsistent with Choi and Scholl’s hypothesis. Increases in launcher size and velocity lead to larger representational momentum for the target (de sá Teixeira et al., Reference Dodds, van Belle, Peers, Dove, Cusack and Duncan2008), and forward displacement of a launched target decreases with distance traveled (Hubbard & Ruppel, Reference Hubbard and Ruppel2002).
Characteristics of the Observer
Variables influencing representational momentum that are related to the observer include (a) age, (b) allocation of attention, (c) eye movements and fixation, (d) action plans, (e) expertise, (f) error feedback and knowledge of representational momentum, (g) affective value of the target, (h) presence of psychopathology, and (i) neurophysiological structures involved or implicated in representational momentum.
Age. Children 24–36 months of age viewed a toy car roll down an incline and vanish behind an occluder, and they could open one of four doors in the occluder to retrieve the car (Perry, Smith, & Hockema Reference Dodds, van Belle, Peers, Dove, Cusack and Duncan2008). Children were more likely to open a door beyond where the car would have stopped, and this is consistent with representational momentum. Children 5 to 9 years of age viewed displays similar to those in Finke and Freyd (Reference Finke and Freyd1985), and older children exhibited larger representational momentum than did younger children (Taylor & Jakobson, Reference Taylor and Jakobson2010). Third-grade children, fifth-grade children, and adults shown frozen-action photographs exhibited representational momentum, but there was no effect of age (Futterweit & Beilin, Reference Futterweit and Beilin1994). First-grade children, fourth-grade children, and adults shown horizontally or vertically moving geometric stimuli exhibited representational momentum, and first-grade children exhibited larger representational momentum than did fourth-grade children or adults (Hubbard et al., Reference Hubbard, Matzenbacher and Davis1999). Older adults (more than 65 years of age) exhibited less representational momentum for an implied motion target than did younger adults (Piotrowski & Jakobson, Reference Piotrowski and Jakobson2011); indeed, the oldest participants did not exhibit representational momentum (which might reflect decreased ability to process implied motion). A consistent pattern of developmental changes in representational momentum has not been found, and methodological differences between studies might account for differences in findings.
Allocation of Attention. If an unrelated task (e.g., counting along with a metronome) is concurrent with target presentation, representational momentum for the target is increased (Hayes & Freyd, Reference Hayes and Freyd2002). Similarly, larger forward (smaller backward) displacement is exhibited when participants simultaneously listen to a string of digits and respond each time three odd numbers in a row occur (Joordens et al., Reference Bartolomeo, Urbanski, Chokron, Chainay, Moroni and Siéroff2004). If attention is manipulated by having participants attend to one or two locations on a single trajectory, no effect of allocation of attention occurs (Hubbard & Motes, Reference Hubbard and Motes2002; Kerzel, Reference Kerzel2004). If participants are cued during the target presentation or retention interval regarding final target location, representational momentum decreases but is not eliminated (Hubbard et al., Reference Doricchi, Merola, Aiello, Guariglia, Bruschini and Gevers2009). The inability of a cue to eliminate representational momentum suggests at least some portion of the displacement process is cognitively impenetrable. However, it is possible that cues presented during target presentation or during the retention interval might be displaced in the direction of motion (cf. Hubbard, Reference Hubbard2008) and thus ineffective in cueing actual final location.
An unrelated object flashed (briefly presented) at the moment the target vanished increases representational momentum (Munger & Owens, Reference Munger and Owens2004). When a flashed object is relevant to the task (i.e., participants judged target position at the time of the flash), backward displacement of the target occurs, but if a flashed object is irrelevant (i.e., observers instructed to ignore the flash), forward displacement occurs (Müsseler et al., Reference Müsseler, Stork and Kerzel2002). An unrelated flash during the retention interval results in backward displacement, and this is larger if the distractor is in front of rather than behind the target (Kerzel, Reference Kerzel2003a). These findings suggest tasks or stimuli that draw attention away from the target might influence displacement. The complementary pattern might also occur, that is, forward displacement might influence attention. For example, detection of a gap within a circle is faster and more accurate if the circle is presented slightly in front of the final location of a moving target than if the circle is presented slightly behind the final location of a moving target (Kerzel et al., Reference Kerzel, Jordan and Müsseler2001). Indeed, attention itself might exhibit a form of momentum (e.g., Hubbard, Reference Hubbard2014a, Reference Hubbard2015b; Pratt, Spalek, & Bradshaw Reference Jancke, Erlhagen, Dinse, Akhavan, Giese and Steinhage1999).
Eye Movements and Eye Fixation. If an observer views a continuously moving target but does not track that target, representational momentum is decreased or eliminated (de sá Teixeira, Hecht, & Oliveira, Reference de sá Teixeira, Hecht and Oliveira2013; Kerzel, Reference Kerzel2000). This initially led to suggestions that forward displacement resulted from pursuit eye movements overshooting final target position and visual persistence (e.g. Kerzel, Reference Kerzel2000; Stork & Müsseler, Reference Stork and Müsseler2004). However, oculomotor behavior does not influence displacement for a target undergoing implied motion (Kerzel, Reference Kerzel2003a); similarly, pursuit movements do not occur with frozen-action photographs, which also result in representational momentum. Nonetheless, the role of eye movements has been debated (e.g., Hubbard, Reference Hubbard2005b, Reference Hubbard2006b; Kerzel, Reference Kerzel2002c, Reference Kerzel2006). Several recent studies challenge the idea that preventing visual tracking of smoothly moving targets eliminates representational momentum (e.g., Getzmann & Lewald, Reference Getzmann and Lewald2009; Schmiedchen et al., Reference Rastelli, Tallon-Baudry, Migliaccio, Toba, Ducorps and Pradat-Diehl2013; Teramoto et al., Reference 441Peyrin, Michel and Schwartz2010). De sá Teixeira, Hecht, and Oliveira (Reference Rastelli, Tallon-Baudry, Migliaccio, Toba, Ducorps and Pradat-Diehl2013) suggested constraining eye movements suppresses or conceals effects of motion representation (cf. Hubbard Reference Hubbard2005b, Reference Hubbard2006b, Reference Hubbard, Nijhawan and Khurana2010, that eye movements might contribute to, but are not causal of, representational momentum). Oculomotor behavior is not related to representational momentum for auditory targets (Getzmann, Reference Getzmann2005) or representational gravity for horizontally moving visual targets (de sá Teixeira, Hecht, & Oliveira, Reference de sá Teixeira, Hecht and Oliveira2013). The presence of representational momentum in patients with schizophrenia (de sá Teixeira, Pimenta, & Raposo, Reference de sá Teixeira, Pimenta and Raposo2013; Jarrett et al., Reference Jarrett, Phillips, Parker and Senior2002), who often exhibit dysfunction of pursuit eye movements, further challenges claims that pursuit eye movements are necessary for generation of representational momentum.
Action Plans. Representational momentum decreases if observers have control over target direction and velocity (Jordan & Knoblich, Reference Jordan and Knoblich2004). Similarly, displacement is influenced by whether participants trigger disappearance of the target or the target vanishes without warning (Jordan et al., Reference Jordan, Stork, Knuf, Kerzel, Müsseler, Prinz and Hommel2002; Stork & Müsseler, Reference Stork and Müsseler2004). This suggests motor plans are coupled to perceptual space, which further suggests sharing or overlap of mechanisms for perception and for action planning. Relatedly, participants with previous experience controlling a target exhibit larger forward displacement than do participants without previous experience controlling that target, and this might reflect activation of action plans (Jordan & Hunsinger, Reference Jordan and Hunsinger2008). Such findings are consistent with effects of expertise on representational momentum (see discussion below), but seem inconsistent with decreases in displacement when participants control the target (Jordan & Knoblich, Reference Jordan and Knoblich2004; Jordan et al., Reference Jordan, Stork, Knuf, Kerzel, Müsseler, Prinz and Hommel2002; Stork & Müsseler, Reference Stork and Müsseler2004); however, it is possible that increased displacement occurs only during passive observation and not during active control.
Expertise. If expert drivers and novice drivers view displays involving roadway scenes filmed on board a moving automobile, all participants exhibited representational momentum, and representational momentum was larger for experts (Blättler, Ferrari, Didierjean, van Elslande, & Marmèche, Reference Blättler, Ferrari, Didierjean, van Elslande and Marmèche2010). If experienced pilots and non-pilots view displays based on aircraft landings, experienced pilots but not non-pilots exhibited representational momentum (Blättler, Ferrari, Didierjean, &Marmèche, Reference Blättler, Ferrari, Didierjean and Marmèche2011). Lack of displacement in non-pilots was attributed to lack of familiarity with the setting and stimuli. Experienced baseball batters exhibit larger representational momentum for a fast-moving object than do inexperienced baseball batters (Nakamoto, Mori, Ikudome, Unenaka, & Imanaka, Reference Nakamoto, Mori, Ikudome, Unenaka and Imanaka2015). These findings are consistent with the notion that representational momentum is related to predictability of the stimulus (cf. Kerzel, Reference Kerzel2002d), as experts are more familiar with the stimuli, and thus more able to predict the near future of those stimuli, than are non-experts. Interestingly, this suggests that attempts to develop training to eliminate representational momentum might be futile, and this is consistent with effects of error feedback on representational momentum.
Error Feedback and Knowledge. Representational momentum was initially claimed to be impervious to error feedback (Freyd, Reference Freyd1987), and this was based on findings that feedback during practice trials did not influence representational momentum on subsequent experimental trials (e.g., Finke & Freyd, Reference Finke and Freyd1985). More recent studies challenged this claim. If participants are instructed regarding representational momentum and asked to guard against it in their responses, forward displacement on subsequent trials is reduced but not eliminated (Courtney & Hubbard, Reference Courtney and Hubbard2008). If participants are given feedback after each trial regarding whether their response was correct or incorrect, such feedback does not reduce representational momentum, although it does reduce overall probability of a same response to any given probe (Ruppel et al., Reference Doricchi, Merola, Aiello, Guariglia, Bruschini and Gevers2009). Furthermore, reduced probability of a same response continues even if feedback is later withdrawn. As most experiments using probe judgment present 5–9 probe positions, the probability that any given probe will reflect the accurate target location is less than 50%, and the relatively low prior probability a same response would be correct might account for decreases in same responses (cf. Hubbard & Lange, Reference Hubbard and Lange2010).
Affective Value. Affective value of an object (e.g., safe, painful) that a hand moved toward or away from influenced representational momentum for location of the hand; more specifically, when affective value of the stimulus matched direction of hand movement (positive affect and motion toward the object, or negative affect and motion away from an object), forward displacement of the hand was larger than when affective value of the stimulus did not match direction of hand motion (Hudson, Nicholson, Ellis et al., Reference Hudson, Nicholson, Ellis and Bach2016; Hudson, Nicholson, Simpson et al., Reference Hudson, Nicholson, Ellis and Bach2016). Analogously, affective value of a target moving toward a stationary object influences displacement of that target. Participants were presented with a neutral stationary object and a moving target, and they read vignettes in which the moving target was described as threatening to the stationary object, neutral, or happy; forward displacement of the moving target was larger when the situation was described as a threatening than when the situation was described as neutral or happy (Greenstein, Franklin, Martins, Sewack, & Meier Reference Greenstein, Franklin, Martins, Sewack and Meier2016). Studies on representational momentum involving changes in facial expression involved different emotions depicted by a facial target, and those studies are discussed in the section on Human Form.
Psychopathology. Patients diagnosed with schizophrenia exhibit larger representational momentum than do control participants (Jarrett, Phillips, Parker, & Senior Reference Jarrett, Phillips, Parker and Senior2002), and target size, but not target velocity, influences representational momentum in such patients (de sá Teixeira, Pimenta, & Raposo, Reference de sá Teixeira, Pimenta and Raposo2013). Patients diagnosed with mental retardation exhibit smaller representational momentum than do control participants (Conners, Wyatt, & Dulaney, Reference Conners, Wyatt and Dulaney1998). Representational momentum is larger in patients with left spatial neglect and patients with right-hemisphere damage but no neglect (McGeorge et al., Reference McGeorge, Beschin and Della Sala2006), and representational momentum decreases with increases in distance traveled by the target for patients but not for control participants. Patients with left hemineglect as a consequence of right-hemisphere damage exhibited larger forward displacement than did patients with right-hemisphere damage without neglect and control participants regardless of direction of target motion (Lenggenhager et al., Reference Schmiedchen, Freigang, Nitsche and Rübsamen2012); furthermore, patients with left hemineglect exhibited larger forward displacement for targets moving toward the left (and a patient with right hemineglect exhibited larger forward displacement for targets moving toward the right). Patients with autism spectrum disorder exhibit decreases representational momentum for changes in facial expression (Uono et al., Reference Lewkowicz and Minar2014).
Neurophysiology. Several studies on neurophysiology of representational momentum involve patients diagnosed with psychopathology, and those studies were discussed in the section on Psychopathology. Retinal ganglion cells of rabbits and salamanders appear to anticipate arrival of a continuously moving stimulus (Berry, Brivanlou, Jordan, & Meister Reference Jancke, Erlhagen, Dinse, Akhavan, Giese and Steinhage1999), but no such patterns have been reported for implied motion or frozen-action stimuli. Representational momentum for changes in size (White et al., Reference White, Minor, Merrell and Smith1993) and location (Gottwald et al., Reference Gottwald, Lawrence, Hayes and Khan2015; Halpern & Kelly, Reference Halpern and Kelly1993) are larger for stimuli in the left visual field (right hemisphere). Consistent with this, increased activity in right parietal cortex occurs when observers exhibit representational momentum (Amorim et al., Reference Amorim, Lang, Lindinger, Mayer, Deecke and Berthoz2000). Frozen-action photographs elicit activation in motion-processing areas of V5/MST (Kourtzi & Kanwisher, Reference Kourtzi and Kanwisher2000; Senior et al., Reference 451Senior, Barnes, Giampietro, Simmons, Bullmore, Brammer and David2000). If a stimulus shown to previously elicit representational momentum is viewed after TMS over area V5/MST, representational momentum does not occur (Senior, Ward, & David Reference Senior, Ward and David2002). Representational momentum has been linked to activity in prefrontal cortex (Rao et al., Reference Bartolomeo, Urbanski, Chokron, Chainay, Moroni and Siéroff2004).
Properties of Representational Momentum
Freyd (Reference Freyd1987) suggested several properties of dynamic mental representation that were based on early studies of representational momentum. Subsequent research suggested additional properties (see Hubbard, Reference Hubbard2005b, Reference Hubbard, Nijhawan and Khurana2010, Reference Hubbard2014a, Reference Hubbard2015a, Reference Hubbard2017). Four of these additional properties are considered here and involve whether representational momentum (a) reflects objective physical principles or naive physics, (b) reflects low-level processing or high-level processing, (c) is related to other spatial biases, and (d) bridges the gap between perception and action.
Physical Principles or Naive Physics?
Some researchers suggest representational momentum reflects internalization or incorporation of momentum (e.g., Finke et al., Reference Finke, Freyd and Shyi1986), and other researchers completely reject the notion of such internalization or incorporation (e.g., Kerzel, Reference Kerzel2000, Reference Kerzel2003a). Displacement does not always reflect objective physical principles (e.g., representational momentum does not reflect implied mass and is influenced by expectations regarding future target behavior and by landmark attraction). What is more likely is that displacement reflects subjective consequences of such principles rather than objective principles per se (e.g., displacement is influenced by experienced weight rather than by objective mass), and that such consequences are modulated by expectations regarding the target. Consistent with this, some authors suggest representational momentum might involve naïve physics (e.g., impetus; Hubbard, Reference 407Hubbard, Oliveira, Teixeira, Borges and Ferro2004, Reference Hubbard2013c; Hubbard & Ruppel, Reference Hubbard and Ruppel2002; Kozhevnikov & Hegarty, Reference Kozhevnikov and Hegarty2001). An interpretation emphasizing subjective experience is consistent with contemporary emphases on embodied or grounded cognition (e.g., Barsalou, Reference Barsalou2008; Gibbs, Reference Gibbs2005).
Low-Level Processing or High-Level Processing?
Several strands of evidence suggest representational momentum involves at least some high-level (top-down) processes. Representational momentum is influenced by information regarding source (Hubbard, Reference 407Hubbard, Oliveira, Teixeira, Borges and Ferro2004, Reference Hubbard2013c) and anticipated direction (Hubbard & Bharucha, Reference 408Hubbard and Bharucha1988; Johnston & Jones, Reference Johnston and Jones2006; Verfaillie & d’Ydewalle, Reference Verfaillie and d’Ydewalle1991) of target motion. Representational momentum is influenced by target prototypicality and identity (Nagai & Yagi, Reference Nagai and Yagi2001; Reed & Vinson, Reference Reed and Vinson1996; Vinson & Reed, Reference Vinson and Reed2002). Representational momentum is related to activity in several cortical areas (Amorim et al., Reference Amorim, Lang, Lindinger, Mayer, Deecke and Berthoz2000; Kourtzi & Kanwisher, Reference Kourtzi and Kanwisher2000; Rao et al., Reference Bartolomeo, Urbanski, Chokron, Chainay, Moroni and Siéroff2004; Senior et al., Reference 451Senior, Barnes, Giampietro, Simmons, Bullmore, Brammer and David2000). Representational momentum occurs with different surface forms (cf. Freyd & Finke, Reference 394Freyd and Finke1984; Hubbard & Bharucha, Reference 408Hubbard and Bharucha1988), in different modalities (cf. Johnston & Jones, Reference Johnston and Jones2006; Verfaillie & d’Ydewalle, Reference Verfaillie and d’Ydewalle1991), and is influenced by cross-modal information (e.g., Teramoto et al., Reference 441Peyrin, Michel and Schwartz2010). Rather than a different mechanism for each surface form or modality, it is more parsimonious to suggest a more high-level general-purpose extrapolation mechanism (cf. Hubbard, Reference Hubbard2006b, Reference Hubbard2014a, Reference Hubbard2015a, Reference Hubbard2015b, Reference Hubbard2017). Importantly, allowing for high-level processes and influences does not mean that low-level processes cannot contribute to or modulate displacement (e.g., disrupting information normally provided by eye movements disrupts displacement; de sá Teixeira, Hecht, & Oliveira, 2103).
Relationship to Other Spatial Biases?
Representational momentum is related to other momentum-like effects (e.g., Hubbard, Reference Hubbard2014a, Reference Hubbard2015a, Reference Hubbard2015b, Reference Hubbard2017) and general perceptual or cognitive processes (e.g., mental rotation; Hubbard, Reference Hubbard2006a; Munger, Solberg, & Horrocks, Reference Munger, Solberg and Horrocks1999; perceptual grouping; Hubbard Reference Hubbard, Albertazzi, van Tonder and Vishwanath2011b; aesthetics; Hubbard, Chapter 15 in this volume). These relationships are beyond the scope of this chapter, but a narrower consideration of relationships of representational momentum to other biases in remembered location (Fröhlich effect, flash-lag effect, boundary extension) is presented.
Fröhlich Effect. The perceived onset (initial) location of a moving target is often displaced in the direction of target motion, and this is referred to as the Fröhlich effect (Kerzel, Reference Kerzel, Nijhawan and Khurana2010; Müsseler & Kerzel, Chapter 7 in this volume). Forward displacement of the target in the Fröhlich effect appears similar to forward displacement of the target in representational momentum (cf. Hubbard, Reference Hubbard1990; Müsseler & Aschersleben, 1988). The Fröhlich effect (e.g., Müsseler & Aschersleben, Reference Müsseler and Aschersleben1998) and representational momentum (e.g., Hubbard, Reference Hubbard1990) increase with increases in target velocity. The Fröhlich effect (Whitney & Cavanagh, Reference Whitney and Cavanagh2000a) and representational momentum (Hubbard et al., Reference Doricchi, Merola, Aiello, Guariglia, Bruschini and Gevers2009) are decreased by presentation of a valid cue prior to stimulus presentation. Given such similarities, displacement in the Fröhlich effect might reflect representational momentum and an accurate memory for trajectory length, or displacement in representational momentum might reflect the Fröhlich effect and an accurate memory for trajectory length. However, when the Fröhlich effect and representational momentum are measured for the same trajectory, representational momentum for the vanishing point is found, but memory for initial location is displaced in the direction opposite to target motion (i.e., an onset repulsion effect; Actis-Grosso & Stucchi, Reference Actis-Grosso and Stucchi2003; Hubbard & Motes, Reference Hubbard and Motes2002; Kerzel, Reference Kerzel2004).
Flash-Lag Effect. If a briefly presented (flashed) stationary object is aligned with a moving target, that object appears to lag behind the moving target. This is referred to as the flash-lag effect (Hubbard, Reference Hubbard2014b, Chapter 9 in this volume). Forward displacement in the flash-lag effect appears similar to forward displacement in representational momentum (cf. Munger & Owens, Reference Munger and Owens2004; Shi & de’Sperati, Reference Shi and de’Sperati2008). The flash-lag effect (Wojtach et al., Reference Dodds, van Belle, Peers, Dove, Cusack and Duncan2008) and representational momentum (Hubbard & Bharucha, Reference 408Hubbard and Bharucha1988) increase with increases in target velocity. The flash-lag effect (Namba & Baldo, Reference Namba and Baldo2004; Vreven & Verghese, Reference Vreven and Verghese2005) and representational momentum (Hubbard et al., Reference Doricchi, Merola, Aiello, Guariglia, Bruschini and Gevers2009) are decreased by presentation of a valid cue prior to stimulus presentation. The flash-lag effect (Nagai et al., Reference Nagai, Suganuma, Nijhawan, Freyd, Miller, Watanabe, Nijhawan and Khurana2010; Noguchi & Kakigi, Reference Noguchi and Kakigi2008) and representational momentum (Reed & Vinson, Reference Reed and Vinson1996) are influenced by conceptual knowledge. The flash-lag effect (Ichikawa & Masakura, Reference Ichikawa and Masakura2006, Reference Ichikawa and Masakura2010) and representational momentum (Hubbard, Reference Hubbard2013c; Hubbard et al., Reference Hubbard and Blessum2001) are influenced by attributions regarding the source of target motion. The flash-lag effect (Scocchia, Actis-Grosso, de’Sperati, Stucchi, & Baud-Bovy, Reference Doricchi, Merola, Aiello, Guariglia, Bruschini and Gevers2009) and representational momentum (Jordan & Hunsinger, Reference Jordan and Hunsinger2008) are influenced by whether observers control the stimulus. The flash-lag effect (Sarich, Chappell, & Burgess, Reference Sarich, Chappell and Burgess2007) and representational momentum (Hayes & Freyd, Reference Hayes and Freyd2002) increase with divided attention. The flash-lag effect (Brenner, van Beers, Rotman, & Smeets, Reference Brenner, van Beers, Rotman and Smeets2006; Shi & Nijhawan, Reference Shi and Nijhawan2008) and representational momentum (Hubbard & Ruppel, Reference Hubbard and Ruppel1999) increase with motion toward a landmark or fixation. The main difference is that in the flash-lag effect, displacement of the target is measured relative to the location of a nearby stationary object, whereas in representational momentum, displacement of the target is measured relative to the actual location of the target Hubbard (Reference Hubbard2013b, Reference Hubbard2014b).
Boundary Extension. Memory for a previously viewed scene includes not just information within the initial view but also information that was not viewed but would likely have been present outside the boundaries of the initial view. This has been referred to as boundary extension (Hubbard et al., Reference Hubbard and Courtney2010; Intraub, Reference Intraub2012; Intraub & Gagnier, Chapter 13 in this volume). Boundary extension (Intraub, Daniels, Horowitz, & Wolfe, Reference Dodds, van Belle, Peers, Dove, Cusack and Duncan2008) and representational momentum (Hayes & Freyd, Reference Hayes and Freyd2002) are decreased when more attention is allocated to the target. Boundary extension (Intraub & Dickinson, Reference Intraub and Dickinson2008) and representational momentum (Freyd & Johnson, Reference Freyd and Johnson1987) occur within tens of milliseconds after a target vanishes. Boundary extension (Intraub, Hoffman, Wetherhold, & Stoehs, Reference Intraub, Hoffman, Wetherhold and Stoehs2006) and representational momentum (Jordan et al., Reference Jordan, Stork, Knuf, Kerzel, Müsseler, Prinz and Hommel2002) are influenced by action plans regarding eye movements. Boundary extension (Intraub & Bodamer, Reference Intraub and Bodamer1993) and representational momentum (Courtney & Hubbard, Reference Courtney and Hubbard2008) are decreased but not eliminated if participants receive information regarding the effect and are instructed to counteract the effect. Boundary extension (Hubbard, Reference Hubbard, Algom, Zakay, Chajut, Shaki, Mama and Shakuf2011a) and representational momentum (Hubbard, Reference Hubbard, Albertazzi, van Tonder and Vishwanath2011b) exhibit properties similar to Gestalt principles of perceptual grouping. Munger et al. (Reference Munger, Owens and Conway2005) suggested boundary extension for a scene occurred before representational momentum for objects in that scene.Footnote 4
Bridging the Gap?
It takes 100 msec or so for information presented to the retina to be processed in the cortex (e.g., De Valois & De Valois, Reference 386De Valois and De Valois1991); thus, there is a lag between when sensation of a stimulus begins and when information regarding that stimulus enters perceptual awareness. The flash-lag effect has been proposed to compensate for such delays (e.g., Nijhawan, Reference Nijhawan2008), but representational momentum might provide better compensation, as the flash-lag effect is defined in terms of relative position (and so a referent stationary object is necessary), and representational momentum does not require comparison to another stimulus. Indeed, Hubbard (Reference Hubbard2005b) suggested representational momentum bridged the gap between perception and action. When light from a moving stimulus stimulates the retina, a cascade of sensory, perceptual, cognitive, and perhaps motor responses is initiated. However, while this processing is occurring, the stimulus typically does not pause and wait for the observer to finish processing, but instead continues in motion. By the time conscious awareness of the stimulus is achieved, the stimulus has already moved beyond where it was when it first stimulated the retina. If an immediate response from an observer is to be optimal, that response should be calibrated to where the stimulus is in real time and not where the stimulus was when it was initially sensed. What is needed is a bridge between perception (i.e., location at initial sensation) and action (i.e., location when a response would reach the stimulus), and representational momentum might provide such a bridge.
Summary and Conclusions
Representational momentum involves displacement of the judged location of a target in the direction of anticipated motion. This displacement can be evoked by continuous motion, implied motion, and static images that suggest a specific direction of motion, and can be measured with cursor positioning, probe judgment, and reaching responses. Representational momentum is increased if (a) velocity is faster, (b) motion is horizontal rather than vertical or downward rather than upward, (c) motion is in a prototypical direction or direction in which the target points or faces, (d) a constant object identity is maintained, (e) motion is from central to paracentral regions, (f) motion is biologically less awkward, (g) observers do not control the target, (h) retention interval is only a few hundred milliseconds long, (i) contrast of the target with the background is high or increasing, (j) a surrounding or nearby stimulus moves in the same direction, (k) motion is toward a landmark, (m) the target is entering the scene, (n) the target experiences less implied friction, (o) a nontarget stimulus that appeared when the target appeared vanishes slightly after the target vanishes, (p) motion is perceived as autonomous rather than caused by another stimulus, (q) observers divide attention between the target and another stimulus or task, (r) observers track a continuously moving target, (s) the observer has previous experience or expertise controlling the target, (t) the target is associated with threat, and (u) observers are naive regarding representational momentum. Other types of information that influence displacement more generally include (a) distance traveled by the target, (b) size of the target, (c) gaze direction of a target, (d) shape and shading, and (e) action plans of the observer.
Representational momentum exhibits several properties in addition to those initially suggested by Freyd (Reference Freyd1987). First, representational momentum incorporates information regarding the subjective consequences of physical principles for the observer rather than information regarding objective physical principles. This is consistent with idea of embodied cognition. Second, representational momentum involves at least some high-level processing. Displacement reflects a combination of many influences, and can be found in multiple dimensions and influenced by cross-modal information. This suggests a single or small number of extrapolation mechanisms exist, although it is possible but less parsimonious that multiple modality-specific and dimension-specific extrapolation mechanisms exist. Relatedly, inability of feedback or instruction to eliminate representational momentum suggests there is at least one cognitively impenetrable (modular) component to displacement, but the influence of expectations regarding target identity and typical behavior suggest there is at least one cognitively penetrable (nonmodular) component. Third, representational momentum is related to other biases in localization such as the Fröhlich effect, flash-lag effect, and boundary extension, as well as other momentum-like processes. Fourth, rather than being an error or flaw in spatial representation, representational momentum is an adaptive solution to the problem of neural processing delay. Representational momentum helps bridge the gap between initial sensed location of a target and actual location of the target at the time information regarding initial sensation enters conscious awareness.
In representational momentum, judged final position of a moving target is displaced from actual final position, and this displacement is in the direction of anticipated or likely future movement of the stimulus. The idea of representational momentum (and displacement in general) highlights the dynamic and anticipatory nature of perception and representation and underscores important issues in visuospatial and spatiotemporal processing. Foremost among these issues is how our representational system has been tuned to anticipate what is most likely to be encountered in interactions with environmental stimuli. Such tuning potentially involved shaping of the functional architecture of the representation (see Hubbard, Reference Hubbard2005b, Reference Hubbard2006a). Relatedly, representational momentum might help compensate for delays in perception due to neural processing latencies. Although it might be tempting to view representational momentum as an error, such a displacement is actually a very useful adaptation. The existence of representational momentum has potential implications for other biases in localization (e.g., representational momentum of a moving target might be the basis of the flash-lag effect), and might be related to other processes in spatial representation. Representational momentum is an important and fundamental aspect of spatial representation, and may contribute to more processes than previously expected.
If an observer views a briefly presented (flashed) stationary object that is aligned with a moving target, the position of the briefly presented object seems to lag behind the position of the moving target. This is referred to as the flash-lag effect (Nijhawan, Reference Nijhawan1994; for review, see Hubbard, Reference Hubbard2014b) and has implications for how we perceive and interact with stimuli in our environment (e.g., there is a delay between when the retina is stimulated and conscious perception of the stimulus [De Valois & De Valois, Reference 386De Valois and De Valois1991; Nijhawan, Reference Nijhawan2008], and the flash-lag effect might reveal one way perception compensates for this delay). Several methods have been used to study the flash-lag effect, and the most common are illustrated in Figure 9.1. In Figure 9.1A, the moving target consists of a rotating bar, and the flashed object consists of two sets of dotted lines. In Figure 9.1B, the moving target consists of a revolving annulus, and the flashed object consists of a solid disk. In Figures 9.1C and 9.1D, the moving target consists of a translating bar, and the flashed object consists of a second bar presented adjacent to the translating bar or within a gap in the translating bar. The magnitude of the flash-lag effect is influenced by numerous variables, and these are briefly reviewed. Properties of the flash-lag effect, and the relationship of the flash-lag effect to other spatial biases, are discussed. Finally, some of the more common explanations for the flash-lag effect are described.

Figure 9.1 Illustrations of common stimulus displays in studies of the flash-lag effect. The actual physical stimulus is depicted on the left, and the typical perceived stimulus is depicted on the right; in each case, the position of the flashed object appears to lag behind the position of the moving target. (A) The target consists of a bar rotating clockwise, and the flashed object consists of two dashed line segments that are briefly flashed when they are in alignment with the bar. (B) The target consists of a black annulus moving clockwise on a circular path (indicated by the dashed line), and the flashed object consists of a white disk flashed within the annulus. (C) The target consists of a vertical bar moving from left to right in the upper part of the display, and the flashed object is a vertical bar in the lower part of the display that is briefly flashed when it is aligned with the moving target. (D) The target consists of two vertically aligned vertical bars moving from left to right, and the flashed object consists of a vertical bar flashed in the gap within the target.
Influences on the Flash-Lag Effect
Many different variables have been manipulated in studies of the flash-lag effect. In some cases (e.g., target velocity), different values of a given variable result in different magnitudes of the flash-lag effect. In other cases (e.g., color of the moving target or flashed object), different values of a given variable reveal other aspects of the flash-lag effect.
Characteristics of the Stimulus
Numerous characteristics of the stimulus influence or reveal properties of the flash-lag effect. These include (a) timing of presentation of the flashed object relative to presentation of the moving target, (b) continuity of the target, (c) distance traveled by the target prior to presentation of the flashed object, (d) distance between the moving target and the flashed object, (e) eccentricity and visual field, (f) velocity of target motion, (g) direction of target motion, (h) binocular disparity, (i) changes in target color and lack of color mixing, (j) luminance of the moving target or of the flashed object, (k) contrast of the moving target and flashed object with the background or each other, (l) spatial frequency of the moving target, (m) identity of the moving target, (n) duration of the flashed object, (o) motion of the flashed object, (p) predictability of the flashed object, and (q) presence of unrelated stimuli.
Relative Timing. The flashed object is typically presented at the onset, midpoint, or offset of target motion, and these displays are referred to as flash-initiated, flash-midpoint, and flash-terminated, respectively. A flash-lag effect typically occurs with flash-initiated and flash-midpoint displays, but not with flash-terminated displays (Eagleman & Sejnowski, Reference Eagleman and Sejnowski2000b; Khurana & Nijhawan, Reference Khurana and Nijhawan1995; Nijhawan, Watanabe, Khurana, & Shimojo, Reference Bartolomeo, Urbanski, Chokron, Chainay, Moroni and Siéroff2004). Many studies that involve flash-initiated, flash-midpoint, and flash-terminated stimuli present the flashed object and moving target as aligned, but a small group of studies varied relative spatial position, and observers adjusted the stimuli so that the flashed object and moving target appear aligned (e.g., Lappe & Krekelberg, Reference Lappe and Krekelberg1998).
Continuity of the Target. A flash-lag effect occurs if the moving target is presented continuously (i.e., target motion appears smooth) or if discrete and clearly separated presentations of the target (i.e., implied motion) are viewed (Rizk, Chappell, & Hine, Reference Doricchi, Merola, Aiello, Guariglia, Bruschini and Gevers2009), although the effect is weaker with discrete presentations. Such a result suggests the flash-lag effect is related more to underlying continuity of the stimulus dimension along which change occurs and from which the target is drawn or sampled (e.g., location, orientation, luminance, hue, etc.) than to characteristics of the target per se. An unexpected change in color or size (Au & Watanabe, Reference Au and Watanabe2013; Moore & Enns, Reference Moore and Enns2004) of the moving target when the flashed object is presented disrupts the flash-lag effect.
Distance Traveled by the Target. Finding a flash-lag effect with flash-initiated and flash-midpoint displays but not flash-terminated displays suggests the flash-lag effect decreases as distance traveled by the target increases. Consistent with this, increases in distance traveled by the target prior to presentation of the flashed object decreases the flash-lag effect (Vreven & Verghese, Reference Vreven and Verghese2005). Maus and Nijhawan (Reference Maus and Nijhawan2006) reported the visible threshold for moving targets was lower if the target traveled farther, and they suggested this involved larger forward displacement of the target; however, larger displacement would presumably result in an increased flash-lag effect with increases in distance traveled by the target (cf., Kanai, Sheth, & Shimojo, Reference Bartolomeo, Urbanski, Chokron, Chainay, Moroni and Siéroff2004).
Distance between Moving Target and Flashed Object. Many studies presented the flashed object embedded within the moving target (e.g., a disk within an annulus; Becker, Ansorge, & Turatto, Reference Becker, Ansorge and Turatto2009; Nijhawan, Reference Nijhawan2001; flashed objects interleaved with different parts of a moving target; Khurana & Nijhawan, Reference Khurana and Nijhawan1995), but other studies varied distance between the moving target and flashed object. In the former studies, a robust flash-lag effect occurred. In the latter studies, increases in distance between the moving target and the flashed object increased the flash-lag effect (Baldo & Klein, Reference Baldo and Klein1995; Baldo et al., Reference Bartolomeo, Urbanski, Chokron, Chainay, Moroni and Siéroff2004). If the flashed object is embedded or interleaved within the moving target, or is spatially separate from the moving target, then there is no partial overlap between the flashed object and the moving target. However, if partial overlap occurs, the portion of the moving target inside the boundaries of the flashed object is veridically perceived, whereas the portion of the moving target outside the boundaries of the flashed object exhibits a flash-lag effect (Kanai & Verstraten, Reference Kanai and Verstraten2006). Thus, whether the moving target encloses, is spatially separated from, or partially overlaps the flashed object influences the flash-lag effect.
Eccentricity and Visual Field. When the flashed object is closer to fixation than is the moving target, the flash-lag effect is increased (Baldo, Kihara, et al. Reference Bartolomeo, Urbanski, Chokron, Chainay, Moroni and Siéroff2004; Baldo & Klein, Reference Baldo and Klein1995), whereas when the flashed object is farther from fixation than is the moving target, the flash-lag effect is decreased (Linares, López-Moliner, & Johnston, Reference Linares and López-Moliner2007) with increases in eccentricity of the flashed object from fixation. The flash-lag effect is more likely to occur with flash-terminated displays as eccentricity increases (Kanai et al., Reference Bartolomeo, Urbanski, Chokron, Chainay, Moroni and Siéroff2004). The flash-lag effect is increased for horizontal target motion in the left visual field relative to the right visual field (Kanai et al., Reference Bartolomeo, Urbanski, Chokron, Chainay, Moroni and Siéroff2004) and is more influenced by target direction if motion is in the right visual field (Shi & Nijhawan, Reference Shi and Nijhawan2008). However, visual field does not influence the flash-lag effect for vertically moving targets (Ishikawa & Masakura, Reference Ichikawa and Masakura2006, Reference Ichikawa and Masakura2010).
Velocity of Target Motion. The flash-lag effect increases with increased target velocity in the picture plane (e.g., Brenner & Smeets, Reference Brenner and Smeets2000; López-Moliner & Linares, Reference López-Moliner and Linares2006; Wojach et al., Reference Dodds, van Belle, Peers, Dove, Cusack and Duncan2008) and in depth (e.g., Lee, Khuu, Li, & Hayes, Reference Dodds, van Belle, Peers, Dove, Cusack and Duncan2008). The effect of target velocity is decreased in multi-target displays relative to single-target displays (Shioiri, Yamamoto, Oshida, Matsubara, & Yaguchi, Reference 441Peyrin, Michel and Schwartz2010). Acceleration or deceleration of the moving target results in an increased or decreased flash-lag effect, respectively (Whitney, Murakami, & Cavanagh, Reference Whitney, Murakami and Cavanagh2000). The effect of velocity is larger if target motion is toward fixation (Blohm et al., 2003). Random changes in velocity decrease the flash-lag effect (Vreven & Verghese, Reference Vreven and Verghese2005). The flash-lag effect is influenced by target velocity after the flashed object is presented (Brenner & Smeets, Reference Brenner and Smeets2000), and this is consistent with an account of the flash-lag effect based on postdiction.
Direction of Target Motion. The flash-lag effect is not influenced by whether targets ascend or descend in the picture plane (Ichikawa & Masakura, Reference Ichikawa and Masakura2006, Reference Ichikawa and Masakura2010). If a target reverses direction at the time of the flash, the flash-lag effect is decreased (Whitney & Murakami, Reference Whitney and Murakami1998). If a vertically moving target turns to the left or right, a flash-lag effect occurs even if the direction of change is unpredictable (Chappell & Hinchy, Reference Chappell and Hinchy2014; Whitney, Cavanagh, & Murakami, Reference Whitney, Cavanagh and Murakami2000). The flash-lag effect is larger if a target moves toward fixation than away from fixation (Brenner, van Beers, Rotman, & Smeets, Reference Brenner, van Beers, Rotman and Smeets2006; Kanai et al., Reference Bartolomeo, Urbanski, Chokron, Chainay, Moroni and Siéroff2004; Mateeff & Hohnsbein, Reference Mateeff and Hohnsbein1988). A flash-lag effect also occurs for targets moving in depth (Harris, Duke, & Kopinska, Reference Harris, Duke and Kopinska2006; Ishii, Seekkuarachchi, Tamura, & Tang, Reference Bartolomeo, Urbanski, Chokron, Chainay, Moroni and Siéroff2004). The flash-lag effect decreases if the target unpredictably changes direction near the time of the flash (Arrighi, Alais, & Burr, Reference Arrighi, Alais and Burr2005; Murakami, Reference Murakami2001b; Vreven & Verghese, Reference Vreven and Verghese2005; Whitney et al., Reference Whitney, Cavanagh and Murakami2000).
Binocular Disparity. A flash-lag effect occurs when the moving target or flashed object is defined solely by binocular disparity. This has been found with random-dot stimuli (Harris et al., Reference Harris, Duke and Kopinska2006; Nieman, Nijhawan, Khurana, & Shimojo, Reference Nieman, Nijhawan, Khurana and Shimojo2006) and stereomotion (Lee et al., Reference Dodds, van Belle, Peers, Dove, Cusack and Duncan2008). As noted by Nieman et al. (Reference Nieman, Nijhawan, Khurana and Shimojo2006), finding a flash-lag effect with random-dot stimuli challenges hypotheses that the flash-lag effect results from retinal or low-level phenomena (e.g., as in Berry, Brivanlou, Jordan, & Meister, Reference Jancke, Erlhagen, Dinse, Akhavan, Giese and Steinhage1999).
Color. If a target gradually changes from red to green and a flashed object is presented during the change, a flash-lag effect for color occurs (Sheth, Nijhawan, & Shimojo, Reference Sheth, Nijhawan and Shimojo2000). If observers view a moving green bar and a briefly flashed red bar is superimposed on the green bar, perception of a yellow bar (based on additive color mixing) might be predicted. However, a flash lag effect in which the red bar lags the green bar occurs (Nijhawan, Reference Nijhawan1997). If observers execute smooth pursuit eye movements past a stationary green bar (that appeared to move across the retina in the direction opposite to the direction of eye movement), and a red bar was briefly superimposed on the green bar, the red bar appeared to be shifted in the opposite direction; this is consistent with a flash-lag effect (Nijhawan, Khurana, Kamitani, Watanabe, & Shimojo, Reference Nijhawan, Khurana, Kamitani, Watanabe and Shimojo1998). A flash-lag effect occurs if the moving object changes color (Kreegipuu & Allik, Reference Kreegipuu and Allik2004), but the perceived color change lags perceived position (Cai & Schlag, Reference Cai and Schlag2001; Gauch & Kerzel, Reference Gauch and Kerzel2008b). If target color is maintained or exhibits multiple changes, a flash-lag effect occurs, but a single unexpected change at the moment of the presentation of the flashed object eliminates the flash-lag effect (Au & Watanabe, Reference Au and Watanabe2013).
Luminance. The flash-lag effect decreases if luminance of the flashed object increases (Öğmen, Patel, Bedell, & Camuz Reference Bartolomeo, Urbanski, Chokron, Chainay, Moroni and Siéroff2004; Purushothaman, Patel, Bedell, & Öğmen, Reference Purushothaman, Patel, Bedell and Öğmen1998); if luminance of the flashed object is very high and luminance of the moving target is very low, the flash-lag effect reverses (i.e., a flash-lead effect occurs). A flash-lag effect is found when the moving target and flashed object are luminance modulated, equiluminant, or equiluminant-in-luminance-noise, except for the specific combination of a luminance modulated flashed object and an equiluminant or equiluminant-in-luminance-noise moving target (Chappell & Mullen, Reference Chappell and Mullen2010). Nieman et al. (Reference Nieman, Nijhawan, Khurana and Shimojo2006) found a flash-lag effect with random-dot stimuli equated in luminance with the background and distinguishable only by binocular disparity. Although for a given velocity targets with low luminance are perceived as moving faster than are targets with high luminance, and that the flash-lag effect is generally larger with faster velocities, differences in velocity related to overall luminance do not influence the flash-lag effect (Vaziri-Pashkam & Cavanagh, Reference Vaziri-Pashkam and Cavanagh2011). A flash-lag effect for luminance occurs for a moving target that is changing in luminance and a flashed object presented at the same luminance as the target (Sheth et al., Reference Sheth, Nijhawan and Shimojo2000).
Contrast. With linearly moving targets, decreases in contrast between the flashed object and moving target increases the flash-lag effect (Kanai et al., Reference Bartolomeo, Urbanski, Chokron, Chainay, Moroni and Siéroff2004), and consistent with this, forward displacement of a moving target is increased if contrast between the target and background gradually fades (Maus & Nijhawan, Reference Maus and Nijhawan2009). However, with rotating targets, decreases in contrast between the flashed object and moving target result in a smaller flash-lag effect or a flash-lead effect (Arnold, Ong, & Roseboom, Reference Arnold, Ong and Roseboom2009). This latter finding is not completely consistent with claims the flash-lag effect results from differential latencies in processing moving targets and flashed objects.
Spatial Frequency. If a square wave grating of a given spatial frequency is briefly presented adjacent to a grating that is increasing or decreasing in spatial frequency, a flash-lag effect for spatial frequency occurs (Sheth et al., Reference Sheth, Nijhawan and Shimojo2000). The flash-lag effect is increased as spatial frequency decreases from 1 to 0.25 cycles per degree (Cantor & Schor, Reference 378Cantor and Schor2007). Forward displacement of a blurry target (high spatial frequencies removed) is larger than forward displacement of a focused target (high spatial frequencies intact; Fu, Shen, & Dan, Reference Fu, Shen and Dan2001). An increase in the flash-lag effect with loss of higher spatial frequency information does not reflect an increase in noise, as noise would be randomly distributed around the actual location and would dilute any consistent shift in a specific direction.
Target Identity. Most studies of the flash-lag effect presented geometric stimuli such as annuli, bars, and disks. If targets are chimeric stimuli comprised of the top half of one (human) face and the bottom half of another (human) face, and the top half is flashed, then observers who judge the identity of the person in the top half perform better when the bottom half is moving than when the bottom half is stationary; this was attributed to a flash-leg effect disrupting normal perceptual alignment effects in facial recognition (Khurana, Carter, Watanabe, & Nijhawan, Reference Khurana, Carter, Watanabe and Nijhawan2006). If a single change in moving target size corresponds with presentation of the flashed object, then the flash-lag effect decreases; this has been attributed to failure to update the original object file of the moving target, and so the suddenly differently sized target is perceived as a different object from the original target (Moore & Enns, Reference Moore and Enns2004). As discussed below, semantic meaningfulness regarding identity or object category attributed to the stimulus influences the flash-lag effect.
Duration of the Flashed Object. Surprisingly, many studies of the flash-lag effect do not report duration of the flashed object. Some studies report use of a single duration ranging from 5 (e.g., Shi & Nijhawan, Reference Shi and Nijhawan2008) to 70 (e.g. Moore & Enns, Reference Moore and Enns2004) msec. Other studies report multiple durations ranging from 1–193 msec (Rotman, Brenner, & Smeets, Reference Rotman, Brenner and Smeets2005) or 24–200 msec (Cantor & Shor, Reference 378Cantor and Schor2007). Eagleman and Sejnowski (Reference Eagleman and Sejnowski2000c) suggested a flash-lag effect would not occur for flash durations longer than 80 msec, but Krekelberg and Lappe (Reference Krekelberg and Lappe1999) reported a flash-lag effect with flash durations of 500 msec.
Motion of the Flashed Object. In most studies of the flash-lag effect, the flashed object is stationary. Indeed, Eagleman and Sejnowski (Reference 389Eagleman and Sejnowski2007) claimed a flash-lag effect would turn into a flash-drag effect if motion were attributed to the flashed object. However, when a flashed object briefly moves along with the moving target, a flash-lag effect can still occur (e.g., Cravo & Baldo, Reference Cravo and Baldo2008), but decreases with increasing motion of the flashed object (Bachmann & Kalev, Reference Bachmann and Kalev1997; Krekelberg & Lappe, Reference Krekelberg and Lappe1999). It is not yet possible to disentangle effects of increased motion of the flashed object from effects of increased duration of the flashed object. A decrease in the flash-lag effect with increased motion of the flashed object might reflect an increase in perceptual processing speed for the flashed object over time (Bachmann, Luiga, Põder, & Kalev, Reference Bachmann, Luiga, Põder and Kalev2003) or an increasing ability to extrapolate position of the flashed object over time. A moving flashed object results in a larger flash-lag effect than does a stationary flashed object for flash-initiated and flash-terminated, but not for flash-midpoint, displays (Gauch & Kerzel, Reference Gauch and Kerzel2008a).
Predictability of the Flashed Object. The validity of a cue presented 100 or 500 msec before the flashed object and indicating whether the flashed object would be on the left or right side of a display does not influence the flash-lag effect (Khurana et al., Reference Khurana, Watanabe and Nijhawan2000). However, a valid cue presented 3,000–5,000 msec before the flashed object appeared results in a smaller flash-lag effect than does an invalid cue (Namba & Baldo, Reference Namba and Baldo2004), and a cue visible from the beginning of a trial until the flashed object appears decreases the flash-lag effect (Brenner & Smeets, Reference Brenner and Smeets2000). The flash-lag effect decreases the second time a stimulus is shown (the first time is analogous to a cue; Rotman et al., Reference Rotman, Brenner and Smeets2005). Cueing which target in a multi-target display would be nearest the flashed object decreases the flash-lag effect (Shioiri et al., Reference 441Peyrin, Michel and Schwartz2010). In general, the flash-lag effect is largest when unpredictability of the flashed object is highest (Baldo, Kihara, et al., Reference Baldo, Kihara, Namba and Klein2002; Baldo & Namba, Reference Baldo and Namba2002; Vreven & Verghese, Reference Vreven and Verghese2005).
Presence of Unrelated Stimuli. If an unrelated stimulus moves toward the location where a flashed object will appear, the flash-lag effect is larger than if an unrelated stimulus moves away from the location where the flashed object will appear (Maiche, Budelli, & Gómez-Sena, Reference Maiche, Budelli and Gómez-Sena2007). Similarly, if an unrelated stimulus moves toward the moving target and is occluded by the target at the time the flashed object is presented, the flash-lag effect increases regardless of whether the unrelated stimulus vanishes after being occluded or emerges from occlusion and continues its original direction of motion (Bachmann, Murd, & Põder, Reference Bachmann, Murd and Põder2012). Bachmann et al. (Reference Bachmann, Murd and Põder2012) suggest this finding is inconsistent with many theories of the flash-lag effect; however, Bachmann et al.’s rejection of attention shift theory in particular might be overstated, as presence of an unrelated object (i.e., divided attention) is linked to increases in other spatial biases such as representational momentum (Hayes & Freyd, Reference Hayes and Freyd2002) and boundary extension (Intraub, Daniels, Horowitz, & Wolfe, Reference Dodds, van Belle, Peers, Dove, Cusack and Duncan2008).
Characteristics of the Observer
Characteristics of the observer that influence the flash-lag effect include (a) allocation of attention, (b) eye movements and eye fixations, (c) body movements of the observer, (d) perceived control of the moving target or flashed object by the observer, and (e) semantic or other meaningfulness the observer attributes to the stimulus.
Allocation of Attention. The flash-lag effect increases as distance between the moving target and flashed object increases, and this has been attributed to the time required to shift attention from the moving target to the flashed object (Baldo & Klein, Reference Baldo and Klein1995). In a multi-target display in which one target is cued, the flash-lag effect increases as distance of the flashed object from the cued target increases (Shioiri et al., Reference 441Peyrin, Michel and Schwartz2010). However, embedding the flashed object within the moving target (thus removing the need for a shift of attention across space) also results in a flash-lag effect (Khurana & Nijhawan, Reference Khurana and Nijhawan1995). The flash-lag effect increases if observers are engaged in a concurrent task (Sarich, Chappell, & Burgess, Reference Sarich, Chappell and Burgess2007; Scocchia, Actis-Grosso, de?Sperati, Stucchi, & Baud-Bovy, Reference Doricchi, Merola, Aiello, Guariglia, Bruschini and Gevers2009). The larger flash-lag effect with random-dot stimuli in Nieman et al. (Reference Nieman, Nijhawan, Khurana and Shimojo2006) supports a role of attention: tracking the target required greater attention, thus leaving less attention for detection of the flashed object, resulting in the flashed object requiring even longer to process and enter into awareness.
Eye Movements and Eye Fixation. If observers fixate a central point around which a moving target is revolving, a flash-lag effect occurs, whereas if observers track the revolving target, a flash-lag effect does not occur (Nijhawan, Reference Nijhawan1997, Reference Nijhawan2001). A flash-lag effect occurs if the flashed stimulus is presented during smooth anticipatory eye movement (Blohm et al., 2003; cf. Nijhawan, Reference Nijhawan2001). The location of a flashed object is shifted in the direction of eye movement as a moving target is tracked (Rotman, Brenner, & Smeets, Reference Rotman, Brenner and Smeets2002; Rotman et al., Reference Rotman, Brenner and Smeets2005) or in the direction of gaze after the flash (Rotman, Brenner, & Smeets, Reference Bartolomeo, Urbanski, Chokron, Chainay, Moroni and Siéroff2004). A flash-lag effect occurs during pursuit motion if a flashed object is above or below the horizontal trajectory of a moving target (van Beers, Wolpert, & Haggard, Reference van Beers, Wolpert and Haggard2001). If the flash involves an object in a specific location (rather than a background flash), subsequent saccades to the location of the flashed object are not displaced, but subsequent saccades to the location of the moving target at the time of the flashed object are displaced in the direction of motion (Becker et al., Reference Becker, Ansorge and Turatto2009).
Body Movement. If observers in a darkened environment focus on an illuminated stationary line and move their heads back and forth, and another illuminated line aligned with the first line is flashed in mid-movement, then a flash-lag effect occurs (Schlag, Cai, Dorfman, Mohempour, & Schlag-Rey, Reference Schlag, Cai, Dorfman, Mohempour and Schlag-Rey2000). If observers in a darkened environment sit in a rotating chair and a continuously illuminated line rotates with the chair, a flash-lag effect occurs if a stationary line is briefly presented near the continuously illuminated line (Cai, Jacobson, Baloh, Schlag-Rey, & Schlag, Reference Cai, Jacobson, Baloh, Schlag-Rey and Schlag2000). A flash-lag effect occurs if observers in a darkened environment move their (nonvisible) hands and a stationary visual line is flashed near their hand (Nijhawan & Kirschfeld, Reference Nijhawan and Kirschfeld2003), or if a vibration is applied to a finger of a hand moving past a stationary finger on the observer’s other hand (a buzz-lag effect; Cellini, Scocchia, & Drewing, Reference Cellini, Scocchia and Drewing2016). Thus, a flash-lag effect can occur with passive or active motion of one’s own body. A flash-lag effect can also occur for judgments of another person’s movements relevant to a flashed object (Kessler, Gordon, Cessford, & Lages, Reference Kessler, Gordon, Cessford and Lages2010).
Control. If observers believe they control target motion, the flash-lag effect decreases (Ichikawa & Masakura, Reference Ichikawa and Masakura2006, Reference Ichikawa and Masakura2013), but only if mapping between observers’ movements (i.e., body movements controlling a computer mouse, which control target motion) and target movements were familiar (Ichikawa & Masakura, Reference Ichikawa and Masakura2010). However, the flash-lag effect increases if observers actually control target motion, and this might reflect greater attention required for control of the target, leaving less capacity available for processing information related to the flashed object (Scocchia et al., Reference Doricchi, Merola, Aiello, Guariglia, Bruschini and Gevers2009). If observers control presentation of the flashed object, then the flash-lag effect decreases (López-Moliner & Linares, Reference López-Moliner and Linares2006). This is consistent with the possibility that the flash-lag effect results at least in part from high-level attributions regarding the source of target motion.
Meaningfulness. The flash-lag effect is influenced by Gestalt perceptual grouping imposed on a stimulus, and is larger if the flashed object is nearer the leading edge of a moving target than the trailing edge of that moving target (Watanabe, Reference Watanabe2004; Watanabe, Nijhawan, Khurana, & Shimojo, Reference Watanabe, Nijhawan, Khurana and Shimojo2001). The flash-lag effect decreases if moving targets or flashed objects are meaningful (e.g., kanji segments for Japanese speakers; Noguchi & Kakigi, Reference Noguchi and Kakigi2008). Relatedly, if the moving target is an object with a typical facing direction or direction of motion (e.g., a photograph of an automobile) and the flashed object is a dot presented above the target, then the flash-lag effect is larger with backward motion than with forward motion of the target (Nagai, Suganuma, Nijhawan, Freyd, Miller, & Watanabe, Reference Nagai, Suganuma, Nijhawan, Freyd, Miller, Watanabe, Nijhawan and Khurana2010). The complementary pattern can also occur, as the flash-lag effect can influence processing of meaningful stimuli (e.g., faces; Khurana et al., Reference Khurana, Carter, Watanabe and Nijhawan2006).
Properties of the Flash-Lag Effect
Properties of the flash-lag effect involve whether the flash-lag effect is (a) primarily spatial or temporal, (b) a bias in perception of the moving target or the flashed object, (c) multisensory or crossmodal, (d) primarily low-level or high-level, (e) related to continuity of target behavior, (f) related to other spatial biases associated with a flashed object, and (g) related to spatial biases not associated with a flashed object.
Spatial or Temporal?
Theories based on motion extrapolation emphasize spatial aspects of the flash-lag effect (e.g., Nijhawan, Reference Nijhawan1994, Reference Nijhawan2008), whereas theories based on differential latencies emphasize temporal aspects of the flash-lag effect (e.g., Whitney & Cavanagh, Reference Whitney, Cavanagh and Murakami2000). Theories based on postdiction emphasize spatial (e.g., Eagleman & Sejnowski, Reference Eagleman and Sejnowski2002) or temporal (e.g., Whitney, Reference Whitney2002) aspects of the flash-lag effect. Temporal judgments (i.e., did a moving target change color prior to presentation of a flashed object?) and spatial judgments (i.e., did a moving target change color after passing a flashed object?) can be dissociated (Kreegipuu & Allik, Reference Kreegipuu and Allik2004; also Gauch & Kerzel, Reference Gauch and Kerzel2008b). Such dissociations probably involve differences in processing latencies for different types of information (e.g., information about color is perceptually available earlier than information about motion; Arnold, Clifford, & Wenderoth, Reference Arnold, Clifford and Wenderoth2001). Other researchers (e.g., Murakami, Reference Murakami2001a) emphasize that the flash-lag effect involves spatiotemporal correlation. As space cannot be traversed without passing through time (and for a moving object, elapsed time relates to traversed space), it seems reasonable to consider the flash-lag effect as spatial and temporal. Indeed, interaction of spatial information and temporal information is found in other illusions (e.g., tau and kappa effects; Collyer, Reference Collyer1977; Jones & Huang, Reference Jones and Huang1982).
Moving Target or Flashed Object?
The flash-lag effect involves bias regarding relative positions of the moving target and flashed object, but it is not initially clear if this involves bias regarding judgment of absolute location of the moving target and/or bias regarding judgment of absolute location of the flashed object. The name “flash-lag” implies veridical perception of the moving target and distortion (i.e., lagging) in perceived location of the flashed object (cf. Nijhawan, Reference Nijhawan2001), but some theories of the flash-lag effect posit veridical perception of the flashed object and distortion (displacement) in perceived location of the moving target. Displacement of absolute locations of the moving target and flashed object have been examined in two studies. In one study, a moving target followed an arc, and the flashed object was a dot in front of or behind the target; judgments of absolute locations of the dot and the target at the time the dot was presented revealed forward displacement for the dot and target, with a larger displacement for the target resulting a flash-lag effect (Shi & de’Sperati, Reference Shi and de’Sperati2008). In another study, a briefly presented stationary object was presented above or below the final location of a horizontally moving target, and the stationary object and moving target were displaced forward (Hubbard, Reference Hubbard2008); lack of a difference in displacement is consistent with lack of a flash-lag effect in flash-terminated displays. Thus, the flash-lag effect might be a derived or second-order illusion resulting from more basic illusions involving perceived absolute positions of the moving target and flashed object (Hubbard, Reference Hubbard2014b).
Multi-Sensory or Crossmodal?
Most research on the flash-lag effect involved visual stimuli, but evidence of auditory, haptic, and crossmodal flash-lag effects have been reported. If the moving target is an auditory frequency sweep or a single auditory frequency moving across space, and the flashed object is a briefly presented tone, an auditory flash-lag effect occurs (Alais & Burr, Reference Alais and Burr2003). If a visual target is moving across space and a localized auditory tone is briefly presented, or if an auditory frequency is moving across space and a localized visual stimulus is briefly presented, then a crossmodal flash-lag effect occurs (Alais & Burr, Reference Alais and Burr2003; but see Hine, White, & Chappell, Reference Hine, White and Chappell2003). If a vibration is applied to a finger of a hand moving past a stationary finger on the observer’s other hand, a haptic flash-lag effect occurs (Cellini et al., Reference Cellini, Scocchia and Drewing2016). If participants in a darkened room move their hand, a brief visual flash aligned with the hand is perceived as lagging behind the hand’s position (Nijhawan & Kirschfeld, Reference Nijhawan and Kirschfeld2003). Crossmodal information can also decrease the flash-lag effect; if observers view a visual moving target, an auditory tone briefly presented before or after a visual flash decreases or increases, respectively, the flash-lag effect (Stekelenburg & Vroomen, Reference Stekelenburg and Vroomen2005; Vroomen & de Gelder, Reference Vroomen and de Gelder2004).
Low Level or High Level?
Several studies suggest high-level processes are involved in the flash-lag effect. The flash-lag effect does not occur prior to perceptual grouping (e.g., Watanabe, Reference Watanabe2004; Watanabe et al., Reference Watanabe, Nijhawan, Khurana and Shimojo2001), pattern recognition (e.g., Linares & López-Moliner, Reference Linares and López-Moliner2007), or tilt illusion (Arnold, Durant, & Johnston, Reference Arnold, Durant and Johnston2003). The flash-lag effect is influenced by conceptual knowledge (e.g., Nagai et al., Reference Nagai, Suganuma, Nijhawan, Freyd, Miller, Watanabe, Nijhawan and Khurana2010; Noguchi & Kakigi, Reference Noguchi and Kakigi2008), beliefs regarding control of the target (Ichikawa & Masakura, Reference Ichikawa and Masakura2006, Reference Ichikawa and Masakura2010), and predictability of the flashed object (Baldo & Namba, Reference Baldo and Namba2002; Vreven & Verghese, Reference Vreven and Verghese2005). A visual flash-lag effect is influenced by presentation of an auditory tone (Vroomen & de Gelder, Reference Vroomen and de Gelder2004), and a flash-lag effect occurs if the moving target and flashed object are in different modalities (Alais & Burr, Reference Alais and Burr2003; Nijhawan & Kirschfeld, Reference Nijhawan and Kirschfeld2003). A flash-lag effect occurs if the moving target and flashed object are presented to different eyes (Whitney & Cavanagh, Reference Whitney and Cavanagh2000b) or in random-dot stereograms (e.g., Harris et al., Reference Harris, Duke and Kopinska2006; Nieman et al., Reference Nieman, Nijhawan, Khurana and Shimojo2006). However, Anstis (Reference Anstis2007, Reference Anstis, Nijhawan and Khurana2010) found a flash-lag effect with stimuli based on a chopsticks illusion and a reversed phi illusion, and he suggested the flash-lag effect reflected physical rather than perceived motion. Also, activation patterns in retinal cells appear to extrapolate a moving target’s trajectory (Gollisch & Meister, Reference Gollisch and Meister2010). It is likely the flash-lag effect involves a combination of low-level and high-level processes or involves top-down influences on low-level processes (e.g., Erlhagen, Reference Erlhagen2003; Gauch & Kerzel, Reference Gauch and Kerzel2009; Jancke & Erlhagen, Reference Jancke, Erlhagen, Nijhawan and Khurana2010).
Continuity of Target Behavior?
A flash-lag effect occurs if the moving target exhibits continuous motion or implied motion involving discrete and distinct presentations of the target (Rizk et al., Reference Doricchi, Merola, Aiello, Guariglia, Bruschini and Gevers2009), although the flash-lag effect is weaker with implied motion. The flash-lag effect decreases if the target unpredictably changes direction near the time of the flash (Arrighi et al., Reference Arrighi, Alais and Burr2005; Murakami, Reference Murakami2001b; Vreven & Verghese, Reference Vreven and Verghese2005; Whitney et al., Reference Whitney, Cavanagh and Murakami2000). Random changes in velocity decrease the flash-lag effect (Vreven & Verghese, Reference Vreven and Verghese2005). If target color is constant or exhibits multiple changes, a flash-lag effect occurs, but a single color change corresponding with presentation of the flashed object eliminates the flash-lag effect (Au & Watanabe, Reference Au and Watanabe2013). A single change in target size corresponding with presentation of the flashed object decreases the flash-lag effect (Moore & Enns, Reference Moore and Enns2004). In general, if disruption in continuity of the target can be bridged by a simple extrapolation that connects the pre-change and post-change target (e.g., implied motion using discrete and separate stimuli), then perception of a single target undergoing motion (or other change) is preserved, and a flash-lag effect occurs. However, if a disruption in continuity cannot be bridged by such an extrapolation (e.g., a single change in size or color at the moment the flashed object is presented), then the moving target is no longer perceived as a single target undergoing motion, and the flash-lag effect does not occur.
Relationship to Other Flash-Related Spatial Biases?
The flash-lag effect is one of several phenomena related to relative positions of a flashed object (or other transient change) and a moving target. Other examples include the flash-lead, flash-drag, flash-grab, and flash-jump effects.
Flash-Lead. In the flash-lead effect, judged location of a briefly flashed object leads rather than lags judged location of a moving target. Increasing luminance of a flashed object (Öğmen et al., Reference Bartolomeo, Urbanski, Chokron, Chainay, Moroni and Siéroff2004; Purushothaman et al., Reference Purushothaman, Patel, Bedell and Öğmen1998) or ratio of luminance of the flashed object to luminance of the moving target (Baldo & Caticha, Reference Baldo and Caticha2005) increases likelihood of a flash-lead effect. Whether absolute intensities or ratio of intensities of the moving target and the flashed object is important for flash-lag and flash-lead effects for stimulus dimensions other than luminance is not known. Additionally, precuing location of the flashed object (Hommuk, Bachmann, & Oja, Reference Dodds, van Belle, Peers, Dove, Cusack and Duncan2008), and decreasing contrast between the moving target and flashed object (Arnold et al., Reference Arnold, Ong and Roseboom2009), can result in a flash-lead effect. If a moving target in a flash-terminated display vanishes at the end of target motion, a flash-lead effect can occur (Roulston, Self, & Zeki, Reference Roulston, Self and Zeki2006; but see Kanai et al. Reference Bartolomeo, Urbanski, Chokron, Chainay, Moroni and Siéroff2004). A flash-lead effect rather than a flash-lag effect can be observed for the first item in a perceptual stream (Bachmann & Põder, Reference Bachmann and Põder2001) and when target motion is away from the fovea (Shi & Nijhawan, Reference Shi and Nijhawan2008). Hine et al. (Reference Hine, White and Chappell2003) reported a flash-lead effect with an auditory flashed object (a click) and a visual moving target.
Flash-Drag. In the flash-drag effect, memory for the position of a briefly flashed object is shifted in the direction of nearby motion (cf. Shi & de’Sperati, Reference Shi and de’Sperati2008). For example, position of a flashed grating is shifted in the direction of motion of a larger inducer grating (Fukiage, Whitney, & Murakami, Reference 375Bourlon, Duret, Pradat-Diehl, Azouvi, Loeper-Jeny and Merat-Blanchard2011). Durant and Johnston (Reference Durant and Johnston2004) reported displacement of stationary flashed stimuli aligned with a rotating bar in the direction of rotation. Hubbard (Reference Hubbard2008) reported displacement of a stationary object aligned with the final location of a horizontally moving target in the direction of motion. Eagleman and Sejnowski (Reference 389Eagleman and Sejnowski2007) suggested the flash-lag and flash-drag effects worked in opposite directions, and increases in the flash-drag effect diluted the flash-lag effect. Curiously, a flash-drag effect (Kosovicheva et al., Reference Kosovicheva, Maus, Anstis, Cavanagh, Tse and Whitney2012), but not a flash-lag effect (Fukiage & Murakami, Reference Fukiage and Murakami2010), influences a tilt aftereffect; however, a flash-drag effect does not influence a position aftereffect (Fukiage & Murakami, Reference Fukiage and Murakami2013). The existence of a flash-drag effect might reflect spreading activation from the target resulting in a shift of the center of activation of the flashed object (in a network representing spatial location) toward the target (cf. Hubbard, Reference Hubbard2008). The flash-drag effect often involves a stationary stimulus (e.g., Whitney & Cavanagh, Reference Whitney and Cavanagh2000b), but a flash-drag effect could be hypothesized to occur with movement of the flashed object.
Flash-Grab. If a target moves back-and-forth, trajectory of that oscillation appears shorter than it actually is (Sinico, Parovel, Casco, & Anstis Reference Doricchi, Merola, Aiello, Guariglia, Bruschini and Gevers2009). In the flash-grab effect, a flashed object at the end of an oscillating trajectory (and which occludes the target) is perceived to be at the endpoint of the perceived trajectory rather than the endpoint of the physical trajectory (Cavanagh & Anstis, Reference Cavanagh and Anstis2013). Although the flash-grab effect seems similar to displacement of a flashed object in the direction of target motion in the flash-drag effect, Cavanagh and Anstis (Reference Cavanagh and Anstis2013) argue the flash-grab effect has a different temporal profile, requires more attention, and is larger than the flash-drag effect. The only reported instances of the flash-grab effect involve oscillating targets, and so whether the flash-grab effect is limited to such stimuli remains an open question. The flash-grab effect contributes to a tilt aftereffect (Ge, Wang, & He, Reference Ge, Wang and He2015), might involve feedback signals from higher visual areas to early retinotopic cortex (Zhou, Ge, Wang, Zhang, & He, Reference Zhou, Ge, Wang, Zhang and He2015), and occurs with visual stimuli and auditory stimuli (Krüger et al., Reference Krüger, Collins, Pressnitzer, Kang, Teki and Patrick2015).
Flash-Jump. In the flash-jump effect, a moving object undergoes a transient change in some feature such as color or size, and that change is judged to have occurred farther along the trajectory (Cai & Schlag, Reference Cai and Schlag2001; Gauch & Kerzel, Reference Gauch and Kerzel2008b). The flash-jump effect has also been referred to as the feature flash-drag effect by Eagleman and Sejnowski (Reference 389Eagleman and Sejnowski2007), as localization of a feature change is displaced (i.e., dragged) in the direction of motion. Cai and Schlag (Reference Cai and Schlag2001) suggest the flash-jump effect results from asynchronous feature binding, and this is related to the idea of object updating in Moore and Enns (Reference Moore and Enns2004); specifically, different features are processed at different rates, and information relevant to different features emerges in perceptual awareness at different times. Alternatively, Eagleman and Sejnowski (Reference 389Eagleman and Sejnowski2007) suggested the flash-jump effect resulted from general motion-biasing effects.
Relationship to Non-Flash Spatial Biases?
The flash-lag effect is consistent with several non-flash phenomena. These include spatial biases studied primarily in the laboratory (Fröhlich effect, representational momentum, backward referral, anisotropic distortions) as well as real-world applications (flag errors in association football).
Fröhlich Effect. The perceived onset (initial) location of a moving target is often displaced in the direction of target motion, and this is referred to as a Fröhlich effect (for review, Kerzel, Reference Kerzel, Nijhawan and Khurana2010; Müsseler & Kerzel, Chapter 7 in this volume). Forward displacement in the Fröhlich effect appears similar to forward displacement of the moving target in the flash-lag effect (cf. Kreegipuu & Allik, Reference Kreegipuu and Allik2003). The Fröhlich effect (e.g., Müsseler & Aschersleben, Reference Müsseler and Aschersleben1998) and flash-lag effect (e.g., Wojtach, Sung, Truong, & Purves, Reference Dodds, van Belle, Peers, Dove, Cusack and Duncan2008) increase with increases in target velocity. The Fröhlich effect (Whitney & Cavanagh, Reference Whitney and Cavanagh2000b) and flash-lag effect (Namba & Baldo, Reference Namba and Baldo2004; Vreven & Verghese, Reference Vreven and Verghese2005) are decreased by presentation of a valid cue. The Fröhlich effect (Müsseler & Aschersleben, Reference Müsseler and Aschersleben1998) and flash-lag effect (Baldo & Klein, Reference Baldo and Klein1995) have been suggested to reflect the time required to shift attention. Given such similarities, displacement of a moving target in a flash-initiated display might appear as nothing more than a Fröhlich effect; indeed, the same mechanisms have been suggested to underlie the Fröhlich effect and flash-lag effect (e.g., Eagleman & Sejnowksi, Reference 389Eagleman and Sejnowski2007; Kirschfeld & Kammer, Reference Kirschfeld and Kammer1999; Müsseler, Stork, & Kerzel, Reference Müsseler, Stork and Kerzel2002). However, the flash-lag effect (Baldo, Kihara, et al., Reference Baldo, Kihara, Namba and Klein2002), but not the Fröhlich effect (Müsseler & Aschersleben, Reference Müsseler and Aschersleben1998), is influenced by eccentricity. When measured on the same set of stimuli, the flash-lag effect is larger than the Fröhlich effect (Chappell, Hine, Acworth, & Hardwick, Reference Chappell, Hine, Acworth and Hardwick2006).
Representational Momentum. The perceived offset (final) location of a moving target is often displaced in the direction of target motion, and this is referred to as representational momentum (for review, Hubbard, Reference Hubbard2005b, Reference Hubbard2014a, Chapter 8 in this volume). Forward displacement in representational momentum appears similar to forward displacement of the moving target in the flash-lag effect (Munger & Owens, Reference Munger and Owens2004; Shi & de’Sperati, Reference Shi and de’Sperati2008). Representational momentum (Hubbard & Bharucha, Reference 408Hubbard and Bharucha1988) and the flash-lag effect (Wojtach et al., Reference Dodds, van Belle, Peers, Dove, Cusack and Duncan2008) increase with increases in target velocity. Representational momentum (Hubbard, Kumar, & Carp, Reference Doricchi, Merola, Aiello, Guariglia, Bruschini and Gevers2009) and the flash-lag effect (Namba & Baldo, Reference Namba and Baldo2004; Vreven & Verghese, Reference Vreven and Verghese2005) are decreased by presentation of a valid cue. Representational momentum (Reed & Vinson, Reference Reed and Vinson1996) and the flash-lag effect (Nagai et al., Reference Nagai, Suganuma, Nijhawan, Freyd, Miller, Watanabe, Nijhawan and Khurana2010; Noguchi & Kakigi, Reference Noguchi and Kakigi2008) are influenced by conceptual knowledge of the target. Representational momentum (Hubbard, Reference Hubbard2013c; Hubbard, Blessum, & Ruppel, Reference Hubbard and Blessum2001) and the flash-lag effect (Ichikawa & Masakura, Reference Ichikawa and Masakura2006, Reference Ichikawa and Masakura2010) are influenced by attributions regarding the source of target motion. Representational momentum (Jordan & Hunsinger, Reference Jordan and Hunsinger2008) and the flash-lag effect (Scocchia et al., Reference Doricchi, Merola, Aiello, Guariglia, Bruschini and Gevers2009) are influenced by whether the observer controls the stimulus. Representational momentum (Hayes & Freyd, Reference Hayes and Freyd2002) and the flash-lag effect (Sarich et al., Reference Sarich, Chappell and Burgess2007) are increased under divided attention. Representational momentum (Hubbard & Ruppel, Reference Hubbard and Ruppel1999) and the flash-lag effect (Brenner et al., Reference Brenner, van Beers, Rotman and Smeets2006; Shi & Nijhawan, Reference Shi and Nijhawan2008) increase with motion toward a landmark or fixation. Hubbard (Reference Hubbard2013b, Reference Hubbard2014b) suggested forward displacement of the moving target in representational momentum and in the flash-lag effect are similar, but in the former, displacement of the target is measured relative to the actual position of the target, whereas in the latter, displacement of the target is measured relative to a nearby stationary object.
Backward Referral. Libet and his colleagues had experimental participants make a voluntary finger movement, and those participants noted the time on a clock face at which they decided to initiate movement (Libet, Reference Libet1985; Libet, Wright, & Gleason, Reference Libet, Wright and Gleason1982; Libet, Gleason, Wright, & Pearl, Reference Libet, Gleason, Wright and Pearl1983). The average reported time of the conscious decision was 200 msec prior to movement, but a readiness potential appeared in participants’ EEG 500 msec prior to movement. Libet and colleagues interpreted this as suggesting that a decision to move was implemented before a participant became consciously aware of such a decision, and so the timing of the subjective conscious intent was “adjusted” backward in time to reflect the timing of the unconscious decision (cf. the notion of “postdiction” discussed below). This adjustment of the timing of conscious decision was referred to as backward referral. Alternatively, apparent incongruity in conscious and unconscious decision times might result from a flash-lag effect (Klein, Reference Klein2002; van de Grind, Reference van de Grind2002) or representational momentum (Joordens, Spalek, Razmy, & van Duijn, Reference Bartolomeo, Urbanski, Chokron, Chainay, Moroni and Siéroff2004); in these latter cases, represented location of the moving hand on the clock face is displaced forward from its actual position, and so timing of the conscious decision to move appeared more recent than it actually was.
Anisotropic Distortions. In studies of the flash-lag effect with visual stimuli, the flash-lag effect is larger if targets move toward fixation than away from fixation (Shi & Nijhawan, Reference Shi and Nijhawan2008) and if measured at onset of the flashed object than at offset of the flashed object (Bachmann & Kalev, Reference Bachmann and Kalev1997). The flash-lag effect is larger for targets in the left visual field relative to the right visual field and larger for targets in the upper visual field relative to the lower visual field (Kanai et al., Reference Bartolomeo, Urbanski, Chokron, Chainay, Moroni and Siéroff2004). Effects of perceptual grouping on the flash-lag effect (Watanabe, Reference Watanabe2004; Watanabe et al., Reference Watanabe, Nijhawan, Khurana and Shimojo2001) suggest anisotropic distortions associated with the flash-lag effect; indeed, Watanabe and Yokoi (Reference Watanabe and Yokoi2006, Reference Watanabe and Yokoi2007) suggest the flash-lag effect is a special case of two-dimensional anisotropic distortion. However, it is not clear if anisotropic distortions associated with the flash-lag effect occur with nonvisual or crossmodal stimuli or are limited to visual stimuli. More critically, it is not clear whether anisotropic distortions cause the flash-lag effect or if the flash-lag effect causes anisotropic distortions (cf. Rowland & Durant, Reference Rowland and Durant2014). If the former, it might be possible to link other spatial biases to the flash-lag effect through mechanisms or properties of anisotropy; if the later, spatial representation is more flexible and idiosyncratic than often assumed (cf. Tversky, Chapter 16 in this volume).
Judgments of “Offsides”. In association football (known as soccer in North America), judgment of “offsides” occurs when a player is in the opponent’s half of the field, the ball is played to him by a teammate, and he is closer to the goal line at the moment the pass is initiated than both the ball and the second-to-last defender (the last one being the goalkeeper). Referees are more likely to call an offsides penalty when an offsides is not present (referred to as a flag error) than to not call an offsides penalty when an offsides is present (i.e., more likely to false alarm than to miss; although see Wühr, Fasold, & Memmert, Reference Wühr, Fasold and Memmert2015). Baldo, Ranvaud, and Morya (Reference Baldo, Kihara, Namba and Klein2002) suggested flag errors resulted from a flash-lag effect: The player is analogous to the moving target, passing a ball is analogous to a transient flashed object, and position of the player is displaced forward relative to position of the ball (see Catteeuw, Gilis, Wagemans, & Helsen, Reference Catteeuw, Gilis, Wagemans and Helsen2010; Giles et al., Reference Dodds, van Belle, Peers, Dove, Cusack and Duncan2008). Studies of expert referees, amateur referees, and controls suggest that expert referees are more able to compensate (i.e., avoid flag errors) and that compensation involves a shift in decision-making rather than perception (Catteeuw, Helsen, Gilis, van Roie, & Wagemans, Reference 379Catteeuw, Helsen, Gilis, van Roie and Wagemans2009; Put et al., 2012). Simulations and computer animations are useful in training referees to avoid flag errors (Catteeuw, Gilis, Jaspers, Wagemans, & Helsen, Reference Catteeuw, Gilis, Jaspers, Wagemans and Helsen2010).
Theories of the Flash-Lag Effect
Several theories of the flash-lag effect have been proposed, but none account for all of the data or are universally accepted. The most well-known theories include (a) motion extrapolation, (b) attention shift, (c) differential latencies, (d) postdiction, and (e) perceptual acceleration.
Motion Extrapolation
The most well-known theory of the flash-lag effect involves motion extrapolation. Nijhawan (Reference Nijhawan1994, Reference Nijhawan2008) suggested the flash-lag effect occurs because the visual system extrapolates the trajectory of a moving target to compensate for delays in perception due to neural processing times. Without such compensation, perceived position of a moving target would lag behind the actual position of that target. Such an account is similar to representational momentum (see Hubbard, Reference Hubbard2005b, Reference Hubbard2013b, Reference Hubbard2014a, Chapter 8 in this volume), but curiously, representational momentum is not mentioned in discussions of motion extrapolation theory. Motion extrapolation has intuitive appeal; however, several findings initially appear inconsistent with motion extrapolation. A flash-lag effect occurs with random motion (Murakami, Reference Murakami2001b) and unpredictable changes in target direction (Chappell & Hinchy, Reference Chappell and Hinchy2014; Eagleman & Sejnowski, Reference Eagleman and Sejnowski2000b; Whitney, Cavanagh, & Murakami, Reference Whitney, Murakami and Cavanagh2000) and target velocity (Brenner & Smeets, Reference Brenner and Smeets2000); random or unpredictable motion would not (by definition) be predictable and able to be extrapolated. Occurrence of a flash-lag effect in flash-initiated displays (when prediction would not be possible) and lack of a flash-lag effect in flash-terminated displays (when prediction should be maximized) are problematic (but see Nijhawan, Reference Nijhawan2008).
Attention Shift
Attention shift theory suggests attention is initially focused on the moving target, and when the flashed object appears, attention shifts from the moving target to the flashed object. This shift takes time, and during this time, the moving target continues to move. By the time information regarding the flashed object reaches conscious awareness, the moving object has already moved some distance beyond where it was located when the flashed object initially appeared, and so the location of the flashed object is perceived as lagging behind the location of the moving target. An attention shift theory is consistent with effects of target velocity (Nijhawan, Reference Nijhawan1994), cueing (Namba & Baldo, Reference Namba and Baldo2004), and predictability of the flashed object (Baldo & Namba, Reference Baldo and Namba2002; Vreven & Verghese, Reference Vreven and Verghese2005). The attention shift notion was initially proposed by Baldo and Klein (Reference Baldo and Klein1995), but Baldo and colleagues have subsequently taken a more conservative view that distribution and allocation of attention modulate but probably do not cause the flash-lag effect (Baldo & Klein, Reference Baldo, Klein, Nijhawan and Khurana2010; Baldo, Kihara et al., Reference Baldo, Kihara, Namba and Klein2002). Findings inconsistent with attention shift theory include occurrence of a flash-lag effect when the flashed object is embedded in (interleaved with) the moving target (e.g., Khurana & Nijhawan Reference Khurana and Nijhawan1995) and occurrence of a flash-lag effect in flash-initiated stimuli.
Differential Latencies
Differential latencies theory suggests a moving target is processed (and reaches conscious awareness) more quickly than does a stationary flashed object. If a moving target and flashed object were aligned, information regarding the moving target would reach perceptual awareness more quickly; therefore, when information regarding the flashed object reached perceptual awareness, the moving target would already be perceived as further along its trajectory (e.g., Kafaligönül, Patel, Öğmen, Bedell, & Purushothaman, Reference Kafaligönül, Patel, Öğmen, Bedell, Purushothaman, Nijhawan and Khurana2010; Öğmen et al., Reference Bartolomeo, Urbanski, Chokron, Chainay, Moroni and Siéroff2004; Purusothaman et al., Reference Purushothaman, Patel, Bedell and Öğmen1998; Whitney & Murakami, Reference Whitney and Murakami1998; Whitney, Murakami, & Cavanagh, Reference Whitney, Murakami and Cavanagh2000). Findings inconsistent with differential latencies theory include temporal order judgments that indicate flashed objects might be processed at the same speed (e.g., Chappell et al., Reference Chappell, Hine, Acworth and Hardwick2006) or more quickly (e.g., Nijhawan et al., Reference Bartolomeo, Urbanski, Chokron, Chainay, Moroni and Siéroff2004; Raiguel, Lagae, Gulyàs, & Orban, Reference Raiguel, Lagae, Gulyàs and Orban1989) than moving targets, effects of perceptual grouping (Watanabe, Reference Watanabe2004; Watanabe et al., Reference Watanabe, Nijhawan, Khurana and Shimojo2001), effects of semantic meaningfulness (Nagai et al., Reference Nagai, Suganuma, Nijhawan, Freyd, Miller, Watanabe, Nijhawan and Khurana2010; Noguchi & Kakiki, Reference Noguchi and Kakigi2008), existence of visual-auditory crossmodal flash-lag (latencies for auditory stimuli are generally faster than latencies for visual stimuli; Alais & Burr, Reference Alais and Burr2003; Arrighi et al., Reference Arrighi, Alais and Burr2005), and occurrence of a flash-lag effect if the flashed object is in motion (Bachmann & Kalev, Reference Bachmann and Kalev1997).
Postdiction
Postdiction theory suggests the flash-lag effect results from information presented after the flashed object vanished (e.g., Eagleman & Sejnowski, Reference Eagleman and Sejnowski2000a, Reference Eagleman and Sejnowski2000b; Rao, Eagleman, & Sejnowski, Reference Rao, Eagleman and Sejnowski2001). Information regarding location is integrated over brief intervals of time for the flashed object and for the moving target,Footnote 1 and the length of this integration period ranges from 80 msec (Eagleman & Sejnowksi, Reference Eagleman and Sejnowski2000b) to 500 msec (Krekelberg & Lappe, Reference Krekelberg and Lappe1999). For the flashed object, the average location during the integration period is the same as the individual location signals (the object does not move); however, for the moving target, the average location during the integration period beginning with the presentation of the flashed object is shifted forward as the moving target continues in motion throughout the integration period. This averaged information “adjusts” perception of the target forward at the time of the flash (cf. backward referral), and this was initially referred to as postdiction (Eagleman & Sejnowksi, Reference Eagleman and Sejnowski2000b) and subsequently referred to as motion-biasing (Eagleman & Sejnowski, Reference 389Eagleman and Sejnowski2007). Effects of changes in target velocity or direction of motion after presentation of the flashed object (e.g., Brenner & Smeets, Reference Brenner and Smeets2000; Eagleman & Sejnowksi, Reference Eagleman and Sejnowski2000b; Rotman et al., Reference Rotman, Brenner and Smeets2005) and lack of a flash-lag effect in flash-terminated displays (e.g., Eagleman & Sejnowski, Reference Eagleman and Sejnowski2000b; Moore & Enns, Reference Moore and Enns2004; Watanabe, Reference Watanabe2004) are consistent with postdiction. However, postdiction theory suggests information presented prior to the flashed object should not influence the flash-lag effect, and so effects of pre-flash target behavior (Chappell & Hine, Reference Chappell and Hine2004) and pre-flash cues (Baldo, Kihara et al., Reference Baldo, Kihara, Namba and Klein2002; Namba & Baldo, Reference Namba and Baldo2004; Vreven & Verghese, Reference Vreven and Verghese2005) are inconsistent with postdiction theory.
Perceptual Acceleration
Perceptual acceleration theory suggests the moving target and flashed objects are processed in different perceptual streams. When a perceptual stream first appears, the first few items are processed relatively slowly, but processing latency decreases for additional stimuli in that stream; this is referred to as perceptual acceleration (Bachmann et al., Reference Bachmann, Luiga, Põder and Kalev2003). If a flashed object is in a second stream that begins later than the stream involving the moving target, then the flashed object is processed more slowly than the moving target, and this would result in a flash-lag effect. This is similar to differential latencies theory, but differential latencies theory specifies that processing speed is a function of the type or intensity of a stimulus and not a function of the number of preceding stimuli. The perceptual acceleration theory is consistent with findings of a flash-lag effect when a moving target consists of a sequence of discrete stimuli (e.g., letters; Bachmann & Põder, Reference Bachmann and Põder2001). However, although a moving target and a flashed object that were spatially separated might involve separate processing streams, it is less clear whether a flashed object that overlapped or interleaved the moving target (e.g., disk within an annulus) would be considered to involve separate streams. Existence of a flash-lag effect with flash-initiated stimuli, and lack of a flash-lag effect in flash-terminated displays, appears inconsistent with perceptual acceleration (but see Bachmann, Reference Bachmann2007, Reference Bachmann, Nijhawan and Khurana2010).
Summary and Conclusions
The flash-lag effect is robust and occurs with many types of stimuli. A flash-lag effect occurs if target motion is linear, curvilinear, or rotary, and with continuous, sampled, or random motion. A flash-lag effect occurs with visual motion in the picture or depth plane, auditory motion in frequency or physical space, and crossmodally with visual, auditory, and haptic stimuli. A flash-lag effect occurs if the flashed object overlaps or is spatially separate from the moving target, and the flashed object can be stationary or in motion. A flash-lag effect usually occurs with flash-initiated and flash-midpoint displays but not with flash-terminated displays. The flash-lag effect is increased if (a) distance between the flashed object and moving target increases, (b) eccentricity of the flashed object or moving target increases, (c) the target moves toward fixation, (d) the target moves faster, (e) presentation of the flashed object is less predictable, (f) target position is less certain, (g) observers divide attention over multiple targets or tasks, (h) a nearby stimulus facilitates processing along the path of motion, (i) observers do not control presentation of the flashed object, (j) the flashed object is aligned with the leading rather than the trailing edge of the moving target, (k) the effect is measured at onset of flashed object motion, and (l) features of the target such as size remain constant.
The flash-lag effect exhibits several properties. First, the flash-lag effect involves spatial components and temporal components. Second, the flash-lag effect involves biases regarding perceived location of the moving target and perceived location of the flashed object. The perceived locations of the moving target and flashed object are shifted in the direction of motion, and the flash-lag effect per se presumably results from a larger shift for the moving target than for the flashed object. Third, the flash-lag effect is multisensory and crossmodal, and has been found with visual, auditory, and haptic moving targets and flashed objects. Fourth, the flash-lag effect involves high-level processing. It is possible low-level perceptual factors contribute to the flash-lag effect, but numerous studies found a role of high-level processing. Fifth, the flash-lag effect is dependent on continuity of target behavior, and discontinuities (e.g., sudden or unpredictable change in target size) disrupt the flash-lag effect. Sixth, the flash-lag effect is likely related to other flash-related spatial biases (flash-lead, flash-drag, flash-grab, flash-jump) and spatial biases not related to a flashed object (Fröhlich effect, representational momentum, backwards referral, anisotropies).
Several theories of the flash-lag effect have been proposed. Motion extrapolation theory proposes the flash-lag effect results from forward spatial displacement of the target. Attention shift theory suggests that movement of the target during the time that attention is being shifted from the moving target to the flashed object results in the target being perceived beyond the flashed object. Differential latencies theory suggests moving targets are processed more quickly than are flashed objects. Postdiction theory suggests temporal integration of location signals after the flashed object is presented shifts the represented location of the target at the time the flashed object was presented forward. Perceptual acceleration theory suggests that a flashed object is the initial stimulus in a new perceptual stream and thus is processed more slowly. However, it is unlikely a single mechanism can account for all examples of the flash-lag effect, and examples of the flash-lag effect with different types of stimuli might reflect different or multiple mechanisms (e.g., attention shifts and differential latencies appear to modulate the flash-lag effect). Some examples of the flash-lag effect might reflect representational momentum or a Fröhlich effect in which judged target position is measured relative to a nearby object rather than the target’s actual position. There are data that challenge each theory, and these challenges have not been resolved.
In the flash-lag effect, position of a briefly presented object spatially aligned with a moving target is perceived to lag behind the position of that target, and research on the flash-lag effect has underscored important issues in visuospatial and spatiotemporal processing. Foremost among these issues is how our representational system compensates for delays in perception due to neural processing latencies. The answer to this question has consequences for the flash-lag effect and several other spatial biases such as the Fröhlich effect, representational momentum, and other flash-related biases. Whether the flash-lag effect reflects a fundamental bias in perception or is a derived bias based on judgment of target location relative to another object (rather than relative to actual target location) is not clear. Given that moving targets are more likely to have an immediate impact on an observer than are stationary objects, a representational system tuned to preferentially anticipate and (more quickly) process information regarding moving targets than information regarding stationary objects would be more adaptive. This would demonstrate an important way our representational system has been tuned to anticipate what is most likely to be encountered in interactions with environmental stimuli. Despite the simplicity of the flash-lag effect, such an effect might reveal important properties of our representational system and provide insight into how our representational system adapted to allow perception of and interaction with stimuli in our environment.
Introduction
Perception, action, and imagery often involve the spatial localization of both us and objects relative to the external environment. Spatial localization, in turn, requires making reference to a frame. Because all sensory systems – along with memory – can contribute to localize a target, and because movements can involve the coordination of several body segments (as in orienting the eyes, head, and arm toward the target), a multiplicity of diverse reference frames contribute to sensorimotor transformations and internal representations (Howard, Reference Howard1982; Lacquaniti, Reference Lacquaniti, Boller and Grafman1997; Soechting & Flanders, Reference Soechting and Flanders1992).
Not only do the reference frames associated with each sensory channel differ between each other but they are also intrinsically unstable because they are egocentric. Thus, any time we move our eyes, the eye-centered frame shifts and rotates in parallel with the eyes. The same happens with head- and body-centered reference frames. Nevertheless, introspection as well as abundant psychophysical and behavioral evidence shows that our representations of space are generally stable.
It has long been recognized that Earth gravity helps keep multiple egocentric reference frames in spatial register (Berthoz, Reference Berthoz2000; Paillard, Reference Paillard and Paillard1991). One possibility is that the brain transforms initial egocentric signals into allocentric, gravity-centered representations of the world. Gravity-centered representations tend to be stable, being anchored to a physical invariant, independent of the observer’s movements. In particular, the gravity reference contributes maintaining postural equilibrium, orienting ourselves, navigating through space, and recognizing objects. Indeed, the lack of a gravity reference during space flight results in cognitive, sensory, and motor derangements that take several days of adaptation to subside (Clément & Reschke, Reference Clément and Reschke2008).
In this chapter, I address first the issue of how we study the representation of the gravity reference behaviorally. There is a multiplicity of different tests, and each of them can reveal a different type of representation. I will show that the neural estimates of the direction of gravity and the kinematics of a target descending along the vertical are generally accurate under the most prevalent ecological conditions, but they can be biased significantly under unusual conditions. As a result, perceived gravity does not always afford a veridical representation of physical gravity. Conversely, neural estimates of gravity direction and acceleration may bias our experience of the outside world and affect our actions accordingly. The study of these two different types of bias is important insofar as it can reveal the mechanisms underlying the neural encoding of gravity effects.
Perceived Vertical
Subjective Visual Vertical (SVV). The perceived vertical direction can be assessed using a variety of tests, which do not lead necessarily to the same results. Probably the oldest and most common test is represented by the SVV, introduced by Aubert in 1861. SVV is assessed in a dark environment by asking participants to align a luminous rod to the vertical, in most cases in the fronto-parallel plane (roll tilt). Both constant (average) errors and variable errors (trial-to-trial variability measured as 1 SD) of SVV are smaller than 2° in healthy participants in the upright posture (Mittelstaedt, Reference Mittelstaedt1983; Tarnutzer, Bockisch, Straumann, & Olasagasti, Reference Doricchi, Merola, Aiello, Guariglia, Bruschini and Gevers2009; Udo de Haes, Reference Udo De Haes1970; Vingerhoets, De Vrijer, van Gisbergen, & Medendorp, Reference Doricchi, Merola, Aiello, Guariglia, Bruschini and Gevers2009). One study reported small constant errors of SVV in pitch (sagittal plane), only slightly higher than those in roll (Frisén, Reference Frisén2010). On the other hand, both constant and variable errors become appreciable when participants lie in a tilted posture (Figure 10.1; Aubert, Reference Aubert1861; Clemens et al., Reference 375Bourlon, Duret, Pradat-Diehl, Azouvi, Loeper-Jeny and Merat-Blanchard2011; Howard, Reference Howard1982; Kaptein & Van Gisbergen, Reference Kaptein and Van Gisbergen2005; Mittelstaedt, Reference Mittelstaedt1983; Udo de Haes, Reference Udo De Haes1970; Vingerhoets et al., Reference Doricchi, Merola, Aiello, Guariglia, Bruschini and Gevers2009). When the participant is rolled in the frontal plane by a small angle (<30°), the SVV in roll tends to remain aligned with the true vertical or slightly overshoots it in the direction opposite to the body tilt (so called E-effect). Instead, for greater roll tilts, the SVV undershoots the vertical in the same direction as body tilt (so called A-effect). A-effects gradually increase for absolute roll tilts beyond 60°, and reach peak amplitudes up to 50° at about 130° roll. The SD of SVV increases to about 5–7°. A-effects are also observed in the perceptual estimates of the direction of visual motion of a patch of dots (De Vrijer, Medendorp, & Van Gisbergen, Reference De Vrijer, Medendorp and Van Gisbergen2008). A-effects cannot be simply accounted for by an underestimation of head and body tilt, because a separate assessment of body tilt perception relative to a reference position (the subjective body tilt or SBT) shows negligible constant errors (Clemens et al., Reference 375Bourlon, Duret, Pradat-Diehl, Azouvi, Loeper-Jeny and Merat-Blanchard2011; Kaptein & Van Gisbergen, Reference Kaptein and Van Gisbergen2004; Mast & Jarchow, Reference Mast and Jarchow1996; Mittelstaedt, Reference Mittelstaedt1983). Notice, however, that the variable errors are generally greater for the SBT than SVV (Clemens et al., Reference 375Bourlon, Duret, Pradat-Diehl, Azouvi, Loeper-Jeny and Merat-Blanchard2011; Mast & Jarchow, Reference Mast and Jarchow1996).

Figure 10.1 Systematic errors in the SVV when participants lie in a roll-tilted posture (60°, 105°, and 150°, from A to C, respectively). Z represents the orientation of the body axis. The SVV is aligned with gravity or undershoots the true vertical in the direction opposite to the body tilt (E-effects) for tilt angles smaller than 30°. The SVV overshoots the true vertical in the same direction as body tilt (A-effects) when the tilt angle is greater than 30°; this bias increase with tilt angle. An abrupt transition occurs from an A to an E effect at large tilts (≥135°).
Both the SVV and SBT have been tested during full immersion in water. The forces acting on the skin are greatly reduced under water because the body is almost buoyant, but the vestibular system still senses the gravitational force. In a carefully controlled study, the pattern of responses for SVV and SBT showed the same dissociation under water as on land, but only SBT significantly differed between the two conditions, with a head-upward bias of the perceived body roll (Jarchow & Mast, Reference Jarchow and Mast1999).
On Earth, the otoliths of the vestibular apparatus are constantly loaded by the pull of gravity. In the freefall conditions of space flight, the otoliths become unloaded. Accordingly, the SVV is typically aligned with the body axis in astronauts (Clément & Reschke, Reference Clément and Reschke2008; Glasauer & Mittelstaedt, Reference Glasauer and Mittelstaedt1998). Tests performed during parabolic flight showed that the SVV starts to be aligned with gravity levels above about 0.3 g (de Winkel, Clément, Groen, & Werkhoven, Reference de Winkel, Clément, Groen and Werkhoven2012).
In general, the biases of SVV under different environmental conditions are well accounted for by the hypothesis that the brain combines visual, vestibular, and somatosensory inputs with a prior assumption about body orientation in space, in particular the assumption that the head and the body are oriented near the vertical (see Multisensory Estimates of Upright Direction). As for the anatomo-functional substrates of SVV, a pathologic tilt of the SVV is consistently observed after lesions of the posterior insular and retroinsular cortex (Baier et al., Reference Baier, Zu Eulenburg, Best, Geber, Müller-Forell, Birklein and Dieterich2013; Barra et al., Reference Barra, Marquer, Joassin, Reymond, Metge, Chauvineau and Pérennou2010; Brandt, Dieterich, & Danek, Reference Brandt, Dieterich and Danek1994; Rousseaux, Honoré, Vuilleumier, & Saj, Reference Rastelli, Tallon-Baudry, Migliaccio, Toba, Ducorps and Pradat-Diehl2013). These regions receive convergent signals from the vestibular, visual, and neck proprioceptive systems and represent a putative human homologue of the parieto-insular vestibular cortex of the monkey (Brandt et al., Reference Brandt, Dieterich and Danek1994; Lopez & Blanke, Reference Lopez and Blanke2011).
Rod-and-Frame Test. The rod-and-frame test, originally developed by Witkin (Reference Witkin1949), measures participants’ ability to align to vertical a luminescent rod inscribed within a luminescent frame in the dark. Tilting the outer frame may affect the alignment of the rod, determining deviations from the true vertical. Interestingly, there is wide inter-individual variability in the effects of the frame tilt, with larger effects in observers who rely more heavily on visual context for verticality estimates.
Subjective Haptic Vertical (SHV). Head and body tilts generally evoke vestibulo-ocular reflexes. Thus, the eyes counterroll by about 10% of a roll tilt (Miller & Graybiel, Reference Miller and Graybiel1962). In line of principle, these reflexes might affect orientation judgments based on visual cues such as the SVV, but they would not affect the same judgments based on a manual alignment of the rod (SHV) to the perceived vertical in blindfolded participants. Bortolami, Pierobon, DiZio, & Lackner (Reference Bortolami, Pierobon, DiZio and Lackner2006) used the SHV to test the localization of the vertical for participants tilted in roll, pitch, and yaw, and found much smaller biases than in SVV. Similar results have been reported for roll by Schuler, Bockisch, Straumann, & Tarnutzer (Reference 441Peyrin, Michel and Schwartz2010). Therefore, a major component of the bias in SVV at tilted positions depends on central processing of visual information.
Perceived Upright of Objects
Oriented Character Recognition Test (OCHART). We recognize and interact more easily with objects when they are perceived as upright. Although the perceived upright of objects can be influenced by body orientation with respect to gravity, it is potentially distinct from the perceived vertical (as assessed by SVV). In the OCHART devised by Dyde, Jenkin, & Harris (Reference Dyde, Jenkin and Harris2006), participants are asked to report whether they see the letter “d” or the letter “p” when the corresponding symbol is presented at various orientations. Because the letter “p” becomes the letter “d” when it is rotated by 180°, the averaged transitions “p”-to-“d” and “d”-to-“p” define a perceptual upright. Importantly, observers are not asked to make judgments relative to any reference frame, but only to identify the character.
OCHART and SVV were compared in three body postures, upright, right side down or supine, and in the presence or absence of a visual background (Dyde et al., Reference Dyde, Jenkin and Harris2006). SVV behaved as in the studies reviewed above. However, OCHART setting was close to the true vertical when the body, gravity, and visual background were aligned, but it markedly deviated when these orientations diverged among each other, the setting now tending to become aligned with the body axis. Moreover, OCHART setting depended on the orientation of the visual background much more than did the SVV.
Recognition of Faces and Scenes. The recognition of scenes, people, and actions tends to be faster and more accurate when they are aligned with the observer, whether both the scene and the observer are upright or they are both tilted relative to the vertical (Chang, Harris, & Troje, Reference Chang, Harris and Troje2010; Köhler, Reference Köhler1940; Kushiro, Taga, & Watanabe, Reference Kushiro, Taga and Watanabe2007; Troje, Reference Troje2003; Yin, Reference 471Yin1969). Thus, the ability to detect gross distortions in a modified photograph of a face is impaired when the photograph is presented upside-down relative to the observer (Lobmaier & Mast, Reference Lobmaier and Mast2007; Thompson, Reference Thompson1980). Similar viewer-centered effects have been described for the discrimination of inverted whole-body postures (Reed, Stone, Bozova, & Tanaka, Reference Reed, Stone, Bozova and Tanaka2003) or point-light biological motion (Chang et al., Reference Chang, Harris and Troje2010; Pavlova & Sokolov, Reference Pavlova and Sokolov2000; Sumi, Reference Sumi1984; Troje & Westoff, Reference Troje and Westhoff2006).
However, the orientation of the scene relative to gravity also contributes. Thus, observers are sensitive to the artificial inversion of the visual effects of gravity on the motion of inanimate objects (Bingham, Schmidt, & Rosenblum, Reference Bingham, Schmidt and Rosenblum1995; Indovina et al., Reference Indovina, Maffei., Bosco, Zago, Macaluso and Lacquaniti2005) or people (Zago, La Scaleia, Miller, & Lacquaniti, Reference 375Bourlon, Duret, Pradat-Diehl, Azouvi, Loeper-Jeny and Merat-Blanchard2011). Moreover, the orientation relative to gravity contributes to processing global and local motion cues of point-light walker stimuli, presumably in connection with expectations about the dynamics of the body due to gravity (Chang & Troje, Reference Chang and Troje2009; Shipley, Reference Shipley2003; Troje & Westhoff, Reference Troje and Westhoff2006).
Conversely, a photograph or video-clip with marked “up” and “down” polarization, when rotated, can bias the perceived vertical direction (Dyde et al., Reference Dyde, Jenkin and Harris2006; Jenkin, Dyde, Jenkin, Zacher, & Harris, Reference 375Bourlon, Duret, Pradat-Diehl, Azouvi, Loeper-Jeny and Merat-Blanchard2011; Jenkin, Jenkin, Dyde, & Harris, Reference Bartolomeo, Urbanski, Chokron, Chainay, Moroni and Siéroff2004). Preuss, Harris, & Mast (Reference Preuss, Harris and Mast2013) used the York Tumbling Room to modulate the visual reference frame and the perceived orientation of the body relative to gravity. The York Tumbling Room is a full-size furnished cubic room with strong directional cues, which can be rotated around an Earth-horizontal axis independently of rotations of the visual stimuli and observers, thus disassociating various sources of information about verticality. Preuss and colleagues found that visual scenes depicting a human body with a clear visual polarity (as shown by the relative positions of the head and feet) were more accurately recognized when they were aligned with the tumbling room.
Overall, it appears that the brain does not use a unique representation of upright for the recognition of all categories of objects. Instead, a specific upright can be defined for different object categories.
Perceptual Judgments of Object Stability
When we have to predict whether an object is stable on its base of support or is going to tip over, we must implicitly determine if the vertical projection of the center of mass falls within the support surface.
To assess perceptual judgments of stability, Barnett-Cowan, Fleming, Singh, & Bülthoff (Reference Barnett-Cowan, Fleming, Singh and Bülthoff2011) presented images of objects close to a table edge to participants upright or lying on their side, and estimated the critical angle at which each object appeared equally likely to fall or right itself. Perceived gravity direction was independently tested as SVV. It was found that the perceived critical angle was significantly biased in the same direction as the SVV, consistent with a similar multisensory fusion of cues. Somewhat similar results were found by Lopez, Bachofner, Mercier, & Blanke (Reference Doricchi, Merola, Aiello, Guariglia, Bruschini and Gevers2009), who investigated perceptual judgments of the tendency to fall of pictures of a human figurine with implied motion that was tilted in the roll plane.
Battaglia, Hamrick, & Tenenbaum (Reference Battaglia, Hamrick and Tenenbaum2013) also assessed perceptual judgments of stability in upright observers, but used much more complex objects such as towers of 10 blocks arranged in randomly stacked configurations presented on a monitor. They found that the average accuracy was 66%, but interestingly the performance was well predicted by a model that uses approximate, probabilistic simulations of mechanics to make fast inferences in complex natural scenes where crucial information is missing (see discussion later in the chapter).
Multisensory Estimates of Upright Direction
As reviewed earlier, there is a potential multiplicity of different perceptual estimates of verticality depending on the specific test that is used. This multiplicity depends on the fact that the direction of gravity is assessed by the brain using not one but a multiplicity of sensory cues (visual, vestibular, somatosensory, visceral) combined with prior assumptions (see Lacquaniti et al., Reference Lacquaniti, Bosco, Gravano, Indovina, La Scaleia, Maffei and Zago2014, Reference La Scaleia, Zago and Lacquaniti2015). The major graviceptors (i.e., receptors sensitive to gravity effects) belong to the vestibular system. The otolith receptors in the maculae of the sacculus and utricle respond to a tilt of the head relative to gravity, but under dynamic conditions they do not distinguish between gravitational and inertial components (Fernandez & Goldberg, Reference Fernandez and Goldberg1976). Thus, the otoliths by themselves are unable to distinguish whether the head is accelerated backward or tilted forward. However, if the inertial accelerations are short lasting, the net gravito-inertial accelerations can be disambiguated by the brain using one of two different strategies. First, the incoming otolith signals can be filtered, with the result that the low-frequency (longer-lasting) signals are interpreted as a change in the tilt angle of the head relative to gravity, whereas the high-frequency (shorter-lasting) signals are interpreted as due to an accelerated translation (Mayne, Reference Mayne and Kornhuber1974). A long-lasting acceleration is a sporadic event, and when it occurs, it can give rise to a misperception of body orientation, being interpreted as a tilt relative to gravity (see the section on Spatial Disorientation).
The second strategy to disambiguate gravito-inertial accelerations consists of combining the otolith signals with those of the semicircular canals (Angelaki, McHenry, Dickman, Newlands, & Hess, Reference Angelaki, McHenry, Dickman, Newlands and Hess1999; Merfeld, Zupan, & Peterka, Reference Jancke, Erlhagen, Dinse, Akhavan, Giese and Steinhage1999). The angular head velocity signaled by the latter allows keeping track of dynamic changes in orientation of the gravity vector relative to the head. Neural correlates of the disambiguation of gravito-inertial accelerations have recently been uncovered. Thus, Purkinje cells in the caudal cerebellar vermis can estimate head tilt (Laurens, Meng, & Angelaki, Reference Laurens, Meng and Angelaki2013), and conversely neurons in the vestibular nuclei, as well as in the rostral portion of cerebellar fastigium and nodulus, are translation-selective (Angelaki, Shaikh, Green, & Dickman, Reference Angelaki, Shaikh, Green and Dickman2004).
Graviceptors also are embedded in thoraco-abdominal viscera (such as the kidneys and vena cava) and provide inputs to the vestibular nuclei (where they are integrated with those from otoliths and semicircular canals; Jian, Shintani, Emanuel, & Yates, Reference Jian, Shintani, Emanuel and Yates2002). Visceral graviceptors contribute significantly to the perception of the direction of gravity, along with somatosensory afferents such as those from neck and ankle joints (Mittelstaedt, Reference Mittelstaedt1996).
Also vision, though not directly affected by gravity, contributes several kinds of cues to spatial orientation in naturalistic environments (Harris, Jenkin, Dyde, & Jenkin, Reference 375Bourlon, Duret, Pradat-Diehl, Azouvi, Loeper-Jeny and Merat-Blanchard2011). Most visual images of our gravity-bound natural or man-made environments are anisotropic, with more image structure at orientations parallel or orthogonal to the direction of gravity in a fronto-parallel plane (Hansen & Essock, Reference Hansen and Essock2004). These image anisotropies are matched by corresponding anisotropies in perceptual responses, so that the direction of lines and motions is discriminated better when they are oriented vertically or horizontally than when they are oriented obliquely (Appelle, Reference Appelle1972; Ball & Sekuler, Reference Ball and Sekuler1987).
The typical orientation of familiar objects (such as walls, trees, people, chandeliers, chairs), the assumption that light comes from above, the spatial relationship between static objects and their support, the direction of falling objects, all consistently point to the vertical direction of gravity effects. The visual reference to gravity is so robust that there exist attraction places (“Mystery spots”) where some peculiarity of the environment (such as strong slopes of the terrain or slanted trees) provides the illusion that the gravity law is violated. Similar illusions are obtained in houses intentionally built with tilted walls.
Sensory systems provide information about the environment in egocentric reference frames, such as those centered on the eyes, head, or body. Egocentric representations are inherently unstable because they tend to shift and rotate any time the corresponding body part moves. Abundant psychophysical and behavioral evidence shows that the brain transforms initial egocentric signals into allocentric, gravity-centered representations of the world. These by definition are stable, being independent of the observer’s movements. However, there is still little experimental data where gravity-centered representations are localized in the brain and how they operate. A recent study showed that neurons in the caudal intraparietal area of the monkey cerebral cortex encode visual object tilt relative to gravity direction (Rosenberg & Angelaki, Reference Rosenberg and Angelaki2014), but similar representations may also exist at earlier visual stages (Sauvan & Peterhans, Reference Sauvan and Peterhans1999).
How are different sensory cues combined together to yield an estimate of orientation? Mittelstaedt (Reference Mittelstaedt1983) proposed that the perceived vertical results from a weighted vector sum of the different orientation cues, the weights depending on the relative reliability of each cue and the specific task. Applying this model to their experimental results, Dyde et al. (Reference Dyde, Jenkin and Harris2006) found that the influence of a visual background in the SVV test is limited, contributing about 8% of the information, compared to 77% from gravity, and 15% from the long axis of the observer’s body. By contrast, vision contributes about 25% of the information for the perceptual upright in the OCHART, compared to 20% from gravity and 55% from the body. Notice that another way to assess the relative role of visual context in the estimate of verticality is provided by the rod-and-frame test mentioned in a previous section. As previously remarked, this test shows a wide inter-individual variability in the relative weight of visual context cues.
Statistically optimal Bayesian models also predict SVV responses (Clemens et al., Reference 375Bourlon, Duret, Pradat-Diehl, Azouvi, Loeper-Jeny and Merat-Blanchard2011; De Vrijer et al., Reference De Vrijer, Medendorp and Van Gisbergen2008; MacNeilage, Banks, Berger, & Bulthoff, Reference MacNeilage, Banks, Berger and Bulthoff2007). The inputs are represented by the head orientation in space and the visual orientation of the luminous bar relative to the retina. The visual signals are precise, whereas the head tilt signals are noisy. However, head tilt signals are combined with a prior assumption that the head and the body are typically oriented near the vertical, resulting in a statistically optimal estimate. Both the vectorial model and the Bayesian model account for the accurate perception of verticality in the default upright posture, as well as for the spatial biases observed in less ecological tilted postures.
A probabilistic model has also been proposed by Battaglia et al. (Reference Battaglia, Hamrick and Tenenbaum2013) to account for subjective judgments of stability under the perturbing influence of gravity of virtual towers of stacked blocks of bricks (see discussion that follows). The conceptual architecture of their model is very similar to that of computer graphics engines that are now used in realistic videogames.
Spatial Disorientation (SpDi)
Spatial disorientation corresponds to a strongly biased perception or complete inability to determine one’s true position and orientation in space. Here we are concerned only with SpDi relative to gravity. SpDi may result from underwater immersion (Cheung, Hofer, Brooks, & Gibbs, Reference Cheung, Hofer, Brooks and Gibbs2000), lack of gravity effects during space flight (Lackner & DiZio, Reference Lackner and DiZio2000; Oman, Reference Oman, Mast and Jancke2007), or neurological disorders (Monacelli et al., Reference Monacelli, Cushman, Kavcic and Duffy2003). For brevity and because of its relevance to the problems of multisensory fusion involved in the gravity reference, I will consider only SpDi in aviation. This is defined by Benson (Reference Benson, Ernsting and King1988, p. 277) as the situation in which “the pilot fails to sense correctly the position, motion, or attitude of his aircraft or of himself within the fixed coordinate system provided by the surface of the Earth and the gravitational vertical.” According to Gibb, Ercoline, & Scharff (Reference 375Bourlon, Duret, Pradat-Diehl, Azouvi, Loeper-Jeny and Merat-Blanchard2011), SpDi contributes to at least 30% of all aircraft accidents and causes the highest number of fatalities.
It is important to note the multisensory contributions to SpDi, vestibular misperceptions being the most studied though not necessarily the most frequent causes of SpDi. Vestibular misperceptions are worsened by low visibility and lack of reliance on instruments. During takeoff, pilots may overestimate their upward pitch, because the resultant of the vector sum of gravity and backward inertial acceleration is misperceived as the actual orientation relative to the vertical. To compensate, pilots may lower the plane nose and crash on the ground. Pilots in a constant bank-angle turn feel that their body posture is upright instead of being tilted relative to gravity. When turning gradually, they may feel as though they are flying straight but ascending; when the turn is corrected, the sensation is that of descending. The so-called “graveyard spin” is an illusion occurring while entering a spin. Pilots may feel stationary if the spin is continued long enough; when they correct the spin, they feel spinning in the opposite direction, and start countering their own corrective actions, thus returning in the original spinning pattern. If enough altitude is lost before the illusion is recognized and corrective actions are not taken, the plane will crash on the ground. The “graveyard spiral” occurs when the sensation of turning is lost in a banked turn. Because the pilots’ instruments show that they are descending, they may add power entering into spiral motion. In the oculogyral illusion, a turning target seen by pilots while they are turning appears to move faster than it is actually moving. In the oculogravic illusion, a watched target appears to rise if the pilot is momentarily in weightlessness, and appears to fall if the pilot is in hypergravity.
Memory of Moving Targets
When observers are asked to indicate the last seen position of a moving target that has just disappeared, they make small but systematic errors forward in the direction of motion. The spatial bias is consistent with the idea that the brain has internalized the basic property of physical momentum (representational momentum), namely that an object in motion will continue to move unless halted by an external force (Freyd & Finke, Reference 394Freyd and Finke1984). This idea has been extended to include the effects of internalized gravity (representational gravity) and friction (representational friction; Hubbard, Reference Hubbard1995b, Reference Hubbard2005b). Here we are concerned with representational gravity (for the general issue, see Chapter 8 in this volume).
Hubbard and Bharucha (Reference 408Hubbard and Bharucha1988) showed that a vanishing target that previously moved horizontally results in a forward and downward memory displacement. Such spatial bias is consistent with the fact that objects traveling horizontally on a support, once without support, will fall under gravity forward and downward along a parabola. De sá Teixeira et al. (Reference Rastelli, Tallon-Baudry, Migliaccio, Toba, Ducorps and Pradat-Diehl2013) reassessed this issue by introducing variable temporal delays between the target disappearance and the observer’s response in order to track the changes in the remembered location over time. They found that the remembered vanishing positions evolved with time in a pattern that indeed roughly mimics a parabolic trajectory. However, this representational trajectory does not correspond to a full extrapolation of actual target motion over the delay interval, but to a much slower drift of the last seen location. Moreover, the extrapolated trajectories are highly distorted copies of actual target motion.
Several other findings argue for representational gravity. Thus, observers in an upright posture typically exhibit a larger memory displacement for a downward motion than for an upward motion of a stimulus (Hubbard & Bharucha, Reference 408Hubbard and Bharucha1988), and memory for the location of a stationary object implying motion is shifted downward (Bertamini, Reference Bertamini1993; Freyd, Pantzer, & Cheng, Reference Freyd, Pantzer and Cheng1988; Hubbard & Ruppel, Reference Hubbard and Ruppel2000). Hubbard (Reference Hubbard2001) found that forward displacement was larger for ascending or descending targets that were lower in the picture plane than for ascending or descending targets that were higher in the picture plane. This is consistent with the belief that descending objects accelerate due to implied gravity and ascending objects decelerate due to implied gravity. Observers lying on their side show memory displacements that reflect both gravicentric and bodycentric effects (de sá Teixeira & Hecht, Reference Brendel, Hecht, DeLucia and Gamer2014). Accordingly, the latter authors proposed that the dynamic representation of gravity effects for the task of locating memorized targets involves a weighted combination of cues related to the direction of physical gravity and cues related to the direction of the long body axis, much in the same way as it occurs for SVV (but see Nagai, Kazai, & Yagi, Reference Nagai, Kazai and Yagi2002 for a different conclusion).
It should be noticed that representational gravity does not reflect Newtonian physics faithfully. As mentioned earlier, targets moving downward produce a larger memory displacement than do targets moving upward (Hubbard & Bharucha, Reference 408Hubbard and Bharucha1988). Moreover, Hubbard (Reference Hubbard1997) found that larger targets (perceived as more massive) induce a greater downward displacement than smaller (lighter) targets in upright observers. Kozhevnikov and Hegarty (Reference Kozhevnikov and Hegarty2001) reported that for ascending motion, larger targets are perceived as slower than smaller ones. Altogether, these findings are more consistent with naïve physics than Newtonian physics. In particular, according to the impetus beliefs of naïve physics, falling objects that accelerate under gravity should move faster than the same objects that decelerate while ascending. Moreover, heavier objects should move faster on the way down and slower on the way up than lighter objects. In contrast, Newtonian physics predicts that all objects, regardless of mass and shape, fall and rise at the same rate in the absence of air drag. In the presence of significant air drag (as for light, large objects), the descent phase takes longer than the ascent phase of the same length; also, more massive objects ascend faster than less massive objects of the same shape. On the whole, representational gravity – just as representational momentum – is a complex phenomenon, with several contributing factors, ranging from sensorimotor cues (e.g., eye movements, visual and vestibular signals) to higher-level cognitive cues (e.g., naïve physics, attention, psychological traits).
Target Interception
Considerable evidence has been accumulated that the interception of a descending target includes prior knowledge of gravity effects (de la Malla & López-Moliner, Reference de la Malla and López-Moliner2015; Lacquaniti & Maioli, Reference 420Lacquaniti and Maioli1989; McIntyre, Zago, Berthoz, & Lacquaniti, Reference McIntyre, Zago, Berthoz and Lacquaniti2001; Vishton, Reardon, & Stevens, Reference 441Peyrin, Michel and Schwartz2010; Zago & Lacquaniti, Reference Indovina, Maffei., Bosco, Zago, Macaluso and Lacquaniti2005; Zago et al., Reference Bartolomeo, Urbanski, Chokron, Chainay, Moroni and Siéroff2004, Reference Thiebaut de Schotten, Urbanski, Duffau, Volle, Levy and Dubois2005; Zago et al., Reference Doricchi, Merola, Aiello, Guariglia, Bruschini and Gevers2009). Under ordinary conditions, participants can accurately place their hand at the right time and the right position to catch or hit a ball falling under gravity along either the vertical (Lacquaniti & Maioli, Reference 420Lacquaniti and Maioli1989; Zago et al., Reference Bartolomeo, Urbanski, Chokron, Chainay, Moroni and Siéroff2004, Reference Thiebaut de Schotten, Urbanski, Duffau, Volle, Levy and Dubois2005) or a parabolic trajectory (Bosco et al., Reference Bosco, Delle Monache and Lacquaniti2012; Cesqui, d’Avella, Portone, & Lacquaniti, Reference Cesqui, d’Avella, Portone and Lacquaniti2012; La Scaleia, Lacquaniti, & Zago, Reference Lewkowicz and Minar2014; La Scaleia, Zago, & Lacquaniti, Reference La Scaleia, Zago and Lacquaniti2015, Reference Bosco, Delle Monache, Gravano, Indovina and La Scaleia2015).
In a recent study (La Scaleia et al., Reference Bosco, Delle Monache, Gravano, Indovina and La Scaleia2015), participants were asked to hit a ball that rolled down an incline at 0.2 g, and then fell in air at 1 g along a parabola. By varying starting position, ball velocity and trajectory differed between trials. Motion on the incline was always visible, while parabolic motion was either visible or occluded. Strikingly, participants were equally successful at hitting the falling ball in both visible and occluded conditions. Moreover, in different trials, the intersection points were distributed along the parabolic trajectories of the ball, indicating that participants were able to extrapolate an extended segment of the target trajectory (Figure 10.2). Remarkably, this trend was observed even in the very first trials. The only way to extrapolate ball motion correctly during the occlusion was to assume that the ball would fall under gravity and air drag when hidden from view. Such an assumption had to be derived from prior experience.

Figure 10.2 Intersection points, for all targets, between the ball surface and the tip of the hand-held rod. Ellipses representing the frontal projections of the tolerance ellipsoids including 95% of the intersection points, centered on the mean intersection point, are drawn along with the first eigenvector (and its 95% confidence cone). Gray continuous lines represent the envelope of ball trajectory, whereas gray dotted lines represent the trajectory that would be followed by the ball if it continued moving on an extended inclined plane.
In contrast with the accurate performance observed under ecological conditions, systematic errors in both time and space are made when the target descends with a kinematics violating gravity under unusual or nonecological conditions (Bosco et al., Reference Bosco, Delle Monache and Lacquaniti2012; Indovina et al., Reference Indovina, Maffei., Bosco, Zago, Macaluso and Lacquaniti2005; McIntyre et al., Reference McIntyre, Zago, Berthoz and Lacquaniti2001; Zago et al., Reference Bartolomeo, Urbanski, Chokron, Chainay, Moroni and Siéroff2004, Reference Thiebaut de Schotten, Urbanski, Duffau, Volle, Levy and Dubois2005). Thus, astronauts continue to anticipate the effects of Earth gravity on a ball that is projected at constant speed from the ceiling of the space shuttle, with the result that they move their arm too early, then stop and reverse direction (McIntyre et al., Reference McIntyre, Zago, Berthoz and Lacquaniti2001). Artificial gravity conditions can be simulated in the laboratory. Thus, in a baseball videogame, participants shifted a cursor to intercept a landing fly ball (Bosco et al., Reference Bosco, Delle Monache and Lacquaniti2012). Ball trajectories were either fully visible or occluded for variable epochs before landing. During descent, the ball could move under natural gravity (1 g), zero gravity (0 g), or hypergravity (2 g) in different, randomized trials. In occluded trials, 500 msec of perturbed motion was always visible before ball disappearance. The effect of air drag was included in all video animations. It was found that participants placed the cursor at the ball landing position for all gravity levels in the fully visible trials but only for natural gravity in the occluded trials. Instead, the landing position was systematically undershot with 0 g balls and overshot with 2 g balls in the occluded trials (Figure 10.3). These spatial biases are explained by the hypothesis that observers use a priori expectation that a fly ball will always fall under natural gravity. Applying this a priori by default results in undershooting an artificial 0 g ball and overshooting a 2 g ball. The same systematic errors occur in the time domain: participants try to intercept 0 g balls too early and 2 g balls too late (Bosco et al., Reference Bosco, Delle Monache and Lacquaniti2012). Algorithms combining online visual information about target position and speed with a prior model of 1 g acceleration are able to explain both the accurate performance under normal gravity as well as the errors under unusual gravity conditions (Bosco et al., Reference Bosco, Delle Monache, Gravano, Indovina and La Scaleia2015; de la Malla & López-Moliner, Reference de la Malla and López-Moliner2015; McIntyre et al., Reference McIntyre, Zago, Berthoz and Lacquaniti2001; Zago & Lacquaniti, Reference Indovina, Maffei., Bosco, Zago, Macaluso and Lacquaniti2005; Zago et al., Reference Bartolomeo, Urbanski, Chokron, Chainay, Moroni and Siéroff2004, Reference Thiebaut de Schotten, Urbanski, Duffau, Volle, Levy and Dubois2005).

Figure 10.3 Distributions of positional errors in the occluded trials (average values among subjects ± SEM) for each ball acceleration. Positional error was the difference in centimeters between the horizontal position of the cursor at the time of the button press and the landing ball position. Negative values indicated horizontal underestimate of the landing position of the ball, while positive values indicated overestimate.
As in the case of representational gravity for memorized targets, also the internal model of gravity effects for target interception involves an approximation of physical laws under unusual nonecological conditions (Zago et al., Reference Dodds, van Belle, Peers, Dove, Cusack and Duncan2008). Evidence for a naïve physics bias was provided by asking participants to intercept an approaching ball in a virtual reality setup (Senot, Zago, Lacquaniti, & McIntyre, Reference Senot, Zago, Lacquaniti and McIntyre2005). Sitting participants either pitched their head backward so as to look up toward the ball falling from a ceiling, or they pitched their head forward so as to look down toward the ball rising from a floor. The ball could move at –1 g, 0 g, or 1 g in different, randomized trials, for both downward and upward trajectories. Participants responded earlier when the ball was launched downward from above than when it was launched upward from below, irrespective of ball acceleration profile. This finding is reminiscent of the observation in representational gravity studies that targets moving downward produce a larger memory displacement than do targets moving upward (Hubbard & Bharucha, Reference 408Hubbard and Bharucha1988), and is consistent with the naïve expectation that objects move faster when they fall than when they rise.
Senot et al. (Reference Senot, Zago, Lacquaniti and McIntyre2005) further showed that the response bias related to whether the target was projected from the visual ceiling or from the visual floor disappeared when participants looked straight ahead, indicating that the reference frame used to plan the interceptive responses is anchored to physical gravity. Evidence for a direct contribution of otolith signals in these interception responses was provided by a parabolic flight study involving the same virtual reality setup as above (Senot et al., Reference Senot, Zago, Le Séac’h, Zaoui, Berthoz, Lacquaniti and McIntyre2012). The downward/upward bias of the responses reversed sign during the weightless phases compared with the responses on the ground. This reversal can be attributed to a corresponding reversal of the otolith responses during the transition from hypergravity to hypogravity in parabolic flight.
In sum, the interception of moving targets potentially affected by gravity is driven by a complex process of integration of visual, vestibular, and somesthesic cues with an internal model of gravity effects. Although the internal model of gravity revealed by the interception studies shares several features with the representational gravity of spatial memory task reviewed earlier, they are not necessarily the same thing. In general, motor actions directed to a target accelerated by gravity under normal, ecological conditions are quite accurate and reflect true physics, and only under unusual or nonecological circumstances (e.g., weightlessness conditions of space flight or virtual reality simulations of motions violating gravity constraints) do motor actions become inaccurate, the inaccuracy reflecting the presence of ecological biases. Thus, the anticipatory timing of interception of different balls falling from a given height is constant, independently of ball mass (Lacquaniti & Maioli, Reference 420Lacquaniti and Maioli1989). By contrast, in spatial memory tasks, larger targets perceived as more massive induce a greater downward displacement than smaller, lighter targets, a result inconsistent with physics (Hubbard, Reference Hubbard1997). Also, balls rolling down an incline and then falling along a parabolic trajectory are always intercepted correctly from the very first trials, whether the parabola is visible or completely obscured (La Scaleia et al., Reference Bosco, Delle Monache, Gravano, Indovina and La Scaleia2015). Moreover, in different trials the intersection points are distributed along the parabolic trajectories, indicating that participants are able to extrapolate the trajectory quite accurately. By contrast, target extrapolation in spatial memory tasks derived by introducing variable temporal delays between the target disappearance and the observer’s response are highly distorted copies of actual target motion (de sá Teixeira et al., Reference Rastelli, Tallon-Baudry, Migliaccio, Toba, Ducorps and Pradat-Diehl2013).
Conclusions
I reviewed several lines of research indicating that both the accurate estimates as well as the presence of significant biases in the spatiotemporal localization of targets relative to gravity result from the integration of multisensory information with prior assumptions about the environment derived from past experience. Prior assumptions are necessary in the multisensory fusion because sensory signals are noisy and ambiguous. Moreover, the process of multisensory fusion appears to be governed by probabilistic rules. There is still no consensus on the nature of the prior assumptions underlying the spatiotemporal estimates. According to hard versions of constructivism, internal representations mirror the actual physical principles that govern the environment (Shepard, Reference Shepard1994). Thus, neural anticipation of a gravitational motion would be based on exact Newton’s laws. Indeed, when people are tested under ecological contexts, their automatic motor responses are often in accord with physics. On the other hand, cognitive judgments often are inconsistent with Newtonian mechanics, and people’s intuitive physics may be based on heuristics rather than realistic models of physics (McCloskey, Reference McCloskey1983a).
Introduction
Detecting and localizing moving objects is essential to avoiding obstacles and acting appropriately in response to these objects. To do this efficiently, humans use multiple sensory signals from the surrounding environment. Let us take moving cars as an example. Not only do they provide visual information (i.e., moving car-bodies), but also generate dynamically changing sounds. Sometimes one or both of these signals may be embedded in noise originating from the surrounding environment, such as someone’s voice or other objects in the proximity. In such cases, using information from multiple sensory modalities is a useful and effective way to compensate for the signal reduction in either modality, and to disambiguate the signals of a moving car.
Studies in the last few decades have increasingly demonstrated that the brain integrates information from different modalities in various aspects of perception, cognition, and action. While classic studies have demonstrated visual dominance in a variety of perceptual phenomena, recent findings have consistently shown that visual dominance does not always occur, even in spatial and spatiotemporal perception (see also other reviews, e.g., Alais, Newell, & Mamassian, Reference Alais, Newell and Mamassian2010; Chen & Vroomen, Reference Chen and Vroomen2013; Hidaka, Teramoto, & Sugita, Reference Hidaka, Teramoto and Sugita2015; Shams & Kim, Reference Shams and Kim2010; Shimojo & Shams, Reference Shimojo and Shams2001). For example, Sekuler, Sekuler, and Lau (Reference Sekuler, Sekuler and Lau1997) reported a “stream-bounce illusion.” In this illusion, two identical objects move toward each other, coincide, and move apart. The visual stimuli are equally likely to be perceived as overlapping and then continuing to move along their trajectory (i.e., streaming) or as bouncing off each other and then reversing direction (i.e., bouncing). However, playing a transient sound at the time of overlap induces perception of bouncing more frequently than perception of streaming. This suggests that auditory information can affect spatial aspects of visual motion processing. In this chapter, we discuss crossmodal, spatiotemporal biases observed in the large literature of multisensory interaction/integration, with a particular focus on the effects of auditory cues on visual motion perception.
Effects of Auditory Temporal Cues on Visual Motion Perception
Visual dominance over other sensory modalities in spatial tasks has been well known. A sound is often perceived as occurring at the position of a visual event, even when the sound and visual events actually occur at discrepant positions (ventriloquism effect; Howard & Templeton, Reference Howard and Templeton1966). The sound /ba/ can be perceived as /da/ or /ga/ when it is presented with a video of lips articulating /ga/ (McGurk effect; McGurk & MacDonald, Reference McGurk and MacDonald1976). In contrast, in temporal processing and tasks, auditory information is often dominant over visual information. While perceived flicker rate of a light while listening to fluttering sounds can be altered by the rate of fluttering sounds, visual flicker has little effect on the perceived rate of sound fluttering (auditory driving; Gebhard & Mowbray, Reference Gebhard and Mowbray1959; Shipley, Reference 453Shipley1964; Welch, DutionHurt, & Warren, Reference Welch, Warren, Boff, Kaufman and Thomas1986). A single flash can be perceived as two flashes when two sounds are presented simultaneously with the flash. This is known as the double flash illusion (Shams, Kamitani, & Shimojo, Reference Shams, Kamitani and Shimojo2000; see also Courtney, Motes, & Hubbard, Reference Courtney, Motes and Hubbard2007). In another example, temporal order judgments of two visual flashes improve when two sounds are presented before and after the flashes, but are impaired when the sounds are interspersed between the flashes (Morein-Zamir, Soto-Faraco, & Kingstone, Reference Morein-Zamir, Soto-Faraco and Kingstone2003; Scheier, Nijhawan, & Shimojo, Reference Scheier, Nijhawan and Shimojo1999; see also Fendrich & Corballis, Reference Fendrich and Corballis2001). These findings indicate that the perceived temporal position of visual stimuli is captured by sounds.
This superiority of audition over vision in temporal processing has also been observed in phenomena associated with visual motion perception. For instance, Vroomen and de Gelder (Reference Vroomen and de Gelder2004) demonstrated an effect of audition on visual motion perception using a flash-lag display, where a flash is perceived to be misaligned with respect to a moving visual object, even if the flash and object are physically presented at the same location (flash-lag effect, FLE; Nijhawan, Reference Nijhawan1994; see also Hubbard, Reference Hubbard2014b, Chapter 9 in this volume). In their experiment, a brief tone (16.7 msec) was presented in conjunction with a flash at various lags. The results showed that the magnitude of the FLE was reduced when the sound was presented before the flash, and increased when the sound was presented after the flash. Heron, Whitaker, & McGraw (Reference Bartolomeo, Urbanski, Chokron, Chainay, Moroni and Siéroff2004) demonstrated that the timing at which a brief sound was delivered was able to influence the bounce position of a horizontally moving visual object against a vertical virtual surface. Compared with a no-sound condition, when the sound occurred prior to the actual bounce, the bounce position appeared to be displaced in the direction opposite to the preceding visual motion (i.e., before the actual bounce position). These findings suggest that sounds can attract (and sharpen) visual event onset timing (flash or bounce) and, consequently, modulate perceived spatial position, measured as the flash-lag effect magnitude (Vroomen & de Gelder, Reference Vroomen and de Gelder2004) or the apparent visual stimulus bounce position (Heron et al., Reference Bartolomeo, Urbanski, Chokron, Chainay, Moroni and Siéroff2004).
The effects of auditory temporal cues on visual motion perception have also been investigated using apparent motion displays. When two spatially discrete visual stimuli are presented in alternation, observers perceive motion between the visual stimuli. Crucial factors for the occurrence of apparent motion are spatiotemporal distance between the visual stimuli and stimulus duration. When spatial distance and duration are held constant, temporal distance is an important factor that affects motion perception. Getzmann (Reference Getzmann2007) investigated whether short sounds presented proximally in time to visual stimuli influenced the quality of apparent motion perception. Two visual stimuli were presented in rapid succession with various onset intervals. Short sounds were presented either 75 msec before and after the first and second visual stimuli, at the same time as each visual stimulus, or in the interval between them. Participants were asked to classify their impression of motion. Presenting sounds in the interval between the visual stimuli facilitated the impression of continuous motion. In contrast, presenting sounds before and after or at the same time as each visual stimulus disrupted continuous motion perception. Freeman and Driver (Reference Freeman and Driver2008) presented two visual stimuli separated by 14° in alternation for several seconds to produce apparent visual horizontal motion. The stimulus onset asynchrony (SOA) and spatial position of the visual stimuli was kept constant, while the timing of concurrently presented auditory beeps varied. Total duration of right-left and left-right presentation was kept constant at 1.0 sec. Leftward motion perception should be dominant over rightward motion perception when the SOA is shorter for right-left than left-right stimulus presentation. Conversely, rightward motion perception should be dominant over leftward motion perception when the SOA is shorter for left-right than right-left presentation. The results showed that leftward motion perception was dominant when the first and second beeps lagged behind the right stimulus and preceded the left stimulus, respectively. Similarly, rightward motion was dominant over leftward motion when the SOA relationship was reversed (Figure 11.1). Moreover, prolonged presentation of such audiovisual stimuli induced motion aftereffects in the opposite direction of the previously perceived visual motion. Thus, these studies demonstrate that auditory information can change the perceived temporal position of visual stimuli in an apparent motion display, altering the perceptual quality and direction of visual motion.
Figure 11.1 Schematic illustration of spatiotemporal positions of audiovisual stimuli in Freeman and Driver (Reference Freeman and Driver2008). A bar was presented in alternation in the upper visual field. In the absence of any sounds, two discrete visual stimuli were perceived as “discrete,” consistent with the physical condition (left panel). In contrast, accompanying sounds changed the percept of these visual stimuli. When tone bursts were presented immediately after the left and before the right visual stimulus, smooth rightward apparent motion was usually perceived (middle panel). In contrast, when tone bursts were presented immediately after the right and before the left visual stimulus, smooth leftward apparent motion was usually perceived (right panel).
While the aforementioned studies focused on perceptual changes in visual onset timing mediated by auditory stimuli, there are several studies demonstrating that auditory information can also alter the perceived offset timing (and offset position) of visual motion stimuli. In the vision science literature, it is well known that the final position of a moving visual stimulus is mislocalized in the direction of motion (see Hubbard, Reference Hubbard1995a, Reference Hubbard2005b, Reference Hubbard2015a, Chapter 8 in this volume for a review). Freyd and Finke (Reference 394Freyd and Finke1984) termed this mislocalization “representational momentum (RM)” because the motion of a moving stimulus is prolonged in the direction of the object’s implied path of motion, similar to the manner in which physical object motion is prolonged. Although the mechanisms underlying RM remain unclear, it is generally accepted that some visual system extrapolation processes may maintain a mental representation of the moving visual stimulus for a brief period after the visual stimulus physically vanishes. Teramoto, Hidaka, Gyoba, and Suzuki (Reference Teramoto, Hidaka, Gyoba and Suzuki2010) used this phenomenon to investigate the effect of sounds on visual motion perception. In their experiments, a visual stimulus moved from either side of a monitor and disappeared at unpredictable positions around the center of the monitor. A complex tone without any motion cues was presented with the moving visual stimulus and vanished at various times relative to the offset of visual motion (Figure 11.2). Visual RM was enhanced when the sound was continuously presented from the beginning of the visual motion, and lasted longer than the visual motion. The magnitude of RM increased as the auditory offset lag relative to visual motion increased, and reached asymptote around 150 msec. In contrast, visual RM was reduced when the sound terminated shortly before the visual motion. The effect of sound on RM reduction was greatest when the auditory stimulus disappeared 100 msec before the visual motion, and was almost zero when it disappeared 150 msec before the visual motion. However, RM magnitude was not modulated by a brief tone burst (20 msec) around the visual motion offset (but see Chien, Ono, & Watanabe, Reference Chien, Ono and Watanabe2013), nor by a long-lasting sound that was not synchronized with the visual motion. These findings suggest that when an association between auditory and visual signals is sufficiently formed, auditory information can alter perceived visual motion offset.
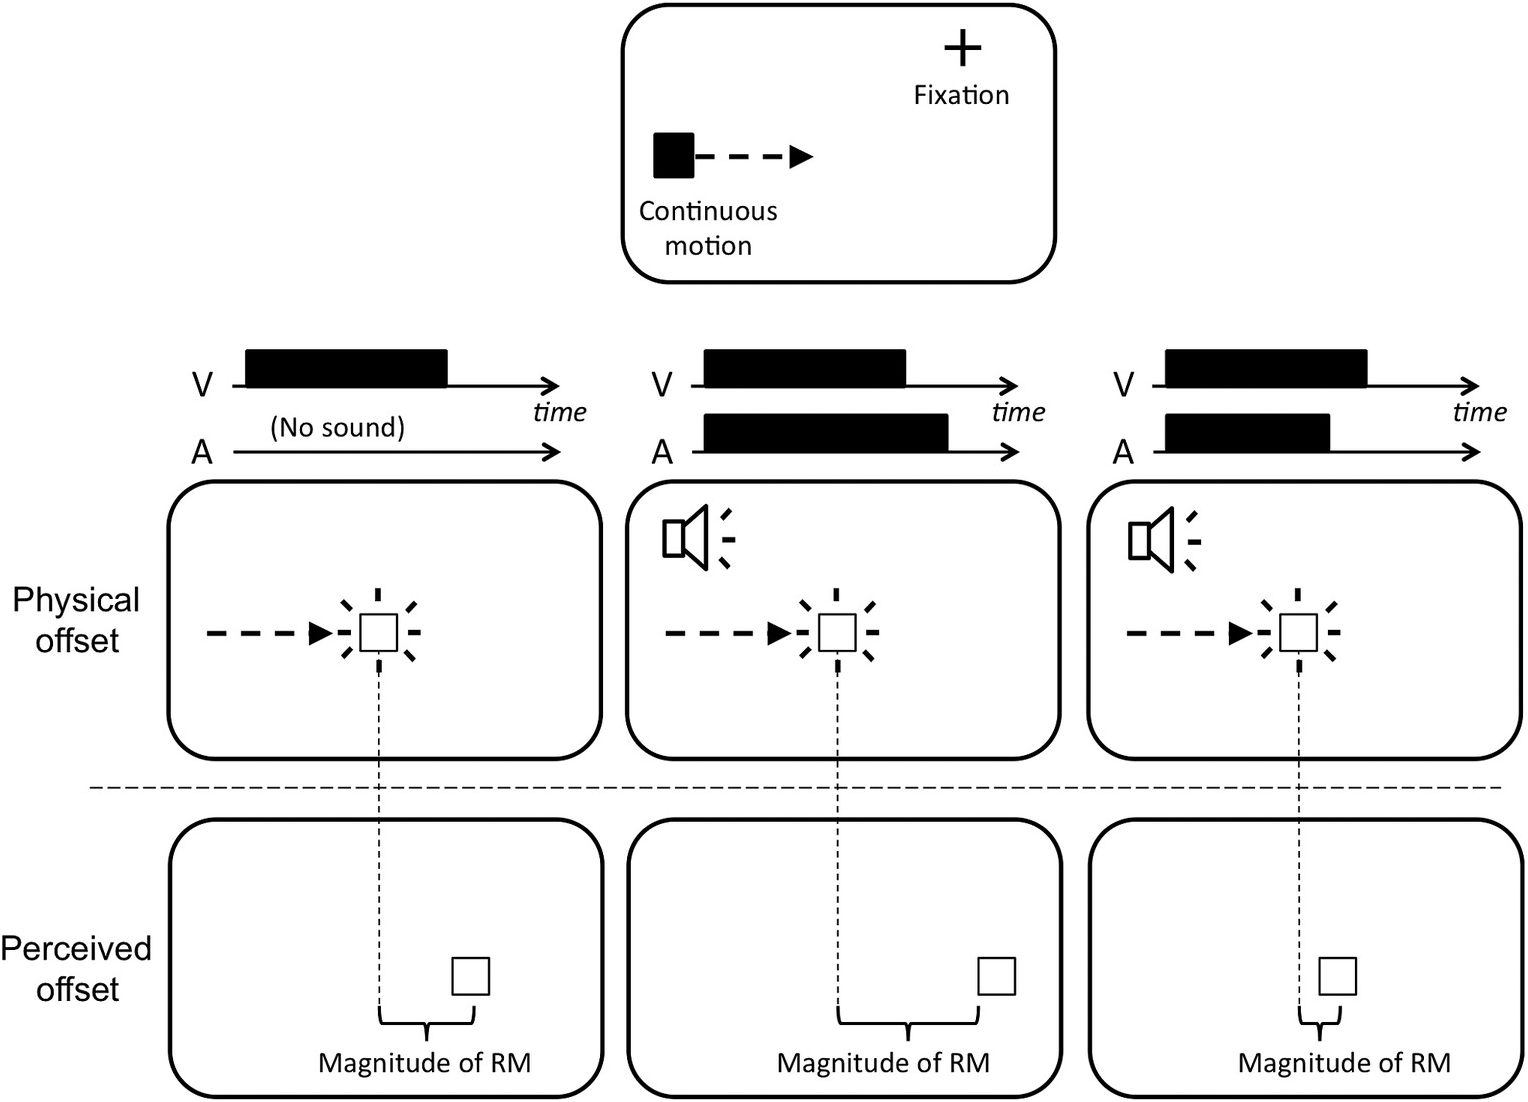
Figure 11.2 Example of the visual display and the presentation sequence used in Teramoto, Hidaka, Gyoba, and Suzuki (Reference Teramoto, Hidaka, Gyoba and Suzuki2010). A white square (target) moved laterally from either side of the CRT display to the center at a speed of 7.5°/s for 1,200 msec, and disappeared at an unpredictable position. A probe was presented 500 msec after the target disappeared. The participants’ task was to judge on which side (left or right) the probe was located relative to target offset position. On some trials, a sound was presented via headphones from the beginning of the target motion and stopped before, at, or after target offset. The magnitude of representational momentum (RM) decreased when the sound stopped before visual offset, and increased when the sound stopped after visual offset.
Taken together, auditory information can modulate temporal aspects (onset and offset) of visual motion events, resulting in an alternation of the spatial perception of these events. However, it should be noted that temporal auditory cues do not always influence visual motion events. A crucial factor for the modulation of visual motion events is relative temporal certainty between the auditory and visual signals. Heron et al. (Reference Bartolomeo, Urbanski, Chokron, Chainay, Moroni and Siéroff2004) investigated the effect of temporal certainty of auditory information on visual events by manipulating sound duration (2.33 msec [high certainty] vs. 74.56 msec [low certainty]). Effects were only found in the high temporal certainty condition. This is inconsistent with the modality appropriateness hypothesis (Welch & Warren, Reference Welch and Warren1980, Reference Welch, Warren, Boff, Kaufman and Thomas1986), which states that audition dominates vision for temporal tasks, while vision dominates audition for spatial tasks. This hypothesis predicts that auditory information always influences visual perception, as long as tasks require a temporal domain. Thus, the results of Heron et al. (Reference Bartolomeo, Urbanski, Chokron, Chainay, Moroni and Siéroff2004) indicate that, in the temporal domain, the perceptual system uses auditory information, not because it originates from the auditory system per se, but because it is more reliable than other simultaneous sensory inputs.
Another important factor is the temporal distance between auditory and visual events. This is known as the “temporal window” in which multisensory effects occur. The double flash illusion becomes less likely to be observed when an asynchrony between auditory and visual stimuli exceeds ±70 msec (Shams, Kamitani, & Shimojo, Reference Shams, Kamitani and Shimojo2002). Similarly, auditory effects on visual motion events reach asymptote around 100~150 msec and then decrease (Heron et al., Reference Bartolomeo, Urbanski, Chokron, Chainay, Moroni and Siéroff2004; Teramoto, Hidaka, Gyoba, and Suzuki (Reference Teramoto, Hidaka, Gyoba and Suzuki2010). Additionally, Teramoto, Hidaka, Gyoba, and Suzuki (Reference Teramoto, Hidaka, Gyoba and Suzuki2010) showed that sounds did not affect visual RM when the offset lag was kept within ±100 msec, but rather when large onset asynchronies (>400 msec) were introduced between a visual motion stimulus and an accompanying long-lasting sound. Thus, there is a temporal limit within which the perceptual system considers visual and auditory signals as originating from the same event.
Effects of Auditory Spatial Cues on Visual Motion Perception
Several studies have investigated spatial audiovisual interactions in motion perception, and most of these have found evidence for visual dominance (e.g., Allen & Koelers, Reference Allen and Kolers1981; Kitagawa & Ichihara, Reference Kitagawa and Ichihara2002; Kitajima & Yamashita, Reference Kitajima and Yamashita1999; Mateeff, Hohnsbein, & Noack, Reference Mateeff, Hohnsbein and Noack1985; Sanabria, Spence, Soto-Faraco, Reference Sanabria, Spence and Soto-Faraco2007; Soto-Faraco, Lyons, Gazzaniga, Spence, & Kingstone, Reference Soto-Faraco, Lyons, Gazzaniga, Spence and Kingstone2002; Soto-Faraco, Spence, & Kingstone, Reference Soto-Faraco, Spence and Kingstone2004, Reference Soto-Faraco, Spence and Kingstone2005; Soto-Faraco, Kingstone, & Spence, Reference Soto-Faraco, Kingstone and Spence2003; Strybel & Vatakis, Reference Strybel and Vatakis2004). For example, Matteeff et al. (Reference Mateeff, Hohnsbein and Noack1985) demonstrated that stationary auditory stimuli tended to be perceived as moving in the same direction as simultaneously presented moving visual stimuli, a phenomenon termed “dynamic visual capture.”
Kitajima and Yamashita (Reference Kitajima and Yamashita1999) and Soto-Faraco and colleagues (Sanabria et al., Reference Sanabria, Spence and Soto-Faraco2007; Soto-Faraco et al., Reference Soto-Faraco, Lyons, Gazzaniga, Spence and Kingstone2002, Reference Morein-Zamir, Soto-Faraco and Kingstone2003, Reference Bartolomeo, Urbanski, Chokron, Chainay, Moroni and Siéroff2004, Reference Soto-Faraco, Spence and Kingstone2005; Strybel & Vatakis, Reference Strybel and Vatakis2004) extended the findings of Matteeff et al. (Reference Mateeff, Hohnsbein and Noack1985) to moving auditory stimuli. Kitajima and Yamashita (Reference Kitajima and Yamashita1999) presented auditory stimuli that moved smoothly horizontally, vertically, or in depth in conjunction with visual stimuli moving in the same or opposite direction as the auditory motion. Perceived direction of the moving auditory stimulus was strongly influenced by visual motion in all directions, especially vertically and in depth. In the study presented by Soto-Faraco et al. (Reference Soto-Faraco, Lyons, Gazzaniga, Spence and Kingstone2002), auditory stimuli were presented via loudspeakers placed at horizontally separated positions, so that auditory apparent motion was perceived. Visual stimuli were concurrently presented from LEDs attached to the speakers to produce visual apparent motion in the same or opposite direction to the auditory motion. Participants correctly reported the motion direction (left/right) of auditory apparent motion when its direction was consistent with that of visual apparent motion. However, when auditory and visual motion directions were inconsistent, participants often misperceived the direction of auditory motion as consistent with the visual direction. Interestingly, auditory motion had little or no influence on the perceived direction of visual motion (Soto-Faraco et al., Reference Bartolomeo, Urbanski, Chokron, Chainay, Moroni and Siéroff2004; Strybel & Vatakis, Reference Strybel and Vatakis2004). Kitagawa and Ichihara (Reference Kitagawa and Ichihara2002) also demonstrated asymmetrical effects in motion perception between auditory and visual modalities. In their experiment, participants adapted to visual size change (increasing or decreasing visual image size), auditory loudness change (increasing or decreasing sound pressure level), both visual and auditory stimuli in the same (congruent) direction, or both in the opposite (incongruent) direction. These changes in physical attributes occurred as the objects moved in the depth direction. Auditory loudness aftereffects that occurred after adaptation to visual size change alone were enhanced after adaptation to congruent audiovisual stimuli, and disappeared after adaptation to incongruent audiovisual stimuli. In contrast, adaptation to auditory loudness change alone did not influence visual size change aftereffects. These findings seem consistent with the notion of visual dominance in spatial perception (see also Alais & Burr, Reference Alais and Burr2004a; Meyer & Wuerger, Reference Meyer and Wuerger2001; Wuerger, Hofbauer, & Meyer, Reference Wuerger, Hofbauer and Meyer2003).
In the literature of ventriloquism effects, Alais and Burr (Reference Alais and Burr2004b) demonstrated that visual dominance in spatial tasks is not always the case when the visibility or reliability of visual inputs is degraded. In this study, blurred visual stimuli were used to increase or decrease position certainty. Participants performed a localization task with visual, auditory, and audiovisual targets. In the audiovisual target condition, the perceived position of auditory stimuli shifted toward concurrent visual stimuli when positional uncertainty of the visual stimuli was low. In contrast, the perceived position of visual stimuli with high positional uncertainty was often captured by auditory stimuli. Similar to the temporal domain described in the previous section (Heron et al., Reference Bartolomeo, Urbanski, Chokron, Chainay, Moroni and Siéroff2004), it seems likely that the perceptual system often uses visual information in spatial processing, not because it originates from the visual system per se, but because it is more reliable compared to other incoming sensory inputs. This indicates a possibility that auditory information influences visual motion perception when visual information is degraded.
Hidaka et al. (Reference Hidaka, Kawachi and Gyoba2009) investigated whether auditory motion information affected the perception of visual stimuli presented in the peripheral visual field. In this paper, the authors noted that previous studies reporting visual dominance effects in audiovisual motion perception presented visual stimuli in the central or paracentral retinal regions, where the spatial resolution of the visual system is excellent. Perrott, Costantino, and Cisneros (Reference Perrott, Costantino and Cisneros1993) reported that location discrimination performance, at azimuth angles of 20° or larger, was better suited for the auditory versus visual modality. Therefore, there is a possibility that auditory spatial information can modulate visual perception when visual stimuli are presented in the peripheral visual field. In the experiment conducted by Hidaka, Kawachi, and Gyoba (Reference Doricchi, Merola, Aiello, Guariglia, Bruschini and Gevers2009), apparent auditory motion was presented through headphones, and a blinking visual target was presented at various retinal eccentricities (Figure 11.3). Results showed that the auditory motion signal drove motion perception of a static visual target. The frequency of visual motion perception increased as retinal eccentricity increased. This auditory driving effect on visual motion perception was reported for both horizontal and vertical auditory motion (Teramoto et al., Reference Teramoto, Manaka, Hidaka, Sugita, Miyauchi, Sakamoto, Iwaya and Suzuki2010).
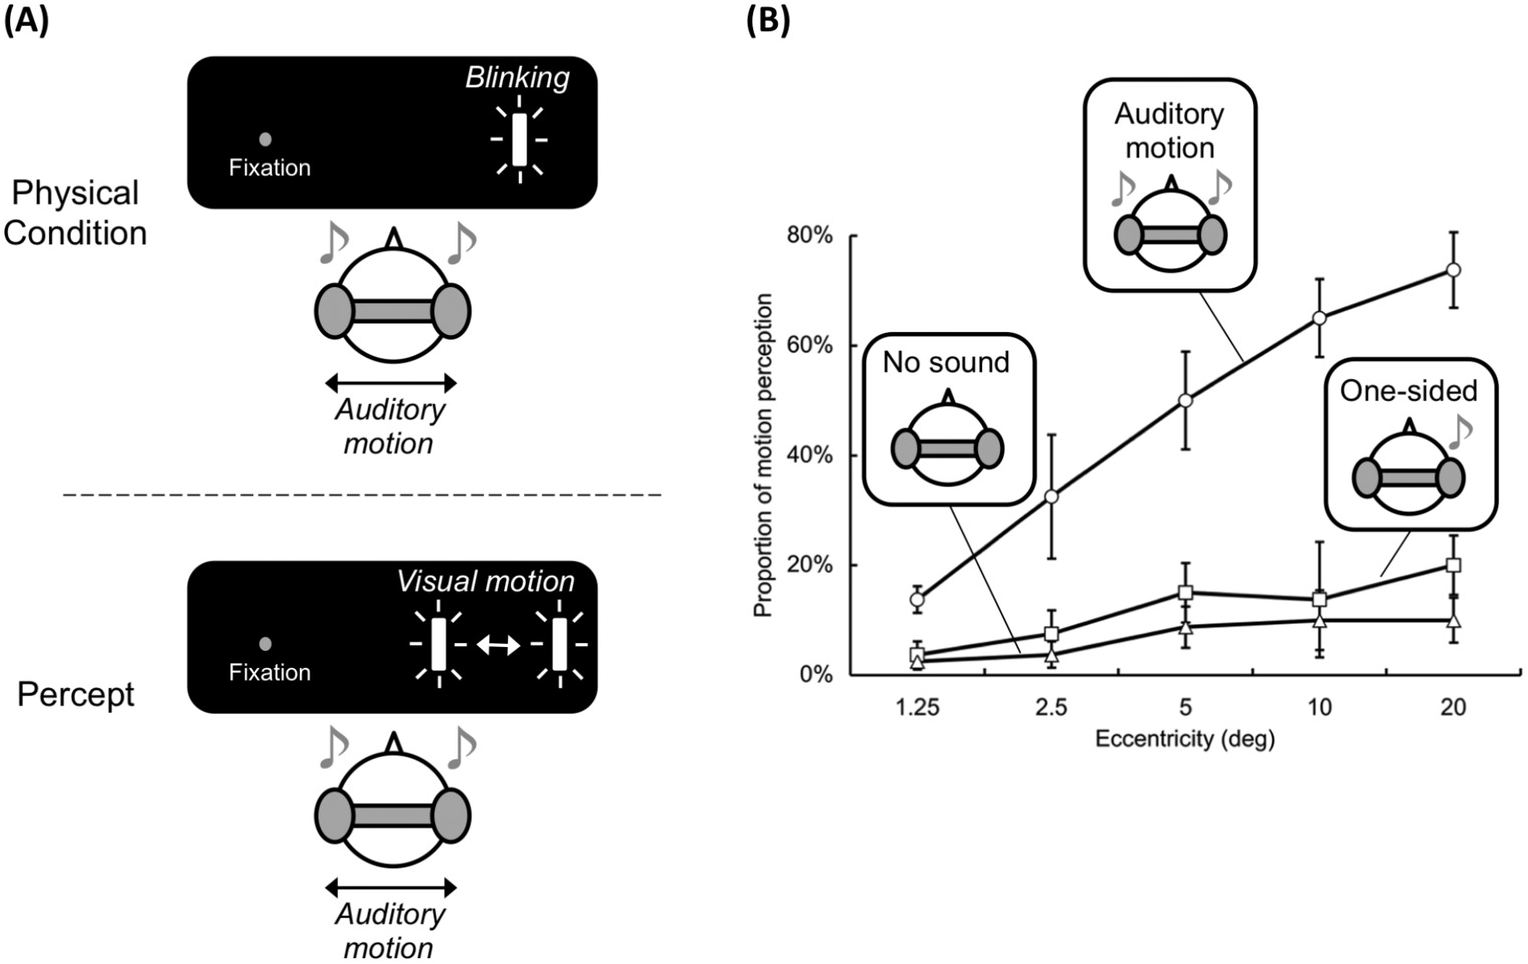
Figure 11.3 Schematic illustration of the sound-induced visual motion illusion (Hidaka et al., Reference Doricchi, Merola, Aiello, Guariglia, Bruschini and Gevers2009). (A) A vertical bar blinking at a fixed position was presented, and its onset was synchronized with a tone burst alternating between the left and right ears. The visual stimuli in such an auditory condition could be perceived as moving laterally. This is the first demonstration of an auditory driving effect on visual motion perception. (B) The results of Hidaka et al. (Reference Hidaka, Kawachi and Gyoba2009). The auditory effect increased as retinal eccentricity of the visual stimuli increased.
In a different study, Hidaka et al. (Reference Hidaka, Teramoto, Sugita, Manaka, Sakamoto and Suzuki2011) found that continuous auditory motion signals, generated by cross-fading two white noises between the left and right ears, could also induce motion perception for a static visual target when it was presented in the peripheral visual field. In addition, continuous auditory motion determined the perceived direction of an ambiguous visual global motion display, in which motion information is extracted from the integration of multiple local motion signals (Williams & Sekuler, Reference Williams and Sekuler1984). Furthermore, Teramoto et al. (Reference Teramoto, Hidaka, Sugita, Sakamoto, Gyoba, Iwaya and Suzuki2012) demonstrated that perceived direction of visual motion could be altered by auditory motion information. In these experiments, apparent visual and auditory motion stimuli were simultaneously presented in two orthogonal directions (i.e., one moved vertically while the other moved horizontally). The perceived direction of visual motion could be consistent with the direction of auditory motion, or was between this direction and that of actual visual motion. Deviation of perceived direction of motion from actual direction was more likely at larger retinal eccentricities. In addition, a separate study reported that the auditory effects on visual motion offset localization were also more salient in the peripheral visual field (Schmiedchen, Freigang, Nitsche, & Rübsamen, Reference Schmiedchen, Freigang, Nitsche and Rübsamen2012). These studies suggest that auditory information can influence visual motion events when visual information is degraded.
One study increased the spatial precision of auditory stimuli instead of decreasing the reliability of visual stimuli. Meyer, Wuerger, Rührbein, and Zetzsche (Reference Meyer, Wuerger, Röhrbein and Zetzsche2005) created auditory motion by switching physical sound sources instead of manipulating differences in the interaural level (Meyer & Wuerger, Reference Meyer and Wuerger2001; Wuerger et al., Reference Wuerger, Hofbauer and Meyer2003) or time (Alais & Burr, Reference Alais and Burr2004a). Motion detection thresholds were measured when either or both auditory and visual motion information were presented. Motion detection thresholds improved when auditory and visual motion signals were spatiotemporally consistent. This study highlights the importance of the quality of auditory spatial information (but see also Kim, Peters, & Shams, Reference Kim, Peters and Shams2012).
To summarize, in contrast to the traditional view of visual dominance for motion processing, recent studies have demonstrated that auditory spatial cues can exert a strong influence on visual motion perception. It should be noted that this is not always the case, however. Necessary conditions include high positional uncertainty of visual, relative to auditory stimuli (Hidaka et al., Reference Doricchi, Merola, Aiello, Guariglia, Bruschini and Gevers2009; Hidaka, Teramoto, Sugita, Manaka, Sakamoto, & Suzuki, 201; Teramoto, Manaka, Hidaka, Sugita, Miyauchi, Sakamoto, Iwaya, & Suzuki, Reference Teramoto, Hidaka, Gyoba and Suzuki2010; Teramoto et al., Reference Teramoto, Hidaka, Sugita, Sakamoto, Gyoba, Iwaya and Suzuki2012; Schmiedchen et al., Reference Schmiedchen, Freigang, Nitsche and Rübsamen2012), and/or auditory signals that include high-quality spatial information (Meyer et al., Reference Meyer, Wuerger, Röhrbein and Zetzsche2005). In other words, the relative reliability of auditory and visual information is crucial. These findings are well consistent with the predictions made by the maximum likelihood estimation (MLE) model of multisensory interaction/integration (Alais & Burr, Reference Alais and Burr2004b; Ernst & Banks, Reference Ernst and Banks2002; Ernst & Bülthoff, Reference Ernst and Bülthoff2004). Signals from each sensory modality are weighted by their reliability, such that reliable and unreliable sensory signals are assigned a high and low weight, respectively. Then, these weighted signals are combined (weighted average) so that the brain ultimately receives a more reliable (or less variable) estimate of the event. Reliability is typically defined as the inverse variance of the probability distribution representing the likelihood of the occurrence of an event in the given sensory modality. Thus, this model assumes that how sensory modalities interact can be flexibly changed depending on the relative reliabilities of sensory signals. It seems likely that the MLE model can capture most of the previous data on audiovisual motion perception.
Effects of Auditory Synesthetic or Semantic Cues on Visual Motion Perception
In addition to spatial and temporal information in multisensory signals, it is well known that semantic congruency plays an important role in multisensory interaction/integration. Semantic congruency is defined by whether auditory and visual signals are matched in terms of identity and/or meaning (Spence, Reference Spence2011). For example, a visual image of a dog barking is semantically congruent with the sound “bow-wow,” but not “meow” (e.g., Amedi, von Kriegstein, van Atteveldt, Beauchamp, & Naumer, Reference Amedi, von Kriegstein, van Atteveldt, Beauchamp and Naumer2004; Laurienti, Kraft, Maldjian, Burdert, & Wallace, Reference Laurienti, Kraft, Maldjian, Burdett and Wallace2004). According to Spence (Reference Spence2011), semantic congruency is different from synesthetic congruency, which refers to “correspondences between putatively non-redundant stimulus attributes or dimensions that happen to be shared by many people” (Spence, Reference Spence2011, p. 927). For example, sound pitch can provide not only a high-low sensation of pitch, but also an up-down (or high-low) impression in space (Bernstein & Edelstein, Reference Berlyne1971; Evans & Treisman, Reference Evans and Treisman2010; Mudd, Reference Mudd1963; Pratt, Reference Pratt1930; Roffler & Butler, Reference Roffler and Butler1968; Rusconi, Kwan, Giordano, Umiltà, & Butterworth, Reference Rusconi, Giordano, Casey, Umiltà, Butterworth, Baroni, Addessi, Caterina and Costa2006). The effects of semantic/synesthetic acoustic cues on visual motion perception have also been investigated in the audiovisual motion perception literature. Maeda, Kanai, and Shimojo (Reference Kanai, Sheth and Shimojo2004) investigated whether ascending or descending pitch can bias visual motion perception. Ascending pitch tends to be associated with upward motion, while descending pitch tends to be associated with downward motion. They presented ambiguous visual motion stimuli that included both upward and downward motion information in conjunction with either ascending or descending pure tone pitches. Results showed that ascending pitch induced more upward than downward motion responses, and vice versa. Interestingly, sounds that were not synchronized with visual motion onset or actual words representing upward or downward motion had little or no effect on visual motion perception. Furthermore, the effect decreased as orientation disparity increased. These findings suggest that synesthetically congruent sounds can modulate visual motion perception.
Recently, Hidaka, Teramoto, Keetels, and Vroomen (Reference Hidaka, Teramoto, Keetels and Vroomen2013) investigated whether this pitch-space correspondence could induce motion perception to a static visual stimulus, using a method adapted from Hidaka et al. (Reference Doricchi, Merola, Aiello, Guariglia, Bruschini and Gevers2009). In this experiment, two loudspeakers were set at 50 cm above and below the center of the visual display where a blinking visual stimulus was presented. In one condition, two discrete tones with high- and low-frequency bands were presented in alternation from both loudspeakers. In the other condition, high- and low-pitched tones were presented alternately from the upper and lower speakers, respectively. Alternation of pitch information (high-low or low-high tone sequences) did not induce vertical visual apparent motion perception, while alternation of position information induced motion perception in a manner similar to that observed by Hidaka et al. (Reference Doricchi, Merola, Aiello, Guariglia, Bruschini and Gevers2009). Hubbard and Courtney (Reference Hubbard and Courtney2010) investigated the effects of ascending/descending tone frequencies on visual RM. They found that changing frequency had little effect on visual RM when vertical visual motion was presented, but induced slight mislocalization in the direction of implied gravity (i.e., visual representational gravity; Hubbard, Reference Hubbard1990, Reference Hubbard1995b, Reference Hubbard1997; Hubbard & Bharucha, Reference 408Hubbard and Bharucha1988) when horizontal visual motion was presented. Thus, the results of these three studies are not consistent, possibly due to a difference in auditory stimuli, as suggested by Hidaka et al. (Reference Hidaka, Teramoto, Keetels and Vroomen2013). While both Hidaka et al. (Reference Hidaka, Teramoto, Keetels and Vroomen2013) and Hubbard and Courtney (Reference Hubbard and Courtney2010) used sequences of discrete sounds, Maeda et al. (Reference Bartolomeo, Urbanski, Chokron, Chainay, Moroni and Siéroff2004) used continuous frequency changes (glides), which can elicit a greater impression of motion (Walker, Reference Walker1987). However, there are several other differences in addition to auditory stimuli, such as the parameters of visual stimuli and experimental procedures. Thus, further studies are needed to clarify the effects of pitch-space correspondence on audiovisual motion processing.
Auditory effects on biological motion perception have also been investigated (Arrighi, Marini, & Burr, Reference Arrighi, Marini and Burr2009; Brooks, van der Zwan, Billard, Petreska, Clarke, & Blanke, Reference Brooks, van der Zwan, Billard, Petreska, Clarke and Blanke2007; Saygin, Driver, & de Sa, Reference Saygin, Driver and de Sa2008; Schouten, Troje, Vroomen, & Verfaillie, Reference Schouten, Troje, Vroomen and Verfaillie2011). According to this literature, semantically congruent sounds can improve the perception of visual biological motion. Arrighi et al. (Reference Arrighi, Marini and Burr2009) had participants detect point-light tap dance sequences embedded in visual noise. In some trials, synchronous or asynchronous tap dance sounds were added to the visual sequence. In other trials, no sound was added. Synchronous tap dance sounds improved detection of visual biological motion, irrespective of whether the sounds were task-relevant or not. Because the improvement was better than predicted by the MLE model, the authors suggested that there was physiological summation of audiovisual signals.
Some studies have shown that synesthetically or semantically congruent sounds can facilitate visual motion perception, while other studies have not. Overall, relatively little is known about the influence of this type of auditory cue on visual motion perception. Spence (Reference Spence2011) classified this type of multisensory interaction/integration into three categories based on the assumed origin: structural, statistical, and semantically mediated correspondences. Structural correspondence refers to physiological correspondence, that is, the proximity/similarity of brain areas/activity when processing signals from different sensory modalities. Statistical correspondence refers to the learned natural correlation between attributes of different sensory modalities. Semantically mediated correspondences refer to links mediated by common linguistic terms. Pitch-space correspondence would be classified as semantically mediated, while the tap dance scenario is an example of statistical correspondence. These differences may modulate the influence of auditory cues on visual motion perception. Statistical correspondence is discussed in more detail in the next section.
Effects of Audiovisual Associative Learning on Visual Motion Perception
Although the MLE model specifies sensory weighting mechanisms, it does not describe how the brain knows which signals, from different sensory modalities, should be integrated or segregated. This is important for establishing crossmodal correspondence relationships. Spatiotemporal consistency (e.g., Calvert, Spence, & Stein, Reference Calvert, Spence and Stein2004) and temporal correlation (Parise, Harrar, Ernst, & Spence, Reference Parise, Harrar, Ernst and Spence2013; Parise, Spence, & Ernst, Reference Parise, Spence and Ernst2012) of signals provide cues about correspondences. However, because each sensory modality receives many inputs each second, it seems implausible that the brain relies only on such spatiotemporal information. A strategy in which preliminary associations between signals are formed would likely help the brain bind signals efficiently. Recent research has approached this question using Bayesian estimation theory in multisensory integration (e.g., Bresciani, Dammeier, & Ernst, Reference Bresciani, Dammeier and Ernst2006; Ernst, Reference 390Ernst, Knoblich, Thornton, Grosjean and Shiffrar2005, Reference Ernst2007, Reference Ernst and Stein2012; Körding, Beierholm, Ma, Quartz, Tenenbaum, & Shams, Reference Körding, Beierholm, Ma, Quartz, Tenenbaum and Shams2007; Roach, Heron, & McGraw, Reference Roach, Heron and McGraw2006; Shams, Ma, & Beierholm, Reference Shams, Ma and Beierholm2005). According to this theory, sensory inputs are combined with prior knowledge about whether stimuli from one sensory modality and those of another modality should be integrated to determine perception. Ernst (Reference Ernst2007) demonstrated that prior knowledge could be learned across arbitrary crossmodal inputs, even by adults. In training sessions, arbitrary but correlated signals from vision and touch, such as object luminance and stiffness (i.e., the brighter the object, the stiffer it was), were presented. Before and after training, participants performed an object discrimination task. Ernst (Reference Ernst2007) predicted that if these sensory signals were processed independently, visual luminance should not influence tactile discrimination performance, and vice versa. Although no effect was found before training, discrimination performance was worse for stimuli where luminance-stiffness was uncorrelated than correlated after training. Seitz, Kim, van Wassenhove, and Shams (Reference Seitz, Kim, van Wassenhove and Shams2007) also demonstrated that this type of associative learning effect could occur in audiovisual object identification. These findings suggest that newly learned relationships (i.e., coupling prior) can contribute to subsequent perception, as predicted by a Bayesian model.
Recently, Teramoto, Hidaka, and Sugita (Reference Teramoto, Hidaka and Sugita2010) demonstrated that arbitrary crossmodal associations could also be established in audiovisual motion perception. In these experiments, two side-by-side visual stimuli were presented in alternation, producing horizontal apparent motion. The onsets of the two visual stimuli were synchronized with high (H: 2,000 Hz) and low (L: 500 Hz) frequency tone bursts (Figure 11.4). Participants were exposed to these audiovisual stimuli for 3 min. Prior to exposure, the sound sequence had no influence on visual motion perception. However, after exposure, the sound sequence induced visual motion perception of a visual stimulus blinking at a fixed location. For example, when the left and right visual stimuli were presented with L and H tones, respectively, in the exposure phase, the LH and HL tone sequences induced rightward and leftward visual motion perception, respectively. The association effect disappeared when the inter-stimulus interval of the visual stimuli was too long to be perceived as apparent motion during exposure. In addition, more recent studies have demonstrated that this effect generalizes to other types of visual motion, such as global motion (Hidaka, Teramoto, Kobayashi, & Sugita, Reference Hidaka, Teramoto, Kobayashi and Sugita2011) and higher-order visual motion (Kafaligonul & Oluk, Reference Kafaligonul and Oluk2015). These findings suggest that an audiovisual association in motion perception can be formed at several levels of visual motion processing. Furthermore, Kobayashi, Teramoto, Hidaka, and Sugita (Reference Kobayashi, Teramoto, Hidaka and Sugita2012a) tested the association effect using two tone bursts, instead of pure tones, that were physically different but perceptually indiscriminable. In their first experiment, two complex tones that consisted of eight frequencies (seven were shared and one was unique) were used and associated with visual motion. Even these sounds influenced visual motion perception. In the second experiment, another type of indiscriminable tone bursts, which were created by applying peak and notch filters centered at 500 Hz and 2,000 Hz, respectively (or vice versa), to white noise, were tested. The results were replicated with these sounds, suggesting that explicit knowledge of the relationship between visual motion and sound sequence is not necessary to form an association.

Figure 11.4 Schematic illustration of perceptual associative learning effects between auditory and visual stimuli reported in Teramoto, Hidaka, and Sugita (Reference Teramoto, Hidaka and Sugita2010). Two visual stimuli were presented in alternation. Each stimulus was paired with a tone of unique frequency (500 Hz or 2,000 Hz). After 3 min exposure to such audiovisual stimuli, the tone sequence induced lateral motion perception to a visual stimulus blinking at a fixed location, in the same manner as the audiovisual relationship at exposure.
Interestingly, Teramoto, Hidaka, and Sugita (Reference Teramoto, Hidaka and Sugita2010) reported that the effect was not observed when the retinal position of the visual stimuli differed between the exposure and test phase (by at least 5°) (see also Hidaka, Teramoto, Kobayashi, & Sugita, Reference Hidaka, Teramoto, Kobayashi and Sugita2011). Since visual receptive fields typically get larger with progressing visual processing, this finding suggests that relatively lower stages of visual processing are involved. Furthermore, Kobayashi et al. (Reference Kobayashi, Teramoto, Hidaka and Sugita2012a) showed that the effect did not occur when the stimulated eye differed between exposure and test phases, suggesting visual processing stages before integrating information from both eyes are involved in this association.Footnote 1 As for the auditory processing stages involved in this association effect, Kobayashi, Teramoto, Hidaka, and Sugita (Reference Kobayashi, Teramoto, Hidaka and Sugita2012b) reported that the association effect had sharp frequency selectivity. After exposure to visual apparent motion and specific tone frequency changes (e.g., 400 and 2,100 Hz), tones with frequencies that differed by 0.25 octave (e.g., 476–2,496 Hz or 566–2,970 Hz) did not have any effect on visual motion perception in the subsequent test session. Similarly, the observed effect was specific to the exposed ear. These findings suggest that auditory processing stages that have relatively sharp frequency selectivity (i.e., relatively lower stages of auditory processing) are involved.
There are two points that should be noted here. First, the association effect is reciprocal. Teramoto, Kobayashi, Hidaka, and Sugita (Reference Teramoto, Kobayashi, Hidaka and Sugita2013) demonstrated that pitch perception of auditory stimuli can be contingent on visual motion direction, after prolonged exposure to audiovisual stimuli. When leftward apparent visual motion was paired with high–low-frequency sequences during exposure, a test tone sequence was more frequently perceived as a high–low-pitch sequence when leftward apparent visual motion was presented. Thus, once an association is formed, related signals from different sensory modalities influence each other. Second, crossmodal associative learning in spatiotemporal processing is not limited to audiovisual domains. Recently, Kuang and Zhang (Reference Kuang and Zhang2014) presented changes in smells (banana and fennel) with a visual global motion display. After exposure, the smells affected perceived direction of visual global motion. This suggests that crossmodal associative learning is a general phenomenon that occurs between a variety of sensory modality pairs.
In summary, recent studies have clearly demonstrated that new perceptual associations can be easily established between signals from different modalities. After associations are formed, inputs from one sensory modality influence perception of the other sensory modality. This fits well with the role of prior knowledge in the Bayesian estimation theory of multisensory interaction/integration. These findings suggest that perceptual associative learning is one of the most plausible underlying mechanisms for establishing common perceptual and neural mechanisms, not only in audiovisual motion processing, but also in crossmodal processing more generally.
Concluding Remarks
In this chapter, we summarized recent studies on the influence of auditory cues on visual motion processing. Traditionally, crossmodal studies have demonstrated that vision is dominant over other sensory modalities (i.e., visual capture) in spatial processing. Spatial ventriloquism and McGurk effects are typical examples supporting this notion. This had been considered to be the case with motion perception. Until recently, it was believed that visual information exerts a critical influence on auditory motion perception, while auditory information has little or no influence on visual motion perception. However, recent findings have clearly demonstrated that various auditory cues can influence visual motion perception. First, temporal auditory cues can change the perceived timing of concurrently presented visual stimuli, resulting in improvement/impairment of apparent motion perception (Freeman & Driver, Reference Freeman and Driver2008; Getzmann, Reference Getzmann2007), as well as the mislocalization of visual motion (Chien et al., Reference Chien, Ono and Watanabe2013; Heron et al., Reference Bartolomeo, Urbanski, Chokron, Chainay, Moroni and Siéroff2004; Teramoto, Hidaka, Gyoba, & Suzuki, Reference Teramoto, Hidaka, Gyoba and Suzuki2010) and visual motion events (Vroomen & de Gelder, Reference Vroomen and de Gelder2004). These results are consistent with a traditional view that audition is more dominant than vision in temporal processing. However, in contrast to the traditional view of visual dominance in motion processing, auditory spatial cues also can exert a strong influence on visual motion perception. Notably, auditory dominance occurs in conditions where positional uncertainty of visual, relative to auditory, stimuli is high, for example, when visual stimuli are presented in the peripheral visual field (Hidaka et al., Reference Doricchi, Merola, Aiello, Guariglia, Bruschini and Gevers2009; Hidaka, Teramoto, Sugita, Manaka, Sakamoto, & Suzuki, Reference Hidaka, Teramoto, Sugita, Manaka, Sakamoto and Suzuki2011; Teramoto, Manaka, Hidaka, Sugita, Miyauchi, Sakamoto, Iwaya, & Suzuki, Reference Teramoto, Manaka, Hidaka, Sugita, Miyauchi, Sakamoto, Iwaya and Suzuki2010; Teramoto et al., Reference Teramoto, Hidaka, Sugita, Sakamoto, Gyoba, Iwaya and Suzuki2012; Schmiedchen et al., Reference Teramoto, Hidaka, Sugita, Sakamoto, Gyoba, Iwaya and Suzuki2012), and/or there is high-quality spatial information in the auditory signals (Meyer et al., Reference Meyer, Wuerger, Röhrbein and Zetzsche2005). This is clearly consistent with the MLE model of multisensory interaction/integration (e.g., Ernst & Banks, Reference Ernst and Banks2002). Specifically, audiovisual integration/interaction in motion perception is flexible and based on the reliability and saliency of spatiotemporal information.
In addition to auditory spatiotemporal cues, synesthetic or semantic auditory information can also influence visual motion perception (e.g., Arrighi et al., Reference Arrighi, Marini and Burr2009; Hidaka et al., Reference Hidaka, Teramoto, Keetels and Vroomen2013; Hubbard & Courtney, Reference Hubbard and Courtney2010; Maeda et al., Reference Bartolomeo, Urbanski, Chokron, Chainay, Moroni and Siéroff2004; Schouten et al., Reference 375Bourlon, Duret, Pradat-Diehl, Azouvi, Loeper-Jeny and Merat-Blanchard2011). It is likely that associative learning between auditory and visual information influences this type of auditory effect on visual motion perception (Teramoto, Hidaka, & Sugita, Reference Teramoto, Hidaka and Sugita2010). These findings clearly suggest that auditory and visual information closely interact in motion perception, and that common neural mechanisms for audiovisual motion processing exist at multiple stages, from very early to higher-level cognitive processing. Similarly, recent neuroimaging studies have shown that several regions are commonly activated by auditory and visual motion stimuli (Alink, Singer, & Muckli, Reference Alink, Singer and Muckli2008; Baumann & Greenlee, Reference Baumann and Greenlee2007; Hidaka, Higuchi, Teramoto, & Sugita, Reference Hidaka, Higuchi, Teramoto and Sugita2017; Lewis, Beauchamp, & DeYoe, Reference Lewis, Beauchamp and DeYoe2000; Scheef et al., Reference Scheef, Boecker, Daamen, Fehse, Landsberg and Granath2009). However, relatively little is known about the neural mechanisms of audiovisual motion processing. Further investigation on this topic could contribute to a comprehensive understanding of the influence of crossmodal interactions on spatiotemporal, spatial, and temporal processing.
In the scientific community, it is almost universally accepted that the remarkable features of our auditory and visual systems have evolved over millions of years. Adaptive perceptual mechanisms that aid survival and reproduction are passed on to subsequent generations. Yet many in the scientific community also hold the belief that our perceptual systems have evolved to give us an “accurate” representation of our environment. Any observed inaccuracies in our perceptual abilities are often considered imperfections in the evolutionary process. However, from an evolutionary perspective, perceptual accuracy is far less important than utility in terms of survival and reproduction. While it is true that our perception of the world must be accurate enough for us to perform all of the remarkable feats that we do, it is also true that evolution will always favor perceptual distortions and cognitive biases over veridical representation of the environment when the former provide a greater selective advantage. Perceptual systems have not evolved because they provide an accurate representation of the environment. They have evolved because they bestow specific advantages in survival and reproduction (Popper & Fay, Reference Popper and Fay1997). If a perceptual bias provides a greater evolutionary advantage than an accurate representation, it will be passed on to subsequent generations at a higher rate than veridical perceptual abilities. The biases that occur when perceiving looming objects are examples of this phenomenon.
However, providing evidence to support this assertion presents a unique challenge. Although few doubt that perceptual abilities in some nebulous sense are a product of evolution, the burden of evidence crystalizes considerably when one begins to make a case for the evolution of a specific perceptual trait. Ethical considerations and the time course of human evolution dictate that the traditional experimental method used to test behavioral hypotheses must be modified when our hypotheses regard the evolution of a specific perceptual trait. We can’t simply apply an independent variable to a sample and evaluate how it affects human evolution. As such, making a convincing case that a perceptual bias (or any other behavioral trait) has been shaped by evolution requires converging empirical evidence from a wide array of disciplines and methods including physiological, comparative, behavioral, theoretical, cross-cultural, anthropological, medical, and even genetic areas of investigation (Schmitt & Pilcher, Reference Schmitt and Pilcher2004). Not every perceptual bias is an adaptation. The dim visual afterimage that occurs after a bright camera flash is a perceptual bias. However, this bias provides no ostensible selective advantage. It is simply a by-product of how the visual system functions. Thus, the degree to which we can be confident that a given bias is an evolutionary adaptation is dependent on the quality and quantity of converging evidence that can be gathered from these diverse areas.
In this chapter, I examine auditory and visual perception of looming objects – objects in motion that approach an observer. Looming objects are a very special class of stimuli that are treated with priority by both the auditory and visual systems because of their importance in ecological and evolutionary terms. However, the auditory and visual systems have evolved to deal with looming objects in different ways and have different strengths and weaknesses. The visual system provides estimates of arrival time that are relatively accurate and precise under good viewing conditions. The auditory system is less accurate and less precise but can be characterized as an “advanced warning” system that provides input into a categorical decision about whether there is time to direct the eyes toward the looming object, or whether evasive actions need to be initiated immediately (Guski, Reference Guski1992; Seifritz et al., Reference Seifritz, Neuhoff, Bilecen, Scheffler, Mustovic and Schachinger2002). Unlike vision, the auditory system functions well when visibility is poor and when objects are occluded or are out of the line of sight. Together the two systems provide a perceptual representation that, while not always accurate, enables highly successful interaction with looming objects. We begin this chapter with a review of the literature on unimodal looming perception in both audition and vision. We then examine the smaller body of research that has examined multisensory integration of looming perception.
Auditory Looming
The Auditory Looming Bias
The auditory looming bias is the strong tendency for listeners to underestimate the arrival time of an approaching sound source. Essentially listeners perceive that the source has arrived when it is still some distance away (Neuhoff, Reference Neuhoff2001). A looming sound source creates several important sources of dynamic acoustic information that listeners can use to make judgments about the arrival time. Perhaps the most studied is the change in intensity that occurs as a source approaches. Simple changes in intensity are sufficient for activating motion-sensitive areas of the brain (Seifritz et al., Reference Seifritz, Neuhoff, Bilecen, Scheffler, Mustovic and Schachinger2002), and the pattern of rising intensity that occurs as a source approaches can physically specify the arrival time, a variable termed acoustic tau (Guski, Reference Guski1992; Shaw, McGowan, & Turvey, Reference Shaw, McGowan and Turvey1991). For a sound source approaching a listener on a close bypass trajectory, the Doppler shift specifies that the frequency observed at the listening point is slightly higher than that emitted by the source and drops gradually as the source draws near. It then drops dramatically as the source passes the listener and continues to drop gradually as the source recedes. Despite this continual drop in frequency, listeners report a rise in pitch as the source approaches, a phenomenon referred to as the Doppler Illusion (Neuhoff & McBeath, Reference Neuhoff and McBeath1996). The illusion is likely due to the rising intensity that occurs as the source approaches and the integral processing of pitch and loudness (McBeath & Neuhoff, Reference McBeath and Neuhoff2002; Neuhoff & McBeath, Reference Neuhoff and McBeath1996; Neuhoff, McBeath, & Wanzie, Reference Neuhoff, McBeath and Wanzie1999).
Rosenblum, Carello, and Pastore (Reference Rosenblum, Carello and Pastore1987) examined the relative effectiveness of Doppler shift, interaural time differences, and overall intensity change in cuing listeners to the arrival time of a looming sound.Footnote 1 Intensity change was found to be the dominant cue to the point of closest approach for a passing sound source, followed by interaural temporal differences, then the Doppler effect. Performance was best under full cue conditions. However, even under full cue conditions, listeners still exhibited a systematic bias to hear the sound arrive before it actually did. Subsequent work showed that providing explicit feedback on the accuracy of the judgments after each trial diminished but did not eliminate the anticipatory bias (Rosenblum, Gordon, & Wuestefeld, Reference Rosenblum, Gordon and Wuestefeld2000).
There are other potential sources of acoustic information that listeners may use in judging the arrival time of a looming sound, which have yet to be systematically investigated. For example, the ratio of direct to reverberant sound increases as the source draws closer to the listener. The spectral profile of the sound at the listening point also changes due to the decrease in atmospheric damping of high frequencies as the source approaches. Some work has shown greater physiological effects of looming sounds when multiple cues are employed over conditions in which just amplitude changes (Bach, Neuhoff, Perrig, & Seifritz, Reference Bach, Neuhoff, Perrig and Seifritz2009). This implies that listeners are sensitive to these additional cues and may in fact use them in judging arrival time. Other work has shown that the perceived urgency of the sound source can influence judged arrival time, with more urgent sounds being perceived to arrive sooner (Gordon, Russo, & MacDonald, Reference Gordon, Russo and MacDonald2013; Neuhoff, Hamilton, Gittleson, & Mejia, Reference Neuhoff, Hamilton, Gittleson and Mejia2014).
The auditory looming bias is closely linked to the bias to hear rising intensity as changing in loudness more than equivalent falling intensity. If listeners overestimate the approach of a looming sound and loudness change is the dominant cue to approach, then the overestimation of rising loudness may be at the heart of the auditory looming bias. However, if we are to argue that this perceptual bias is an adaptation shaped by evolution, then it should be specific to the conditions under which it would provide the greatest advantage in the natural listening environment over our evolutionary history. To test this prediction, Neuhoff (Reference Neuhoff1998) presented listeners with rising and falling intensity tones and asked them to use a slider to indicate the amount of loudness change they heard in each sound. Rising intensity was consistently heard to change more than equivalent falling intensity, and the louder the range of intensity change presented, the greater the disparity between rising and falling loudness change. In a natural listening environment where closer sounds are louder than equivalent distant sounds, these findings suggest a perceptual priority for looming sounds that are close over those that are more distant. Although the effect occurred with harmonic tones, it did not occur when listeners were presented with broadband noise, a finding that is also consistent with the priorities of localizing moving sound sources in a natural environment. Periodic sounds that have a tonal quality are produced by a wide variety of biological organisms and can act as a reliable marker for the identity of a single source. Although broadband noise can be produced by biological organisms, it can also be produced by widely dispersed nonbiological sources (e.g., wind and rain) for which localization may be less important. Thus, the looming bias is most robust under conditions in which it would be most advantageous to survival (see also McCarthy & Olsen, Reference McCarthy and Olsen2017). Recent magnetoencephalography work supports this hypothesis by showing that strength of sustained magnetic fields over bilateral temporal sensors linearly tracks intensity change in a looming harmonic tone but not in looming broadband noise (Bach, Furl, Barnes, & Dolan, Reference Bach, Furl, Barnes and Dolan2015)
The argument for the looming bias as an adaptation was initially challenged because of the limited number of conditions under which the effect was first demonstrated (Canevet, Scharf, Schlauch, Teghtsoonian, & Teghtsoonian, Reference Canevet, Scharf, Schlauch, Teghtsoonian and Teghtsoonian1999; Neuhoff, Reference Neuhoff1999). However, it has now been replicated under a wide variety of experimental conditions and settings (DiGiovanni & Schlauch, Reference DiGiovanni and Schlauch2007; Grassi, Reference Grassi2010; Grassi & Darwin, Reference Grassi and Darwin2006; Olsen & Stevens, Reference Olsen and Stevens2010; Olsen, Stevens, & Tardieu, Reference 438Olsen, Stevens and Tardieu2010; Ponsot, Meunier, Kacem, Chatron, & Susini, Reference Ponsot, Meunier, Kacem, Chatron and Susini2015; Ponsot, Susini, & Meunier, Reference Ponsot, Susini and Meunier2015; Teghtsoonian, Teghtsoonian, & Canevet, Reference Teghtsoonian, Teghtsoonian and Canevet2005). One of the first studies to replicate the effect used a moving loudspeaker in an outdoor environment (Neuhoff, Reference Neuhoff2001). Blindfolded listeners made terminal egocentric distance estimates of a moving loudspeaker that either approached or receded. The sounding loudspeaker approached from a distance of 12.2 meters and came to rest 6.1 meters from the listener. The receding loudspeaker began directly in front of the listener and stopped at the same distance, 6.1 meters from the listener. Analogous to the rising and falling loudness sounds presented over headphones, the results showed that approaching sounds were perceived to stop closer to the listener than receding sounds, and tones were perceived as stopping closer than noise despite an equal stopping distance from the observation point in all conditions.
The Logic Behind the Adaptation: Error Management Theory
Error Management Theory (EMT) predicts that a wide range of social, cognitive, and perceptual biases have evolved because they increase the likelihood of survival and reproduction. EMT proposes that biases will evolve when judgments are made under conditions of uncertainty, when the decisions have historically had an impact on evolutionary fitness, and when there is an asymmetric cost of making false-positive and false-negative errors (Haselton & Buss, Reference Haselton and Buss2000; Haselton & Nettle, Reference Haselton and Nettle2006; Haselton et al., Reference Doricchi, Merola, Aiello, Guariglia, Bruschini and Gevers2009). All of these conditions are met when a sound source approaches a listener. All perceptual judgments are made under a degree of uncertainty (Mathys et al., Reference Lewkowicz and Minar2014), and predicting the arrival time of a looming sound source may have more uncertainty than many other perceptual judgments. Such decisions could also have life or death consequences and thus undoubtedly have had an impact on evolutionary fitness. Finally, the cost of a false positive (responding too early to a looming sound source by escape or avoidance behaviors) pales in comparison to the potentially deadly cost of a false negative (responding too late). Thus, an organism whose neural architecture represented looming sounds as closer than they actually were would have a selective advantage.
In the context of this discussion, the question is often posed: Wouldn’t it be more advantageous to have veridical perception of a looming sound source and let the listener cognitively decide what appropriate actions should be taken? There are several critical reasons why the answer to this question is “no.” First, let us contrast a hypothetical listener with veridical perception to a listener with a bias to hear looming sounds as closer than they are. Each is tasked with predicting the arrival time of a dangerous looming source. On average, the listener with veridical perception predicts perfectly the arrival time of the source, a point we will call 0 seconds to contact. The listener with the looming bias responds consistently early, for example at an average of 500 msec before contact. However, each listener also has a degree of variability associated with their arrival time judgments, each sometimes responding slightly earlier or later than their respective means. Early judgments are not problematic for either listener, as they provide slightly more time than expected to prepare for the arrival of the source. However, a listener with veridical perception who responds just a half-second late is responding after the source has already arrived. Even if the listener with veridical perception makes the cognitive decision to initiate motor behaviors sooner rather than later in order to prepare for the arrival of the source, their responses are still based on a “veridical” judgment of arrival time that in this instance is a half-second too late and pushes the motor response back by a potentially perilous half-second as well. A late response by the listener with the looming bias still leaves enough time to respond safely.
It is also the case that cognitive resources are limited. If the decision to engage the motor system in the face of a looming sound source were entirely under conscious control, then anyone engaged with a high cognitive load at the time would be disadvantaged in that there would be fewer cognitive resources to devote to the approaching danger. However, a recent study that manipulated cognitive load while participants judged the arrival of a looming sound found just the opposite. McGuire, Gillath, and Vitevitch (2015) asked listeners to judge when a looming sound would reach them while under high cognitive load (memorizing a seven-digit number) or low cognitive load (memorizing a two digit number). They found that the looming bias was significantly larger under high cognitive load. That listeners respond sooner rather than later under high cognitive load suggests that the bias to hear sounds as closer than actual is an automatic process that requires little effortful cognitive processing. Rather than (or at least in addition to) a “decision to respond early,” the looming bias appears to be a perceptual phenomenon that has evolved to keep organisms safe. This finding is consistent with work in representational momentum and boundary extension that also shows an increase in the magnitude of perceptual bias under high cognitive load (Hayes & Freyd, Reference Hayes and Freyd2002; Hubbard, Hutchison, & Courtney, Reference Hubbard, Hutchison and Courtney2010; Intraub, Daniels, Horowitz, & Wolfe, Reference Intraub, Daniels, Horowitz and Wolfe2008).
Converging Evidence for the Looming Bias Adaptation
Behavioral evidence. A wide range of behavioral research has now demonstrated that looming sounds are treated with priority by the auditory system and that listeners demonstrate a consistent underestimation of distance and arrival time when faced with a looming sound (Neuhoff, Reference Neuhoff1998, Reference Neuhoff2001, Reference Neuhoff2016; Neuhoff et al., Reference Lewkowicz and Minar2014; Neuhoff, Long, & Worthington, Reference Neuhoff, Long and Worthington2012; Riskind, Kleiman, Seifritz, & Neuhoff, Reference Riskind, Kleiman, Seifritz and Neuhoff2014; Rosenblum, Wuestefeld, & Saldana, Reference Rosenblum, Wuestefeld and Saldana1993; Rosenblum et al., Reference Rosenblum, Carello and Pastore1987; Rosenblum et al., Reference Rosenblum, Gordon and Wuestefeld2000). The prioritization of looming sounds is present in infancy. Infants as young as four months old show significant differential responding to looming versus receding sounds by exhibiting defensive avoidance responses to looming sounds that do not occur with equivalent receding sounds (Freiberg, Tually, & Crassini, Reference Freiberg, Tually and Crassini2001). By six months, infants have better discrimination abilities for looming versus receding sounds (Morrongiello, Hewitt, & Gotowiec, Reference Morrongiello, Hewitt and Gotowiec1991).
Sex differences have also been demonstrated in the looming bias, with women tending to perceive auditory arrival time as occurring sooner than do men (Neuhoff, Planisek, & Seifritz, Reference Neuhoff, Planisek and Seifritz2009; Schiff & Oldak, Reference Schiff and Oldak1990). In the study of the evolution of behavior, sex differences can be a key piece of evidence for behavioral adaptations. To the extent that men and women have faced different challenges to survival and reproduction over our evolutionary history, we should expect slightly different behavioral adaptations to have evolved to deal with these challenges (Buss, Reference Buss1995; Byrd-Craven & Geary, Reference Byrd-Craven and Geary2007).
Although judging the arrival time of a looming sound is essentially a spatial transformation task, the sex difference in the perception of looming sounds is likely not the product of the well-known male advantage in spatial transformation (Kimura, Reference Kimura1999; Silverman, Choi, & Peters, Reference Silverman, Choi and Peters2007; Voyer, Voyer, & Bryden, Reference Voyer, Voyer and Bryden1995). If it were, we would expect sex differences for the perception of sounds that move both toward and away from the listener. However, Neuhoff et al. (Reference Bach, Neuhoff, Perrig and Seifritz2009) presented male and female listeners with both approaching and receding sounds that stopped equidistant from the listening point. Women perceived the looming sounds to be significantly closer than did men. However, there was no difference between the male and female judgments for the receding sounds. If sex differences in the perception of looming sounds were simply the result of more accurate spatial transformation abilities by men, then we should expect those same differences to occur for receding sounds.
That there were no sex differences in the perceived distance of receding sounds may highlight a particular differential environmental challenge that men and women have faced over our evolutionary history – dealing with an approaching threat. Some of the most reliable differences between males and females are in physical strength, running speed (Nicolay & Walker, Reference Nicolay and Walker2005; Whipp & Ward, Reference Whipp and Ward1992). Both of these characteristics could be crucial in dealing with a dangerous looming sound source. Thus, women would stand to benefit from a larger margin of safety in anticipating the arrival of a looming source. Essentially, those least well prepared to engage a dangerous looming sound source should have the greatest auditory looming bias.
Evidence to support this hypothesis comes from work showing that the magnitude of the looming bias is negatively correlated with strength and physical fitness (Neuhoff et al., Reference Neuhoff, Long and Worthington2012). Individual within-sex correlations were also significant, suggesting that the sex differences in the looming bias may be largely due to differences in strength and fitness rather than biological sex per se. The magnitude of the looming bias is also modulated by factors such as affect, anxiety, depression, and even schizophrenia (Bach, Buxtorf, Strik, Neuhoff, & Seifritz, Reference Bach, Buxtorf, Strik, Neuhoff and Seifritz2011; Ferri, Tajadura-Jimenez, Valjamae, Vastano, & Costantini, Reference Ferri, Tajadura-Jimenez, Valjamae, Vastano and Costantini2015; Neuhoff et al., Reference Lewkowicz and Minar2014; Tajadura-Jimenez, Valjamae, Asutay, & Vastfjall, Reference Tajadura-Jimenez, Valjamae, Asutay and Vastfjall2010)
Comparative Evidence. The argument that a given human behavior is an evolutionary adaptation can be made stronger if the behavior is also found in a closely related species. Thus, if the human bias to perceive looming sounds as closer than actual is an adaptation, then we might expect to observe the bias in related species that have faced similar evolutionary challenges. Ghazanfar, Neuhoff, and Logothetis (Reference Ghazanfar, Neuhoff and Logothetis2002) presented rhesus monkeys with the same simulated looming and receding sounds that were presented to human listeners in the work by Neuhoff (Reference Neuhoff1998). They found a preferential orienting response to looming sounds over receding sounds that matched the pattern of results found in humans. As with humans, the bias occurred for harmonic tones but not for broadband noise. The concomitant neural activity that underlies the perceptual priority for looming sounds shows the same directional asymmetry (Hall & Moore, Reference Hall and Moore2003). Activity in the lateral belt auditory cortex of monkeys is stronger with looming than with receding sounds, and the processing of looming stimuli appears to involve an interaction between the auditory cortex and the superior temporal sulcus that is not apparent with equivalent receding stimuli (Maier, Chandrasekaran, & Ghazanfar, Reference Maier, Chandrasekaran and Ghazanfar2008; Maier & Ghazanfar, Reference Maier and Ghazanfar2007).
Physiological Evidence. Support for the hypothesis that any perceptual trait is an evolutionary adaptation can be strengthened by identifying specific physiological mechanisms that support the trait. Seifritz et al. (Reference Seifritz, Neuhoff, Bilecen, Scheffler, Mustovic and Schachinger2002) used neuroimaging to examine the neural processing of looming sounds in comparison with receding sounds. They found that looming sounds preferentially activate a distributed neural network that is known to subserve auditory motion perception, attention, and motor planning. These findings support an earlier hypothesis by Guski (Reference Guski1992) that suggested that the function of the auditory system in the face of a looming sound is to provide input into a decision about the appropriate motor behaviors in which to engage. Faced with a looming sound, the auditory system provides advanced warning as evidenced by enhanced autonomic responses. Looming sounds when compared with equivalent receding sounds produce stronger amygdala activation, greater skin conductance, more robust pupil dilation, enhanced phasic alertness, and greater emotional arousal (Bach et al., Reference Bach, Schachinger, Neuhoff, Esposito, Di Salle, Lehmann and Seifritz2008; Bach et al., Reference Bach, Neuhoff, Perrig and Seifritz2009; Ferri et al., Reference Ferri, Tajadura-Jimenez, Valjamae, Vastano and Costantini2015; Fletcher et al., Reference Fletcher, Nicholas, Shakespeare, Downey and Golden2015; Tajadura-Jimenez et al., Reference 441Peyrin, Michel and Schwartz2010).
Visual Looming
If the auditory looming bias provides advanced warning of looming objects, the visual system provides a more accurate means of dealing with the source on approach. The anticipatory looming bias that occurs in audition is significantly diminished in vision, and observers are significantly more accurate in making visual time-to-arrival judgments than they are when making equivalent auditory judgments (DeLucia, Preddy, & Oberfeld, Reference DeLucia, Preddy and Oberfeld2015; Schiff & Oldak, Reference Schiff and Oldak1990). However, the evolutionary implications of impending collision are still present in vision. It should also be noted that many of the studies that show an underestimation of visual arrival time introduce uncertainty by occluding the final approach of the object. In these experiments, the object first approaches then disappears before reaching the observer, and observers are asked to judge when the object would have reached them had it not disappeared. Performance increases significantly when viewers can see the entire approach of the object as is evidenced by our ability to interact with objects in the real world successfully (e.g., catching a ball; McBeath, Shaffer, & Kaiser, 1995; Shaffer & McBeath, Reference Scharine and McBeath2002; Wang, McBeath, & Sugar, Reference Wang, McBeath and Sugar2015b). In audition, the anticipatory looming bias remains even when listeners can hear the full approach of the sound source (Neuhoff et al., Reference Doricchi, Merola, Aiello, Guariglia, Bruschini and Gevers2009; Neuhoff et al., Reference Neuhoff, Long and Worthington2012; Neuhoff et al., Reference Lewkowicz and Minar2014).
Under some conditions, there are also sex differences in judgments of visual arrival time that mirror those in audition. Females tend to show greater underestimation of arrival time than males (Hancock & Manser, Reference Hancock and Manser1997; Manser & Hancock, Reference Manser and Hancock1996; McLeod & Ross, Reference McLeod and Ross1983; Montgomery, Kusano, & Gabler, Reference Montgomery, Kusano and Gabler2014; Schiff & Oldak, Reference Schiff and Oldak1990). Moreover, an incredibly wide variety of species ranging from insects to humans exhibit defensive responses when presented with visually looming objects (W. Ball & Tronick, Reference Ball and Tronick1971; Bower, Broughto, & Moore, Reference Bower, Broughto and Moore1971; King, Dykeman, Redgrave, & Dean, Reference King, Dykeman, Redgrave and Dean1992; Lima, Blackwell, DeVault, & Fernandez-Juricic, Reference Lima, Blackwell, DeVault and Fernandez-Juricic2015; Sato & Yamawaki, Reference Sato and Yamawaki2014; Schiff, Reference Schiff1965; Schiff, Caviness, & Gibson, Reference Schiff, Caviness and Gibson1962; Yilmaz & Meister, Reference Yilmaz and Meister2013; Zurek, Perkins, & Gilbert, Reference Zurek, Perkins and Gilbert2014). Like looming sounds, visually looming objects also prime the human motor system for action and activate the autonomic nervous system (Low, Lang, Smith, & Bradley, Reference Low, Lang, Smith and Bradley2008; Skarratt, Cole, & Gellatly, Reference Skarratt, Cole and Gellatly2009; Skarratt, Gellatly, Cole, Pilling, & Hulleman, Reference Skarratt, Gellatly, Cole, Pilling and Hulleman2014). All of these factors, including the more accurate judgments of visual time-to-arrival, provide evidence for an evolutionary role in shaping our responses to looming visual stimuli.
Cues to Visual Looming
As an object approaches an observer,. the image cast on the retina dilates. This optical dilation was one of the first investigated sources of information in judging the arrival time of a looming visual object. The inverse of the rate of dilation (called optical tau) can specify time-to-arrival under some conditions, and observers have been shown to be sensitive to this information (Kaiser & Mowafy, Reference Kaiser and Mowafy1993; Lee, Reference Lee1976; Lee & Reddish, Reference Lee and Reddish1981; Regan & Hamstra, Reference Regan and Hamstra1993; Todd, Reference Todd1981). Tau was initially proposed as a candidate for completely explaining how observers judge visual time-to-arrival (Lee, Reference Lee1976; Savelsbergh, Whiting, & Bootsma, Reference Savelsbergh, Whiting and Bootsma1991; Turvey & Carello, Reference Turvey and Carello1986). However, this version of tau is limited in that it breaks down when looming objects do not have a constant acceleration, are not symmetrical, and are not on a collision course with the observer (Tresilian, Reference Tresilian1999). Optical tau alone also fails to account for how observers can predict the arrival of very small objects or objects that undergo short falls from gravity (Gray & Regan, Reference Gray and Regan1998; Tresilian, Reference Tresilian1993). Subsequent work showed that optical tau is just one of a number of available cues. Several other dynamic tau variables, heuristics, and even pictorial cues such as image size can be used to estimate arrival time (DeLucia, Reference DeLucia1991, Reference DeLucia, Hecht and Savelsbergh2004; Kaiser & Mowafy, Reference Kaiser and Mowafy1993; Tresilian, Reference Tresilian1993, Reference Tresilian1994). For a review, see Tresilian (Reference Tresilian1999).
Bias for Looming Visual Motion
Despite the relatively accurate perception of visual arrival time under full viewing conditions, there are nonetheless well-documented asymmetries in the perceptual processing of looming versus receding motion. For example, it has been known more than 100 years ago that the motion aftereffect for looming motion persists significantly longer than that for equivalent receding motion (Scott, Lavender, McWhirt, & Powell, Reference Scott, Lavender, McWhirt and Powell1966; Wohlgemuth, Reference Wohlgemuth1911). More recent work has shown that the perceptual asymmetry in perceiving looming and receding develops within the first few months of life (Shirai et al., Reference Doricchi, Merola, Aiello, Guariglia, Bruschini and Gevers2009; Shirai, Kanazawa, & Yamaguchi, Reference Shirai, Kanazawa and Yamaguchi2004, Reference Shirai, Kanazawa and Yamaguchi2006). Observers also perceive looming motion as faster than receding motion, detect the onset of looming motion sooner, and show better detection of changes in looming stimuli than in receding ones (K. Ball & Sekuler, Reference Ball and Sekuler1980; Bex & Makous, Reference Bex and Makous1997; Geesaman & Qian, Reference Geesaman and Qian1996; Petersik & Thiel, Reference Petersik and Thiel2010). Under conditions of uncertainty, viewers show a predisposition to perceive objects as looming rather than receding. For example, C. F. Lewis and McBeath (Reference Lewis and McBeath2004) presented viewers with a 3D bistable apparent motion display that could be perceived as either looming or receding. They found that viewers showed a significant bias to perceive the display as looming.
The emotional characteristics of a looming visual stimulus can influence perceived arrival time. Looming threatening stimuli (spiders and snakes) are perceived to arrive more quickly than nonthreatening stimuli (bunnies and butterflies), and the ratings of fear of the stimulus are correlated with perceived arrival time (Vagnoni, Lourenco, & Longo, Reference Vagnoni, Lourenco and Longo2012, Reference Vagnoni, Lourenco and Longo2015). The more fearful the viewer, the sooner the object is perceived to have arrived. Other threatening stimuli (e.g., threatening faces) show similar effects (Brendel, DeLucia, Hecht, Stacy, & Larsen, Reference Brendel, DeLucia, Hecht, Stacy and Larsen2012). However, the notion that “threat” alone is the critical factor at work here is likely an oversimplification. More recent work has also implicated the role of arousal and stimulus complexity. For example, highly arousing positive stimuli (erotica and money) are perceived to arrive as soon as fearful stimuli, and pictorial stimuli, in general, are perceived to arrive sooner that simple colored rectangles (Brendel, Hecht, DeLucia, & Gamer, Reference Brendel, Hecht, DeLucia and Gamer2014).
Looming and receding visual stimuli also have asymmetrical effects on attention. Objects that approach an observer attract attention and are treated with priority. For example, in a visual search task, increasing the number of distractors in a search for a receding target significantly increases search time. However, the same increase in the number of distractors has no effect on search time for looming targets (Takeuchi, Reference Takeuchi1997). This suggests that detecting looming stimuli occurs automatically. Subsequent work has shown that looming, but not receding, objects capture attention even when they are not relevant to the task at hand (Franconeri & Simons, Reference Franconeri and Simons2003). The attentional capture effects of looming stimuli appear to be subserved by covert attentional mechanisms that do not require effortful cognitive processing (Kahan, Colligan, & Wiedman, Reference Kahan, Colligan and Wiedman2011; J. E. Lewis & Neider, Reference Lewis and Neider2015). The evolutionary implications of the priority for looming objects are underscored by the finding that the effects of looming stimuli are magnified when the stimuli are on a collision path with the observer and are not dependent on the sudden onset of motion (Lin, Franconeri, & Enns, Reference Lin, Franconeri and Enns2008; von Muhlenen & Lleras, Reference von Muhlenen and Lleras2007).
Bias for Receding Visual Motion?
Despite the wealth of data demonstrating a perceptual bias for looming visual motion, there are a number of apparently conflicting studies that find a bias for receding motion. For example, observers show better sensitivity as measured by a discrimination task for a contracting pattern of dots than an expanding pattern of dots (Edwards & Badcock, Reference Edwards and Badcock1993; Edwards & Ibbotson, Reference Edwards and Ibbotson2007). Viewers have also demonstrated better sensitivity to acceleration when viewing receding versus looming dot patterns (Mueller & Timney, Reference Mueller and Timney2014). Some researchers have suggested that the better discrimination for these receding optic flow fields is related to postural stability, where falling backward (which creates receding optic flow) is a greater danger than falling forward (Edwards & Ibbotson, Reference Edwards and Ibbotson2007; Mueller & Timney, Reference Mueller and Timney2014; but see Holten, Donker, Stuit, Verstraten, & van der Smagt, Reference Holten, Donker, Stuit, Verstraten and van der Smagt2015). Other work suggests that the direction of asymmetry is also dependent on the speed of the optic flow pattern, which varies across studies (Naito, Sato, & Osaka, Reference Naito, Sato and Osaka2010).
Variability in the nature of the tasks employed may also in part be responsible for the conflicting results. The majority of the studies that find an advantage in the perception of receding stimuli use optic flow fields that are composed of dots. The analogous real-world looming condition would be moving through the world without any indication that a collision is imminent. On the other hand, many of the studies that show a perceptual advantage for looming present a target stimulus that appears to approach the observer on a collision course. Given these differences, both the “postural stability” and the “looming threat” hypotheses may have merit depending on the specific circumstances. Another consideration is that the discrimination tasks typically used in studies that find an advantage for receding stimuli may require more effortful cognitive processing than, for example, visual search or time-to-arrival where attention is captured automatically or where a defensive motor response is appropriate (e.g., Franconeri & Simons, Reference Franconeri and Simons2003; King et al., Reference King, Dykeman, Redgrave and Dean1992; J. E. Lewis & Neider, Reference Lewis and Neider2015; Lin et al., Reference Dodds, van Belle, Peers, Dove, Cusack and Duncan2008). Because the visual features of a looming object are thought to be processed without depleting effortful cognitive resources (Kahan et al., Reference 375Bourlon, Duret, Pradat-Diehl, Azouvi, Loeper-Jeny and Merat-Blanchard2011; J. E. Lewis & Neider, Reference Lewis and Neider2015), looming objects may impact discrimination and visual search differentially. Looming stimuli activate motor defense mechanisms and responses of the autonomic nervous system (King et al., Reference King, Dykeman, Redgrave and Dean1992; Low et al., Reference Dodds, van Belle, Peers, Dove, Cusack and Duncan2008; Skarratt et al., Reference Doricchi, Merola, Aiello, Guariglia, Bruschini and Gevers2009; Skarratt et al., Reference Lewkowicz and Minar2014). This may facilitate the automatic responses to looming objects that do not require effortful processing but interfere with effortful cognitive judgments such as discrimination. Essentially, the different tasks may differentially invoke either visuo-motor or visuo-cognitive systems and account for the conflicting findings (Goodale & Milner, Reference Goodale and Milner1992; Tresilian, Reference Tresilian1995).
Multisensory Integration of Looming Stimuli
Despite the fact that most of the research conducted on the perception of looming objects has been unimodal in nature, many looming objects simultaneously produce both visual and auditory cues as they approach. Some work has examined how the presence of both visual and auditory information influences the perception of looming objects and how this multimodal information is integrated. Other work has hypothesized that the information contained in a looming object is “modality-neutral.” In other words, regardless of modality, the tau variable information for an approaching source can specify time-to-arrival. If the system is sensitive to this underlying change in information over time, then in theory, the modality with which the approach is perceived should have little effect on the perceived time-to-arrival (Gordon & Rosenblum, Reference Gordon and Rosenblum2005).
However, despite the potential equivalence of information in the two modalities, observers show stark differences in how they use auditory versus visual information in judging arrival time (DeLucia et al., Reference DeLucia, Preddy and Oberfeld2015; Schiff & Oldak, Reference Schiff and Oldak1990). The visual and auditory systems have evolved to solve quite different evolutionary problems in dealing with looming objects. Guski (Reference Guski1992) suggested a kind of “handshaking” that occurs between the two systems, in which audition acts as an advanced warning system that provides information for a categorical decision about engaging appropriate motor behaviors (e.g., either evasive or engaging in visual tracking). The visual system can then provide the more accurate estimates of arrival time that can be used to deal appropriately with the looming object. The “warning system” hypothesis for audition is supported by work that examines time-to-arrival judgments under auditory only, visual only, and audiovisual conditions. A number of these studies have shown that performance in predicting the arrival time of a looming object with both visual and auditory information does not significantly differ from performance when only visual information is available (DeLucia et al., Reference DeLucia, Preddy and Oberfeld2015; Hofbauer et al., Reference Bartolomeo, Urbanski, Chokron, Chainay, Moroni and Siéroff2004; Schiff & Oldak, Reference Schiff and Oldak1990; Zhou, Yan, Liu, Li, & Xie, Reference Zhou, Yan, Liu, Li and Xie2007).
The integration of auditory and visual information is present in infants as early as five months. When presented with matched and mismatched auditory and visual looming and receding signals, infants show greater attention to the stimuli that are matched in direction of travel (Walker-Andrews & Lennon, Reference Walker-Andrews and Lennon1985). As might be expected, they also show greater attention to looming versus receding stimuli. Work with rhesus monkeys shows a similar strong orienting preference for coincident visual and auditory looming stimuli but no analogous response for coincident stimuli that were receding. Consistent with previous work in auditory looming, the orienting preference effect occurred only with tonal auditory stimuli and not with broadband noise (Maier, Neuhoff, Logothetis, & Ghazanfar, Reference Maier, Neuhoff, Logothetis and Ghazanfar2004; Maier et al., Reference Dodds, van Belle, Peers, Dove, Cusack and Duncan2008). Preferential processing and integration of looming versus receding multisensory stimuli also occurs in adult humans and is supported by recent behavioral, EEG, and fMRI experiments (Cappe, Thelen, Romei, Thut, & Murray, Reference Cappe, Thelen, Romei, Thut and Murray2012; Cappe, Thut, Romei, & Murraya, Reference Cappe, Thut, Romei and Murraya2009; Maier et al., Reference Dodds, van Belle, Peers, Dove, Cusack and Duncan2008; Ogawa & Macaluso, Reference Ogawa and Macaluso2013; Tyll et al., Reference Rastelli, Tallon-Baudry, Migliaccio, Toba, Ducorps and Pradat-Diehl2013).
The processing advantage and environmental importance of looming stimuli are further evidenced when the perception of multimodal looming and receding stimuli are examined under congruent and incongruent conditions. Under congruent conditions, both the auditory and visual stimuli move in the same direction, either toward or away from the observer. Under incongruent conditions, the auditory and visual stimuli move in opposite directions. If listeners are asked to judge the direction of the moving sound and ignore the visual stimulus, performance is better in the presence of receding stimuli. In essence, observers can more easily ignore the incongruent receding visual stimulus. This indicates that looming visual stimuli show stronger visual capture effects than receding visual stimuli (Harrison, Reference Harrison2012). Similar work has shown that varying the congruency of a visual stimulus has little effect on detection rates for looming sounds (where accuracy is generally high). However, a congruent versus an incongruent visual stimulus does increase the detection of receding auditory stimuli (Liu, Mercado, & Church, Reference Liu, Mercado and Church2011).
Looming auditory and visual objects have also been shown to influence tactile perception. For example, a looming visual object that approaches the face increases tactile sensitivity at the predicted time and location that the object would contact the face (Clery, Guipponi, Odouard, Wardak, & Ben Hamed, Reference Clery, Guipponi, Odouard, Wardak and Ben Hamed2015). Similar tactile effects are obtained with looming sounds (Teneggi, Canzoneri, di Pellegrino, & Serino, Reference Teneggi, Canzoneri, di Pellegrino and Serino2013). Canzoneri, Magosso, and Serino (Reference Canzoneri, Magosso and Serino2012) found that a sound moving toward an observer’s hand speeded up the processing of a tactile stimulus at the hand when the sound was within the boundaries of peripersonal space representation. The effect was significantly stronger for looming sounds than for receding ones (but see Finisguerra, Canzoneri, Serino, Pozzo, & Bassolino, Reference Finisguerra, Canzoneri, Serino, Pozzo and Bassolino2015).
Conclusions
Looming objects are salient and behaviorally relevant stimuli that are perceptually and neurally processed with priority when compared with equivalent receding objects. Looming stimuli also preferentially activate the autonomic nervous system and the motor system. They bring about differential emotional, cognitive, and defensive responses. Although this perceptual anisotropy can sometimes create distortions in perceived egocentric spatial relations, they are distortions that over time have enhanced the probability of survival and reproduction. Thus, these perceptual biases have been favored by evolution.


