
Political polls have staggered from embarrassment to embarrassment in recent years, with substantial errors in the polls before every major electoral event in Britain and the US since at least 2012. This perception of poor and declining performance has led many to ask whether political polling has a future (Cassino Reference Cassino2016; Cowley Reference Cowley2017; Tao and Reis-Smart Reference Tao and Reis-Smart2014; Zukin Reference Zukin2015). This review examines how polls have performed in recent years and the causes of polling error.
Firstly, we outline the challenges facing contemporary polling, particularly declining response rates and the rise of non-probability internet samples. Secondly, we examine the evidence for how polling’s performance has changed over time. Thirdly, we review different sources of bias in polls. Fourthly, we look at some recent and prominent polling misses and discuss the evidence for why these polls went wrong. Finally, we look at the future of polling and possible alternative ways of measuring public opinion, such as social media.
Our review uncovers several myths about modern polling. Although modern polling faces many challenges, our review finds no evidence that polling has become systematically worse over time. However, there is strong evidence that polling has always had higher rates of error than naive calculations would imply. Similarly, despite many claimed instances, we find little evidence that polling error is often caused by respondents lying about who they will vote for (so-called ‘shy’ voters). Instead, we find that the most common errors appear to be ones of representativeness (particularly in terms of representing politically disengaged respondents), large numbers of undecided voters splitting in one direction, and in some cases miscalibrated turnout models and late swings when voters change their minds at the last minute.
The challenge of polling in the twenty-first century
The cornerstone of survey research is probability sampling (Kish Reference Kish1965). The statistical properties of random samples allow survey researchers to draw inferences about population-level characteristics and scientifically estimate the uncertainty of those inferences. Political surveys following probability sampling methods generally rely on either address-based face-to-face surveys or random digit dialling (RDD) telephone surveys. The primary challenge for both of these methods is the decline in the willingness of people to participate in surveys.
Although response rates to most commercial surveys are secret, we know that response rates to face-to-face and telephone surveys have declined precipitously from academic and government surveys. An example of declining face-to-face response rates comes from the British Election Study (BES). The response rate for the first BES in 1963 was 79.4 per cent (Butler and Stokes Reference Butler and Stokes1974). This dropped to 55.9 per cent for the 2015 BES (Fieldhouse et al. Reference Fieldhouse, Green, Evans, Schmitt, van der Eijk, Mellon and Prosser2015).Footnote 1 In addition the cost of achieving even these lower response rates has greatly increased. The 1963 BES interviewed nearly 50 per cent more respondents per day than the 2015 BES. Combined with an increase in labour costs, the financial burden of high-quality face-to-face surveys has increased enormously in the past 50 years.
The expensive and time-consuming nature of face-to-face surveys has meant that the bulk of probability sample polling has moved to telephone in recent decades. Response rates for telephone polls declined even more dramatically than face-to-face surveys. Richard Curtin, Stanley Presser and Eleanor Singer (2005) show the telephone-based Survey of Consumer Attitudes (SCA) response rate declined steadily from 1979 to 1996, before the advent of caller ID technology accelerated this trend, with the average annual drop in response rate doubling between 1996 and 2003. In total, the SCA response rate fell from 72 per cent in 1979 to 48 per cent in 2003. Likewise, a series of studies by Pew show response rates declining from 36 per cent in 1997 to just 9 per cent in 2016 (Keeter et al. Reference Keeter, Hatley, Kennedy and Lau2017). Compounding the problems of low response rates is the decreasing proportion of the population with landline telephones, and the corresponding rise of the ‘mobile phone only’ population and uncertainty over how best to incorporate mobile numbers into telephone sampling frames (Lavrakas et al. Reference Lavrakas, Shuttles, Steeh and Fienberg2007).
At the same time as traditional survey modes experienced serious drops in response rates, a new survey mode emerged in the form of internet surveys. Internet surveys revolutionized political polling, providing a rapid and relatively cheap means of conducting surveys. The growth of internet surveys has been phenomenal. Internet polling arrived in the UK in 2001, when YouGov published a single poll before the 2001 election. Only 14 years later, two-thirds of the final 2015 polls were conducted online (Sturgis et al. Reference Sturgis, Baker, Callegaro, Fisher, Green, Jennings, Kuha, Lauderdale and Smith2016). Although probability-based internet panels exist (which are generally recruited offline through traditional survey methods), the vast majority of internet polling is conducted via non-probability panels, which recruit respondents by a variety of means, including advertising and referrals from existing participants (Baker et al. Reference Baker, Brick, Bates, Battaglia, Couper, Dever, Gile and Tourangeau2013) to take surveys for particular companies. Polls are then conducted by drawing smaller samples from these larger access panels, which are weighted to match population-level demographic characteristics.
The rise of non-probability internet surveys has generated a large literature detailing the potential pitfalls of conducting surveys online.Footnote 2 The most obvious concern about non-probability internet surveys is that respondents self-select into joining an access panel and are likely to be different from the population on a number of important characteristics. The most obvious difference is that people who do not use the internet, such as older voters, will be excluded from internet sampling frames (Couper Reference Couper2000). Other differences go beyond demographic characteristics. For political polling, a key problem is that respondents in non-probability panels are generally more politically engaged than the general population (Kennedy et al. Reference Kennedy, Mercer, Keeter, Hatley, McGeeney and Gimenez2016; Malhotra and Krosnick Reference Malhotra and Krosnick2007). Concerns have also been raised about the small number of respondents who take a large number of surveys and are often members of multiple access panels – so-called ‘professional’ respondents – who participate in surveys for (generally meagre) compensation and are known to pay less attention to the surveys in order to finish quickly (‘speeding’), resulting in lower-quality survey responses (Hillygus et al. Reference Hillygus, Jackson and Young2014; Vonk et al. Reference Vonk, van Ossenbruggen and Willems2006).
More fundamentally, unlike probability samples, where the known probability of inclusion in a particular sample can be used as the basis for drawing population-level inferences, the reasons why some people self-select into internet access panels are generally unknown, and largely unknowable. Simply treating non-probability samples in the same way as probability samples has no statistical basis, and methods for correcting demographic imbalances and calculating measures of uncertainty are likely to be invalid. An influential report by the American Association for Public Opinion Research (AAPOR) on non-probability samples stated they ‘consider methods for collecting data and producing estimates without a theoretical basis as not being appropriate for making statistical inferences’ (Baker et al. Reference Baker, Brick, Bates, Battaglia, Couper, Dever, Gile and Tourangeau2013).
Is polling actually getting worse?
Given recent prominent polling misses and the methodological challenges that have arisen in the past couple of decades, the idea that polling is in crisis seems plausible. However, polling misses are nothing new. The most famous polling miss in history occurred more than 80 years ago – in 1936 – when the Literary Digest poll underestimated Roosevelt’s lead over Landon by 38 points (Squire Reference Squire1988). In Britain, significant polling misses occurred in 1970 and 1992 as well as the more recent 2015 miss. The 1970 miss exhibited similar levels of error to the 2015 polling miss and the 1992 miss was worse than either 1970 or 2015 (Sturgis et al. Reference Sturgis, Baker, Callegaro, Fisher, Green, Jennings, Kuha, Lauderdale and Smith2016).
Nevertheless, it could still be the case that past misses were aberrations from otherwise more accurate polls and that more recent misses are more representative of the current state of polling accuracy. Whether this is the case is an empirical question. Drawing on a data set of 26,971 polls covering 338 election in 45 countries over more than 70 years, Will Jennings and Christopher Wlezien (2018) find the average level of error in polls has remained remarkably stable over time, and if anything, has decreased marginally.
Given the challenges facing polling, it might seem surprising that polls have not become less accurate. The explanation for this is three-fold: (1) historical polling faced challenges of its own and often fell well short of the probability sample ideal; (2) declining response rates have not necessarily translated into increasing non-response bias; (3) internet polling has used increasingly sophisticated methods to draw and adjust samples, and recent work has put non-probability samples on a firmer theoretical footing. We elaborate on these points below.
The Myth of the Golden Age of Polling
Although contemporary polling often falls short of the probability sample ideal, the same is also true of many polls in the past. In Britain, prior to the 1970 polling miss, most political polls were conducted using probability sampling methods. The downside of this otherwise robust approach is that the length of fieldwork required to complete the poll meant polls could miss late shifts in party support in the run-up to the election. Missing this late swing was one of the key reasons for the 1970 polling miss (Abrams Reference Abrams1970). Consequently British pollsters switched to the quicker – but less rigorous – method of quota sampling (Moon Reference Moon1999). Quota sampling is a non-probability method where interviewers try to interview particular types of people until they meet demographic target quotas. As with other non-probability methods, quota sampling has no grounding in statistical theory and is likely to suffer from non-random error. A particular problem with quota samples is availability bias – if a relevant attribute such as vote choice is correlated with being available to take the survey within demographic groupings (i.e. being at home when the interviewer calls), then quota samples are likely to give incorrect answers. Inaccurate quotas and availability bias were suggested as major factors in the 1992 polling miss (Market Research Society Working Party 1994; Moon Reference Moon1999).
Following the 1992 polling miss, most British pollsters began to switch to telephone polls. British pollsters were slow to adopt RDD methods for a number of logistical reasons, not least the non-standardized format of telephone numbers in the UK and the absence of public information about the range of phone numbers in use (Nicolaas and Lynn Reference Nicolaas and Lynn2002). Ultimately, British pollsters adopted phone methods just as pollsters elsewhere began to worry about telephone response rates. The lack of public data makes response rates difficult to assess but the available information suggests similar response rates to US polls: Gerry Nicolaas and Peter Lynn (2002) report response rates of 35 per cent and 36 per cent for two RDD surveys carried out in 1999. Unsurprisingly, given these problems, the switch to telephone polls in Britain did not increase polling accuracy and the level of error remained similar to the quota sampling era.
In the US, RDD quickly became the dominant survey mode following its introduction in the 1970s. Although the American telephone infrastructure made RDD sampling easier than in Britain, RDD polls were not unproblematic. A perennial concern is coverage. Although landline telephone coverage reached 90 per cent of US households by the 1980s, and was even higher in Europe, not having a telephone in the household persistently correlates with geography and demography (Lavrakas Reference Lavrakas2008). Given coverage problems, and the fact that the period of both high telephone coverage and high response rates was fleeting, it is not surprising that US polling has often been inaccurate. The Jennings and Wlezien (Reference Jennings and Wlezien2018) data show that, despite using theoretically superior probability sampling methods, the average level of polling error for US presidential elections is almost identical to the average error in British elections, and is higher for US legislative elections.
Non-response Rates vs. Non-response Bias
Despite massive declines in response rates, the simplest explanation for why polls are not getting less accurate is that non-response rates are not the same as non-response bias. Although low response rates increase the risk of non-response bias, numerous studies show that lower response rates do not necessarily lead to higher survey errors (Curtin et al. 2000, Reference Curtin, Presser and Singer2005; Keeter et al. Reference Keeter, Kennedy, Dimock, Best and Craighill2006; Miller et al. Reference Miller, Groves and Presser2000). Non-response bias is not a function of the response rate, but of the interaction between relevant characteristics and the likelihood of responding to a survey.
One important factor affecting non-response bias is the survey topic. Many studies show that respondents to surveys about politics tend to be more politically interested (Groves et al. 2000, Reference Groves, Presser and Dipko2004; Keeter et al. Reference Keeter, Kennedy, Dimock, Best and Craighill2006; Tourangeau et al. Reference Tourangeau, Groves and Redline2010). As we discuss in more detail later, over-sampling politically interested respondents can lead to large errors in vote shares estimates (Mellon and Prosser Reference Mellon and Prosser2017a). What is less clear in the literature is how this type of non-response bias has changed over time.
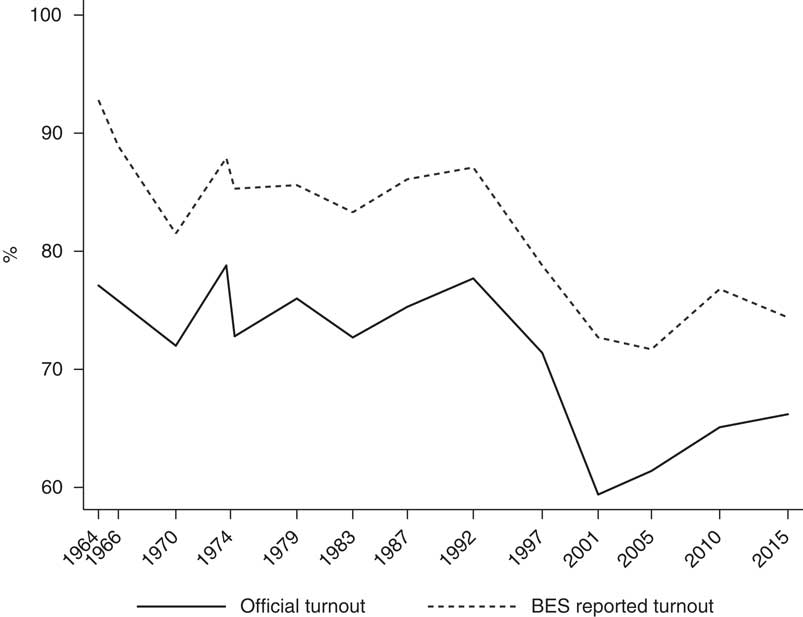
To examine this question further, we track political interest non-response bias over time by examining levels of reported turnout in the BES post-election face-to-face surveys. As Figure 1 clearly shows, although the BES is the highest-quality political survey conducted in Britain, in every instance reported turnout was substantially higher than the official level of turnout at the election.Footnote 3 This is partly because people over-report voting, a problem we return to later. But even after accounting for misreporting by validating responses against the marked register, BES respondents are more likely to have voted than the general population. This is a clear indication of a response bias pattern whereby more politically engaged people respond to BES surveys at higher rates. Importantly, this pattern is true for the entire span of the BES – indeed the largest gap between actual and reported turnout occurred in the first BES in 1964. This suggests that non-response bias is a constant in political polling, and is not something that only affects recent polls (although this is, of course, only a single case study).
Official vs. BES Reported Turnout, 1964–2015
Internet Panels Come of Age
Much like quota sampling methods, non-probability internet polls often work better in practice than they do in theory. Numerous studies show non-probability internet panels performing as well as probability sample methods (Ansolabehere and Schaffner Reference Ansolabehere and Schaffner2014; Baker et al. Reference Baker, Brick, Bates, Battaglia, Couper, Dever, Gile and Tourangeau2013; Berrens Reference Berrens2003; Bytzek and Bieber Reference Bytzek and Bieber2016; Kennedy et al. Reference Kennedy, Mercer, Keeter, Hatley, McGeeney and Gimenez2016; Pasek Reference Pasek2016; Sanders et al. 2004, Reference Sanders, Clarke, Stewart and Whiteley2007; Simmons and Bobo Reference Simmons and Bobo2015; Stephenson and Crête Reference Stephenson and Crête2011; Twyman Reference Twyman2008), although many other studies show them performing worse (Baker et al. Reference Baker, Blumberg, Brick, Couper, Courtright, Dennis, Dillman, Frankel, Garland, Groves, Kennedy, Krosnick and Lavrakas2010; Chang and Krosnick Reference Chang and Krosnick2009; Dutwin and Buskirk Reference Dutwin and Buskirk2017; Malhotra and Krosnick Reference Malhotra and Krosnick2007; Pasek and Krosnick Reference Pasek and Krosnick2011; Sohlberg et al. Reference Sohlberg, Gilljam and Martinsson2017; Yeager et al. Reference Yeager, Larson, Krosnick and Tompson2011).
Recently, researchers have recognized the heterogeneity in quality between different types of non-probability internet panels (Baker et al. Reference Baker, Brick, Bates, Battaglia, Couper, Dever, Gile and Tourangeau2013; Dutwin and Buskirk Reference Dutwin and Buskirk2017; Kennedy et al. Reference Kennedy, Mercer, Keeter, Hatley, McGeeney and Gimenez2016; Pasek Reference Pasek2016). An AAPOR report summarized the continuum of non-probability internet panels as ranging from ‘uncontrolled convenience samples that produce estimates assuming that respondents are a random sample of the population’, which are particularly prone to error, to ‘methods that select respondents based on criteria related to the survey subject matter and adjust the results using variables that are correlated with the key outcome variables’ (Baker et al. Reference Baker, Brick, Bates, Battaglia, Couper, Dever, Gile and Tourangeau2013).
Efforts to place non-probability internet surveys on a firmer theoretical footing (Mercer et al. Reference Mercer, Kreuter, Keeter and Stuart2017; Rivers Reference Rivers2007; Terhanian and Bremer Reference Terhanian and Bremer2012) that draw on case-control matching methods (Rosenbaum and Rubin Reference Rosenbaum and Rubin1983) have led to more accurate non-probability internet surveys (Kennedy et al. Reference Kennedy, Mercer, Keeter, Hatley, McGeeney and Gimenez2016). The key requirement for drawing accurate inferences from non-probability samples is that self-selection into the sample is ‘ignorable’ conditional on the matching and weighting variables (Rivers Reference Rivers2013). At a practical level, this involves gathering accurate data on potentially relevant population characteristics and then matching and weighting non-probability internet panel respondents to meet those criteria. A recent Pew study suggests that the particular statistical method used to adjust the survey is not as important as which weighting variables are chosen (Mercer et al. Reference Mercer, Lau and Kennedy2018). The exact weighting variables used vary between pollsters. In general terms, they likely involve combining demographic information from the census, partisan registration data and data on political interest and engagement from high-quality academic surveys.
These selection and adjustment methods are reliant on the availability and quality of this sort of data, which varies between contexts. US pollsters, for example, can access party registration information which is generally unavailable in other countries. An additional concern is that these approaches must fix the values of potentially relevant variables such as political interest, which might change in response to events or are potentially dependent variables of interest (Kennedy et al. Reference Kennedy, Mercer, Keeter, Hatley, McGeeney and Gimenez2016).
When these matching and weighting variables are accurate and any remaining response bias is orthogonal to outcome variables, these techniques will produce unbiased estimates of population values (Pasek Reference Pasek2016). Whether these conditions are met is essentially unknowable, especially before the fact, and the precise combination of relevant conditioning variables will change over time.
This problem is not unique to non-probability samples – whether non-response bias to probability surveys will affect polling estimates is impossible to know beforehand as well. Indeed, proponents of non-probability internet survey methods have demonstrated that self-selection into internet surveys and non-response to probability sample surveys are theoretically and mathematically equivalent (Rivers Reference Rivers2013).
Why Do We Think Polling Is Getting Worse?
Despite the evidence that polling is as (in)accurate as ever, there is a common perception that polling has got worse in recent years (Cassino Reference Cassino2016; Cowley Reference Cowley2017; Tao and Reis-Smart Reference Tao and Reis-Smart2014; Zukin Reference Zukin2015). This perception may be driven by the various challenges outlined above as well as by confirmation bias and the common (if unacknowledged) definition of a polling ‘miss’ on the basis of whether the polls got the winner wrong, rather than the scale of the error. In Britain this tendency is apparent when we look at the error in the Conservative–Labour polling lead from 1945 to 2017 using the Jennings and Wlezien (Reference Jennings and Wlezien2018) data. We see errors of five percentage points or more in nine elections: 1951, 1970, October 1974, 1983, 1992, 1997, 2001, 2015 and 2017. However only the three years where the winning party was called incorrectly are referred to as ‘polling misses’: 1970, 1992 and 2015.
This bias towards ‘wrong winner’ errors was evident in the oral evidence sessions of the House of Lords Political Polling and Digital Media Select Committee. On at least two occasions, members of the committee commented on the accuracy of the French polls in the 2017 election, with Baroness Fall saying, ‘in France, the forecasts did a pretty good job with a new political party, with Macron. I wonder whether we do as well here with the same sort of methodology.’Footnote 4 It was a sentiment that was closely echoed by Lord Smith in a subsequent session.Footnote 5 As was pointed out on both occasions, the French polls were accurate in the first round of the 2017 election, but the error on Macron’s eventual margin of victory over Le Pen was 10 percentage points (Enten Reference Enten2017), outstripping the level of error in recent British polls. Perhaps the clearest example of the use of the ‘wrong winner’ definition is the 2016 US presidential election, where the national poll estimates were accurate by historical standards and got the winner of the popular vote correct, but the polls were considered to have missed because Donald Trump won the electoral college.
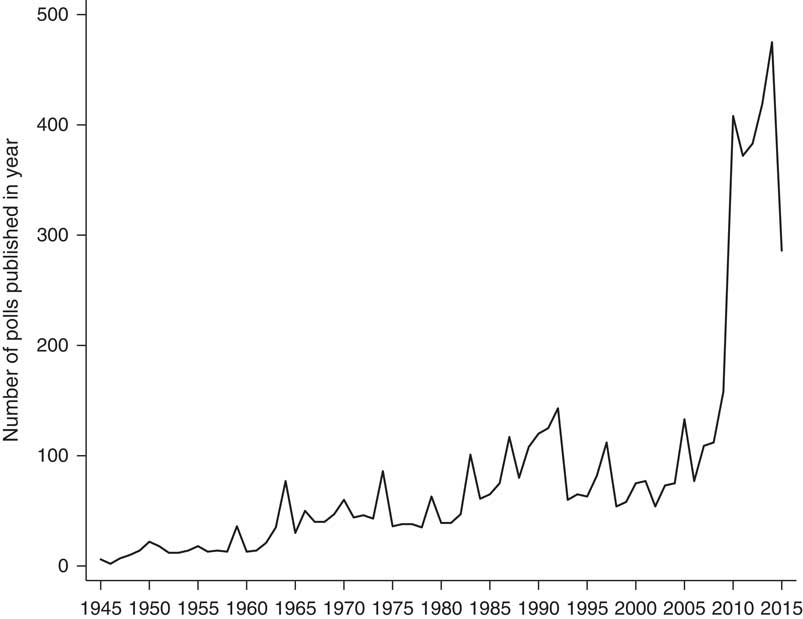
Another factor driving the impression that polls have become less accurate may be the increase in the number of polls published in recent years. Figure 2 shows the number of British polls published from 1945 to 2015 using data from Mark Pack (Reference Pack2017) and clearly shows the explosion of polls from 2010 to 2015. The sheer volume of polling creates a false impression of certainty around polling estimates, which is exacerbated by a poor understanding of the sources of polling error, particularly the idea that sampling error is the only source of error in polls. This problem is compounded by the pollsters themselves providing statements such as the margin of error around vote share estimates being ‘± three percentage points’. This is only the sampling margin of error, which strictly applies only to probability samples, and even then is an oversimplification.Footnote 6 If sampling error was the main source of error in polling, the increased volume of polls would increase certainty about the true levels of support for each party. However, sampling error is just one source of error, and other sources of error tend to take the form of bias – that is, the errors will tend to be in one direction – and do not cancel out across different polls. In the presence of these types of error, no amount of polling will provide more accurate estimates, and the actual sampling error will simply cluster around the biased estimates.
Number of Polls Published in Britain, 1945–2015
Further reinforcing the salience and implied certainty of polling has been the rise of poll aggregators and polling-based electoral forecasting (Jackson Reference Jackson2016). Notable early forecasting successes, such as Nate Silver’s 2008 and 2012 election predictions, created an air of infallibility around election forecasting. What has been poorly understood by the public (and perhaps by some forecasters) is the immense difficulty in quantifying some essential elements needed to develop an accurate probability, such as the uncertainty around whether bias in current polls will reflect past bias and the correlation between error between parties and across geography. A further difficulty is the task of properly assessing the accuracy of probabilistic forecasts of one-off events such as elections. After the fact, it would be easy to assume the forecast that assigned the highest probability to the eventual outcome was the most accurate, but it is easy to show this is not necessarily the case: imagine three forecasts of the outcome of a single toss of a fair coin, the first forecasts a 50 per cent chance of either heads or tails, the second a 99 per cent chance of heads, and the third a 99 per cent of tails. We know the correct probability is 50 per cent and yet after the coin is flipped an observer could be tempted to see the second or third forecast as uncannily prescient.
Sources of polling error
It is, we hope, clear that, despite the challenges facing contemporary polling, there is little evidence to suggest polls are becoming less accurate. It is important to make clear, though, that the fact that polls are not getting worse does not mean contemporary polls are accurate but that polls have always been inaccurate and continue to be so. Although some degree of polling error is inevitable due to sampling variation, polls have consistently underperformed the sampling error benchmark (Buchanan Reference Buchanan1986; Shirani-Mehr et al. Reference Shirani-Mehr, Rothschild, Goel and Gelman2016). Survey researchers have long known sampling error is just one of many potential sources of error in surveys (Weisberg Reference Weisberg2005). In this section, we explore several non-random sources of polling error.
Late Swing
Voters changing their minds between when they were polled and the time they cast their vote is one of the most commonly cited sources of polling error. From a pollster’s perspective, the appeal of this explanation is obvious – the polls were not wrong: they measured opinion accurately at the time but people changed their minds. Unfortunately for pollsters, in most cases where it is claimed, panel surveys and re-interviews with pre-election poll respondents do not support the theory (Bodor Reference Bodor2012; Durand et al. Reference Durand, Blais and Vachon2001; Marsh and McElroy Reference Marsh and McElroy2003; Mellon and Prosser Reference Mellon and Prosser2017a; Shlapentokh Reference Shlapentokh1994; Sturgis et al. Reference Sturgis, Baker, Callegaro, Fisher, Green, Jennings, Kuha, Lauderdale and Smith2016; Wolfers and Leigh Reference Wolfers and Leigh2002).
This does not mean the late swing excuse is always wrong. In Britain the evidence suggests late swing also played a significant role in the 1970 (Abrams Reference Abrams1970; Moon Reference Moon1999) and, to a smaller degree, 1992 polling misses (Jowell et al. Reference Jowell, Hedges, Lynn, Farrant and Heath1993a; Market Research Society Working Party 1994). There is also some limited evidence that a late swing to ‘No’ may have led polls to underestimate the ‘No’ vote in the 2014 Scottish referendum (Curtice Reference Curtice2014; Wells Reference Wells2016). In the 2014 US midterm elections the underestimation of the Republicans appears to have partly resulted from late swing (Keeter et al. Reference Keeter, Igielnik and Weisel2016).
‘Shy’ Voters
Another common excuse for polling misses is that supporters of one party/candidate either refused to disclose for whom they intended to vote, or told pollsters they were going to vote for someone else. Again, this would let pollsters slightly off the hook for polling errors – sampling methodologies could be perfect but if people will not tell the truth then the polls will be wrong through no fault of the pollsters. The reason for non-disclosure is usually suggested to be social desirability bias, with supporters of unpopular or controversial parties most likely to conceal their views. Additionally, supporters who are reluctant to reveal their vote preferences may refuse to take part in surveys, creating a ‘spiral of silence’ (Noelle-Neumann Reference Noelle-Neumann1993), leading to polls understating support for controversial or socially undesirable parties and candidates.
Given the secrecy of the ballot, it is difficult to prove whether people lie about how they will vote. There is some evidence to suggest it happens on at least some occasions. In the US, the ‘Bradley effect’ whereby polls overstated support for African-American politicians (due to white respondents being reluctant to say they would vote for a different candidate) appears to have been true in the 1980s and early 1990s, though it has since disappeared (Hopkins Reference Hopkins2015). As with the ‘late swing’ excuse, ‘shy’ voters are more often accused than guilty (Coppock Reference Coppock2017; Durand et al. 2001, Reference Durand, Blais and Vachon2002; Kennedy et al. Reference Kennedy, Blumenthal, Clement, Clinton, Durand, Franklin and McGeeney2017; Mellon and Prosser Reference Mellon and Prosser2017a; Sturgis et al. Reference Sturgis, Baker, Callegaro, Fisher, Green, Jennings, Kuha, Lauderdale and Smith2016).
‘Shy Tories’ – supporters of the Conservative Party in the UK – are the canonical explanation for the 1992 polling miss in Britain. There is some evidence that people who did not disclose their vote intention prior to the 1992 election but reported voting in recontact surveys were disproportionally Conservative (Jowell et al. Reference Jowell, Hedges, Lynn, Farrant and Heath1993b), though whether this represents ‘shy’ voters or late deciders swinging in one direction is unclear, and the extent to which people lied to pollsters has been disputed (Crewe Reference Crewe1993; Worcester Reference Worcester1996).
Shy Tories were suggested to be behind the 2015 polling miss (Singh Reference Singh2015), but looking at differential vote by non-disclosers during the campaign, the geographic distribution of Conservative support and vote intention reporting, a question ordering experiment, and modelling the likely vote choices of non-disclosers, Mellon and Prosser (Reference Mellon and Prosser2017a) found no evidence of a Shy Tory phenomenon, a conclusion later confirmed by the British Polling Council inquiry into the polling miss (Sturgis et al. Reference Sturgis, Baker, Callegaro, Fisher, Green, Jennings, Kuha, Lauderdale and Smith2016). Some researchers also suggested that people lying to pollsters about their likelihood of turning out to vote was a factor in the polling error (Whiteley Reference Whiteley2016). Examining this question, however, Mellon and Prosser (Reference Mellon and Prosser2017a) found that although people over-reported their likelihood of voting and having voted, over-reporting was uncorrelated with vote choice, meaning the errors in vote share estimates cancelled out.
‘Shy Trump’ supporters were also suggested to be behind Trump’s unexpected victory (Anderson Reference Anderson2016). However, there is no evidence supporting this. Using a list experiment – a technique designed to elicit accurate reporting of socially undesirable behaviour – Alexander Coppock (Reference Coppock2017) found no evidence of Shy Trump voters. Likewise, the AAPOR report into the 2016 US polls compared presidential vote intentions to Republican support in down ballot races and found nothing to suggest a Shy Trump effect (Kennedy et al. Reference Kennedy, Blumenthal, Clement, Clinton, Durand, Franklin and McGeeney2017).
Differential Don’t Knows
Another source of possible polling error is the voting behaviour of respondents who do not state a vote intention prior to the election, either because they are genuinely undecided about who to vote for or because they deliberately hide their vote intention. Pollsters and academics have discussed how and whether to assign undecided voters to a choice. The default method is simply to remove the undecided voters from the poll and report intentions only for those respondents who state a choice. Some pollsters such as ICM in Britain partially assign ‘don’t knows’ to the party they voted for at the previous election, although the approach has changed over time (ICM 2017). As we discussed above, there is evidence that people who did not disclose a vote choice before the 1992 election voted disproportionally for the Conservatives (Jowell et al. Reference Jowell, Hedges, Lynn, Farrant and Heath1993b). In the run-up to the Scottish and EU referendums, Stephen Fisher and Alan Renwick (Reference Fisher and Renwick2016) suggested undecided voters were somewhat more likely to return to the status quo option. This assumption seemed to hold true in the Scottish independence referendum, but did not predict the direction of the polling error in the EU referendum (Fisher and Shorrocks Reference Fisher and Shorrocks2018). Similarly in the US undecided voters swung towards the Republicans in 2014 (Keeter et al. Reference Keeter, Igielnik and Weisel2016) and towards Trump in 2016 (Kennedy et al. Reference Kennedy, Blumenthal, Clement, Clinton, Durand, Franklin and McGeeney2017).
Turnout Filtering
A key challenge for pollsters is determining who will actually vote on election day. Elections are won by those who vote, and including the vote intentions of people who will not turn out leads to polling bias if turnout likelihood is correlated with vote choice. Numerous studies show that voters overstate their turnout likelihood and over-report having voted afterwards (Burden Reference Burden2000; Karp and Brockington Reference Karp and Brockington2005; Presser and Traugott Reference Presser and Traugott1992). Pollsters frequently blame differential turnout for polling error but often do so with little evidence (Bodor Reference Bodor2012; Durand et al. Reference Durand, Blais and Vachon2001).
More problematic than people overstating their likelihood of voting are miscalibrated turnout models. Some pollsters adjust their vote shares by weighting the responses of voters according to their likelihood of voting, either using self-reported likelihood or more sophisticated models using demographic information. If those adjustments inaccurately predict the relative turnout of different party supporters, this will lead to polling errors. In the US, faulty turnout models were partly to blame for the polling error at the 2014 midterm elections (Keeter et al. Reference Keeter, Igielnik and Weisel2016). Likewise in Britain, turnout adjustments made to polls in 2017 increased error relative to the unadjusted vote shares estimates (Jennings Reference Jennings2017; Sturgis and Jennings Reference Sturgis and Jennings2017). Whether this was because pollsters incorrectly predicted who would vote or the way turnout adjustments were implemented is unclear (Wells Reference Wells2018).
Representative Samples and Weighting
By far the most common cause of polling error is unrepresentative samples (Curtice and Sparrow Reference Curtice and Sparrow1997; Durand et al. 2001, 2002, Reference Durand, Blais and Larochelle2004; Jowell et al. Reference Jowell, Hedges, Lynn, Farrant and Heath1993b; Marsh and McElroy Reference Marsh and McElroy2003; Mellon and Prosser Reference Mellon and Prosser2017a; Sturgis et al. Reference Sturgis, Baker, Callegaro, Fisher, Green, Jennings, Kuha, Lauderdale and Smith2016). Representativeness problems arise at two stages, first at the sampling stage when, as we discussed earlier, there might be coverage and non-response bias, and second at the weighting stage, where weighting categories either fail to correct for coverage and non-response bias, or introduce it.
Non-response bias can take two forms. (1) People in different demographic groups may be less likely to answer a survey. (2) Some types of people within demographic groups may be less likely to take a survey. Provided accurate population-level demographic targets are available, the first type of non-response bias is easily dealt with by weighting demographic groups to their correct proportions. The second type of non-response bias is more problematic, and can only be corrected if the correlates of non-response are known, and population-level targets are available. Likewise, there are two corresponding forms of weighting problem: (1) population targets might be inaccurate or out of date; and (2) weighting fails to account for relevant imbalances in the sample, leading to bias within weighting categories.
Both types of problem are potential sources of bias in polling, but in practice pollsters are generally good at accounting for demographic imbalances. In most polling situations, accurate demographic data are available in the form of high-quality government data such as census statistics, and demographic data are easily collected in surveys. This is not always the case, though: out-of-date demographic quotas are thoughts to have contributed to the 1992 polling miss in Britain (Moon Reference Moon1999). More recently, divergence between the voting age population (VAP) and the voting eligible population (VEP) due to immigration has called into question the validity of population-based weighting targets (Mellon et al. Reference Mellon, Evans, Fieldhouse, Green and Prosser2018; Prosser et al. Reference Prosser, Fieldhouse, Green, Mellon and Evans2018). A related but different problem is not including relevant demographic variables in the weighting scheme. In the 2016 US presidential election it appears state polls were unrepresentative because they did not weight for education, which was highly correlated with vote choice. Provided accurate targets are available, this problem is easily solved.
Non-response bias within weighting categories is more problematic. Survey researchers have long known that the ability of weighting to correct for survey bias rests on the assumption that respondents mirror non-respondents within weighting categories (Heath Reference Heath1996; Kalton Reference Kalton1983). Until recently, however, it has been less well appreciated exactly how non-response bias – specifically non-response bias related to political engagement and turnout – leads to errors in vote share estimates. Mellon and Prosser (Reference Mellon and Prosser2017a) show that non-response bias in the form of non-voters not taking polls was the primary cause of the 2015 polling miss. In short, missing non-voters from Labour-supporting demographic groups were replaced with Labour voters from those same groups, inflating the Labour vote share in polls.
To better understand how the absence of non-voters can inflate one party’s vote share, take the following hypothetical example. Imagine there is only one relevant demographic characteristic – whether people are ‘young’ or ‘old’. Fifty per cent of the population is ‘young’ and 50 per cent is ‘old’. Additionally, imagine there are only two parties: Conservative and Labour. In this scenario, there are two important differences in the political behaviour of the young and old: old people are much more likely to vote, and the majority of them vote Conservative when they do. Young people are much less likely to vote, but mostly vote Labour when they do. In an election, half the young would not vote (25 per cent of the total population), 40 per cent would vote Labour (20 per cent of the total population) and the remaining 10 per cent would vote Conservative (5 per cent of the total population). Conversely, only 20 per cent of the old would not vote (10 per cent of the population), 20 per cent of them would vote Labour (10 per cent of the population), and the remaining 60 per cent would vote Conservative (30 per cent of the population). Combined, 30 per cent of the population would vote Labour, 35 per cent would vote Conservative, and 35 per cent would not vote. The result of this election would be a Conservative win with 54 per cent of the vote and 65 per cent turnout.
Imagine we conduct a poll and face an extreme form of non-response bias where non-voters never answer polls and voters always answer polls (and there are no other sources of error). Because young people are less likely to vote, they are also less likely to answer the poll, and we will end up with a demographic balance of 62 per cent old and 38 per cent young in our sample. On the surface, we can easily correct this imbalance by weighting up young and weighting down old respondents, as is standard practice in polling. However, because we have not accounted for non-voter response bias, if we weight the age groups to their ‘correct’ population proportions of 50 per cent each, we will heavily skew the results of our poll by up-weighting young voters and down-weighting old voters. Indeed, this poll would give us 52.5 per cent Labour and 47.5 per cent Conservative – a large 13 percentage point error on the Conservative–Labour lead, and erroneously predicting a Labour win.
Although non-response bias is reasonably straightforward to identify after an election when the level of turnout and support for each party are known, it is not an easy problem to solve beforehand. One potential method is to correct for the missing non-voters directly by including turnout probabilities and an expected level of turnout in the weighting schema (Mellon and Prosser Reference Mellon and Prosser2016a). The logic of this approach is that conditioning demographic weights on the level of turnout will increase the accuracy of the relative weights amongst the voting subsample. The polling company Kantar used this approach successfully at the 2017 British election. An alternative approach weights the sample to the population and adjusts the weights according to expected turnout levels within each group. ICM used this approach in 2017, but the error actually increased as a result. Considerably more research is needed to understand the similarities and differences between these approaches. Both, however, rely on the accuracy of turnout models and on the predicted level of turnout at the election, both of which present considerable challenges.
An alternative approach tackles the problem indirectly by including a measure of political engagement as a weighting target. The logic of this approach is similar to turnout weighting, albeit with a more differentiated variable. The drawbacks of this approach are also similar: it requires an accurate population target for something which changes over time. High-quality academic surveys like the BES face-to-face are usually used to measure political engagement. Although these surveys likely provide accurate estimates of political engagement at the time of the survey (albeit with more error than other weighting targets based on the census), unlike demographics, attitudinal variables change throughout the political cycle. The BES Internet Panel data (Fieldhouse et al. Reference Fieldhouse, Green, Evans, Schmitt, van der Eijk, Mellon and Prosser2017) show that political attention increases during election campaigns and around events such as Brexit. Likewise, if we examine changes within campaigns we see election interest increases over the course of the campaign. As with turnout weighting, adjusting reported levels of political engagement to those measured in a post-election survey from a particular year is likely to lead to error if the population levels of political engagement change.
Geographic Heterogeneity
Geographic differences in how voter characteristics relate to vote choice further compound the difficulties of achieving an accurate poll sample. In the US, for example, the relationship between factors such as income and support for the Republican Party vary between states (Gelman Reference Gelman2008). In Britain, the decline in the number of marginal seats and geographic distribution has weakened the link between vote and seat changes (Curtice 2010, Reference Curtice2015), and geographically concentrated parties such as the Scottish National Party can win large numbers of seats with a small percentage of the vote.
Geographic differences will not necessarily lead to increased polling error as such – accurate nationally representative samples should still get national vote shares correct – but if geographic heterogeneity disproportionately rewards one party it will increase the probability of ‘wrong winner’ polling misses. This is particularly the case in majoritarian electoral systems that aggregate the results of local plurality contests to determine the overall winner like the Electoral College in the US and the distribution of seats in the UK House of Commons.
The vast majority of polling is commercial, and because subnational markets are smaller than national markets, any particular subnational market for polling is smaller too. Consequently, subnational polling is considerably less frequent – for example, between 2010 and 2015 roughly one Scottish vote intention poll was conducted for every 35 national polls. A further problem is the often-lower quality of subnational polling compared with national polling. The lower quality of US state polls is a long-standing problem (Hillygus Reference Hillygus2011), including in 2016 when the level of error in state polls was considerably higher than in national polls, contributing to the surprise of Trump’s Electoral College win (Kennedy et al. Reference Kennedy, Blumenthal, Clement, Clinton, Durand, Franklin and McGeeney2017).
Other Biases
The above problems cover the bulk of claimed or actual sources of polling bias but are not exhaustive. Error can arise at every stage of survey research (Weisberg Reference Weisberg2005), from a respondent clicking the wrong button to a journalist typing the wrong results into a newspaper report. Although these types of error are real, they are unlikely to result in bias. However, there are other ways in which polls might go wrong more systematically. We do not have space to describe other sources of error in great detail, but some are worth mentioning briefly.
In survey research the precise wording, format and context of survey questions can affect the answers respondents give (Tourangeau et al. Reference Tourangeau, Rips and Rasinski2000). In the electoral context some American research has pointed to the effect of different ways of asking about electoral turnout (Duff et al. Reference Duff, Hanmer, Park and White2007; Zeglovits and Kritzinger Reference Zeglovits and Kritzinger2014) and questions that ask about party or local candidate vote intention (Box-Steffensmeier et al. Reference Box-Steffensmeier, Jacobson and Grant2000), though recent research in Britain finds no, or at most, small effects (Green et al. Reference Green, Fieldhouse and Prosser2018; Prosser et al. Reference Prosser, Fieldhouse, Green, Mellon and Evans2018).
Another factor is the effects of different survey modes.Footnote 7 The effects of survey mode on political polling accuracy are not well established. One consistent finding is that impersonal methods, such as internet surveys, better elicit socially undesirable answers than personal survey modes such as face-to-face and RDD telephone surveys (Chang and Krosnick Reference Chang and Krosnick2009; Heerwegh Reference Heerwegh2009; Holbrook et al. Reference Holbrook, Green and Krosnick2003; Kreuter et al. Reference Kreuter, Presser and Tourangeau2008; Tourangeau and Yan Reference Tourangeau and Yan2007). Although the effect of Shy Tories has been exaggerated, it is likely to be even less of a problem in internet surveys.
Another challenge is respondents misremembering their vote choice at the previous election. Voters tend to misremember voting for the party they currently support (van Elsas et al. Reference van Elsas, Lubbe, Van Der Meer and Van Der Brug2014; Himmelweit et al. Reference Himmelweit, Biberian and Stockdale1978; Weir Reference Weir1975). Some parties are particularly prone to people forgetting they voted for them. In Britain this problem particularly affects the Liberal Democrats (and the Liberals before them, cf. Himmelweit et al. Reference Himmelweit, Biberian and Stockdale1978). The BES Internet Panel (Fieldhouse et al. Reference Fieldhouse, Green, Evans, Schmitt, van der Eijk, Mellon and Prosser2017) shows that only a year later, 16 per cent of 2015 Liberal Democrat voters said they had voted for a different party, and were more than twice as likely to misremember their vote as Conservative and Labour voters (other small party voters, such as the Greens and the UK Independence Party also disproportionately forget who they voted for). This pattern is driven, at least in part, by the Liberal Democrats’ reliance on tactical voters, who are more likely to forget how they voted than people who voted for the party they really preferred. Although this might seem an amusing curiosity, it is a potential source of polling error. In Britain it has been common to weight polls to past vote (Moon Reference Moon1999). If past vote estimates are inaccurate, they introduce bias into polls (this is a smaller problem for internet surveys, which generally use information about past vote recorded close to the previous election).
Herding
The final source of error we discuss here is ‘herding’, where pollsters deliberately adjust their methodology to produce certain results or suppress polls they think are wrong (AAPOR 2017) in line with the current ‘conventional wisdom’. Herding does not necessarily increase error – it could even increase polling accuracy if pollsters herd in the right direction – but it tends to artificially decrease the variance in polling, creating false confidence. Pollsters are regularly accused of herding by journalists and election forecasters (Hodges Reference Hodges2015; Linzer Reference Linzer2012; Silver Reference Silver2014). It is hard to know how common herding is because methodological changes can be made for legitimate reasons.
The inquiry into 2015 UK polls showed there was evidence consistent with herding but concluded the available data were insufficient to reject the null hypothesis of no change in variance over the last week of the campaign (Sturgis et al. Reference Sturgis, Baker, Callegaro, Fisher, Green, Jennings, Kuha, Lauderdale and Smith2016). Similarly, methodology changes made during the EU referendum campaign reduced the accuracy of the polls (Curtice Reference Curtice2016). Whether these adjustments constitute herding or were done in good faith is impossible to say. Herding clearly occurs on some occasions; one known example came from the polling company Survation, who admitted they ‘chickened out’ of publishing a poll with a six-percentage point Conservative lead the day before the 2015 election (Lyons Lowe Reference Lyons Lowe2015).
The future of polling?
Although polls are not getting worse, they are clearly far from perfect. Polls have always faced a number of methodological challenges and will likely continue to do so. It is hard to predict how polling might evolve beyond a short time horizon – few in the 1990s would have expected the current dominance of internet surveys – and the possibility of disruptive innovation in polling methods always remains a possibility. Although cheap and fast probability samples with high response rates will always remain a pollster’s dream, non-probability internet surveys are likely to remain a prominent part of the polling landscape for the foreseeable future.
Researchers and pollsters are likely to continue to work on improving the accuracy and reliability of non-probability samples. One particularly promising area of research is Multilevel Regression with Poststratification (MrP) methods (Lax and Phillips Reference Lax and Phillips2009; Park et al. Reference Park, Gelman and Bafumi2004). In brief, MrP methods work in the election context by first estimating the likely vote share within particular combinations of demographics and geography (e.g. women aged 35–44 with a university degree living in a particular constituency) with a multilevel model combining individual-level data from surveys with aggregate-level data at the chosen geographic level. Once the estimates of vote share within these cells are calculated, they are then ‘poststratified’ by weighting the cells to their known distribution in the population (e.g. the number of women aged 35–44 with a university degree living in a particular constituency). Research has shown that MrP methods can transform (very) unrepresentative survey data, such as users of the Xbox gaming platform, into accurate estimates of vote intentions (Wang et al. Reference Wang, Rothschild, Goel and Gelman2014). The 2017 British election saw a notable success in which a YouGov MrP model correctly forecast a hung parliament (YouGov 2017), contradicting every other forecast which confidently suggested a Conservative majority. MrP methods are not a panacea for all polling ills, and MrP models have been less successful in other contexts – a similar model to the successful 2017 British MrP forecast incorrectly predicted a comfortable Electoral College victory for Hillary Clinton in the 2016 US presidential election (YouGov 2016). MrP methods are only possible where the appropriate aggregate-level data are available. In particular the joint distribution of whatever demographic and geographic cells used in analysis must be known or estimated (Leemann and Wasserfallen Reference Leemann and Wasserfallen2017). Other research has shown that the accuracy of MrP methods is also highly dependent on the choice of aggregate-level prediction variables (Hanretty et al. Reference Hanretty, Lauderdale and Vivyan2016; Toshkov Reference Toshkov2015).
Although non-probability access panels are by far the dominant internet survey method, several other approaches have become more prominent in recent years. One such method is river sampling, where respondents are recruited to a survey as part of some other activity (clicking on an advertisement or taking an unrelated survey). This has been most commonly used by Google Consumer Surveys and Survey Monkey. A related method is random domain interception, which presents surveys to people who accidentally type in an incorrect URL. The major advantage of all of these approaches is that respondents do not self-select on the basis of political interest, which is one of the major problems with current polling. Mellon and Prosser (Reference Mellon and Prosser2016b) found that respondents to a random domain intercept survey in Britain reported much lower turnout among young people than internet panel data that matched turnout levels in probability samples. However, there is a serious downside to recruiting respondents through such a low engagement method: low response quality. Andrew Grenville (Reference Grenville2012) finds that river sample respondents drop out of surveys up to four times as often as internet panel respondents and are 16 times more likely to ‘flat-line’ responses: where a respondent mindlessly ticks the same option for every question in a grid.
Another development is the continuing rise in people taking internet surveys on their mobile phones. Although the use of mobiles to complete surveys has raised concerns about the quality of survey responses, recent research suggests the quality is comparable to internet surveys completed on computers (Antoun et al. Reference Antoun, Couper and Conrad2017; Couper et al. Reference Couper, Antoun and Mavletova2017). Whether mobile surveys remain a subtype of internet survey or evolve to form their own mode remains to be seen.
Given the problems polling has faced, some have suggested ‘big data’ methods might replace traditional polling as a means of measuring public opinion (Huempfer Reference Huempfer2017; Ruffini Reference Ruffini2011), especially in the form of the analysis of social media data (Cowley Reference Cowley2017; Ellis Reference Ellis2016). We are sceptical, however, that accurate measures of public opinion can be generated from these data for a number of reasons but primarily because, as with other non-probability samples, if self-selection into the sample is not ignorable, estimates of population values will be biased (Rivers Reference Rivers2013). Self-selection into social media usage is likely to be non-ignorable – we know social media users in general are not representative of the population – they tend to be younger, better educated and more politically engaged than the general population (Greenwood et al. Reference Greenwood, Perrin and Duggan2016; Mellon and Prosser Reference Mellon and Prosser2017b). However, we do not know enough about who uses platforms such as Twitter to talk about politics, nor with what frequency or intended audience. Such data would be necessary to condition social media data appropriately, but it would be extremely difficult to collect the demographic and attitudinal data about social media users needed to do so.Footnote 8 Existing forecasting methods that use social media data often make little attempt to correct for these biases.
It is unsurprising then that the performance of social media based forecasts is decidedly mixed, with a review of forecasts using Twitter data finding that they only performed well due to arbitrary decisions made after the election had already happened (Gayo-Avello Reference Gayo-Avello2012). When forecasts are actually preregistered, the performance has been poor (Burnap et al. Reference Burnap, Gibson, Sloan, Southern and Williams2015). Summarizing the existing research, Mellon (2018) concludes that without validation against representative data, there is little hope that social media data will consistently outperform traditional data sources.
Conclusions
We have shown that recent polls have had substantial errors but that these are entirely in line with historical levels of polling (in)accuracy. Polling has always been and continues to be a messy science with considerably higher errors than simple sampling margins of errors would imply. The causes of polling error are wide-ranging, and polling misses have different (and often multiple) causes.
In Britain the 2015 polling miss was due to unrepresentative samples (Mellon and Prosser Reference Mellon and Prosser2017a; Sturgis et al. Reference Sturgis, Baker, Callegaro, Fisher, Green, Jennings, Kuha, Lauderdale and Smith2016), whilst past misses in 1970 and 1992 were at least partly attributable to late swing (Abrams Reference Abrams1970; Moon Reference Moon1999), with additional factors such as inaccurate quotas and differential ‘don’t knows’ affecting the 1992 polls (Jowell et al. Reference Jowell, Hedges, Lynn, Farrant and Heath1993b). There is less consensus about the causes of error in the 2014 Scottish and 2016 EU referendum polls but there is some evidence of a late swing in 2014 (Curtice Reference Curtice2014) and the possibility of herding in 2016 (Curtice Reference Curtice2016). Likewise, it is too early to give a definitive judgement, but inaccurate turnout filtering appears to have increased the level of error in the 2017 British polls (Sturgis and Jennings Reference Sturgis and Jennings2017; Jennings Reference Jennings2017).
In the US, errors in the 2014 midterm polls were probably due to a combination of turnout filtering, late swing and differential ‘don’t knows’ (Keeter et al. Reference Keeter, Igielnik and Weisel2016). In 2016 state polls were inaccurate because they did not weight for education (Kennedy et al. Reference Kennedy, Blumenthal, Clement, Clinton, Durand, Franklin and McGeeney2017).
The challenges facing polling are many, and the cause of polling error is a moving target. However, recent research into these errors means we now understand the sources of polling error better than ever before. Despite public opinion research having been around in some form for more than a century, we are only now recognizing some of the mechanisms by which polling error can occur. These mechanisms are not unique to current polling methods and are likely to have affected political polling for as long as it has existed.Footnote 9 There are therefore grounds for optimism. If pollsters can identify and correct long-standing problems, they may be able to improve the quality of polling in the future.
One such problem is the way in which missing non-voters systematically skew polls towards the opinions of the general population rather than just those of voters. While Mellon and Prosser (Reference Mellon and Prosser2017a) only examine the 2015 British polling miss, given long-standing problems with non-response bias in political surveys, this type of problem has likely long affected polls around the world. The type of error that arises depends on the correlations between demographics, turnout and vote choice. These correlations can change between elections – for example, Mellon and Prosser (Reference Mellon and Prosser2017a) find the problems the polls faced in 2015, which inflated Labour’s vote share, also inflated the Liberal Democrat share in 2010. Broadly speaking, we would expect polls to overestimate parties supported by demographic groups with lower levels of turnout. In many cases this is likely to be parties of the left – generally supported by the working class and the young, both of whom are less likely to turn out to vote (Evans and Tilley Reference Evans and Tilley2017; Heath Reference Heath2016; Niemi and Barkan Reference Niemi and Barkan1987). It is therefore unsurprising that the overestimation of left-wing party vote share is common in many countries (Sturgis et al. Reference Sturgis, Baker, Callegaro, Fisher, Green, Jennings, Kuha, Lauderdale and Smith2016).
Although polls have not become less accurate, there have been changes in the volume of polling and in the way that polls are communicated to the public, especially with the rise of polling aggregators and election forecasters. While injunctions to focus only on polling averages and forecasts that collate large numbers of polls – and not to cherry-pick individual polls that fit a narrative, or over-interpret random noise – are well intentioned, polling averages and forecasts can give a picture of stability and certainty of public opinion that is not justified. In other words, even though focusing on outlier polls might be misleading in terms of vote shares, they are important indicators of the inherent variance and uncertainty in polling. Pollsters, forecasters and journalists all need to strike a balance between conveying the real information that polling provides, while also communicating the uncertainty that surrounds polling.
Despite the numerous challenges that contemporary polling faces, the research suggests that we are far from seeing the twilight of the polls. If pollsters and researchers continue to study the sources of bias in polling, and provide possible solutions to them, we could instead be at the dawn of a new era of higher polling accuracy.


