
Book contents
- Contested Transformation
- Contested Transformation
- Copyright page
- Dedication
- Contents
- Figures
- Maps
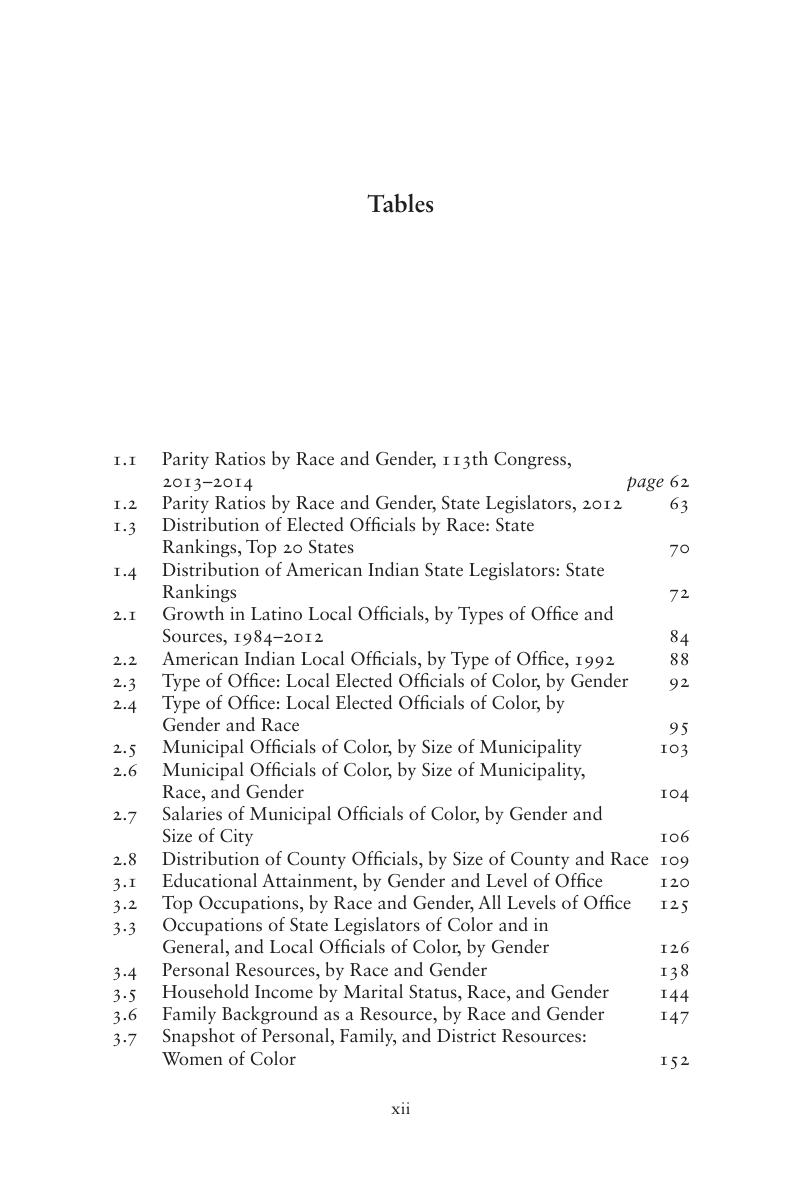
- Tables
- Boxes
- Acknowledgments
- Introduction
- Part I Transforming the American Political Landscape
- Part II Paths to Political Office
- Part III Leadership, Governance, and Representation
- Part IV Advancing Democracy in the United States
- Appendix A Data and Methodology
- Appendix B GMCL National Telephone Survey Questionnaire
- References
- Index
Tables
Published online by Cambridge University Press: 15 December 2016

Book contents
- Contested Transformation
- Contested Transformation
- Copyright page
- Dedication
- Contents
- Figures
- Maps
- Tables
- Boxes
- Acknowledgments
- Introduction
- Part I Transforming the American Political Landscape
- Part II Paths to Political Office
- Part III Leadership, Governance, and Representation
- Part IV Advancing Democracy in the United States
- Appendix A Data and Methodology
- Appendix B GMCL National Telephone Survey Questionnaire
- References
- Index
Summary
A summary is not available for this content so a preview has been provided. Please use the Get access link above for information on how to access this content.
Information
- Type
- Chapter
- Information
- Contested TransformationRace, Gender, and Political Leadership in 21st Century America, pp. xii - xvPublisher: Cambridge University PressPrint publication year: 2016
Accessibility standard: Unknown
Why this information is here
This section outlines the accessibility features of this content - including support for screen readers, full keyboard navigation and high-contrast display options. This may not be relevant for you.Accessibility Information
Accessibility compliance for the HTML of this chapter is currently unknown
and may be updated in the future.