

2.1 Diversity and Inequality
We too often form our perspectives or design policies based on simplistic notions of generational warfare or stereotypes. Precise definitions and examination of data on the life conditions of older people lead us to the same conclusion as a quick contemplation of our own lives: the situations, goals and behaviours of older people are very diverse.
Defining older people is not simple. Even though population ageing is something that clearly occurs due to shifts in age-demographics in their entirety (i.e. increases in the number of people at older ages relative to the number of people at younger ages), when we talk about population ageing – and especially when we warn of the consequences of population ageing – usually we are really focusing our attention on older people. To understand then the consequences of population ageing it makes sense to turn our attention to focus primarily on the people that make up this group. It must be acknowledged that there is no age grouping that universally defines people as being older. Often (as we will discuss further below) age 65 is taken as a cut-off point, with anyone above age 65 being considered older. In fact, the diversity of the ageing experience can be divided to encompass ‘older adults’ (65–84) and the ‘older old’ (85+). These categories can be further divided by including the ‘younger old’ (65–74), but for the purposes of this book the two categories will suffice. As lived experience shows, calendar age is a convenient way to classify but a poor guide to health status or behaviour. People at the same age have varying degrees of health and activity, which ultimately affects their role in society.
Further, discussions of ageing societies do not always distinguish between different interpretations of what different cohort (generation) sizes mean. It is possible to discuss simple numbers: more people were born in year X than in year Y. This means, for example, that the size of the Baby Boom generation (the generation born just after World War Two) affects pension expenditures, while the relatively small size of the generation born after the mid-1990s is producing a decline in demand for education in many places. These are simple demographic facts that we can see in Figure 1.2. Their actual policy impact is not so simple, though, and depends on other factors. For example, people born after the mid-1990s might be less numerous, but various factors including policy might encourage a higher share of them to pursue higher education. It is also possible to identify patterns in which a given property is more common in a given cohort. Higher education became much more accessible in the UK over the postwar years, which produces a relationship between age and likelihood that a person is a graduate. People who entered the labour market in a major downturn such as that of 2008 often face lower lifetime earnings. As we will argue, these relationships are more complex than they sound because they are shot through with intragenerational inequalities. Third, and perhaps most ambitious, are analyses that try to attribute a cast of mind to an entire generation. They channel the intuition in the quote attributed to Napoleon Bonaparte: ‘To understand the man you have to know what was happening in the world when he was twenty.’ These analyses (e.g. Reference Howe and StraussHowe & Strauss, 1992, Reference Howe and Strauss2009), which turn generations into actors, are generally based on shared formative characteristics; for example, the Baby Boomers or Millennials purportedly developed shared political and cultural ideas because of their shared experiences. They are far more problematic, as we shall argue below, because they privilege one variable, age, over all the other things that shape people’s life experiences and views. Many of them almost immediately disqualify themselves because a close reading shows the partiality of the viewpoints they impressionistically represent (most often well off and highly educated ones) and the tendentiousness of their arguments (Reference BristowBristow, 2019). Any account that gives the impression that most people have attended university, still less an elite university, gives away its own unrepresentativeness.
Distinguishing between these three understandings of generations matters greatly: it is not the same thing to say that ‘there are more 45–49 year olds than 25–29 year olds in a given country’ (an ascertainable demographic fact), to say that ‘35 year olds have on average lower average earnings than 45 year olds did at the same age’ (already a more probabilistic statement), and to say that ‘35 year olds are more likely to share a particular understanding of politics and policy that is different from 45 year olds after controlling for other factors’ (an ambitious statement indeed).
It is, nonetheless, easy to slide between the three different understandings of demographics, but doing so can mislead because the experiences of people are very diverse within and between cohorts, and often more appropriately explained by other factors. Empirically, we do indeed find that the lived experiences of older people are different, within and between countries and within and between cohorts. The following sections intend to illustrate the experience of being an older person in European countries in 2017 using the 7th wave of SHAREFootnote 1.
2.1.1 Income Insecurity Varies across the European Region, but It Is Better to Be on the Margins in Northern & Western Europe Than in Eastern Europe
Wealth has a considerable impact on whether healthy ageing is likely and whether ageing populations have a positive or negative impact on society. Wealthy men and women not only live longer, they also get more healthy life years after 50 years of age than the poorest individuals (Reference Zaninotto, Batty and StenholmZaninotto et al., 2020). In addition, the researchers found that education and social class also had an impact, but wealth was by far more significant. Similarly, wealthy older adults have a more positive impact on society than their poorer counterparts simply because they are healthier, thereby requiring less intensive or expensive care. In addition they were able to accumulate more asset wealth, which in turn contributed to economic growth when the assets translated into capital investments (Cylus et al., 2018).
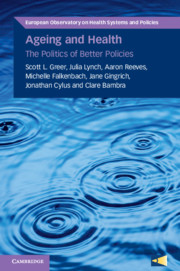
An important concern at older ages therefore is income insecurity. While there are worries about the sustainability of pension systems in many country contexts, other countries have limited or non-existent pensions, causing older people to struggle to make ends meet. According to SHARE data, the extent to which older people age 65 and above report that they feel they are able to make ends meet varies across countries, from 13 per cent in Greece and Bulgaria to 91 per cent in Denmark and Luxembourg (Figure 2.1).
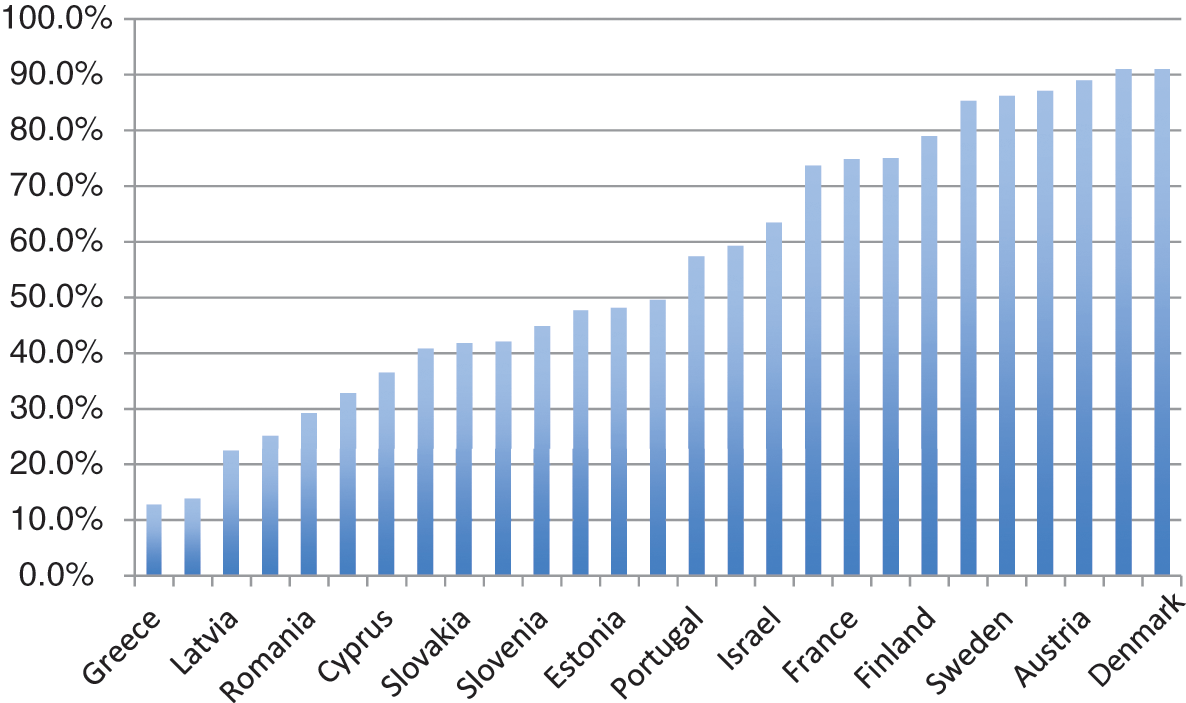
Figure 2.1 Percentage of people age 65+ who report they are able to make ends meet.
Grouping countries regionally into Southern Europe, Eastern Europe and Northern & Western Europe highlights the broad differences. For example, 85 per cent of people over age 65 in Northern & Western Europe reported they could easily or fairly easily get by, while only 58 per cent and 39 per cent respectively in Southern and Eastern Europe reported the same. Even controlling for differences in age and genderFootnote 2 among the SHARE respondents, the probability of a person over age 65 feeling unable to meet basic needs in Southern Europe is over four times higher than in Northern & Western Europe and over nine times higher in Eastern Europe than in Northern & Western Europe.
Within these broad regions, there are still significant differences in income insecurity. Less educated (ISCED-1997 below level 3) older people in general are more likely to face income insecurities, no matter where they live. But a low educated person in a country where a greater percentage of older people do not experience income insecurity is still better off than a low educated person in a country where the majority of older people do experience income security.
Looking only at the Northern & Western Europe sample as a whole, again adjusting for age and gender, an over 65 year old with low education is more than three times more likely than a highly educated older person from Northern & Western Europe to report being unable to make ends meet. The same is true within Southern and Eastern Europe, comparing older people of different education levels, with statistically similar odds. So, within regions in Europe, the relationships between education level and income security at older ages is fairly consistent: more educated older people have greater income security.
However, comparing across all regions and levels of education together, and still controlling for age and gender, it becomes clear that a low educated older person in Northern & Western Europe on average still has greater income security than a relatively more educated person living further to the East. Model results confirm that a highly educated person 65 years and over in Eastern Europe is still more than twice as likely to feel unable to make ends meet as a low educated 65+ in Northern & Western Europe. Simply put, when it comes to income security among older people, while there are differences everywhere that vary by education, it is more favourable to grow old in some countries than it is in others.
2.1.2 Most Older People Are Not in Paid Work but the Odds of Not Working Are Higher in Eastern Europe Than in Northern and Western Europe
To compensate for the lack of pensions, in some countries older people may engage in paid work for longer. Alternatively, it may be that people who have jobs that are limited by age-related factors (e.g. construction workers) leave the labour force at comparatively younger ages, while those in office jobs or other occupations that are not so physically demanding are able to continue to work at older ages; in this way, it may end up that the people who work longer are those who are more well off, rather than those who need to do so.
According to the SHARE data, the percentage of people above 65 working is overall quite low, around 2.5 per cent. This varies from 0.1 per cent in Romania to 18 per cent in Israel, though in most countries the percentage is below 5 per cent. Most people in Europe are retired by the time they reach age 65.
In fact, the likelihood of working after age 65 is much lower for Eastern Europeans than it is for the rest of Europe (Figure 2.2). Models suggest that Eastern Europeans over age 65 are more than twice as likely as Northern & Western Europeans to be retired or otherwise not working as opposed to working. This suggests that the ability to work is probably more of a luxury rather than something that older people continue to do in order to make ends meet.
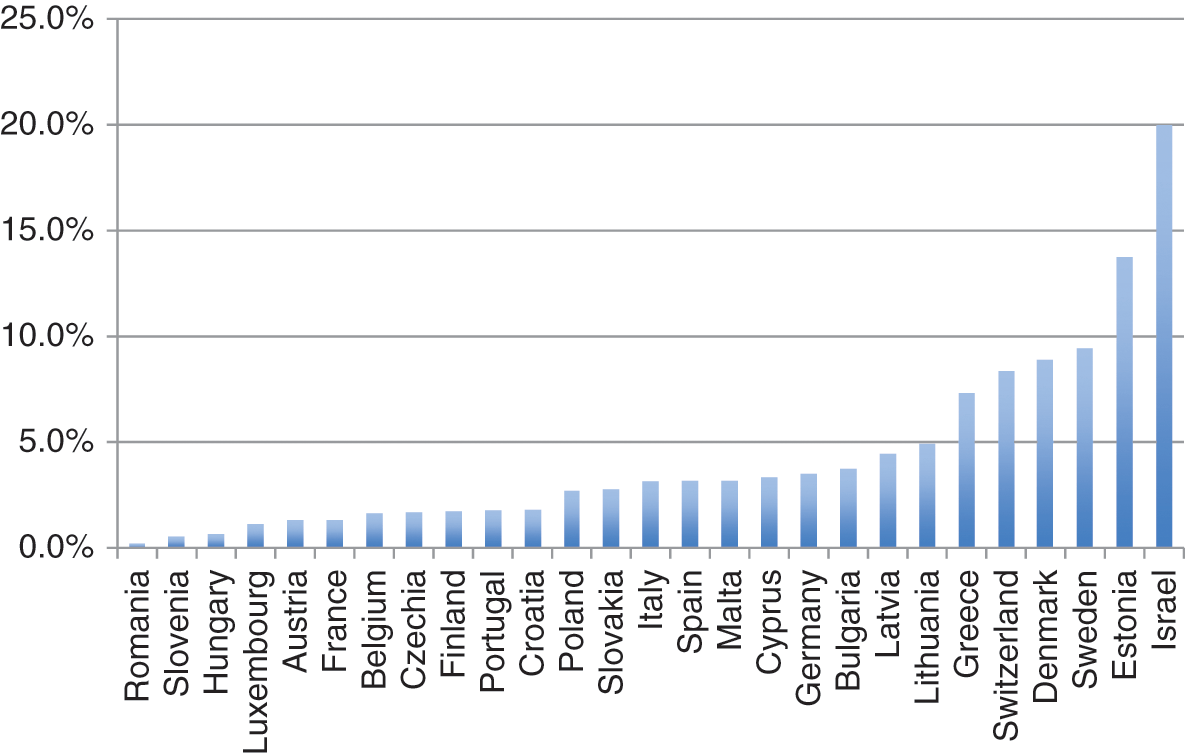
Figure 2.2 Percentage of people age 65+ who are in paid work.
2.1.3 Older People in Eastern Europe Are Most Likely to Live in Multigenerational Households
Who older people live with is important for understanding their level of support. Older people are at an age where their children (if they have them) are adults. In some countries they will have left the family home, while in others adult children may stay until they are married. In others, multigenerational households may be the norm.
Looking at the SHARE data, 56 per cent of respondents age 65 and over reported living with their spouse or partner. The lowest percentages of respondents living with their spouse or partner is in Eastern Europe, compared to Northern & Western Europe and Southern Europe. A likely explanation for this is lower life expectancies in Eastern Europe, so the region is likely to have more widows or widowers. Models suggest older people in Northern & Western Europe are 1.4 times and in Southern Europe 1.7 times as likely as Eastern Europeans to live with their spouse or partner.
However, older Eastern Europeans, on average, also have the largest households. According to the age 65 and over respondents in the SHARE data, the average household size in Northern & Western Europe is 1.7 people, compared to 1.9 people in Southern Europe and 2.1 people in Eastern Europe.
In fact, defining multigenerational households as any household with more than two people, or those with two people where the respondent reports not living with a spouse or partner, there is a much higher likelihood of Eastern European older people living in multigenerational households than older people in other regions. According to model estimates, an older person in Eastern Europe is more than 5 times as likely as an older person in Northern & Western Europe to live in a multigenerational household. Southern European older people are around 3.5 times as likely as an older person in Northern & Western Europe to live in a multigenerational household.
2.1.4 The Health of Older People Varies across Regions
Health (and, similarly, disability) is exceptionally important to consider when thinking about the ageing population. A key question that must be understood within this context is whether older people are spending their later years in good or bad health. This is significant because if longer life is healthy, active and fulfilling, then population ageing is less likely to become a potential crisis. If, however, ageing corresponds to a longer period of illness and limited activity, economic, social and health care costs may increase once a greater share of the population reaches older ages. The latest assessment of the health of older people in Europe (Reference Rechel, Jagger and McKeeRechel et al., 2020) finds that the assessment of whether people live longer in better or worse health depends very much on the measures used. In addition, the differences between and within countries are substantial, making it difficult to speculate on overall trends. The takeaway message is that while it is difficult to make broad statements about the health and disability trends among older people, health systems have the potential to contribute to increases in life expectancies, decreases in severe disability, and better coping and functioning with chronic disease.
Health status is notoriously difficult to compare across individuals. Self-reported health status is one of the most commonly used indicators, despite the potential for reporting biases. Self-reported health is reported in SHARE on a 1–5 scale (1 is excellent, 5 is poor). For convenience we convert this into a binary indicator of good health.
The percentage of people over age 65 reporting good health differs across countries. Fewer than a third of older people over age 65 in Estonia, Latvia, Lithuania and Hungary report good health, whereas more than two-thirds of older people over age 65 in Sweden, Belgium, Czechia, Denmark and Switzerland report good health. Unsurprisingly, again the differences among older people can be seen very clearly looking across broad regions: 54 per cent of Northern & Western Europeans over age 65 report good health, 49 per cent of Southern Europeans, and only 40 per cent of Eastern Europeans.
These differences highlight very clearly how calendar age does not tell the full story when it comes to the life experience of being an older person. Controlling for gender, logit models suggest that the odds of 65–69 year olds in Northern & Western Europe reporting good health (as opposed to poor health) does not statistically differ from their same-aged counterparts in Southern Europe. But 65–69 year olds from Northern & Western Europe are nearly 70 per cent more likely to report good health than 65–69 year olds in Eastern Europe (Figure 2.3).
Figure 2.3 Percentage of people age 65+ who report good health.
Put another way, the same models estimate that the odds of an Eastern European 65–69 year old reporting to be in good health are not statistically different from a 75–79 year old in Northern & Western Europe reporting to be in good health. Effectively one could interpret this to mean that when it comes to self-reported health, Eastern Europeans, on average, age about a decade ahead of Northern & Western Europeans by the time they are in their late 60s.
Of course, it isn’t only the region where an older person lives that matters for their health. Even after accounting for the effects of living in a particular region, more educated older people everywhere still have better odds of ageing in good health than those who are less educated. Figure 2.4 reports the odds of reporting good health by age and education (all relative to 65–69 year olds who have low levels of education). The odds ratios are shown in line graphs to help to visualize how the likelihood of reporting good health changes with age. Controlling for gender and region, across all education levels, the likelihood of reporting good health declines with age. But because the odds decline from different starting points, more educated people retain a health advantage. For example, a highly educated 65–69-year-old European is 1.5 times more likely to report that they are in good health compared to a low educated 65–69 year old. A highly educated 75–79 year old also has a likelihood of reporting good health that is statistically not different from the odds of a low educated 65–69 year old reporting good health. What this implies is that after controlling for the effects of living in a particular region, low educated people in their late 60s have effectively aged – at least when it comes to their self-reported health – about ten years faster than those with high levels of education.
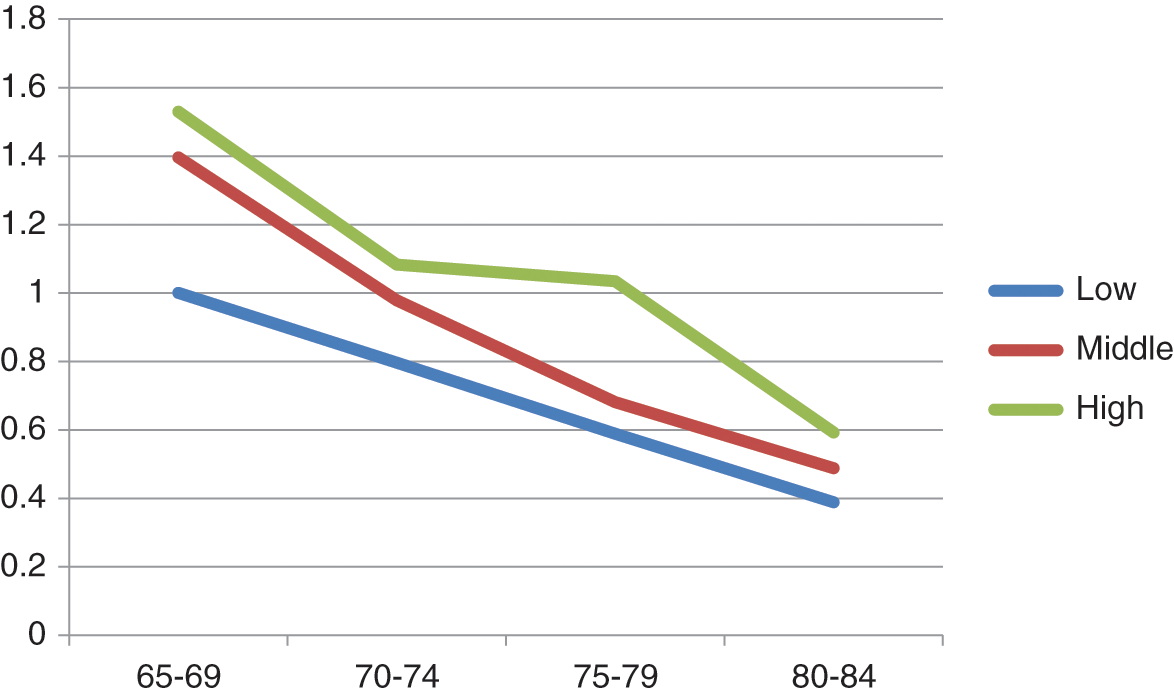
Figure 2.4 Predicted odds of reporting good health by age category and level of education.
2.2 What Do Commonly Used Data Say about Population Ageing and Its Effects on Society?
The above analysis illustrates what many would think is obvious and which the late singer Aaliyah said even more succinctly in 1994 at the age of 15: ‘age ain’t nothing but a number’. Older people may share common traits but, depending on factors including (but not limited to) their education and the country they live in, they often have very different experiences in terms of their income security, support networks and health status. In effect, age, while not completely insignificant, is not necessarily the most important predictor when it comes to many factors, simply because what it means to age for different people in different country contexts differs.
Highlighting this variability among older people matters, because all too often policies that are considered when trying to respond to the perceived threats of population ageing take a broad-brush approach. Whether proposing to deal with fiscal pressures by raising pension ages across the board or resisting calls to expand entitlement to long-term or social care services without acknowledging the huge variation in access to informal care or abilities to self-fund social care, all too often older people are treated like a single homogeneous group.
Nevertheless, many of the common metrics used in the context of population ageing do not take these differences across older people into account. At face value, some of them would seem to support concerns over population ageing. One of the most well-known metrics is known as the old-age dependency ratio, sometimes referred to as a support ratio. These aim to compare the ratio of the ‘non-working’ population to the ‘working’ population by relating the size of the population above a pre-determined chronological age (considered not to be working and to require ‘support’) to the adult population below the pre-determined age (who are considered to be working and thus ‘supporting’ them). For example, one could calculate the ratio of the population size over 65 years to the population size 15–64 years and express the ratio per 100 working-age people (e.g. 30 older people for every 100 of working age). The age threshold is often 65, which reflects the official pension age in many countries.
Despite its ubiquities, this metric has a number of important limitations. Chief among these is the assumption that all older people above a certain age are out of work, requiring and in receipt of external financial support, while younger-aged adults are assumed to be economically active and contributing into support systems. In fact, there is considerable variability in terms of normal retirement ages (i.e. the official age at which an individual can retire with a full pension) and average effective retirement ages (i.e. the age of exit from the labour force), both across countries and within countries across time, as well as between men and women. For example, according to OECD data, in South Korea men work on average 11.0 years beyond their normal retirement age, whereas in Slovenia men leave the labour force on average 5.4 years before their normal retirement age. Women in South Korea work 11.2 years longer, while women in Poland leave the labour force 7.2 years before normal retirement age.
Data from 1970 to 2014 also suggest that across countries, people have been leaving the formal labour force at progressively earlier ages over time, with a slight reversal to that trend in recent years (see Figure 2.5). The OECD-34 average retirement age for men in 1970 was 68.4 years, but this fell to a low of 63 years by 2004 before slowly rising again to 65.1 years in 2016.
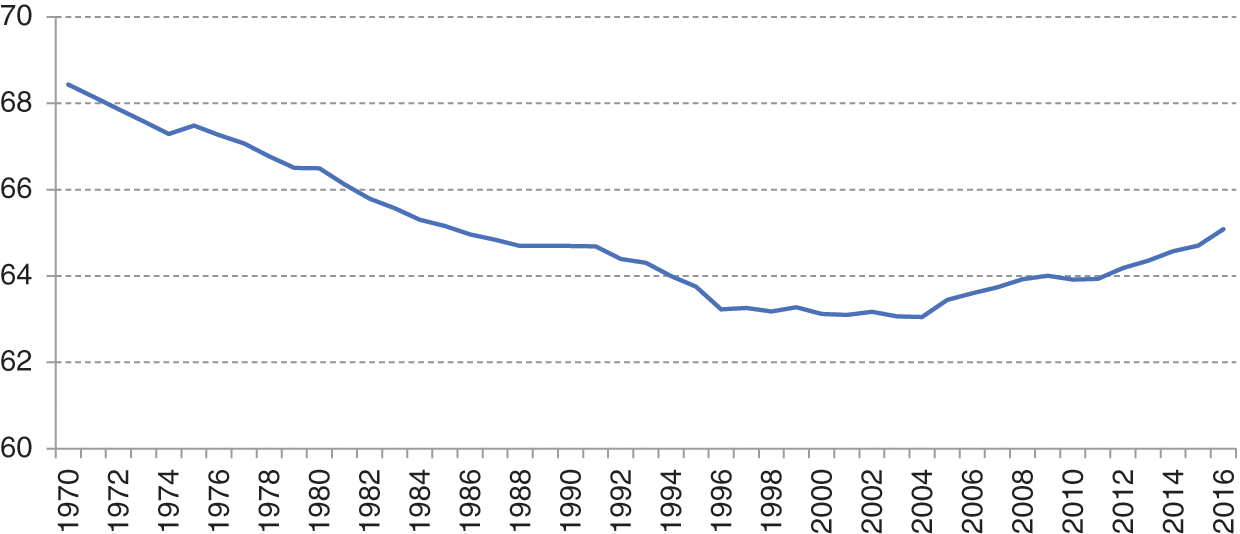
Figure 2.5 Average retirement ages among men in OECD-34 countries, 1970 to 2016.
Using any single age threshold for the support ratio will mask the fact that many people above the age threshold remain in the workforce, particularly in low-income countries, and many other older people who are not in the workforce are economically independent, are not dependent on the state for their incomes and pay tax on asset-based income and pensions. Not all younger people below the age threshold are economically active; as of April 2020, seasonally adjusted youth unemployment (under 25 years) was 15.8 per cent in the Eurozone (Eurostat, 2020). Increases in working-age unemployment rates increase the ratio of those who are genuinely dependent to those who are supporting them. This is a particular problem given high youth unemployment in many countries – but has no effect on the support ratio metric itself.
In essence, the old-age support ratio seems to raise an important policy question: will the older portion of the population become so large that it is unsustainable to continue to support it in the same way as before? It is a strangely simplistic concept. To say, in isolation, that we should be worried about the dependency ratio is to ignore productivity (if one working person is three times as productive as her grandparents, then why can’t she support three times more dependents?), the reduction in education and early years expenditure that arithmetically is happening when a society ‘ages’, and the uncounted contributions made by older people (e.g. unpaid child care that enables working age people’s labour market participation while probably also contributing to the health and happiness of children).
Even if we put aside these basic conceptual problems with dependency ratios, the challenge is determining how most accurately to capture the comparison between the size of the population requiring support and the size of the supporting population. There are additional caveats to consider, including the fact that the supported population may be supporting itself to some extent through its own taxes, through providing informal care for other people requiring support, or through income from savings and assets. Two alternative approaches attempt more properly to account for changes in population health and disability, and for changes in the proportion of consumers and producers.
Accounting for health and disability can be done through a metric called the prospective old-age dependency ratio (POADR), which takes forecasted increases in life expectancy into account and is defined as the number of people in age groups with life expectancies of fifteen years or fewer, divided by the number of people aged 20 years or older in age groups with life expectancies greater than fifteen years. Another similar option to adjust for disability is the adult disability dependency ratio (ADDR), which is the number of adults at least 20 years old with disabilities divided by the number of adults at least 20 years old without them.
Alternatively, we can also gauge the level of ‘dependency’ by accounting for the actual numbers of consumers and producers in the old-age dependency ratio. The National Transfer Accounts – country level data which contain information on economic flows from one age group or generation to another – can be used for this purpose. Figure 2.6 provides the intuition for this metric. Here, we can see how production and consumption vary per person across the life-course using data from South Korea as an example. In childhood, people naturally consume far in excess of their production since the majority do not engage in any sort of labour until at least their mid- to late teenage years. During traditional working years people produce far more than they are able to consume. However, as people age, their production on average begins to fall, eventually to a point where it is below their level of consumption. It follows then that a large share of the population at older ages (i.e. net consumers) superficially appears unsustainable. For a metric relating the total number of consumers to producers, one can take the population at each age group and weighting by average labour income and consumption at that age.
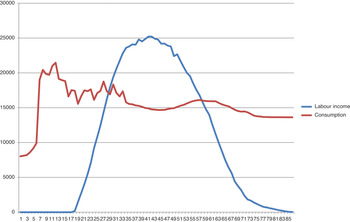
Figure 2.6 Labour income and consumption over the life-cycle, South Korea, 2012.
Technical debate about these different metrics should not obscure the fact that they, and the concept of dependency itself, are political constructs, developed for identifiable political reasons (such as justifying old-age pensions, Reference WinantWinant, 2021) and used for other political reasons (such as the political call for reduced old-age expenditures under the guise of “intergenerational accounting,” Reference CooperCooper, 2021). Statistics are costly to produce which means they are always political (Reference Greer, Greer and ElliottGreer, 2019).
Overall, this chapter has demonstrated that while policy and political debates often talk about older people as if they were a single homogeneous group, in reality what it means to be an older person differs substantially both across countries and within countries. This has important implications, both for how we perceive people at older ages as well as how we should approach policy development in different country settings when it comes to ageing-related policies.


 Open access