
Wisdom from Models
The most important question about climate change is: what will we do about it? Climate models have been predicting global warming as a result of human activities for more than a century. Since the 1980s, the connection between fossil fuels and climate change has not been in any doubt in the scientific community.1 But there has been much debate about how soon the effects would play out, how bad those effects would be, and what the world should do about it. Uncertainty on these questions – along with deliberate misinformation by industry lobbyists – has delayed the world from taking effective action on climate change for nearly three decades.
At the 1992 Earth Summit in Rio de Janeiro, the United Nations established the Framework Convention on Climate Change (UNFCC), which included an agreement to achieve “stabilization of greenhouse gas concentrations in the atmosphere at a level that would prevent dangerous anthropogenic interference with the climate system. ”2 The agreement was an important step forward, but it didn’t specify what constituted “dangerous,” and left the details to be negotiated at an annual series of international summits.3
Climate models cannot tell us what counts as “dangerous,” as they do not make value judgments.4 Nor can they make policy recommendations. To complicate the picture, the models show climate impacts vary in their speed and severity in different regions of the world. What counts as dangerous depends on where you live and whether you have the resources to adapt. The worst impacts are likely to occur in many of the poorest regions, while the richest nations are responsible for the vast majority of historical carbon emissions, making climate change an enormous equity issue.
Still, policymakers need specific targets to focus international negotiations. Over the years, a number of different targets have been proposed. The most widely adopted is the United Nation’s agreement to limit climate change to no more than +2°C over pre-industrial global average temperatures. This limit traces back5 to an influential report from the Stockholm Environment Institute in 1990 which concluded that beyond 2°C of warming, “the risks of grave damage to ecosystems, and of non-linear responses, are expected to increase rapidly.”6 Whether this is the right limit is still hotly debated, as is figuring out how to achieve it.
However, the question of what it would take to meet the 2°C limit has become much clearer over the last few decades. Through the use of model intercomparison projects – which involve a huge number of coordinated experiments on models from many different climate modelling labs – the climate modelling community has arrived at a remarkably consistent picture of how quickly we have to curb global greenhouse gas emissions to meet any specific limit on global temperature rise. This work is regularly assessed by the UN’s Intergovernmental Panel on Climate Change (IPCC), whose reports summarize the science and provide a set of pathways for the future, to guide national and international climate policymaking and to allow us to assess progress.
In this final chapter, we’ll explore what that guidance looks like. We’ll identify the most important lessons from climate modelling, and see how they feed into policymaking. We’ll also explore the implications of the 2°C limit, along with other ways of setting and interpreting goals for limiting climate change. We’ll consider what the models can and cannot tell us, and how likely we are to encounter nasty surprises. Finally, we’ll discuss why the world has been so slow to respond to the threat, despite the clear warnings from climate scientists, and we’ll end with some thoughts about what we ought to do now.
The Trillionth Tonne
After my first study of how climate scientists build and test their models, my colleagues at the UK Met Office encouraged me to present my work at the annual conference of the European Geosciences Union, normally held every April in Vienna, Austria. The conference is huge. That year, 2009, there were more than 10,000 scientists attending. Since then, the conference has only grown. There are so many sessions happening in parallel you have to browse the online program ahead of time, and download your own schedule of the talks you want to attend.
My talk was scheduled for the last day of the conference, so I had the rest of the week free to take in as much of the conference as I could.7 As this was my first time attending a geosciences conference, I wasn’t sure where to start. My co-author, Tim Johns, acted as my tour guide, steering me towards talks he felt represented the cutting edge of climate science. I learned about how climate scientists measure uncertainty and weigh up probabilities, heard about the potential for abrupt climate changes – or tipping points – as the planet warms, and discovered some scientists were already starting to model what would happen if we attempt emergency responses to climate change via geo-engineering. I also attended many talks on technologies for sharing climate data across the scientific community.
But one talk that week stood out for me, both for the elegance of the modelling experiment, and the importance of its implications. I had already met the speaker, Chris Jones, the previous summer at the Met Office, and interviewed him about his work, so I knew a bit about what to expect. However, my interviews with Chris had focused on the technical challenges in his work, and I hadn’t yet heard him talk about the bigger picture. Chris was presenting results from a collaboration with colleagues at the Universities of Oxford and Reading, to be published that same month in the prestigious journal Nature, on what the team called the trillionth tonne.8
The question Chris addressed in his talk is: how much coal, oil, and gas can we still use? The European Union had formally adopted the goal of keeping warming below the +2°C limit in the 1990s, and there was a widespread expectation this goal would be adopted by the UN at the Copenhagen summit in December 2009 – which it was. The work Chris presented that year was part of a larger effort within the climate science community to analyze this target and what it would take to meet it. Their answer turned out to be very simple – the world must not burn more than a trillion tonnes of carbon. Ever. The implications are profound, but before we discuss them, we’ll explore how they arrived at this answer.
Why 2°C?
Ideally, policymakers need clear, evidence-based targets, backed by robust scientific results, as a basis for international treaties. But distilling the science down to useful – actionable – guidance is not easy. Take, for example, the +2°C limit. The 1990 Stockholm report from which this limit arises offered a traffic light approach.9 The safe zone, green, is where temperatures stay below 1°C of warming. Beyond this, in the amber zone, the report anticipated “rapid, unpredictable, and non-linear responses that could lead to extensive ecosystem damage.” The world passed the +1°C threshold in the early 2000s, and some of the impacts described in the report are already evident – widespread increases in extreme heat, flooding, and wildfires. The upper limit, +2°C, marked the red zone, where damage would become irreversible, and new feedback effects could be triggered that would further amplify the warming.
The risks described in the report for the amber zone include stress on ecosystems, because plants – especially trees – can’t easily migrate to higher latitudes when climate zones shift polewards; the loss of farmland as sea levels rise, flooding fertile river deltas; sudden shifts in regional climate patterns as ocean circulation patterns change; and shifts in rainfall patterns, with many areas receiving considerable additional rainfall and flooding, while others experience more frequent droughts. The report also reviewed the potential for feedbacks to kick in at higher rates of warming, should we enter the red zone: sudden release of huge amounts of methane from melting permafrost and from undersea crystalline deposits known as calthrates; massive release of CO2 from dying vegetation as the climate changes; and the potential for a warming ocean to start releasing CO2 rather than absorbing it. The temperature limits were intended to guard against these risks.
The report also compared these limits with climates of the distant past. Warming of 2° to 2.5°C is comparable with previous inter-glacial periods 125,000 years ago, when early humans lived in hunter-gatherer groups and sea levels were 5–7 metres higher. Temperatures above 3°C take the Earth back to the Pliocene, 3–5 million years ago, long before humans evolved. Finally, warming of 5°C or more takes us to the “hothouse” Earth of 56 million years ago,10 when there were no ice sheets or glaciers anywhere on the planet, and sea levels were at least 70 m higher than today. Transitions between these periods in the Earth’s history were marked by mass extinctions, where the majority of species were wiped out.
This report established the idea of 2°C being an upper threshold for dangerous climate change, even while the rest of its warnings were largely ignored. But this number itself was only a rough estimate, and reflects our preference for whole numbers and simple messages. The original Stockholm report – and subsequent analysis in the IPCC assessment reports – all make it clear there’s no sudden change at 2°C. The risks get steadily worse with greater warming, as does the potential for unforeseen impacts to emerge. While there’s clearly a need to set specific limits to guide the political process, there’s no scientific way to decide exactly where these limits should be.
Within the climate science community there has been much criticism of the 2°C limit as far too high. In 2008, Jim Hansen, then director of NASA’s climate modelling lab,11 proposed instead a target of reducing CO2 concentrations in the atmosphere. His work drew on extensive analysis of paleoclimate records, from which he concluded “If humanity wishes to preserve a planet similar to that on which civilization developed and to which life on Earth is adapted, […] CO2 will need to be reduced from its current 385 ppm to at most 350 ppm, but likely less than that.”12 Hansen described the drastic action that would be needed to achieve this – phasing out all coal use, putting a price on carbon to limit the use of oil, and radically transforming agricultural and forestry practices to soak up past emissions. Hansen’s proposal inspired a global protest movement called 350.org, which continues to push for this more ambitious target. But concentrations have continued to rise, surpassing 420 ppm in 2022 (see Figure 1.4).
The Association of Small Island States (AOSIS) has also long been critical of the 2°C limit, because at that temperature, sea-level rise may wipe them out completely. Projections from coupled climate models show in a +2°C world, sea-levels would continue to rise for centuries, as the Greenland and Antarctica ice sheets continue to melt.13 It would also mean the loss of 99% of all coral reefs.14 These consequences led AOSIS to lobby for years for a lower “guardrail” limit at 1.5°C, and this was finally adopted in the language of the Paris agreement in 2015, which agreed to “pursue efforts” towards it.15 Unfortunately, the Paris agreement doesn’t link these global limits in any way to the commitments made by each country to reduce emissions – analysis of the initial commitments under the Paris agreement project the world would still warm by around 3°C by the end of the century.16
Future Scenarios
It’s not easy to translate a limit on rising global temperatures into specific actions or policies to ensure it. Future projections of climate change using a global climate model are always “what if” experiments. The model needs, as input, a detailed scenario for how much of each greenhouse gas – and other pollutants – humans will add to the atmosphere each year,17 along with any major changes in land use, such as deforestation. Creating such a scenario requires a lot of thought. What if over the coming century, the global economy grows rapidly, with more international trade, higher consumption, and ever growing demand for energy? Or what if there are trade wars and the world fragments into more regional trade blocks? What if there is more emphasis on protecting the environment and development of renewable energy? What if the world agrees and enacts strict policies on climate change? Each of these factors will affect how fast emissions grow, and whether and when they then might peak and then decline.
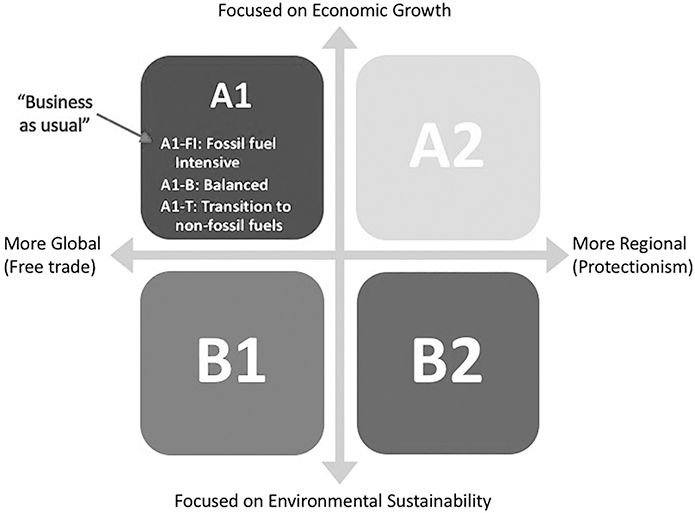
Over the years, the IPCC has developed various scenarios to serve as inputs to climate models. These scenarios result from detailed analysis of economic, social, and technological trends18 to understand how these trends interact, and how they would affect global greenhouse gas emissions. In 2000, the IPCC’s Special Report on Emissions Scenarios (SRES) identified 40 different scenarios, grouped into six different families (see Figure 9.1). The scenarios labelled “A” describe a world more focused on economic growth, while those labelled “B” describe a world focused on environmental protection. Similarly, the scenarios labelled “1” assume greater globalization, with more international trade, while those labelled “2” assume more regionalization, in a world with trade wars and protectionism. For example, the B1 family represents a world marked by global progress towards sustainable development, while the A2 family describes regional competition for economic growth. The A1 family, which envisages a continuation of the trend for increasing globalization and rapid growth, was subdivided further according to the likely energy sources used to fuel that growth – FI for Fossil fuel Intensive, T for a Transition to renewable energy, and B for a Balanced mix of energy from different sources. A1FI was regarded as the “business as usual” scenario, as it continued the late twentieth-century trend of expanding fossil fuel extraction to drive rapid economic growth.
The six scenarios from the IPCC’s 2000 Special Report on Emissions Scenarios (SRES).
These scenarios are intended to be politically neutral – the IPCC takes no stance on which of these storylines is more likely, nor which is more desirable. The idea was to map out plausible futures for society, so that climate models could then calculate the consequences. There are, of course, likely feedback loops – for example, if rapid growth leads to environmental destruction, it could trigger famine, war, or even societal collapse.19 And of course, if the world uses these analyses to enact strong climate change policies, that would change the storyline. But none of these potential feedbacks are included in the scenarios.
The IPCC assessment reports show how climate models respond to these scenarios (see Figure 9.2). Figure 9.2a shows the expected warming under three of the SRES scenarios over the remainder of this century,20 with hindcast simulations of the twentieth century in black. Future projections use a different colour for each scenario. The shaded regions show the range of results from multiple models, while the darker lines show the average of all the models for each scenario. Running these simulations is computationally expensive, so not all climate modelling groups were able to run all the scenarios – the numbers in brackets show how many models participated in each scenario run.
Projections of future global temperature change from (a) the IPCC Fourth Assessment Report in 2007, and (b) the IPCC Fifth Assessment Report in 2014. The black line shows simulated historical temperatures. Bold lines show the average of all the models for each scenario, while shading shows the range from different models. Numbers in brackets indicate how many models simulated each scenario. The temperature scale shows warming compared to the last quarter of the twentieth century. As the world had already warmed by about 0.75°C over pre-industrial conditions, all these scenarios exceeds the UN’s 2°C limit, except for RCP2.6.

The data used to compile these charts come from the Coupled Model Intercomparison Projects we met in Chapter 8, but this figure shows just one tiny part of that analysis – focusing on a single variable, global average surface temperature, and just on simulations of the twentieth and twenty-first centuries. Data from these intercomparison projects also allow scientists to analyze many other consequences of climate change – its effects on rainfall, seasonal norms and extremes, regional impacts, sea-level rise, melting sea ice and glaciers, and so on. Further experiments in CMIP focus on other things the models can be used for, including analysis of how well they simulate climates of the past, and hypothetical experiments that alter the atmosphere in other ways.
Updating the Scenarios
When planning began for the fifth IPCC assessment report, it was clear a new set of scenarios were needed. With growing pressure for international agreement on stronger climate policies, policymakers needed scenarios that reflected what such policies might achieve. None of the scenarios in the earlier assessment reports stay below the 2°C limit, so policymakers wanted to know what it would take. Was it even still possible?
The IPCC invited 130 climate scientists from around the world to a workshop in the Netherlands, in September 2007, to develop a new set of scenarios.21 Scientists from three different research communities came together for this workshop: climate modellers; social scientists who build Integrated Assessment Models (IAMs) representing economic and social trends; and scientists who study how climate change affects people – a field known as Impacts, Adaptation, and Vulnerability (IAV).
The previous approach was very slow – social scientists started with plausible storylines for how society might change, and used their socio-economic models to generate predictions for annual greenhouse gas emissions over the coming century. They then passed these to climate modellers as inputs to the physical climate models. To speed things up, the 2007 workshop focused on creating a set of plausible pathways for concentrations of greenhouse gases in the atmosphere, which each community could then analyze, in parallel, for plausibility. The community selected four representative pathways, chosen to be likely upper and lower limits22 for global concentrations of greenhouse gases in each of two different future worlds – a world that enacts international climate policies, and a world that fails to do so.
The names chosen for these pathways are a little awkward. They are referred to as Representative Concentration Pathways (RCPs), because they focus on how concentrations of greenhouse gases in the atmosphere might change over time, but each is named after the total impact on the planet’s energy balance – the radiative forcing,23 in watts per square metre – by the end of this century, if we were to follow each pathway. In all but one of these scenarios, concentrations of greenhouse gases in the atmosphere continue to rise throughout this century, because we keep adding more each year. So in each case the total forcing – and hence the amount of warming – is bigger than today’s. Figure 9.2b shows how global temperatures would rise for each pathway.
In the most optimistic pathway, RCP2.6, we start reducing annual greenhouse gas emissions immediately. Emissions drop to zero by the second half of the century, and then become negative – meaning we find a way to remove carbon from the atmosphere faster than we add it. This scenario would keep global temperatures below the 2°C threshold, but only just – and it would far exceed the 1.5°C limit. By contrast, in the worst-case scenario, RCP8.5, CO2 concentrations keep increasing even beyond the end of the century. The models show this would lead to as much as 5°C of warming by 2100, with a lot more to come in the twenty-second century. Many parts of the planet would become uninhabitable.
There’s much debate in the climate science and climate policy communities about whether these best- and worst-case scenarios are plausible. The worst-case scenarios (A1FI and RCP8.5) may depend on burning more fossil fuel reserves than actually exist. In the 2010s, the development of clean energy accelerated faster than the “business-as-usual” scenarios anticipated. Emissions cuts proposed under the Paris agreement would put us on track to do no worse than RCP4.5. On the other hand, the most optimistic scenario, RCP2.6, assumes large-scale removal of CO2 from the atmosphere in the second half of the twenty-first century, using technologies that are largely still hypothetical. This doesn’t mean the 1.5°C target is off the table. But as we’ll see, it does require a much more radical approach.
Uncertainty
The spread of projections in Figure 9.2 can be interpreted as scenario uncertainty – we don’t know which of these paths we will follow. Think of it as a choice. Humanity, collectively, must choose which of these paths to follow: will we continue on the upward trajectory of the recent past, or will we bend the curve downwards to avoid the worst impacts, and if so, how fast?
There’s a second kind of uncertainty represented in this figure – within each scenario, the shaded region shows the spread of results from different models. Climate scientists call this structural uncertainty, as we cannot be sure how well each model captures all the relevant physical structure of the climate system. The Model Intercomparison Projects we met in Chapter 8 are an important tool for assessing this kind of uncertainty – many different models from different labs around the world are run on exactly the same inputs, for a huge range of experiments. Data from these Multi-Model Ensemble experiments provides a detailed view of how and why the models vary, allowing scientists to analyze how accurately each model can simulate climates of the past, including the relatively stable climate of the pre-industrial era, the more recent climate change over the twentieth century,24 and the larger changes in climate during the ice ages.
As we saw in Chapter 8, these Model Intercomparison Projects have grown to become the largest coordinated computational experiments in the world. These projects – along with detailed analysis of observational data from the past and present – help to separate what we know about climate change from what we don’t know. This is important because uncertainty is often used as an argument to delay implementation of climate policy.
Figure 9.2 also shows that for the first few decades of the projections, the disagreement between models – the shaded region – is much larger than the difference between the scenarios.25 However by the end of the century, the converse is true – the difference between scenarios is much bigger. This illustrates a fundamental dilemma in climate policymaking. The choices we make in the next few years might not make a measurable difference to the climate change we experience until several decades have passed. But they will make a profound difference to the world we create by the end of the century, and in the centuries to come.
Where the models do disagree, it’s usually because of the choice of empirical parameters that stand in for processes that cannot be simulated explicitly. To assess how much these parameter choices matter, modellers use another kind of ensemble, known as a Perturbed Physics Ensemble, which involves systematically varying individual parameters to measure their effect. The long-running Climateprediction.net project,26 which began in 2001, uses crowdsourcing by allowing anyone to run parts of the experiment on their home computers when they are otherwise idle, and to display the results as a screen saver. Over the years, hundreds of thousands of people have signed up to participate, allowing the project to run as many as 10,000 versions of one of the UK Met Office models for a range of experiments: testing how variations in the land vegetation map affect the hydrological cycle; how variations in the sulphate aerosol parameters affect climate sensitivity27; and how parameters for cloud formation and water vapour affect the model’s ability to correctly simulate observed ocean states.28
An additional source of uncertainty arises from variability within the Earth’s climate system. Large-scale weather patterns often have a significant but temporary impact on regional climates, which in turn show up as year-to-year variations in climate indicators – temperature, precipitation, humidity, etc. Some of these patterns are big enough to show up at the global scale. For example, years where there is a strong El Niño have higher average surface temperatures than La Niña years, because they change how heat is stored and released from the oceans. This means accurate simulation of shorter-term climate change – over the scale of a decade or two – may depend heavily on the chosen starting state. Climate modellers assess this kind of uncertainty using Initial Condition Ensembles, like the Hamburg Large Ensemble we met in Chapter 8. Using many runs of the same model, each started from a slightly different initial state, the modellers can assess how much this internal variability affects short-term and long-term climate trends.
These various model ensembles provide some assurance that the models give reliable projections of future climate change. But they don’t entirely eliminate the possibility that all the models may be missing unexpected feedback loops that could trigger as the planet warms. Such a possibility argues strongly for caution – keeping the limit as low as possible. The further we move away from the stable climate of the past 10,000 years, the more likely we are to encounter such surprises.
Our Carbon Budget
The scenario analysis shown in Figure 9.2 doesn’t tell us how to stay within the UN’s 2°C limit, nor the tougher 1.5°C limit. To answer this with a global climate model you would, in effect, have to run the model backwards to find scenarios that stay within a specific global average temperature. But simulation models can’t run backwards like that. So it may take many runs – with hundreds of different scenarios – to identify the pathways that keep within these limits. If it takes a couple of weeks to run each simulation on a fast supercomputer, you’ll wait a long time for an answer.
In his talk at the 2009 EGU conference, Chris Jones showed how to do this without needing a supercomputer. His conclusion – to stay below 2°C, we cannot ever burn more than a trillion tonnes of carbon29 – builds on a remarkably robust result that emerged from climate models in the late 2000s. For all the complexity of the climate system, the peak warming we should expect largely depends on just one thing: the total amount of carbon humanity adds to the atmosphere over time – our cumulative global emissions. So the 2°C limit turns into a very simple rule.
Chris pointed out that if you add up all the carbon emitted since the dawn of the industrial revolution, it’s already well over 500 billion tonnes – half a trillion. And existing known fossil fuel reserves are enough to put at least another trillion tonnes of carbon into the atmosphere. So to stay within the UN’s limit, the majority of all current reserves of fossil fuels cannot be used.
The way Chris and his colleagues calculated this is interesting. Ideally, the analysis should use all the available climate models, as we know the average of all the models is better than any individual model, and the range of responses from the models gives a sense of the range of uncertainty. But the data from the CMIP experiments only cover a few scenarios, and Chris and his colleagues wanted to explore all possible scenarios.
They solved the problem by developing an extremely simplified model that can be calibrated to mimic the global temperature response of each of the big climate models, while sacrificing all other details. Their model expresses the energy balance of the planet as a single equation, and couples this to a simple carbon cycle model to calculate how quickly carbon is removed from the atmosphere by the soils and surface oceans, and the slower processes by which it is sequestered into the ocean depths. The parameters in these equations can be set to mimic30 any fully coupled Earth System Model, or they can be varied systematically over a range of values likely to be plausible compared to observational data.
The team then generated hundreds of potential emissions pathways over the coming century, each representing a possible future (see Figure 9.3a). Each pathway starts with emissions rising as they have been over recent decades, and assumes that, at some point, annual emissions will peak and then decline again. So the pathways are generated by varying three things: when the rise in emissions begins to slow; how quickly it then peaks; and how steeply it then declines. The team put each of these pathways into their simplified model to compute the temperature response over the coming centuries. And because the model can be adjusted to mimic other models, the team computed the results for every plausible climate model, to give a spread of possible answers. The graph in Figure 9.3b shows all of these possible outcomes for just one selected pathway – the one shown in red in Figure 9.3a – with darker grey shading showing the more likely outcomes.
Potential emissions pathways, and plausible temperature responses: (a) each of the possible pathways generated for the experiment. Orange pathways are those where the total cumulative emissions is 1 trillion tonnes of carbon. The red pathway was then selected as an example to compute the expected warming over the coming four centuries shown in (b). Note the longer timescale! Shading in (b) indicates probability – darker means more probable – and the solid red line shows the most likely response. Dotted red lines (and the slice of responses towards the year 2500) show what happens if we maintain net-zero emissions to stabilize CO2 concentrations in the atmosphere at 490 ppm.

Every Tonne Matters
Studies by other climate scientists all confirm a similar result – no matter which pathway we follow, and no matter which model we use, the peak global temperatures depend primarily on the cumulative total of carbon we add to the atmosphere. The result is so strong that if you plot cumulative emissions against peak global temperature – from any scenario, in any climate model – you get almost a perfect straight line (see Figure 9.4). The steepness of the line varies a little between models, but the models all agree it is a straight line.
The relationship between cumulative emissions and surface temperature rise. The chart shows an almost linear relationship between cumulative CO2 emissions and the rise in global surface temperature since the period 1850–1900. The five scenarios illustrated here for future warming are updated versions of the RCP scenarios, known as Shared Socio-economic Pathways (SSPs) – SSP1-1.9 was added after the Paris agreement, to represent a world that stays below the 1.5°C threshold. Note that all the scenarios are truncated at 2050. In all but SSP1-1.9, further warming continues in the second half of the century.

So it turns out it doesn’t matter when and where greenhouse gas emissions occur. Carbon dioxide is a long-lived greenhouse gas – once we put it into the atmosphere, it stays there for hundreds of years. Every tonne we emit makes the problem worse, including every tonne already emitted in the past, and every tonne we will emit in the future.
This result also means you can convert any goal for limiting global temperatures into a cumulative emissions target, to give what has become known as the carbon budget – the maximum amount of carbon we can burn globally and stay within the desired temperature. The term carbon budget is a little unfortunate, as it sounds like this is an amount of carbon we can still safely spend. In reality, the size and severity of climate impacts grow, the more of the budget we use up. Going past a trillion tonnes will put us over 2°C, and into the “red” zone of dangerous warming – where the impacts of climate change will pose an existential threat to many ecosystems and communities around the world.
There is still some uncertainty – and disagreement between models – on exactly how much warming you get per tonne of carbon, as can be seen in the spread of the shaded area in Figure 9.3b. But we can use that to estimate the probability of success for achieving any given target. For example, a trillion tonnes only gives us a 50% chance of meeting the UN’s 2°C limit. If we want better odds, the budget has to shrink accordingly. For a 66% chance, the remaining carbon budget shrinks to 250 billion tonnes of carbon. In the years since I saw Chris’s talk, we’ve emitted another 100 billion tonnes. That cuts the remaining budget significantly, but it is still possible to stay below a trillion tonnes. The bad news is that global emissions are still rising.31 Among the orange “trillion tonne” pathways in Figure 9.3a, the longer it take use to reach peak emissions, the more steeply the subsequent cuts have to be to stay on the path.
Some Serious Implications
These findings lead to three important facts about climate change, which together emphasize how hard climate change is to solve. The first is that global temperatures will keep on rising until we stop adding more carbon to the atmosphere. International climate negotiations have begun to acknowledge this, in the discussion about reaching “net-zero emissions” – the point when any ongoing emissions from human activities are balanced by processes that artificially remove carbon from the atmosphere. Because it will take years to build a replacement green energy infrastructure, we cannot cease all use of fossil fuels instantly. So the target date for reaching net-zero is typically set a few decades into the future, such as 2050.
Whether pushing off net-zero until mid-century is the right thing to do is hotly contested. On one hand, analysis from climate models shows that to keep the planet below 2°C of warming does require us to reach net-zero by the middle of this century. On the other hand, these studies also show net-zero alone isn’t enough. Early deep emissions cuts will be needed in the 2020s, because it is the cumulative emissions over the years that determine how much the planet warms. So focusing on a long-term target for the middle of the century can also be a way of putting off making crucial large emissions reductions in the short term.
The second fact is that climate change is largely irreversible, at least on human timescales. As we saw in Chapter 6, model experiments where human emissions instantly cease show the temperature of the planet stabilizes at whatever level it had reached. It takes the planet several decades to warm up under its extra blanket of greenhouse gases, but this ongoing warming is roughly counterbalanced by the initial absorption of some of those greenhouse gases by oceans and soils. The planet’s temperature will stabilize once we reach net-zero, but it will not cool down again.
For many people, this is counter-intuitive. Other kinds of pollutants wash out of the atmosphere fairly quickly. Heavy rains can clear many kinds of pollution from the atmosphere in a matter of hours – although they may then persist in soils and waterways. For such pollutants, once we stop producing them, the air clears relatively quickly. Clean air legislation usually leads to a rapid improvement in air quality. But greenhouse gases aren’t like that.
Long-lived greenhouse gases take thousands of years before they disappear entirely from the atmosphere.32 Roughly speaking, about half of each additional tonne of CO2 disappears within a few decades, absorbed by soils and oceans. Plants, particularly trees, help in this process by breathing in carbon dioxide and turning it into organic matter which builds up layers of soil – although some of this returns to the atmosphere every winter when fallen leaves decompose, and forest fires release a lot more of it. Two slower processes remove the remainder. The first is the flow of ocean surface waters into the deep oceans via the overturning circulation, which, as we saw in Chapter 7, takes hundreds of years. The second is a process of rock weathering, in which carbon dioxide dissolved in water forms a weak acid (carbonic acid) which reacts with calcium in rocks to form limestone (calcium carbonate). This eventually ends up in new sedimentary layers at the bottom of the ocean. Natural rock weathering would take thousands of years to fully remove the billions of tonnes of carbon we have added to the atmosphere.
Much research is under way to develop technologies that can remove carbon dioxide from the atmosphere faster, using a variety of chemical and mechanical processes. Unfortunately, none has been shown yet to work well at a large enough scale to make any significant difference. And many of these technologies require massive amounts of energy – which would have to come from a source other than burning more fossil fuels.
The conclusion is inescapable. Our carbon emissions accumulate in the atmosphere, and cannot be easily removed. So climate change is, in effect, irreversible on the scale of human lifetimes,33 unless we invent a way to remove carbon cheaply, on a massive scale. Most likely, whatever peak temperature we’re at when we reach net-zero, we will be stuck at for generations to come (see Figure 9.5).
The long-term relationship between emissions, atmospheric concentrations, and global surface temperatures. The chart shows, schematically, the consequences of three different scenarios (yellow, orange, and red) where emissions rise steadily and then end abruptly. In each case the carbon accumulates in the atmosphere, with an exponential rise, and begins to fall again after emissions cease, but with a very long tail. Temperatures remain roughly flat after the peak.

The third fact is a consequence of this. To prevent dangerous levels of global warming, we have to avoid burning the majority of current known reserves of coal, oil, and gas.34 There is enough carbon locked up in existing fossil fuel reserves to take the planet through at least 3–4°C of warming. If, in the coming years, we extract and use the majority of coal, oil, and gas in these reserves, we will blow through any agreed ceiling on global temperatures. Keeping most of our existing fossil fuel reserves in the ground represents a significant challenge for society – the world has to find a way to forego the enormous financial benefits that could be made on such valuable natural resources. Oil and gas extraction has been the most profitable industry on the planet for the last 50 years.35 Saying “no” to that will not be easy.
Is 1.5°C Still Possible?
In response to the agreement to make efforts towards the 1.5°C limit expressed in the Paris agreement, the IPCC produced a special report, in 2018, studying the implications of this lower limit, and analyzing scenarios that might achieve it. The report makes it clear the difference between 1.5°C and 2°C will affect some communities much more than others: “Populations at disproportionately higher risk of adverse consequences with global warming of 1.5°C and beyond include disadvantaged and vulnerable populations, some Indigenous peoples, and local communities dependent on agricultural or coastal livelihoods.”36
The report concludes that holding warming below 1.5°C will make a huge difference: ten million fewer people at risk from sea-level rise; several hundred million fewer people at risk from climate-related health issues and poverty; and significantly less stress on food security across equatorial regions. In many cases, dropping the limit from 2°C to 1.5°C means impacts are halved: half as many plants and animal species will be at risk, half as many ecosystems threatened, the loss to global fisheries will be halved, and the number of people affected by water stress halved.
To explore what it would take to hold to this limit, the report used a similar method to the trillion tonne analysis, running very simplified climate models37 to test a large number of scenarios collected from existing published studies. All the scenarios require urgent deep emissions cuts. The report also discusses how to achieve this: completely replacing all fossil fuel energy production with clean energy alternatives by mid-century, reducing demand for energy across the board via energy efficiency measures, and changing people’s behaviour to reduce demand. Buildings, transport, and industry would all have to consume less power. In each case, this would entail radical changes in how we do things – for example, in transportation, the majority of journeys would need to shift from planes and cars to (electric) buses and trains, and we would need to arrange our cities and neighbourhoods so less daily travel is needed. In agriculture, this would mean a dramatic reduction in the use of pasture land for farm animals, so that this land can be used for re-forestation, and a shift in what we eat – less meat – and big reductions in food waste.
The emissions scenarios38 that keep below the 1.5°C limit all share two crucial features (see Figure 9.6). All would need to reach net-zero global emissions by mid-century, and all would require immediate rapid cuts throughout the 2020s – around 7% every year – so that emissions would halve by 2030, and then halve again by 2040. Scenarios (shown in grey) that fail to make these early rapid cuts would overshoot the 1.5°C target, and would then require large-scale deployment of technologies to suck carbon out of the atmosphere again in the second half of the century, to bring temperatures back down.
Rapid reduction in CO2 emissions to stay below 1.5°C. In blue: scenarios that keep below this limit require emissions to drop by about half by 2030, and reach net zero by around 2050. In grey: scenarios that would overshoot the 1.5°C threshold, and then require very high carbon removal technologies in the second half of the century to cool the planet down again. These scenarios all assume rapid reduction in emissions of other greenhouse gases.

All of this would require a massive investment estimated at USD$2.4 trillion per year globally for two decades, or about 2.5% of global GDP. Such a massive investment for a rapid transformation of society is certainly possible – it would be akin to putting each country on a war footing,39 to reorganize every industry. The biggest barrier is political – our political leaders are still unwilling to acknowledge the scale of change needed.
What the Models Can’t Do
Climate models are excellent tools for improving our understanding of the climate system, allowing scientists to run computational experiments to test their hypotheses, and compare the results with observational data. They also allow us to make useful projections of likely future climate change, as they encapsulate so much of what we know about how the climate responds to various changes. And because they make theories about the climate system explicit and precise, they help to improve communication and collaboration across the scientific community.
While we can be sure the models get most aspects of global climate change right, the models still disagree on some impacts – especially on regional impacts – and cannot simulate fine-grained, local changes. More importantly, there are big gaps between what climate models do and what we really need, as a society, to comprehend the enormity and urgency of climate change.
First, climate models don’t help us imagine what life will be like in a climate changed future. The charts and diagrams I have presented in this book give us plenty of numbers, but these don’t really show us what a world warmed by say 2°C or 3°C will be like, and how different those worlds might be. And we’re easily misled by our intuitions here – after all, a couple of degrees doesn’t sound like much at all. In the 2010s, as the warming crossed the threshold of 1°C, some of the impacts started to become obvious: increased flooding from heavier rainfall, increased wildfires from hotter drier weather, and supercharged cyclones that pack more energy but move more slowly, leaving a lot more devastation in their wake. Seeing these impacts play out has clearly changed how the media reports climate change, and has energized climate activism. But when climate models predicted these impacts 30 years ago, it didn’t capture the public imagination in the same way, perhaps because the predictions lacked any specificity – such as where and when the floods and fires would hit. And photographs of the impacts are much more visceral than line graphs. For the same reason, it’s still very hard for us to picture the difference between a +1.5°C world and a +2°C, or between a +2°C world and +3°C world, no matter how much the models tell us this difference matters.
Climate models also don’t tell us much about how climate change will affect us in the near-term – over the next few years. While seasonal to decadal forecasting has improved, it still remains much harder than both short-term weather forecasting and end-of-century climate prediction. We also need to know how conditions will change at a specific location, say a farm, a city, or the neighbourhood where we live. Such information is critical for farmers to plan what crops to grow, for city governments to prepare for extreme weather events, for insurance companies to calculate risks and potential losses, and for individual citizens to understand how climate change will affect them. The grid cells in global climate models – typically 30–50 km across, even in today’s very high resolution simulations – are simply too coarse to provide such localized advice.
To fill this need, new organizations are beginning to appear, offering climate services. These organizations work with data from global climate models and observational data from satellites and weather stations, and add their own analysis, to offer more specific advice for governments, companies, and citizen groups. Climate services organizations make use of tools such as downscaling, which uses statistical techniques to fill the gaps between grid points in outputs of global models, and regional modelling, which specializes a climate model to simulate a specific region at a much higher resolution, using data from a global model to constrain what happens at the edges of the region.
Finally, climate models cannot give us precise answers about tipping points – thresholds where feedback effects kick in and turn a gradual change into a sudden shift in conditions.40 Model experiments and data from the distant past tells us that such tipping points exist, and allow us to understand the mechanisms in detail. But uncertainties in the models make it hard predict precisely when these would occur.
Known tipping points include the melting of the Antarctic and Greenland ice-sheets, where, once the melting starts, flows of water under the ice lubricate the ice sheets causing them to slide much faster into the ocean, triggering instability in the ice further inland. Triggering these tipping points could add many metres to sea level rise over the next few centuries. Similarly, the melting of sea ice in the Arctic Ocean may reach a tipping point when the ice that routinely melts every summer never re-freezes again in the winter. Other tipping points affect the Earth’s major ecosystems, including the loss of coral reefs due to warmer, more acidic oceans, and the loss of rainforests such as the Amazon, due to warmer, drier conditions. In such cases, the damage we’re already seeing to these systems could become permanent, such that they never recover.
Each of these tipping points can in turn trigger further tipping points. Melting of the Greenland ice sheet could release enough fresh water into the Arctic Ocean to trigger a shutdown of the Atlantic Meridional Overturning Circulation, as we discussed in Chapter 7. This circulation pattern has already slowed by around 15% in the last few decades.41 A full collapse of these ocean currents would bring sudden, dramatic climate shifts to many parts of Europe, Africa, and the Americas.
Predicting precisely when a tipping point will trigger is hard, due to the nature of chaotic processes – as we saw in Chapter 4 – which become less predictable as they approach a major shift in behaviour. But it’s also due to lack of data. While there are examples of these tipping points in the geological record, long before the modern era, they are rare, and none of the shifts in climate happened as fast as modern climate change. One of the reasons to limit climate change to within the UN’s target thresholds is to avoid triggering these kinds of tipping points.
In all of the scenarios described above, none of the climate models produce “runaway” global warming, where the planet just keeps heating up until it is entirely uninhabitable. Such a possibility is sometimes floated in the media, and by some climate activists, who worry about the possibility of human extinction. As we saw in Chapter 2, the planet only warms until it reaches a new thermal equilibrium – where outgoing heat lost to space balances incoming heat from the sun. So once we stop adding more greenhouse gases to the atmosphere, the warming stops too, although if we trigger any tipping points before then, they will greatly amplify the damage. Avoiding runaway warming shouldn’t give us much comfort though – the worst-case scenarios will still cause widespread suffering across the planet, and will certainly make some parts of the world uninhabitable.
Why Haven’t We Done More?
Climate models can show us the likely consequences of our choices, but they cannot make those choices for us. Many scientists I have spoken to assume given what we know about the science of climate change, it is obvious what we should do about it. Surely, they argue, a rational policymaking process would take rapid and decisive action to transition the world away from a dependence on fossil fuels, and away from destructive land management practices. And yet, despite more than 40 years of clear warnings from the scientific community, carbon emissions have continued to rise steadily, and very few countries have enacted the kinds of policy necessary to bring greenhouse gas emissions to a rapid halt.
Unfortunately, there is a significant gap between knowledge and action. Action on climate change doesn’t flow from knowing what the models tell us – it also involves a value judgment. It requires us to weigh up future outcomes against current wants and desires. We’re not very good at this. People who know that smoking causes cancer still smoke. And those of us who don’t smoke still routinely ignore our doctors’ advice on getting exercise and eating healthily. Partly, this is because we tend to discount the value of things that are far away in our futures, and put a high value on things we can enjoy right now.
Economists make these value judgments explicit by calculating a discount rate for future costs, to reflect the intuition that having some amount of money today is more useful than having that amount in several years’ time. So while climate scientists drew on the laws of physics to build their models, economists built assumptions about discount rates and economic growth42 into their analyses, which often then showed the cost of future damage from climate change would be smaller than the cost of taking action on it today. Today, most economists43 agree the early economics models vastly underestimated the cost of damage from climate change.
We are also surrounded by social influences and systems that train us to certain behaviours, even if we know, rationally, they are poor choices. And we tend to bundle those influences and values into ideological systems that then filter how we see the world. Studies of science communication show people tend to reject scientific findings that clash with their political worldview, and readily accept those that don’t.44
Combine this form of motivated reasoning with the allure of money, and you have a recipe for inaction. The oil companies whose profits derive from selling fossil fuels already knew about climate change in the 1970s and 1980s – their own scientists told them – just as the tobacco companies were aware of the link between smoking and cancer. But those companies exist in a capitalist society that values short-term profit over long-term sustainability, and they are led by (mostly) men who are entrenched in an ideological mindset that prioritizes individual freedom and unregulated enterprise over protecting the environment and ensuring long-term sustainability. So instead of making investments in alternative fuels, these companies doubled down, seeking to maximize the return on investment from fossil fuel extraction, while lobbying governments to delay any regulation on carbon emissions. They even paid some scientists45 to promote the idea that the science was still too uncertain, and that action on climate change would be premature. Few people today would regard this as ethical behaviour. But we all tend to act based on our value systems, rather than what the science shows.
Worse still, we don’t have appropriate ethical frameworks for these kinds of decision. The philosopher James Garvey describes46 climate change as ethics smeared out in space and time. Our individual choices join with the choices of huge numbers of other people, to cause harm to people at some future time, most likely in some other part of the world. Our understanding of ethical behaviour doesn’t generally extend that far. We can easily argue it’s wrong to kill someone, but can we argue that it is wrong to live a comfortable life today, powered by forms of energy that everybody uses, if in the long term that might make life miserable for people yet unborn? And even when we do recognize we have a responsibility to future generations, it’s not clear exactly how much that should restrict our actions today.
We also have difficulty seeing climate change as a problem of collective action, rather than individual action. For many years, the most common message – at least in Western cultures – focused on steps an individual could take to reduce their personal carbon footprints: save energy, fly less, eat less meat, and so on. While these things do matter, individual actions by concerned citizens are dwarfed by the global growth in emissions driven by government policies and corporate profit-seeking. All of our infrastructures – buildings, transportation, large-scale agriculture, manufacturing, shipping, etc. – are built on the assumption that fossil fuels are the dominant energy source and will continue to be. Until we dismantle and replace these infrastructures, it will be very hard for any of us to live a zero-carbon life. So the message that individuals must take responsibility for their own personal carbon footprints merely shifts the blame. The companies most responsible for carbon emissions have been happy to promote this message,47 as it takes the onus away from them.
The final missing link is politics, and especially the question of how wealth and power influences our political processes. One of the reasons so little has been done about climate change in the last 40 years is that politicians are regularly funded and lobbied by the wealthy corporations who stand to lose the most from strong climate policies. As Machiavelli pointed out48 anyone seeking change “will have for his enemies all those who are well off under the existing order of things, and only the lukewarm supporters in those who might be better off under the new.” There will be many opportunities to profit from a massive global investment in zero-carbon infrastructures, but the companies who will benefit either don’t yet exist, or are too small to wield political power. We don’t have the political structures in place to take collective global action on climate change, and indeed, our current global institutions, such as the UN, are strongly biased towards business as usual, because they are dominated by the wealthy nations who have gained most from the current economic system.
So What Should We Do?
What should people do, in the face of all of this? I am often asked this question by journalists, and I usually try to steer them away from it, because the question itself tends to push us into thinking about our individual contributions to the problem, instead of the vital question of how to bring about political change. If I am challenged to offer guidance, I say the three most important things any of us can do about climate change are, first, to talk about it; second, to get political; and third, to make it your job.
Talking49 about climate change – with friends, family, co-workers, and even strangers – is vitally important, because it helps to remind us all just how widespread our concerns are, and it helps reinforce our collective values around sustainability. Transformative change is hard. If we avoid talking about it, we’ll never know how much other people around us share our concerns, and our political leaders won’t know how much support there is for change. Plus, talking about climate change can be therapeutic – instead of bottling up our fears, we share them, which means we can start to help each other turn away from despair and start to galvanize action.
Getting political means joining with others in political campaigning, protest groups, putting pressure on politicians, and helping elect leaders who share our concerns. In a democratic system, change only occurs if large numbers of citizens get together and demand it. Most of the important steps we need to take are in the hands of our elected representatives, whether it’s our national leaders, or our local city councillors. Politicians tend to act only on things for which they sense there is widespread support. So make sure local representatives know how you feel about climate change, and join a political organization campaigning for urgent climate action. Make your voice heard.
Finally, by making climate change your job, I mean look for ways to incorporate climate action into how you earn a living, no matter what kind of work you do – including vital but unpaid work such as parenting and volunteering in the community. Virtually every sector of the economy contributes to climate change, either directly through carbon emissions, or indirectly by how it consumes energy and resources, or how it affects people’s behaviour. Many jobs will change dramatically over the next few decades, either because of the impacts of climate change, or because of the societal changes needed for a rapid transition to a sustainable world. If you work for a large organization, does it have a climate change plan? Can you get together with co-workers and create one? Can you push for changes in the workplace to make things more sustainable? For some, it might mean looking for a career change, to find a role where your skills and knowledge can be most effective. It might not be obvious where your skills are needed, but there’s work to be done everywhere. Ask around, and see what other people are doing – your skills will be needed somewhere.
Most importantly, we must not give into despair, because despair tends to stifle action. There are plenty of people, some claiming to be experts, peddling the idea that we are doomed. Today’s climate models – the work of a huge worldwide collaboration among thousands of scientists – show that unchecked climate change will change life on Earth for everyone, causing widespread death and suffering, and destroying many of the world’s vital ecosystems. But the models also show us clear pathways to avoid these worst-case scenarios. By acknowledging the severity of the crisis, and then choosing to work for a rapid transition to a sustainable world – choosing hope – we can follow those pathways together.


