
20.1 Introduction: Data and the Deep Carbon Observatory
For most of the history of science, data-driven discovery has been difficult and time-consuming: a lifetime of meticulous data collection and thoughtful synthesis was required to recognize previously hidden, higher-dimensional trends in multivariate data. Recognition of processes such as biological evolution by natural selection (Reference Darwin1,Reference Beddall2), continental evolution by plate tectonics (Reference Muir Wood and Woodhouse3,Reference Hazen4), atmospheric and ocean oxygenation by photosynthesis (Reference Holland5,Reference Canfield6), and climate change (7,Reference Weart8) required decades of integrated data synthesis preceding the discovery and acceptance of critical Earth phenomena. However, we stand at the precipice of a unique opportunity: to dramatically accelerate scientific discovery by coupling hard-won data resources with advanced analytical and visualization techniques (Reference Fayyad, Piatetsky-Shapiro and Smyth9,Reference Bolukbasi, Berente, Cutcher-Gershenfeld, Dechurch, Flint and Haberman10). Today, Earth and life sciences are generating a multitude of data resources in numerous subdisciplines. Integration and synthesis of these diverse data resources will lead to an abductive, data-driven approach to investigating Earth’s mineralogical and geochemical history, as well as the coevolution of the geosphere and biosphere (Reference Hazen, Bekker, Bish, Bleeker, Downs and Farquhar11–13).
In this chapter, we examine applications of data science in deep carbon research through three “use cases.” The first example focuses on geochemical and mineralogical anomalies from a period in Earth history (~1.3 to 0.9 Ga) when the supercontinent Rodinia was being assembled from previously scattered continental blocks. The second case study examines the diversity and distribution of minerals, notably carbon-bearing minerals, through deep time from the contexts of mineral evolution, mineral ecology, and mineral network analysis. The third and most speculative use case considers ways to analyze and visualize data that relate microbial protein expression to growth environments – complex interconnections that may shed light on Earth’s coevolving microbial ecosystems and near-surface geochemical environments. In each example, discoveries related to Earth’s deep-time evolution have resulted from the analysis and visualization of large data resources fostered by the Deep Carbon Observatory (DCO).
20.2 Use Case #1: Global Signatures of Supercontinent Assembly
Large and growing geochemical and mineralogical data resources facilitate global surveys of trends in crustal evolution through deep time. Over the past 3 billion years, Earth has undergone five periods of supercontinent assembly, during which most continents converged and concentrated into one more or less contiguous landmass. Each of these assembly episodes was followed by intervals of supercontinent stability, rifting, and dispersal (Reference Spencer, Hawkesworth, Cawood and Dhuime14–Reference Liu, Knoll and Hazen16).
In spite of some shared geochemical, mineralogical, and tectonic characteristics, each of these five supercontinent episodes is distinct in detail. The Mesoproterozoic Rodinian supercontinent, in particular, displays several unique mineralogical and geochemical characteristics that point to a unique outcome of collisional events between ~1.3 and 0.9 billion years ago (Reference Liu, Knoll and Hazen16–Reference Liu, Runyon, Knoll and Hazen22). Rodinia represents an important transitional period for Earth’s carbon cycle in terms of both geochemical and biological evolution. In this section, we examine rapidly growing data resources in mineralogy and geochemistry that shed light on the unique character of this interval of Earth’s history.
20.2.1 Mineralogical Evidence
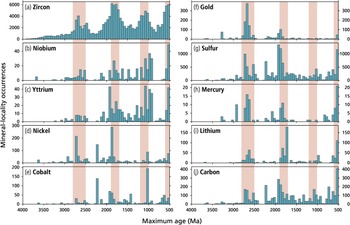
Evidence for five cycles of supercontinent assembly, stability, and dispersal are strikingly preserved in the age distributions of high-temperature minerals (including many igneous, metamorphic, and hydrothermal species), which may be preferentially formed and/or preserved during continental suturing. The most notable mineralogical proxy is detrital zircon grains (Reference Kemp, Hawkesworth, Paterson, Kinny and Kemp23–Reference Voice, Kowalewski and Eriksson29). As with other supercontinents (Figure 20.1a), the assembly of Rodinia saw a significant peak in the production and/or detrital preservation of zircon, with a global maximum at ~1.1 to 1.0 Ga (Reference Kemp, Hawkesworth, Paterson, Kinny and Kemp23,Reference Voice, Kowalewski and Eriksson29).
Mineral frequency of occurrence through deep time for: (a) detrital zircon (data from 29), (b) minerals with essential niobium, (c) yttrium, (d) nickel, (e) cobalt, (f) gold, (g) sulfur, (h) mercury, (i) lithium, and (j) carbon (data from earthchem.org). Bar graphs display 50-million-year bins. Vertical bars indicate periods of supercontinent assembly.

Important mineralogical insights into supercontinent cycles are provided by minerals other than zircon (Figure 20.1) (Reference Liu, Knoll and Hazen16,Reference Hazen, Golden, Downs, Hystad, Grew and Azzolini30,Reference Hazen, Liu, Downs, Golden, Pires and Grew31), and these mineral species can be explored through deep time thanks to the creation and rapid expansion of the Mineral Evolution Database (MED; rruff.info/evolution), an important contribution of DCO mineralogists. The MED incorporates more than 195,000 mineral/locality/age data, mostly for minerals from well-constrained magmatic, metamorphic, or hydrothermal events (data as of June 10, 2019). Liu et al. (Reference Liu, Knoll and Hazen16,Reference Liu, Runyon, Knoll and Hazen22) employed the MED to explore and document age distributions of minerals and found that minerals containing niobium and yttrium (Figure 20.1b and c) exhibit similar trends to those of zircon; these minerals display maxima slightly later than zircon, at ~1.1 to 0.95 Ga. By contrast, minerals of most other elements, including Ni, Co, Au, S, Hg, Li, and C (Figure 20.1d to j), record significant pulses of mineralization during the assembly of Kenorland, Nuna, Gondwana (Pannotia), and Pangaea, but notably indicate decreased mineralization during Rodinian assembly (Reference Hazen, Golden, Downs, Hystad, Grew and Azzolini30–Reference Hummer, Golden, Hystad, Downs, Eleish and Liu35). From these observations, we conclude that the currently expressed patterns of mineralization associated with the Rodinian assembly are unique relative to those of the other aforementioned supercontinents.
20.2.2 Trace Element Distributions
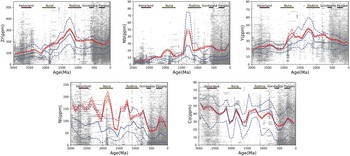
Temporal changes in the global averages of trace elements in igneous rocks complement and amplify mineral evolution data. Liu et al. (Reference Liu, Knoll and Hazen16,Reference Liu, Runyon, Knoll and Hazen22) compiled trace element data for globally distributed igneous rocks from the EarthChem database (earthchem.org) and the United States Geological Survey (USGS) Mineral Resources Online Spatial database (mrdata.usgs.gov). They compiled age/concentration data for 129,161 samples with reported Zr analyses, 105,045 with Nb analyses, 121,373 with Y analyses, 77,835 with Co analyses, and 82,611 with Ni analyses from igneous rocks, all of which are associated with SiO2 content (wt.%) and modern geographic coordinates (Figure 20.2).
Trace element concentrations of Zr, Nb, Y, Ni, and Co in global igneous rocks through the last 3.0 Ga. Maximum values for Zr, Nb, and Y occur during and immediately before Rodinian assembly, in contrast to Ni and Co. Gray-filled circles are data resampled from earthchem.org with bootstrap resampling. Moving averages and medians of samples within ±100 Ma bin sizes are calculated for each 100 Ma. Red solid lines are averages; red dashed lines are 95% confidence intervals of the moving average; blue solid lines are medians; blue dashed lines indicate the lower (25%) and upper (75%) quantiles

The period of Rodinian assembly from 1.3 to 0.9 Ga saw significantly greater niobium, yttrium, and zirconium concentrations in igneous rocks than at any other time during the last 3 billion years (Figure 20.2). Furthermore, these trace element maxima apply to both mafic and felsic igneous rocks. By contrast, Liu et al.’s (Reference Liu, Knoll and Hazen16,Reference Liu, Runyon, Knoll and Hazen22) survey found that average nickel and cobalt concentrations in igneous rocks display no significant enrichments or depletions during this interval (Figure 20.2).
20.2.3 Why Is Rodinian Assembly Unique?
Rodinia has long been recognized as distinct from other supercontinents. In addition to the mineralogical and geochemical anomalies noted above (Figure 20.1), the time from 1.3 to 0.9 Ga is marked by enhanced anorogenic magmatism, as well as a relative minimum extent of continental margins and collisional belts (Reference Bierlein, Groves and Cawood21,Reference Hoffman, Kaufman, Halverson and Schrag36–Reference Dickinson40). Liu et al.’s (Reference Liu, Knoll and Hazen16,Reference Liu, Runyon, Knoll and Hazen22) observation of significant maxima in the Nb, Y, and Zr composition of Rodinian igneous rocks (Figure 20.2) amplifies evidence that Rodinian assembly was unique, while pointing to possible reasons for these differences.
The enrichments of Nb, Y, and Zr, coupled with the greater relative abundances of minerals of these three elements, point to a distinctive tectonic setting for Rodinia. Rodinian assembly was dominated by “non-arc” magmatism, in contrast to other intervals of supercontinent assembly when collision-related mineralization and island arc magmatism were of greater relative significance (Reference Nicholson, Cannon and Schulz41–Reference Prol-Ledesma, Melgarejo and Martin46). In particular, these tectonic conditions at 1.3 to 0.9 Ga led to enhanced production of NYF-type (i.e. Nb-, Y-, and F-enriched) pegmatites, with associated increases in the occurrence and diversity of Nb-, Y-, and Zr-bearing minerals (Reference Prol-Ledesma, Melgarejo and Martin46–Reference McCauley and Bradley49). This mineralization may have been associated with a warmer mantle and/or a thickened continental crust during Rodinian assembly (Reference Dhuime, Wuestefeld and Hawkesworth50,Reference Dijkstra, Dale, Oberthür, Nowell and Graham Pearson51) – characteristics that may reduce scavenging of high-field-strength elements by interaction with the depleted mantle during arc magmatism (Reference Kelemen, Johnson, Kinzler and Irving52,Reference Woodhead, Eggins and Gamble53).
The relative enrichment of Nb, Y, and Zr contrasts with the behavior of many other elements during the period of Rodinian assembly. The minerals of most elements are notably lacking during the 1.3 to 0.9 Ga interval, as manifest in the relatively few ore deposits associated with the time of Rodinian assembly (Reference Hazen, Golden, Downs, Hystad, Grew and Azzolini30,Reference Hazen, Liu, Downs, Golden, Pires and Grew31,Reference Hoffman, Kaufman, Halverson and Schrag36,Reference Bradley38). However, the trace element concentrations of Co, Ni, and many other elements in igneous rocks do not show corresponding depletions compared to other supercontinent episodes (Figure 20.2) (Reference Liu, Knoll and Hazen16). Given this consistency in metal concentrations, reduced Rodinian ore deposition seems unlikely. Rather, the lack of Mesoproterozoic ore deposits may be a consequence of enhanced erosion of near-surface deposits that formed preferentially near active margins. This style of erosion was perhaps more characteristic of Rodinia than other supercontinents for two reasons. First, pre-collisional erosion of Rodinia may have been more aggressive than with other supercontinents, because the accretion of Rodinia is thought to have been both prolonged and “extrovert,” with assembly by two-sided subduction (Reference Cawood, Strachan, Pisarevsky, Gladkochub and Murphy54–Reference Cawood and Pisarevsky56). Such a tectonic context would have caused the loss of most volcanic-hosted massive sulfide deposits, which require rapid accretion of continental margins for preservation (Reference Bradley38). Furthermore, the major orogens associated with Rodinian assembly experienced cycles of collisional distension that must have led to enhanced deep erosion. These processes are reflected in the high regional metamorphic grade of many surviving rocks associated with two major Rodinian sutures: the Grenville and Sveconorwegian orogens (Reference Cawood and Hawkesworth20,Reference Hoffman and Grotzinger57–Reference Möller, Andersson, Dyck and Antal Lundin60). Thus, for example, the absence of Rodinian-age gold deposits likely reflects removal of the shallower loci of mineralization, whereas the enhanced production of Grenvillian fluvial sediments led to the abundance of detrital zircon crystals of that age (Reference Rainbird, Cawood and Gehrels61–Reference Spencer, Prave, Cawood and Roberts63) Consequently, the observed distribution and diversity of minerals during the period of Rodinian assembly reflects a unique combination of mineralization events and preservational biases.
20.2.4 Implications for the Carbon Cycle
Tectonic events such as supercontinent assembly and dispersal have direct effects on carbon cycling at Earth’s surface (Reference Brune, Williams and Müller64–Reference Aulbach, Creaser, Stachel, Heaman, Chinn and Kong66; Chapter 11, this volume). How might the distinct aggregation and breakup of Rodinia have influenced the carbon cycle and, related to this, redox conditions and life?
In principle, uplift and erosion associated with supercontinent assembly might have affected both atmospheric pCO2 and nutrient fluxes into the oceans. Denudation rates of modern active margins (e.g. New Zealand, Taiwan) were reported to be highest on continents/islands – orders of magnitude higher than mountain belts (e.g. Alps, Himalaya) and shields away from the coast (Reference von Blanckenburg67). The Rodinian supercontinent was proposed to be formed via closure of Pacific-type oceans (Reference Cawood, Hawkesworth and Dhuime62,Reference Silver and Behn68), with abundant active but rare passive continental margins (Reference Bradley38). On geologic timescales, continental erosion/weathering is the major sink for atmospheric CO2 (Reference Berner69), and the high erosion/weathering rate of Rodinian active margins could have sequestered CO2 more rapidly, paving the way for Neoproterozoic global glaciations (Reference Hoffman, Kaufman, Halverson and Schrag36). The fact that global ice ages postdate Rodinian assembly by more than 200 million years indicates that while Rodinian CO2 drawdown might have contributed to later Proterozoic climate change, other factors must be considered as well.
Enhanced weathering and erosion had the potential to increase P fluxes into the oceans, thus promoting primary production. For example, the later Mesozoic and Cenozoic uplift of major mountain belts appears to have impacted primary production, driving ecosystem-wide biological changes in the oceans (Reference Knoll and Follows70). In addition, enhanced formation of rapidly subsiding sedimentary basins during the Rodinian breakup might have increased rates of organic carbon burial, thereby contributing to Neoproterozoic oxygenation (Reference Knoll71).
We have several geochemical tools for exploring secular variations in carbon cycling, most notably the carbon isotopic record of carbonate and organic carbon (Reference Hayes and Waldbauer72). In addition, a variety of proxies permit inferences about changing redox conditions in the oceans and atmosphere (Reference Lyons, Reinhard and Planavsky73), and fossils record the course of early evolution (Reference Knoll74,Reference Knoll75). Interestingly, supercontinental events correlate only weakly with the carbon isotopic, paleo-redox, and fossil records. Rodinian assembly correlates with a moderate increase in the secular variation of carbon isotopes, following a long interval of near-invariant values (Reference Kah, Sherman, Narbonne, Knoll and Kaufman76), whereas a much larger amplitude of C-isotopic variations is associated with the Rodinian breakup and its aftermath (Reference Halverson, Hoffman, Schrag, Maloof and Rice77). Proxies for redox conditions show little change in association with either Rodinian assembly or breakup, perhaps because limited P availability (Reference Reinhard, Planavsky, Gill, Ozaki, Robbins and Lyons78) muted Earth system responses to these tectonic events. Global changes in oxygen levels and biological complexity occur only near the end of the Proterozoic Era, in association with a state change in P availability linked by some to climate rather than directly to tectonics (Reference Laakso and Schrag79).
Thus, at our present state of knowledge, the momentous tectonic events of Rodinian assembly and dispersal seem to have exerted only a limited influence on the surficial carbon cycle, with dispersal correlating more closely with enhanced organic carbon burial, perhaps minor oxygen enrichment, and protistan diversification (Reference Knoll75) than with supercontinent assembly.
20.3 Use Case #2: Carbon Mineral Evolution, Mineral Ecology, and Mineral Network Analysis
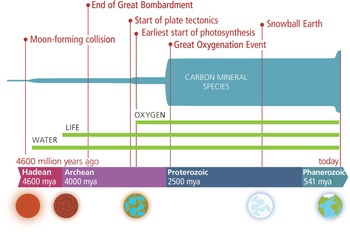
Data-driven exploration is built on open-access data resources and the application of advanced analytical and visualization techniques. Databases, such as that of the RRUFF Project (rruff.info), which includes information on all approved mineral species, and that of mindat.org, which documents species found at more than 300,000 localities with greater than 1,000,000 mineral/locality data, provide opportunities to explore mineral data with new analytical tools. The effects of preservational and/or sampling bias in these data are poorly understood and are the subject of further investigation. The DCO has seized this opportunity by facilitating significant advances in the accumulation, analysis, and visualization of mineral data – notably information housed in the MED related to the more than 400 approved carbon-bearing mineral species (Reference Hazen, Downs, Kah and Sverjensky80–Reference Morrison, Liu, Eleish, Prabhu, Li and Ralph82). As such, carbon minerals constitute an important test case for new approaches to mineralogy, while providing unique insights into the evolving roles of carbon through deep time (Figure 20.3).
Carbon mineral evolution timeline over 4.5 billion years. Carbon played a key role throughout this evolutionary path, with an explosion in carbon mineral diversity in the Proterozoic and Phanerozoic.

20.3.1 Carbon Mineral Evolution
Mineral evolution is the study of the changing diversity and distribution of minerals through deep time – the consequence of varied physical, chemical, and, in the case of Earth, biological processes (Reference Hazen, Bekker, Bish, Bleeker, Downs and Farquhar11,Reference Hazen, Papineau, Bleeker, Downs, Ferry and Mccoy83–Reference Zhabin85). Hazen et al. (Reference Hazen, Downs, Kah and Sverjensky80) surveyed carbon mineral evolution from a qualitative viewpoint, tracing changes in the nature and extent of carbon-bearing minerals through ten stages of Earth’s evolution. From the most primitive Stage 1, characterized by chondrite meteorites, which contain several carbide minerals and allotropes of carbon, to the thriving terrestrial biosphere of Stage 10, with more than 400 approved carbon mineral species, Earth’s 4.567-billion-year history saw significant increases in the diversity and complexity of C-bearing phases. The number of crystalline forms of C-bearing compounds has seen a dramatic rise with the creative contributions of chemists in the “Anthropocene Epoch” – an explosion of new mineral-like forms that some observers have dubbed “Stage 11” of Earth’s mineral evolution (Reference Zalasiewicz, Kryza and Williams86,Reference Hazen, Grew, Origlieri and Downs87).
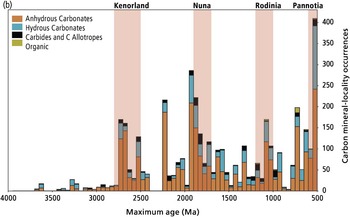
The development of the MED (Reference Golden, Pires, Hazen, Downs, Ralph and Meyer88), which tabulates 17,455 ages for C-bearing mineral/locality data (data as of May 21, 2018), facilitates a more quantitative examination of carbon mineral evolution. A detailed investigation of these minerals, including their paragenetic modes, associated species, geochemical contexts, tectonic settings, and other parameters, is beyond the scope of this chapter. However, an overview of the temporal distributions of C-bearing minerals reveals important physical, chemical, and biological processes that influence carbon mineralization. Figure 20.4 illustrates these newly expanded MED carbon mineral data.
The past 4 billion years with 50‑million-year bins.
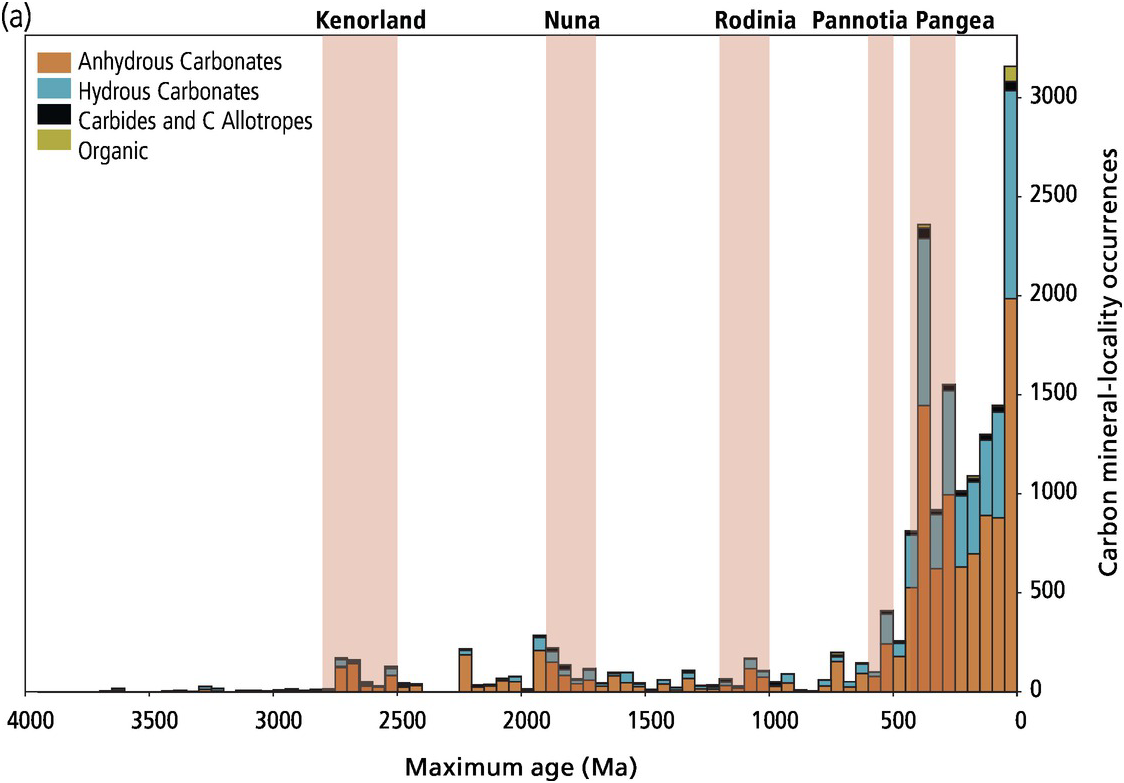
Precambrian occurrences (4.0 to 0.5 Ga) with 50‑million-year bins.

Neoproterozoic and Phanerozoic occurrences (760 to 0 Ma) with 20‑million-year bins. Anhydrous carbonates (orange, lowest segment), hydrous carbonates (blue, next lowest segment), other (i.e. diamond and carbides, black, next lowest segment), and organic minerals (green; topmost segment). Graphs are based on 17,455 mineral/locality/age data tabulated in the MED (rruff.info/ima; as of February 15, 2018). Note that this tabulation is based on mineral specimens collected from specific localities and does not include sedimentary carbonate formations.
The temporal distribution of carbon minerals reveals significant trends. As with most other groups of minerals, C-bearing species display striking episodicity, with pulses of mineralization as well as time intervals with few recorded carbon minerals. For example, significant maxima in preserved carbonate minerals are recorded at 2.75 to 2.70 Ga and at 2.55 to 2.50 Ga, with each interval having more than 150 points of reported carbon mineral/locality/age data. Those two 50-million-year intervals frame the assembly of Kenorland, the earliest well-documented supercontinent. By contrast, the 200-million-year interval from 2.45 to 2.25 Ga, a period of presumed Kenorland stability and generally low mineralization, has fewer than 20 total reported carbon mineral occurrences. As noted in Section 20.2, such a sharp contrast in numbers of mineral occurrences likely reflects a combination of episodic mineralization and preservational biases.
A similar contrast is observed for Nuna, the next widely recognized supercontinent episode in Earth’s history. Approximately 800 mineral/locality/age data are recorded for the 250-million-year period of presumed Nuna assembly from 1.95 to 1.70 Ga. By contrast, the 250-million-year interval of Nuna breakup from 1.60 to 1.35 Ga is represented by fewer than 250 reports of C-bearing minerals.
Though less dramatic, the assembly of Rodinia is also reflected in the carbon mineral record. Approximately 400 mineral/locality/age data are recorded for the assembly period from 1.1 to 0.9 Ga, as opposed to fewer than 20 data points from the subsequent 100-million-year interval from 0.9 to 0.8 Ga. As suggested in Section 20.2, the relatively modest mineral inventory from Rodinian assembly likely reflects significant erosional loss of near-surface (i.e. more carbonate-rich) deposits compared to Kenorland and Nuna.
Approximately 80% of reported carbon mineral occurrences in the MED are from the Phanerozoic Eon, which spans the last 540 million years when carbonate biomineralization became an important mode of near-surface carbon mineralization. The greater number of data from the Phanerozoic Eon allows a more detailed examination of carbon mineral evolution during the past 500 million years. Figure 20.4c underscores the nonuniform distribution of documented carbon mineralization during the past 600 million years. Of note is that almost 1700 mineral/locality/age data are recorded from the 20-million-year interval from 360 to 340 Ma, a time of the supercontinent Pangaea’s assembly, and thus a plausible time of enhanced mineralization and preservation.
An important concurrent event was the expansion of late Paleozoic ice sheets in Gondwana, a scenario linked to enhanced burial of organic matter associated with the evolution of trees and diversification of seed plants, stem group ferns, and lycopods. This interval was also notable for the 359 Ma Devonian–Mississippian boundary, which marks the last pulse of elevated extinctions that occurred through much of the Devonian Period. A notable degree of ecological reorganization also occurred in marine environments, including the complete turnover of rugose corals, a once-abundant order of corals that are now extinct, at the family level. It is not obvious how these paleobiological developments might have led to enhanced mineralization, although it is possible that at least some of the observed paleobiological events might reflect responses to tectonic events and their environmental consequences, as recorded by carbon mineral occurrences.
By contrast, the interval from 200 to 180 Ma is represented by fewer than 15 C-bearing mineral/locality/age data points worldwide. This 20-million-year period occurred at the beginning of Pangaea’s breakup and the opening of the modern Atlantic Ocean, a time characterized by tectonic conditions that might be associated with reduced carbon mineralization or deposition and enhanced erosional loss. The beginning of this interval corresponds to the end-Triassic mass extinction associated with massive volcanism, whereas a minor extinction event at 182 Ma is also associated with a large igneous province (Reference Ernst89). However, neither of these short intervals of species loss have obvious connections to the mineral record.
Note that the distribution of mineral occurrences during the Precambrian at 50-million-year intervals (Figure 20.4b) is not unlike the peak distributions of the Phanerozoic Eon at 20-million-year intervals (Figure 20.4c). An unresolved question in mineral evolution research is the extent to which the temporal distribution of mineral groups, including C-bearing species, is fractal; in other words, does the same pattern of mineral distribution repeat at finer and finer temporal scales? This question can only be answered by gathering many more mineral/locality/age data with the highest possible time resolution. We are currently limited to the 195,000 mineral/locality/age data compiled in the MED, but there are likely many more data yet to be extracted from the existing literature, as well as many rock and mineral samples that have yet to be analyzed. For instance, rock-forming minerals are particularly underrepresented in the MED simply due to sampling bias.
20.3.2 Carbon Mineral Ecology
Mineral ecology is the study of mineral diversity–distribution relationships of minerals at the global scale –an effort that depends on large and growing data resources on mineral species and their localities on Earth’s crust. Hazen et al. (Reference Hazen, Hummer, Hystad, Downs and Golden81) applied a large number of rare events (LNRE) formalism (Reference Hystad, Downs and Hazen90–Reference Hazen, Hystad, Downs, Golden, Pires and Grew93) to model the distribution of 403 approved mineral species of carbon. Using 82,922 mineral species/locality data tabulated in mindat.org (as of January 1, 2015), they demonstrated that all C-bearing minerals as well as several compositional subsets containing C conform to LNRE distributions.
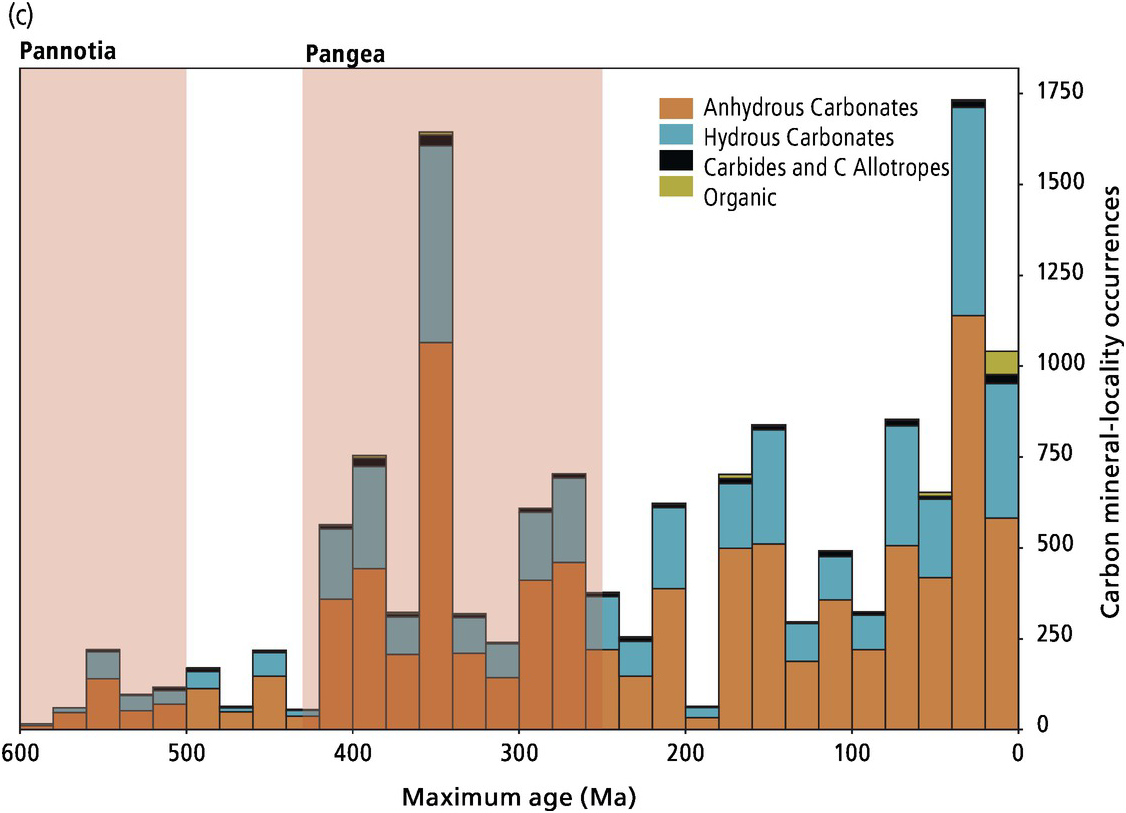
The LNRE model is particularly useful because it can be used to determine an “accumulation curve” – a formalism that enables estimations of the probability that the next carbon mineral/locality discovery will represent a new species (Figure 20.5). Figure 20.5a displays the frequency spectrum analysis for 403 C-bearing mineral species based on 82,922 individual mineral-locality data (from mindat.org as of January 2015). We found that 101 minerals – more than 25% of known C-bearing species – have been identified from only one locality worldwide. Another 42 species have been found at exactly two localities. Based on this information, we employed a Generalized Inverse Gauss–Poisson function to model the number of mineral species for minerals found at between 1 and 14 localities (Reference Hystad, Downs and Hazen90).
Frequency spectrum analysis of 403 C-bearing minerals, with 82,922 individual mineral-locality data (from mindat.org as of January 2015), employing a generalized inverse Gauss–Poisson (GIGP) function to model the number of mineral species for minerals found at between 1 and 15 localities (Reference Hystad, Downs and Hazen90).
This model facilitates the prediction of the mineral species accumulation curve (upper curve, “All”), plotting the number of expected C mineral species (y-axis) as additional mineral species-locality data (x-axis) are discovered. The vertical dashed line indicates data recorded as of January 2015 in mindat.org. The model also predicts the varying numbers of mineral species known from exactly one locality (curve 1) or from exactly two localities (curve 2). Note that the model predicts that the number of C-bearing mineral species known from only one locality is now decreasing, whereas the number from two localities is now increasing, though it will eventually decrease. We predict that the number of minerals known from two localities will surpass those known from one locality when the number of species-locality data exceeds ~400,000.
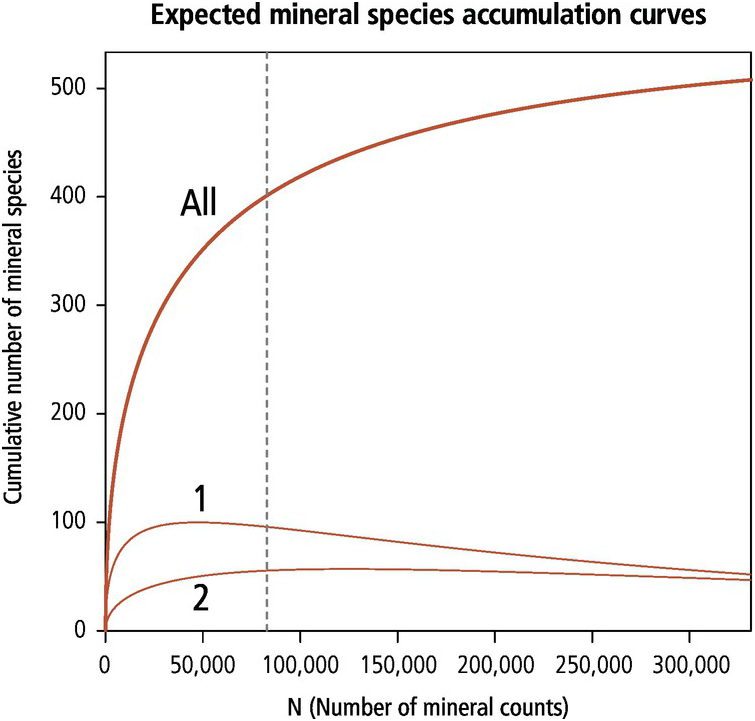
This LNRE model facilitated the prediction of the mineral species accumulation curve (Figure 20.5b). In Figure 20.5b, the upper curve (labeled “All”) plots the expected number of approved C mineral species (y-axis) as additional mineral species/locality data (x-axis) are discovered. The vertical dashed line indicates data recorded as of January 2015 in mindat.org. The model also predicts the varying numbers of mineral species known from exactly one locality (curve “1”) or from exactly two localities (curve “2”). Note that the model predicts that the number of C-bearing mineral species known from only one locality is now decreasing, whereas the number from two localities is now increasing, though it too will eventually decrease. We predict that the number of minerals known from exactly two localities will surpass those from one locality when the number of species-locality data exceeds ~400,000.
Employing this model, Hazen et al. (Reference Hazen, Hummer, Hystad, Downs and Golden81) predicted that at least 548 carbon mineral species occur in Earth’s crust today –a result that suggests at least 145 C-bearing minerals exist but have yet to be discovered. Additional hints regarding the nature of these “missing” carbon minerals are gleaned by analyzing compositional subsets of common additional elements in C-bearing minerals, including oxygen, hydrogen, calcium, and sodium. Accordingly, Hazen et al. (Reference Hazen, Hummer, Hystad, Downs and Golden81) predicted that 129 missing carbon minerals contain oxygen (primarily carbonates) and 118 species contain hydrogen (mostly hydrous carbonates). In addition, more than 50 of the missing species contain calcium, while more than 60 contain sodium. Additional studies of the distributions of known minerals according to their distinctive sizes, colors, crystal forms, and physical properties (Reference Hazen, Hystad, Downs, Golden, Pires and Grew93) suggest that many of the missing carbon minerals may have been overlooked because they are colorless, poorly crystalized, water soluble, and/or occur in minute grains. Similarly, these same factors are likely why nearly 35% of Na minerals have yet to be discovered and, conversely, why fewer than 20% of Cu, Mg, Ni, S, Te, U, and V minerals are still unknown (Reference Hazen, Hystad, Downs, Golden, Pires and Grew93). This powerful data-driven approach has allowed the systematic prediction and discovery of large numbers of previously unknown mineral species for the first time.
These newly applied data analytic methods have led to DCO’s Carbon Mineral Challenge (mineralchallenge.net), which enlists professional mineralogists and amateur mineral collectors around the world in the search for new species. More than 30 new carbon minerals – roughly 20% of the predicted total missing inventory – have been reported since January of 2016. Two of those species, abellaite (NaPb2(CO3)2(OH)) and parasite-(La) (CaLa2(CO3)3F2), were predicted as possible new carbon minerals by Hazen et al. (Reference Hazen, Hummer, Hystad, Downs and Golden81). Other new carbon species were not predicted. Of note is the organic mineral tinnunculite (C5H4N4O3.2H2O), which crystallizes when the excrement of the kestrel, Falco tinnunculus, bakes in the hot gases of a burning coal fire. Though tinnunculite was not anticipated by our analysis, we did predict that several new organic minerals would be included in the list of new finds.
Mineral ecology and data-driven approaches to predicting and discovering new mineral species (as well as valuable mineral resources identified using similar statistical approaches) are in their infancy. In addition to further studies of carbon mineral ecology on Earth, efforts concentrating outward, focusing on other planetary bodies, will be necessary. Some work has begun, including hypothesizing the mineral diversity of Saturn’s moon, Titan (Reference Maynard-Casely, Cable, Malaska, Vu, Choukroun and Hodyss94,Reference Hazen95). Maynard-Caseley et al. (Reference Maynard-Casely, Cable, Malaska, Vu, Choukroun and Hodyss94) propose a rich, diverse population of carbon minerals, specifically organic molecular minerals, on Titan’s frozen surface. The applications of such data-driven methods as cluster analysis, network analysis, and affinity analysis to mineral systems are poised to revolutionize the way we think about the diversity and distribution of minerals on Earth and other worlds by providing a more complete, multivariate understanding of these systems.
20.3.3 Carbon Mineral Network Analysis
Advances in data-driven discovery rely on application of creative analytical and visualization methods to complex multi-dimensional systems. Mineral network analysis (Reference Morrison, Liu, Eleish, Prabhu, Li and Ralph82) is a particularly powerful approach to understanding complex relationships among mineral species, their localities, paragenetic modes, and varied physical and chemical properties.
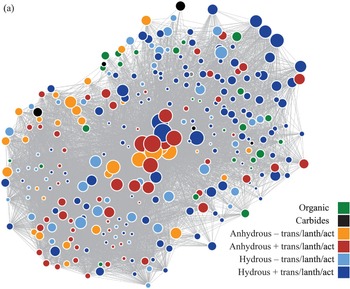
Figure 20.6a displays a force-directed network graph in which colored circles (nodes) indicate C-bearing mineral species, while lines between circles (edges) denote coexisting pairs of minerals. The sizes of nodes indicate the relative abundances of the minerals, while colors represent major C-bearing mineral groups. In this force-directed graph, each edge has an optimal length like a spring; edges are stretched or compressed to achieve a “lowest energy” state for the entire network. Similarly, Figure 20.6b shows a bipartite network of 403 C-bearing mineral species from approximately 300 mineralized regions on Earth. These graphs are interactive; each node can be clicked and dragged to more closely examine the number and nature of edges (see dtdi.carnegiescience.edu for interactive renderings).
Force-directed, unipartite network graphs of 403 C-bearing mineral species. Nodes represent C-bearing mineral species, while lines between nodes denote coexisting pairs of minerals. Node diameters indicate the relative abundances of the minerals, while colors represent compositional groups (dark blue = hydrous carbonates with transition elements, lanthanides, and/or actinides; light blue = hydrous carbonates without transition elements, lanthanides, and/or actinides; red = anhydrous carbonates with transition elements, lanthanides, and/or actinides; orange = anhydrous carbonates without transition elements, lanthanides, and/or actinides; black = carbon allotropes and carbides; green = organic minerals).

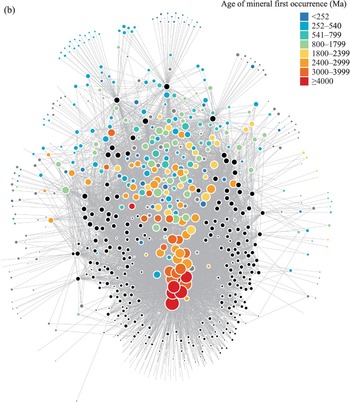
Force-directed, bipartite network of 403 C-bearing mineral species and their localities on Earth (see also http://dtdi.carnegiescience.edu/node/4557 for an interactive version). Colored nodes represent carbon mineral species, with node size corresponding to the frequency of occurrence and color corresponding to the age of earliest known occurrence of each mineral species. Black nodes represent regional localities, with diameter corresponding to the relative numbers of distinct C-bearing mineral species found at each locality. The network rendering reveals important information regarding the diversity and distribution of carbon minerals through space and time. In particular, the “U-shaped” distribution of black locality nodes, with a few very common carbon minerals “inside” and many more rare carbon minerals “outside,” is an alternative visual representation of the LNRE distribution illustrated in Figure 20.5.

An important characteristic of network visualizations is that they can be analyzed with numerous metrics, each of which quantifies aspects of the local and global distributions of nodes and links (Reference Abraham, Hassanien and Snasel96–Reference Newman98). For example, the carbon network (Figure 20.6a) has density D = 0.24 (i.e. 24% of all possible edges are present) – a value that is intermediate between those of copper minerals (D = 0.12) and igneous minerals (D = 0.64) (Reference Morrison, Liu, Eleish, Prabhu, Li and Ralph82). The network diameter, which measures the maximum degree of separation between any two network nodes, is d = 4, while the network affinity is a = 0.55.
One of the surprising findings related to networks of minerals is that they may embed information not coded into the network layout. For example, a slight chemical trend is visible in Figure 20.6a, with nearly all of the anhydrous carbonates not containing transition elements, lanthanides, and/or actinides (orange nodes) plotting on the left side of the network and the majority of the organics and hydrous carbonates containing transition elements, lanthanides, and/or actinides (green and purple nodes, respectively) plotting on the right. In Figure 20.6b, a few trends regarding the diversity and distribution of minerals in space and time are evident. First, the “U-shaped” distribution of black locality nodes, with a few very common carbon minerals “inside” and many more rare carbon minerals “outside,” is a visual representation of the LNRE distribution illustrated in Figure 20.5. Second, there is an embedded timeline, with the oldest minerals in the center of the locality “U” radiating outward as the mineral species’ age of first occurrence becomes younger.
Mineral network analysis, a direct outgrowth of interactions among diverse members of the DCO community, is in its infancy. We anticipate that open-access data resources, as well as freely available analytical and visualization software, will lead to a transformation in the ways that we study complex mineral systems on Earth and other worlds.
20.4 Use Case #3: Enzyme Evolution and the Environmental Control of Protein Expression
Microbes in Earth’s crust have played key roles in the carbon cycle throughout space and time (Reference Colwell and D’Hondt99; Chapters 17 and 18, this volume). In order to better understand “whole-Earth carbon,” we must examine the relationships among: (1) the physical and chemical characteristics of varied microbial environments (Chapters 16 and 19, this volume); (2) the metabolic strategies adopted by microbial consortia in these environments (Chapter 17, this volume); and (3) the consequent variation of microbial gene molecular function and expression (Chapter 18, this volume). The exploration of the complex interconnections among the physical, chemical, and biological aspects of microbial ecosystems represents an as yet unrealized opportunity for understanding the coevolving geosphere and biosphere.
A fundamental stumbling block in documenting the role of microbes in Earth’s carbon cycle through deep time is the lack of relevant data on the nature and expression of proteins in ancient microbial ecosystems. In spite of the occasional preservation of Precambrian microfossils, scant biomolecular traces survive in ancient rock formations (Reference Tashiro, Ishida, Hori, Igisu, Koike and Méjean100–Reference Stüeken, Buick, Anderson, Baross, Planavsky and Lyons102). Therefore, an understanding of the biochemical evolution of microbes might seem beyond our reach.
A promising strategy to understand aspects of the coevolution of geochemical and biochemical systems is based on the analysis of the large and growing data resources describing microbial ecosystems. Extant microbial communities span a wide range of physical and chemical environmental conditions (e.g. high and low pH, temperature extremes, high salinity and pressure, low consumable resource availability, and low water activity), some of which likely mimic a range of ancient conditions extending back to the dawn of life (Reference Giovannelli, Sievert, Hügler, Markert, Becher and Schweder103). While extant microorganisms living in these ecosystems are modern organisms that coevolved with our planet and adapted to its changing conditions, they still harbor ancestral metabolic traits. Consequently, today’s microorganisms contain both inherited traits as well as recently acquired ones.
Considering that ancient protein structures and functions are at least to some extent conserved in modern organisms, then modern analogs of presumed ancient environments may resemble life’s earliest enzymatic systems. For instance, extant strict anaerobes that inhabit anoxic, geothermal environments must have inherited the metabolic machinery necessary to conserve energy using redox couples abundant in geothermally influenced environments (e.g. hydrogen and sulfur) and to fix carbon dioxide of magmatic origin (Reference Giovannelli, Sievert, Hügler, Markert, Becher and Schweder103). These same organisms also must have acquired the ability to cope with reactive oxygen species in order to adapt as atmospheric oxygen levels on Earth increased over the last 700 million years. However, being unable to accurately differentiate new adaptations of older functions from truly new innovations complicates the process of reconstructing the emergence and evolution of metabolisms. The integration of large data sets obtained from the study of extant microorganisms and their protein structures, coupled with detailed environmental, geochemical, and mineralogical information, may allow us to better understand the emergence and evolution of microbial metabolism. In particular, it may provide new insights into how the geosphere and biosphere have coevolved, ultimately resulting in the complex network of metabolic reactions we see today (Reference Jelen, Giovannelli and Falkowski104,Reference Moore, Jelen, Giovannelli, Raanan and Falkowski105).
Here, we propose strategies for applying methods of data analysis and visualization in order to answer questions about microbial ecology, protein evolution, and their relationship to carbon mineralization through deep time.
20.4.1 Network Analysis of Protein Structures: Geo–Bio Interactions on Evolutionary Scales
Methods of network analysis are well suited to the exploration of the evolution of and relationship between protein structure and function (Reference Greene106–Reference Zhu, Mahlich, Miller, Bromberg and Fusion108). The combination of geochemically identifiable timescales with biologically determined timelines permits glimpses into the history of life on Earth. For example, Bromberg and colleagues have employed similarity networks to analyze relationships among the structures of nearly 4700 oxidoreductases from varied microbial and multicellular organisms. Since electron transfer reactions are necessary to fulfill the energy requirements of all life-forms, the ability to carry out redox reactions must have been among the first functions acquired by early life. Understanding the evolution of biological redox machinery can thus shine light on the history of life and on its interactions with Earth’s environment.
Ideally, the evolution of redox abilities could be traced through the analysis of the relevant enzyme sequences. However, the origins of biological redox, which likely correspond to the origins of life, as well as the dramatic environmental changes that have since taken place (e.g. the Great Oxidation Event and the “fold explosion” of protein structures), are ancient. This fact makes the exploration of the mutations in sequence space that led to the current biological “state of the art” nearly impossible (Reference Harel, Falkowski and Bromberg109,Reference Harel, Bromberg, Falkowski and Bhattacharya110). Protein three-dimensional structures, on the other hand, retain evolutionary evidence for significantly longer stretches of time. Note that the process of the divergent evolution of folded structures implies that existing folds emerged from prior ones. However, functionally similar folds may also arise independently via convergent evolution. Using network analysis, augmented by metrics of sequence similarity in structural alignments, it is possible to trace distant relations between redox proteins to estimate whether they have common ancestors or whether they developed independently.
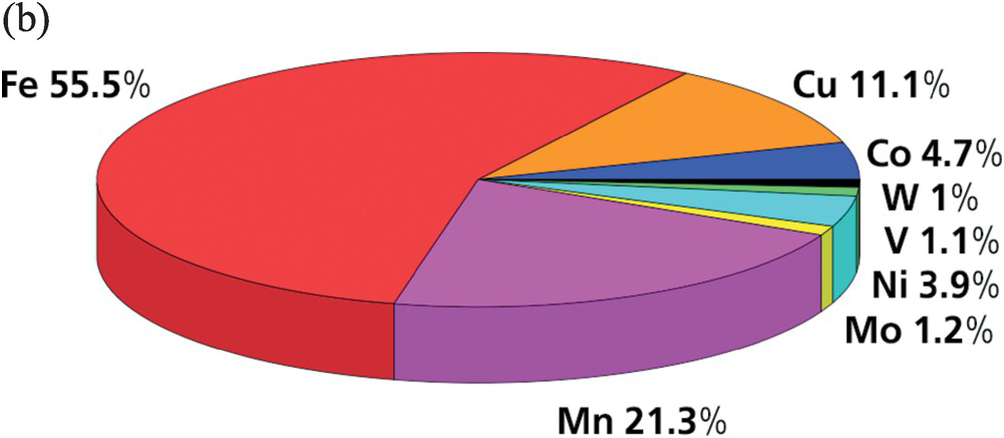
Bromberg et al. have created a method, sahle (structure-annotated homology, ligand-extended), for evaluating the reliability of structural similarity of transition metal binding sites in proteins, defined as spheres of 15-Å radius from the active metal-containing site (Reference Senn, Nanda, Falkowski and Bromberg111). A sahle score, ranged 0–100, gives weight to an edge between two spheres/nodes in the resulting network (Figure 20.7). The color of the nodes indicates the primary metal at the active site of a given sphere in a protein. Interestingly, network connectivity illustrates that the biological use of metals may be traceable through evolutionary time; in other words, the earliest proteins preferentially incorporated Fe, with later proteins using Mn and then Cu –the same sequence seen in the network graph – although metal information was not explicitly encoded in the network topology. This network reinforces previous findings from geochemistry (Reference Anbar and Knoll112) and biochemistry (Reference Jelen, Giovannelli and Falkowski104,Reference Moore, Jelen, Giovannelli, Raanan and Falkowski105) that suggest that Fe proteins are ancient, whereas Cu-bearing proteins evolved later, possibly related to the presence and bioavailability of Fe and Cu in Earth’s oceans through deep time (Reference Dupont, Lundve and Thorndyke113).
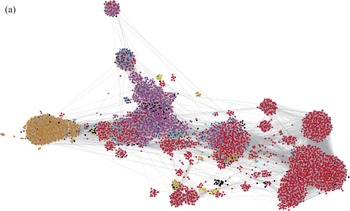
(a) Similarity network diagram of relationships among protein structures. The 4686 circular nodes represent oxidoreductases for which the three-dimensional structure is known. The linking and therefore distribution of nodes relates to similarities in protein fold structure in a 15-Å radius from the active metal-containing site. Nodes are colored according to the principal metal cation at the active site. Network connectivity illustrates that functional similarity of spheres may be traceable through evolutionary time (i.e. although metal information was not used in the building of this network, the time-related sequence Fe to Cu is embedded). This network indicates that Fe proteins are ancient, whereas Cu proteins evolved later. The pie chart (b) shows the relative abundance of metals in the graph.

An important finding of these and other network applications is that graphs of evolving systems (i.e. fossil taxa or mineral species) inevitably embed a time axis (Figure 20.8). This discovery points to possible data-driven approaches to gaining insights into the evolution of specific protein groups. For example, clustering of spheres in the network provides a means for reducing experimental bias in favor of generating a more naturally representative set of nodes and edges, which can be further used to build evolutionary trees of redox reactions on global timescales. These approaches can also inform synthetic biology, directing possible experimental mutagenesis efforts for designing and evaluating evolutionary intermediates that no longer exist in nature.
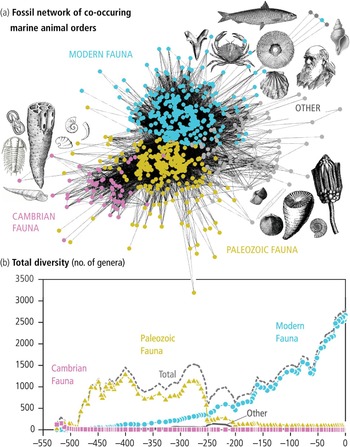
Networks that illustrate structural or coexistence relationships among individual members of an evolving system (i.e. mineral species, fossil taxa, or protein structures) inevitably embed a time axis, even though no age information is used in the generation of the graphs. (a) Phanerozoic fossil animals: nodes represent family-level taxa, while lines indicate coexisting fauna. The network was partitioned using the Louvain (multilayer) algorithm for community detection (138), resulting in the discovery of five modules, or “evolutionary paleocommunities.” An embedded time axis is visible from the Cambrian to modern fauna and each partition represents a major extinction event. (b) Plot of diversity (total number of genera) versus time for each of the modules in (a).

The inherent flexibility of network approaches allows for the incorporation of additional data, thus strengthening any inferences made. For example, as there are no protein fossils that can be used to establish dates of redox protein existence, one reliable piece of information that can be used for this purpose is transition metal availability, which would drive the selection of the molecular functionality necessary for life. By matching the currently existing microbiome molecular function (Reference Zhu, Miller, Marpaka, Vaysberg, Rühlemann and Wu114) and metal cofactor annotations with mineralogical and geochemical data, it is possible to reveal the relationships between the presence and abundance of specific enzymatic functionalities and metal availabilities. Functional annotations can thus be mapped to metal availability and, further, to the corresponding evolutionary age. Additionally, using machine learning techniques to recognize patterns in molecular function to metal availability relationships, it is likely possible to pinpoint any discrepancies between expectations and existing annotations, suggesting areas for more extensive research. As a result, protein structure networks, in combination with geochemical evidence, could provide a glimpse into the emergence and evolution of life on our planet and an understanding of the principles that could govern life on other planets.
20.4.2 Network Analysis of Extant Microbial Ecosystems: Geo–Bio Interactions on Ecological Scales
Investigations of the relationships between individual microbial taxa, microbiomes, and environmental conditions are complicated by the large number of contributing physical, chemical, and biological parameters, culminating in a complexity that is not easily representable by two-dimensional graphical methods. It has been suggested that new analytical techniques will be necessary to explore the large data sets produced by high-throughput DNA sequencing to discover new connections between microbiomes and the environment (Reference Barberán, Bates, Casamayor and Fierer115). Quantitative gene content analysis of terrestrial and marine microbial communities has already revealed habitat-specific fingerprints that reflect known characteristics of the sampled environments (Reference Tringe, Von Mering, Kobayashi, Salamov, Chen and Chang116). Metagenomic and amplicon sequencing of diverse environments and microbial communities are now paving the way toward outlining the global ecosystem network and the development of ecosystem-wide dynamic models (Reference Faust and Raes117,Reference Delgado-Baquerizo, Oliverio, Brewer, Benavent-González, Eldridge and Bardgett118).
Network analysis and machine learning can be used to investigate microbial communities from all types of ecosystems and are useful approaches for examining and determining patterns in large, complex data sets, and they provide predictive power in the absence of mechanistic models (Reference Barberán, Bates, Casamayor and Fierer115,Reference Weiss, Kapouleas, Shavlik and Dietterich119–Reference Proulx, Promislow and Phillips121). Since microbes are notoriously difficult to culture, the primary source of information on their diversity and evolution comes from the environmental distribution of microbiome data (Reference Lozupone and Knight122,Reference Solden, Lloyd and Wrighton123). Metagenomics – the study of genetic material obtained directly from environmental samples – has opened the door to the incredible diversity of microbial communities in the biosphere. The large-scale analysis of metagenomes, in concert with a wide range of environmental characteristics and geological diversity, will allow for the identification of unknown geo–bio interactions in the near future. This opportunity may lay the foundations for better understanding the geosphere and biosphere and their coevolution on this planet. As of the time of writing (January 2018), there were 6983 metagenomes available on the Department of Energy Joint Genome Institute public database (https://img.jgi.doe.gov), covering a variety of environments. Identifying relationships among physical and chemical parameters, such as temperature, pH, salinity, geochemistry, and the diversity in microbial communities, can reveal microbial responses to changing environmental conditions, and such information is critical to understanding microbial adaptations to different environments and their functions within those environments. Many studies have already shown the strong links between environmental conditions and microbial populations, a number of which did so with network analytical approaches (Reference Barberán, Bates, Casamayor and Fierer115,Reference Delgado-Baquerizo, Oliverio, Brewer, Benavent-González, Eldridge and Bardgett118,Reference Lozupone and Knight122,Reference Giovannelli, D’Errico, Fiorentino, Fattorini, Regoli and Angeletti124–Reference Ruff, Biddle, Teske, Knittel, Boetius and Ramette131). We suggest that the application of advanced analytical approaches to the microbial metagenomes and their corresponding environments, coupled with geochemical, geological, and mineralogical information, could transform the way we understand the role of microbial diversity in ecosystems.
Sharing and relating data sets between different disciplines, however, remains a great challenge. One way to deal with this challenge is through ensuring online availability of data. Currently, large amounts of sequenced data that represent a substantial portion of the total environmental diversity of Earth reside in online databases (e.g. MG-RAST, NCBI, JGI IMG, CAMERA). However, the quality of the associated metadata is generally low, with essential information like pH, temperature, salinity, redox state, and organic load often missing (Reference Gilbert132). Moreover, the links among sequence data, metadata, and any geochemical, geological, or other environmental data collected during the study are difficult or impossible to establish. Numerous attempts are being made by the scientific community to standardize the quality and type of metadata collected along with each sequenced sample in order to increase interoperative power. For example, efforts from the Genomic Standard Consortium (gensc.org) such as the Minimum Information about a Metagenomic Sequence (Reference Field, Garrity, Gray, Morrison, Selengut and Sterk133), initiatives like the Earth Microbiome Project (earthmicrobiome.org), and the release of metadata-curated metagenomes (Reference Pasolli, Schiffer, Manghi, Renson, Obenchain and Truong134) are pointing the metagenomics community in the right direction. Pioneering data sets of interdisciplinary, colocated data have been collected by the International Continental Drilling Programs (icdp-online.org), the International Ocean Discovery Program (iodp.org), and the DCO Integrated Field Site Initiatives (deepcarbon.net). These sampling programs will provide unprecedented environmental, geological, and geochemical metadata to analyze along with the associated metagenomes. Expansion of these efforts is crucial for advancing this important work in the future toward understanding geo–bio interactions on a global scale.
Our ability to generate predictive models of the relationships between -omic data and environmental data is further hindered by the varying data structures specific to the different fields of study (Reference Reed, Algar, Huber and Dick135,Reference Schimel136). The poor resolution of our current understanding of the relationship between functional diversity and redundancy, biodiversity, ecosystem roles, and niche partitioning also presents challenges. A possible way to overcome this problem is by using predictive models that are not linked to specific hypothesis but take advantage of big data approaches that allow data-driven discoveries. Tools such as network analysis and machine learning can identify hidden patterns in large-scale data and provide predictive power in the absence of mechanistic models (Reference Barberán, Bates, Casamayor and Fierer115,Reference Weiss, Kapouleas, Shavlik and Dietterich119–Reference Proulx, Promislow and Phillips121). Similar techniques have been used in metagenomic modeling to predict microbial assemblages and their metabolic properties (e.g. 113–115,137), and they can be applied to the investigation of the interaction between the geosphere and biosphere.
Recently, we have attempted a preliminary exploration of large-scale patterns in the relationships among oxidoreductase metalloproteins and the mineral diversity present at the same location (Figure 20.9). Based on publicly available metagenomic data from 40 randomly selected microbial ecosystems (including samples from shallow-water and deep-sea hydrothermal vents, hot springs, permafrost, mines, soils, arctic soils, marine sediments, and salt marshes), our analysis reveals distinct patterns in the association between specific metalloprotein functions and the mineral settings where those functions are commonly abundant. In particular, geochemistry and redox conditions govern oxidoreductase gene diversity distribution in the observed environments. The microbial communities of certain locations had few or no distinctively expressed oxidoreductase proteins within the network, thus exhibiting overlap with other communities with similar environmental conditions. However, microbial communities from most locations expressed unique oxidoreductases that were not present in the communities of the other environments. This information is crucial to understanding niche partitioning among environmental taxa and may reveal key details regarding how environmental conditions and metal availability shape microbial community function.
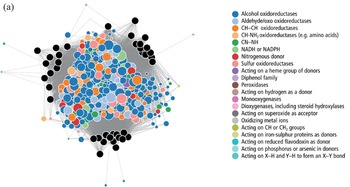
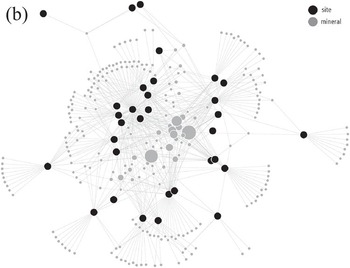
Bipartite networks of our preliminary analysis of geo–bio interactions based on 40 random metagenomes downloaded from MG-RAST and the mineral composition of the same site obtained from the Mindat database.
Bipartite network of the metalloprotein oxidoreductases (enzyme commission EC1 class) and the sites where they were found (in black). Enzyme nodes sized according to their counts and colored by their subclass.

Bipartite network of the mineral diversity at the same sites. Mineral nodes in gray, sized according to their mineral diversity; site nodes in black.

We expected a great deal of overlap in gene expression between the microbial populations of many environments as we observed in our initial analysis. These functions will shed light on the expected and unexpected core functions of diverse communities. Additionally, numerous genes that are exclusively expressed in particular environments or under distinctive physical/chemical conditions will reveal geo–bio interactions that evolved in systems that are ancient Earth analogs to the modern day. We conclude that expanding data resources on microbial communities and ecosystems and better integration with geochemical, mineralogical, and geological databases will provide opportunities for documenting the effects of environmental parameters on gene distribution and functional diversity.
20.5 Conclusions: The Future of Data-Driven Discovery
Among the DCO’s enduring legacies, and a tremendous opportunity for future advances, is the continued development and exploitation of data resources in the geosciences and biosciences. Our experiences over the decadal adventure of the DCO have convinced us that further advances in data-driven discovery will rest on three coequal pillars. The first ongoing demand is the creation and enhancement of comprehensive data resources, including those in geochemistry, petrology, mineralogy, paleobiology, paleotectonics, microbiology, proteomics, and other deep time aspects of carbon’s global cycles in space and time.
Hand in hand with database enhancement, we require the development and adaptation of established and new methods for data analysis and visualization. Ongoing advances include new techniques to exploit geochemical data, novel LNRE formulations designed for specific applications to mineralogical and paleobiological systems, modified approaches to visualizing networks of varied geological and biological systems, and applications of affinity analysis to Earth systems.
Thirdly, data-driven discovery will advance through continued creative application of data resources and analytical methods targeted to answer complex problems related to Earth’s evolution through space and time. Our ambitions for the coming years include: estimating the erosional bias of the ancient rock record from differential mineral preservation through deep time; investigating the completeness of the fossil record with LNRE methods applied to the Paleobiology Database (paleobiodb.org); creating interactive networks of all known mineral species, fossil genera, and microbes and their environmental contexts; and applying affinity analysis to the discovery of new mineral and ore deposits.
The DCO has fostered the beginning of the era of data-driven discovery in carbon mineral science and has promoted the collection and assembly of a wide range of data resources. The DCO has employed existing analytical and visualization methods while developing new approaches and has raised and refined a suite of fundamental questions about Earth’s carbon from crust to core – its forms, movements, quantities, and origins. Looking forward to the next decade of exploration, we predict that data-driven discovery will play an ever-greater role in our emerging understanding of carbon in Earth.
Acknowledgments
This chapter is a contribution of the Deep Carbon Observatory. This work was supported by the W.M. Keck Foundation’s Deep-Time Data Infrastructure project (dtdi.carnegiescience.edu), with additional support by the Alfred P. Sloan Foundation, the Templeton Foundation, a private foundation, the Carnegie Institution for Science, NASA NNX11AP82A – Mars Science Laboratory Investigations, and NSF grant MCB 15-17567. Any opinions, findings, and conclusions or recommendations expressed in this material are those of the authors and do not necessarily reflect the views of the National Aeronautics and Space Administration.
Questions for the Classroom
1 What are the “three pillars” of data-driven discovery and why are all three important?
2 What are some of the visualization methods that can enhance discovery and how many different parameters can be displayed simultaneously with each of these methods?
3 Why are time axes embedded in network graphs of evolving systems, even though no age information is used in the generation of these graphs?
4 What was “Rodinia” and what is the evidence for its unique signature in Earth’s history?
5 What are some of the preservational biases likely affecting the rock record and how do these biases scale with time?
6 How many carbon mineral localities are in the MED today and how many of those localities are dated? Which locality has the most carbon mineral species?
7 What are the biases in sampling the carbon minerals listed in the text and what are additional biases not covered in the chapter?
8 What is an LNRE distribution and why is it a useful model for mineral distributions?
9 To what other systems could you apply an LNRE model and associated accumulation curve?
10 What factors might be important in describing a microbial ecosystem, such as a community of microbes living beneath the ocean floor?
11 What is a metagenome and how is it sequenced? Why is shotgun metagenomics used instead of pure cultures?


 Open access