

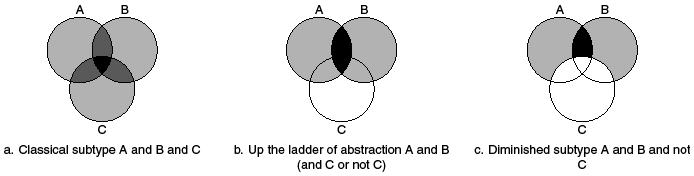
In a seminal article, Giovanni Sartori (Reference Sartori1970) explored the problem of “concept stretching.” His proposed solution was to omit an attribute from a definition in order to make it apply to a larger and more diverse set of cases. He hewed to a classical approach to conceptualization in which adding attributes to a concept – descending the ladder of abstraction – increased its intension (the richness and precision of its meaning) while limiting its extension (the set of objects to which it could be applied). The black area in Figure 5.1a represents the result of adding attribute C to the intersection of attributes A and B. Sartori argued that removing an attribute from the concept – ascending the ladder of abstraction, as in Figure 5.1b – necessarily broadened its extension and decreased its intension, sometimes leading to concept stretching. The discussion of diminished subtypes in the “Democracy with Adjectives” article (Collier and Levitsky Reference Collier and Levitsky1997, revised 2009 and again in this volume, Chapter 2) offers a useful corrective to Sartorian thinking about conceptualization, and the new version of “Democracy with Adjectives” (Collier and Levitsky Reference Collier, Levitsky, Collier and Gerring2009) further clarifies Sartori’s contribution. There is a crucial difference between identifying a diminished subtype (Figure 5.1c) and moving up the ladder of abstraction. Moving up the ladder entails moving from attributes “A and B and C” to “A and B and either C or not C.” Diminished subtypes entail moving from attributes “A and B and C” to “A and B and not C.” Diminished subtypes are more precise and do not necessarily increase the extension of a concept vis-à-vis the classical subtype, as it depends on how many cases belong to these two completely distinct subsets. It is interesting to note that moving up the ladder of abstraction yields the union (1b) of the mutually exclusive classical (1a) and diminished (1c) subtypes.
Both classical and diminished subtypes, however, are grounded in categorical thinking. Here I contrast them with the conceptual approach used by the Varieties of Democracy (V-Dem) project, which conceives of democracy as an aggregate of multiple continuous dimensions. Thus, the analysis achieves a high degree of granularity. I map conceptual innovations based on adding and removing attributes onto V-Dem’s continuous multidimensional framework. This mapping elucidates the strengths and weaknesses of each approach to conceptualization. The development of typologies was cutting edge for its time, but more is possible now.
Moving from a categorical approach and a continuous approach requires three steps: first, reconceptualizing attributes as thresholds on dimensions; second, removing the thresholds; and third, using different techniques to combine the dimensions. Examples using V-Dem data suggest that it is possible to create measurements of specific concepts that are both qualitatively rich and quantitatively precise. However, the measurement of very general concepts such as democracy, which may be useful for some broad-brush analyses, comes at the cost of some quantitative information and conceptual clarity.
From Categories to Dimensions with Thresholds
Conceptualization based on categorical thinking takes its inspiration from Sartori’s dictum, in his critique of the concept stretching in structural-functionalism, that “concept formation stands prior to quantification” (Sartori Reference Sartori1970, 1038). I do not believe that acknowledging the primacy of differences in kind logically requires focusing on categories to the exclusion of differences of degree, but scholars tend to take one road or the other. Perhaps it is true that “there may be said to be two classes of people in the world; those who constantly divide the people of the world into two classes, and those who do not” (Benchley Reference Benchley1920). Sartori paid lip service to quantification in his 1970 article, but he clearly preferred categories. Rather than quantify the number of political parties, for example, his elaborate counting rules resulted in a sevenfold typology of party systems rather than a count (Sartori Reference Sartori1976).
Thinking of attributes as continuous dimensions rather than membership in sets or categories requires setting aside categorical concepts, such as belonging to the set of “democracies,” and replacing them with different concepts, such as placement on a dimension ranging from democracy to nondemocracy. This was explicitly Robert Dahl’s approach in Polyarchy (Reference Dahl1971): identifying contestation and inclusiveness as two qualitatively distinct dimensions that jointly define degrees of polyarchy. If our concept development never leads to dimensional concepts, we are stuck endlessly dividing and subdividing categories. Not every categorical concept can be recast as a continuum, but many questions that researchers consider binary can be redefined as matters of degree. One might declare that an election either took place or it did not, but for some applications it is relevant to take into account how closely the election complied with the law, what proportion of the seats were uncontested, the extent to which votes were counted accurately, and how many winners were allowed to assume office. Researchers are free to declare that their concept is inherently categorical and that any continuous measure of it is invalid or riddled with error (Alvarez et al. Reference Alvarez, Cheibub, Limongi and Przeworski1996), but by doing so, they risk ignoring kinds of variation that are relevant to other observers and that could be useful for measurement.
In order to reconceptualize a category as a dimension, some additional conceptual work is needed beyond listing the attributes that are present at the positive pole of the concept. Gary Goertz (Reference Goertz2006, 30–35) argued that continuous concepts also require defining the negative pole and “theorizing the continuum” (specifying what changes as a case moves from one pole toward the other). Specifying these elements often requires choices. For example, what is the negative pole of “there is little or no self-censorship among journalists,” and what changes along this dimension: the proportion of journalists who self-censor? How common self-censorship is? The range of issues on which journalists self-censor? Defining these dimensions is conceptual innovation – a kind of precising (Collier and Levitsky Reference Collier and Levitsky1997).
Continuously defined attributes contain all the information contained in categories only when we add thresholds to them to distinguish between cases that belong to the top category and those that do not. Placing thresholds requires some judgment. If properly chosen, such thresholds would establish a one-to-one correspondence between the categorical definition and a definition based on continuous dimensions. However, adding thresholds can only detract from the continuous information because it reduces the variation within categories to a single value. The damage can be minimized to the degree that two conditions hold. First, if within-category variance is just noise, then losing that variation does no harm. Second, if values are tightly clustered in the center of the range of each category, then there is natural clustering that clearly separates ranges of values, and this clustering ensures that cases within categories are more similar to each other than to cases in other categories. In other words, less quantitative information is lost by using thresholds when cases are tightly clustered inside each category and distant from clusters of cases in other categories.
As a side note, it is important to observe at this point that the only way to assess whether these conditions are met by a particular indicator is to measure concepts continuously, which makes it possible to see how much clustering there is. Beginning with categorical measures deprives one of the more precise quantitative variation needed to ascertain whether clusters exist.
V-Dem makes it possible to examine whether the conditions that would justify categorizing in measures of democracy are met, as it provides continuous and ordinal versions of all the variables that are expert-coded (Coppedge et al. Reference Coppedge, Gerring and Knutsen2023a, Pemstein et al. Reference Pemstein, Marquardt and Tzelgov2023, Marquardt and Pemstein Reference Marquardt and Pemstein2018). It is unlikely that the variation within any possible category is pure noise. For example (not shown here), line graphs of trends in indicators show that the continuous version of V-Dem data can document gradual trends within a category, such as the gradual improvement in electoral management body capacity in Mexico from 1974 to 1989 even though all those values fall within the range of an ordinal score of 3.
Venn diagrams contrasting three set-based definitions.
Note: Black areas correspond to the property space of the subtype defined each way.

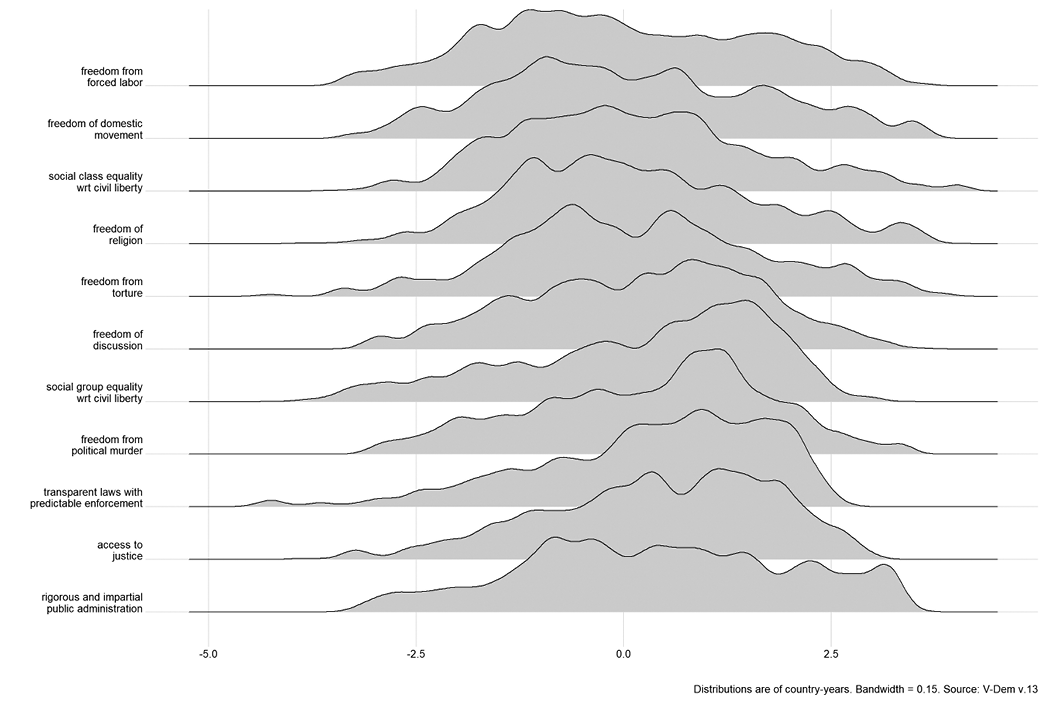
Moreover, there are not clusters that would define discrete categories. Figure 5.2 shows the distributions of continuous values for eleven of V-Dem’s measures of civil liberties. It should be immediately evident that although the distributions are somewhat lumpy, they are not clustered distinctly enough to divide the cases into discrete categories in any defensible way. Any proposed thresholds dividing categories are likely to be arbitrary.
Distributions of continuous scores on eleven civil liberties variables (nearly all countries, 1900–2022).
Some of the researchers at the V-Dem Institute in Gothenburg developed a “Regimes of the World” classification to meet a perceived need from the policy community (Lührmann, Tannenburg, and Lindberg Reference Lührmann, Tannenburg and Lindberg2018). This typology of liberal democracy, electoral democracy, electoral autocracy, and closed autocracy has been widely used, although it lacks the endorsement of the larger V-Dem project. The typology gives the impression that all cases of the same type are similar, and very different from all cases of other types. Yet often a country has more in common with countries just barely over the nearest threshold than it does with countries at the other end of its type. Figure 5.3 shows the range of the Liberal Democracy Index, which contains all of the variables used to define the typology, for each category of the typology (including intermediate categories that the creators recognize as ambiguous). The clusters are far from clear. In fact, 17.5 percent of the cases lie in ambiguous ranges between the four regime types (v2x_regime_amb). Taking such typologies seriously requires overzealous policing of arbitrary borders. Such typologies may help users feel that they understand the data better, but in fact they provide only the illusion of understanding.
Range of liberal democracy index for regimes of the world types, including ambiguous types.
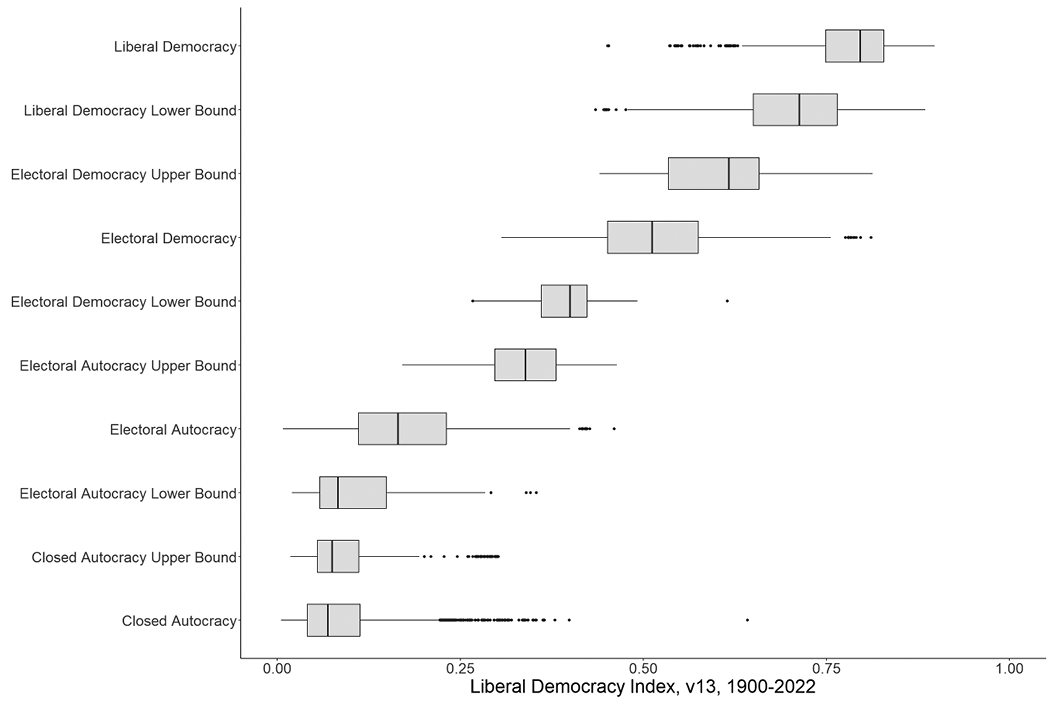
Figure 5.3 Long description
The box plot presents regime types: Liberal Democracy, Electoral Democracy (with upper and lower bounds), Electoral Autocracy (with upper and lower bounds), and Closed Autocracy (with upper and lower bounds). The X-axis is labeled “Liberal Democracy Index” ranging from 0.00 to 1.00, while the Y-axis lists the regime types. Each box represents the interquartile range, with horizontal lines indicating the median. The graph demonstrates a positive correlation with regimes placed lower having a lower liberal democracy index and regimes placed higher having a higher liberal democracy index.
An alternative justification for categorical measurement would be a claim that even attributes that vary on a continuum can have discontinuous consequences. For example, one might argue that there are phase changes in political regimes that are analogous to the rapid transitions of water from solid to liquid to gas as temperature rises continuously. Essentially, phase changes involve a tight relationship between a continuous attribute and a nominal or ordinal attribute. I doubt that the analogy is apt for democracy because there are few truly discrete attributes of democracy, and their relationship to the continuous attributes is not sufficiently tight. For example, 27 percent of the time, bans on political parties from 1900 to 2022 fail to predict whether elections were on course, even over the full span of the independent variable’s values.
Removing Thresholds
There are good reasons, then, to consider removing the thresholds. It may feel unsettling to lose the qualitative benchmarks that thresholds provide, as without them there are no discrete subtypes (diminished or otherwise). The cases that would belong to them simply become off-the-line cases: cases that deviate marginally from the expected relationship among dimensions. However, there are benefits to abandoning types and subtypes, beyond not having to defend them. First, continuous data make use of all the variation that can be measured, both within categories and across categories. Discarding fine-grained quantitative variation wastes potentially useful information that could help researchers to describe more precisely and get closer to inferences about causal mechanisms, which tend to operate at a microlevel. Second, when there are no thresholds separating cases that belong to a category from those that do not, increasing intension no longer decreases extension. Some cases’ scores differ, but they do not leave the sample. Dropping thresholds enables us to keep using all the data. There may be sound scope conditions that require not using all the data: Middle-range theory is still a good idea. However, dropping arbitrary conceptual thresholds prevents the unnecessary loss of cases to compare.
Furthermore, V-Dem offers three ways of using the continuous data without losing touch with differences of kind. First, its codebook is transparent and explicit, and the online graphing interfaces at v-dem.net display codebook definitions – the texts of questions, clarifications, and response categories – for every variable included in a graph. Second, the project makes available for download both interval and ordinal versions of all of the hundreds of expert-coded variables, which make it possible to ascertain the range of continuous values that correspond to each ordinal category. Third, its variable line graph interface by default plots the continuous measurement model values but also uses gridlines to separate the range of values corresponding to each codebook category. Users can see at a glance what the continuous variation is within categories as well as across them. In addition, because V-Dem rates so many countries and years, it is always possible to find a well-known prototype that can aid interpretation: “My case rated slightly worse than Germany in 1940,” for example.
Combining Dimensions
Once we remove thresholds, we can no longer think in terms of unions and intersections of categories, such as in cross-tabulation. What we can do is analyze covariance, using techniques such as correlations, principal component or factor analysis, or latent variables. Without membership in categories, combining dimensional attributes no longer results in a loss of extension. However, we can analyze the loss of variance. If we are, for example, combining two continuous variables into an index, each variable has a variance that measures the amount of quantitative information it contains. When the two variables are combined with factor analysis, the variance that is common to the two variables is preserved, but the unique variance of each variable is lost. The trade-off involved in combining dimensions is not between intension and extension but between intension and the retention of variance.
Thinking in terms of covariance between variables highlights a crucial point that applies to aggregations of both categorical and continuous attributes: The degree to which the aggregation of attributes leads to either reductions of extension or loss of variance depends on the correlations among attributes. It is possible that if the positive pole of a discrete concept is defined by many perfectly correlated attributes, its intension can be increased with no loss of extension or variance. Using continuous measures, we can thicken the meaning of an index by including more and more variables in it without losing information about the components as long as all the variables are perfectly correlated. With perfect correlation, knowing the score on one variable would reveal exactly what the score is on others. Of course, perfect correlations rarely occur in nature. It is the lack of perfect correlation that creates subtypes and the loss of variance when aggregating attributes into indices.
V-Dem data illustrate how these relationships work with continuous data. The project aggregates many specific variables to construct indices of thicker concepts and often aggregates indices to generate higher-level indices. The electoral democracy index contains five components, which are built from forty-three specific variables. The liberal democracy index uses three components and the electoral democracy index, for a total of sixty-six indicators. The deliberative, egalitarian, and participatory democracy indices draw on forty-eight, fifty-three, and eighty-six indicators, respectively. No qualitative conception of democracy considers such a detailed set of attributes. V-Dem’s high-level indices are both quantitative and conceptually richer and more detailed than any alternative.
How much information is lost in the construction of these indices? Again, it depends on how correlated their component variables are. As Table 5.1 shows, the freedom of expression and alternative sources of information index preserves the most information from specific indicators: It explains 85 percent of the variance in its nine component variables. The unique variances of these nine variables are left on the cutting-room floor. The five most general indices, of the five varieties of democracy V-Dem creates, preserve a great deal of the variance contained in the four components and the electoral democracy index. However, each level of aggregation explains less and less of the variance in the most specific indicators. They account for only 40 to 56 percent of the variance in the indicators used to construct them.
| Explained variance in … | ||||||
|---|---|---|---|---|---|---|
| Components | Sub components | Indicators | ||||
| k | percent | k | percent | k | Percent | |
| Liberal democracyFootnote * | 2 | 93% | 8 | 67% | 66 | 52% |
| Liberal componentFootnote * | 3 | 83% | 23 | 64% | ||
| Equality before the law and individual liberty | 14 | 69% | ||||
| Legislative constraints on the executive | 4 | 81% | ||||
| Judicial constraints on the executive | 5 | 76% | ||||
| Participatory democracyFootnote * | 2 | 94% | 9 | 62% | 65 | 40% |
| Participatory componentFootnote * | 4 | 59% | 22 | 30% | ||
| Civil society participation | 4 | 63% | ||||
| Direct popular vote (indicators with N>10k)Footnote * | 12 | 32% | ||||
| Local government | 3 | 78% | ||||
| Regional government | 3 | 82% | ||||
| Egalitarian democracyFootnote * | 2 | 88% | 8 | 68% | 53 | 48% |
| Egalitarian componentFootnote * | 3 | 86% | 10 | 67% | ||
| Equal distribution of resources | 4 | 78% | ||||
| Equal access | 3 | 76% | ||||
| Equal protection | 3 | 74% | ||||
| Deliberative democracyFootnote * | 2 | 94% | NA | 48 | 47% | |
| Deliberative componentFootnote * | 5 | 83% | ||||
| Electoral democracy (indicators with N>10k)Footnote * | NA | 5 | 72% | 33 | 56% | |
| Freedom of association | 6 | 81% | ||||
| Freedom of expression and alternative sources of information | 9 | 85% | ||||
| Clean elections | 8 | 67% | ||||
| Elected officialsFootnote * | 9 | 21% | ||||
| Suffrage | 1 | 100% | ||||
* Indices that V-Dem does not aggregate by Bayesian factor analysis.
Percentages are the percentage of the variance that is explained by the first principal component. These figures differ marginally from percentages explained by the first factor in the Bayesian factor analyses used by V-Dem. “k” is the number of components, subcomponents, or indicators used in each analysis. The sample size varies across analyses owing to missing data, largely due to years without elections or a legislature.
Because the indices are constructed from variables that are not perfectly correlated, the index scores have somewhat ambiguous interpretations in the sense that the aggregated score does not reveal exactly what the scores of all the variables are. However, for the indices that are very unidimensional such as legislative constraints, regional government, the deliberative component, and freedom of association, all the variables would be found within a small range. V-Dem’s interactive line graphs also provide a feature that helps users discover which variables are responsible for the value of an index. In any line graph of an index, clicking on the index line drills down to the variables that comprise the index, making it easy to see which ones have high or low values or are trending up or down.
When indicators are believed to measure a concept but are only weakly correlated, the concept is empirically multidimensional. In such instances, V-Dem provides a theoretical justification for a more complex aggregation formula. For instance, Table 5.1 shows that the nine variables considered relevant for constructing the elected officials index share only 21 percent of their variance. The formula V-Dem uses to combine them operationalizes the reasoning that officials are as “elected” as the most “elected” procedure of selecting the legislators and the most powerful chief executive (Coppedge et al. Reference Coppedge, Gerring and Glynn2020: 92–93). Another example is the electoral democracy index, which is treated as multidimensional because the contributions of some components to election democracy are to some extent conditional on other components and to some extent components compensate for one another. V-Dem therefore calculates both a multiplicative and a weighted average additive polyarchy index, and averages them. This same formula is used to combine electoral democracy with the liberal, participatory, egalitarian, and deliberative components to create the other four high-level indices (Coppedge et al. Reference Coppedge, Gerring and Glynn2020: chap. 5).
Aggregating all of the indicators into a single big-D index of Democracy as though they were unidimensional would retain only 57 percent of the variance; 43 percent would be lost. This trade-off suggests that we pay a steep price if we try to reduce democracy to a single dimension. A single dimension of democracy is still somewhat meaningful and useful, but there is so much more that we could learn if we ended our collective fixation on a vague, narrow, reductionist notion of democracy and focused instead on its many revealing components.
We have come a long way from the premature quantification and rampant concept stretching that Sartori decried in 1970. V-Dem shows that, in democracy measurement, we can respect qualitative differences of kind by conceptualizing multiple dimensions, while measuring differences of degree by measuring each of those dimensions as a continuum. We can also move up the ladder of abstraction to some extent without losing information, to the degree that dimensions are correlated.
In fact, the V-Dem Institute has repeatedly used this approach in a series of spin-off projects to measure a widening range of concepts. They include Historical V-Dem (extending back to 1789, including many concepts about the state), the Digital Society Project (on the use of social media for political influence), Academic and Civic Space (academic freedom, pro- and antidemocracy protests, inclusion and exclusion, and polarization), Regime Legitimation (how governments attempt to justify their authority), the Pandemic Backsliding Project, Varieties of Autocracy and Autocratization, V-Party (data on orientations of political parties historically and around the world, with special attention to populism and anti-pluralism), and Varieties of Indoctrination (political socialization through education).


 Open access