To save content items to your account,
please confirm that you agree to abide by our usage policies.
If this is the first time you use this feature, you will be asked to authorise Cambridge Core to connect with your account.
Find out more about saving content to .
To save content items to your Kindle, first ensure no-reply@cambridge.org
is added to your Approved Personal Document E-mail List under your Personal Document Settings
on the Manage Your Content and Devices page of your Amazon account. Then enter the ‘name’ part
of your Kindle email address below.
Find out more about saving to your Kindle.
Note you can select to save to either the @free.kindle.com or @kindle.com variations.
‘@free.kindle.com’ emails are free but can only be saved to your device when it is connected to wi-fi.
‘@kindle.com’ emails can be delivered even when you are not connected to wi-fi, but note that service fees apply.
Modern statistical methods use complex, sophisticated models that can lead to intractable computations. Saddlepoint approximations can be the answer. Written from the user's point of view, this book explains in clear language how such approximate probability computations are made, taking readers from the very beginnings to current applications. The core material is presented in chapters 1-6 at an elementary mathematical level. Chapters 7-9 then give a highly readable account of higher-order asymptotic inference. Later chapters address areas where saddlepoint methods have had substantial impact: multivariate testing, stochastic systems and applied probability, bootstrap implementation in the transform domain, and Bayesian computation and inference. No previous background in the area is required. Data examples from real applications demonstrate the practical value of the methods. Ideal for graduate students and researchers in statistics, biostatistics, electrical engineering, econometrics, and applied mathematics, this is both an entry-level text and a valuable reference.
This book was first published in 2004. Many observed phenomena, from the changing health of a patient to values on the stock market, are characterised by quantities that vary over time: stochastic processes are designed to study them. This book introduces practical methods of applying stochastic processes to an audience knowledgeable only in basic statistics. It covers almost all aspects of the subject and presents the theory in an easily accessible form that is highlighted by application to many examples. These examples arise from dozens of areas, from sociology through medicine to engineering. Complementing these are exercise sets making the book suited for introductory courses in stochastic processes. Software (available from www.cambridge.org) is provided for the freely available R system for the reader to apply to all the models presented.
This practical guide to survival data and its analysis for readers with a minimal background in statistics shows why the analytic methods work and how to effectively analyze and interpret epidemiologic and medical survival data with the help of modern computer systems. The introduction presents a review of a variety of statistical methods that are not only key elements of survival analysis but are also central to statistical analysis in general. Techniques such as statistical tests, transformations, confidence intervals, and analytic modeling are presented in the context of survival data but are, in fact, statistical tools that apply to understanding the analysis of many kinds of data. Similarly, discussions of such statistical concepts as bias, confounding, independence, and interaction are presented in the context of survival analysis and also are basic components of a broad range of applications. These topics make up essentially a 'second-year', one-semester biostatistics course in survival analysis concepts and techniques for non-statisticians.
This self-contained book is a graduate-level introduction for mathematicians and for physicists interested in the mathematical foundations of the field, and can be used as a textbook for a two-semester course on mathematical statistical mechanics. It assumes only basic knowledge of classical physics and, on the mathematics side, a good working knowledge of graduate-level probability theory. The book starts with a concise introduction to statistical mechanics, proceeds to disordered lattice spin systems, and concludes with a presentation of the latest developments in the mathematical understanding of mean-field spin glass models. In particular, progress towards a rigorous understanding of the replica symmetry-breaking solutions of the Sherrington-Kirkpatrick spin glass models, due to Guerra, Aizenman-Sims-Starr and Talagrand, is reviewed in some detail.
This book was first published in 2003. Derived from extensive teaching experience in Paris, this book presents around 100 exercises in probability. The exercises cover measure theory and probability, independence and conditioning, Gaussian variables, distributional computations, convergence of random variables, and random processes. For each exercise the authors have provided detailed solutions as well as references for preliminary and further reading. There are also many insightful notes to motivate the student and set the exercises in context. Students will find these exercises extremely useful for easing the transition between simple and complex probabilistic frameworks. Indeed, many of the exercises here will lead the student on to frontier research topics in probability. Along the way, attention is drawn to a number of traps into which students of probability often fall. This book is ideal for independent study or as the companion to a course in advanced probability theory.
Based on the author's experience of teaching final-year actuarial students in Britain and Australia, and suitable for a first course in insurance risk theory, this book focuses on the two major areas of risk theory - aggregate claims distributions and ruin theory. For aggregate claims distributions, detailed descriptions are given of recursive techniques that can be used in the individual and collective risk models. For the collective model, different classes of counting distribution are discussed, and recursion schemes for probability functions and moments presented. For the individual model, the three most commonly applied techniques are discussed and illustrated. Care has been taken to make the book accessible to readers who have a solid understanding of the basic tools of probability theory. Numerous worked examples are included in the text and each chapter concludes with exercises, which have answers in the book and full solutions available for instructors from www.cambridge.org/9780521846400.
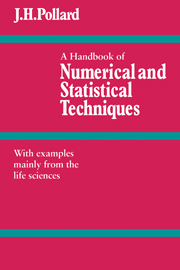
This handbook is designed for experimental scientists, particularly those in the life sciences. It is for the non-specialist, and although it assumes only a little knowledge of statistics and mathematics, those with a deeper understanding will also find it useful. The book is directed at the scientist who wishes to solve his numerical and statistical problems on a programmable calculator, mini-computer or interactive terminal. The volume is also useful for the user of full-scale computer systems in that it describes how the large computer solves numerical and statistical problems. The book is divided into three parts. Part I deals with numerical techniques and Part II with statistical techniques. Part III is devoted to the method of least squares which can be regarded as both a statistical and numerical method. The handbook shows clearly how each calculation is performed. Each technique is illustrated by at least one example and there are worked examples and exercises throughout the volume.
When is a random network (almost) connected? How much information can it carry? How can you find a particular destination within the network? And how do you approach these questions - and others - when the network is random? The analysis of communication networks requires a fascinating synthesis of random graph theory, stochastic geometry and percolation theory to provide models for both structure and information flow. This book is the first comprehensive introduction for graduate students and scientists to techniques and problems in the field of spatial random networks. The selection of material is driven by applications arising in engineering, and the treatment is both readable and mathematically rigorous. Though mainly concerned with information-flow-related questions motivated by wireless data networks, the models developed are also of interest in a broader context, ranging from engineering to social networks, biology, and physics.
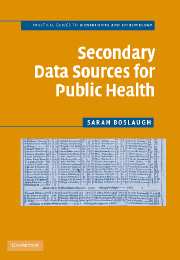
Secondary data play an increasingly important role in epidemiology and public health research and practice; examples of secondary data sources include national surveys such as the BRFSS and NHIS, claims data for the Medicare and Medicaid systems, and public vital statistics records. Although a wealth of secondary data is available, it is not always easy to locate and access appropriate data to address a research or policy question. This practical guide circumvents these difficulties by providing an introduction to secondary data and issues specific to its management and analysis, followed by an enumeration of major sources of secondary data in the United States. Entries for each data source include the principal focus of the data, years for which it is available, history and methodology of the data collection process, and information about how to access the data and supporting materials, including relevant details about file structure and format.
Chapter Preview. This chapter introduces regression where the dependent variable is the time until an event, such as the time until death, the onset of a disease, or the default on a loan. Event times are often limited by sampling procedures and so ideas of censoring and truncation of data are summarized in this chapter. Event times are nonnegative and their distributions are described in terms of survival and hazard functions. Two types of hazard-based regression are considered, a fully parametric accelerated failure time model and a semiparametric proportional hazards models.
Introduction
In survival models, the dependent variable is the time until an event of interest. The classic example of an event is time until death (the complement of death being survival). Survival models are now widely applied in many scientific disciplines; other examples of events of interest include the onset of Alzheimer's disease (biomedical), time until bankruptcy (economics), and time until divorce (sociology).
Example: Time until Bankruptcy. Shumway (2001) examined the time to bankruptcy for 3,182 firms listed on Compustat Industrial File and the CRSP Daily Stock Return File for the New York Stock Exchange over the period 1962–92. Several explanatory financial variables were examined, including working capital to total assets, retained earnings to total assets, earnings before interest and taxes to total assets, market equity to total liabilities, sales to total assets, net income to total assets, total liabilities to total assets, and current assets to current liabilities. The dataset included 300 bankruptcies from 39,745 firm years.
Chapter Preview. This chapter extends the discussion of multiple linear regression by introducing statistical inference for handling several coefficients simultaneously. To motivate this extension, this chapter considers coefficients associated with categorical variables. These variables allow us to group observations into distinct categories. This chapter shows how to incorporate categorical variables into regression functions using binary variables, thus widening the scope of potential applications. Statistical inference for several coefficients allows analysts to make decisions about categorical variables and other important applications. Categorical explanatory variables also provide the basis for an ANOVA model, a special type of regression model that permits easier analysis and interpretation.
The Role of Binary Variables
Categorical variables provide labels for observations to denote membership in distinct groups, or categories. A binary variable is a special case of a categorical variable. To illustrate, a binary variable may tell us whether someone has health insurance. A categorical variable could tell us whether someone has
Private group insurance (offered by employers and associations),
Private individual health insurance (through insurance companies),
Public insurance (e.g., Medicare or Medicaid) or
No health insurance.
For categorical variables, there may or may not be an ordering of the groups. For health insurance, it is difficult to order these four categories and say which is larger. In contrast, for education, we might group individuals into “low,” “intermediate,” and “high” years of education.
Chapter Preview. Many datasets feature dependent variables that have a large proportion of zeros. This chapter introduces a standard econometric tool, known as a tobit model, for handling such data. The tobit model is based on observing a left-censored dependent variable, such as sales of a product or claim on a health-care policy, where it is known that the dependent variable cannot be less than zero. Although this standard tool can be useful, many actuarial datasets that feature a large proportion of zeros are better modeled in “two parts,” one part for frequency and one part for severity. This chapter introduces two-part models and provides extensions to an aggregate loss model, where a unit under study, such as an insurance policy, can result in more than one claim.
Introduction
Many actuarial datasets come in “two parts:”
One part for the frequency, indicating whether a claim has occurred or, more generally, the number of claims
One part for the severity, indicating the amount of a claim
In predicting or estimating claims distributions, we often associate the cost of claims with two components: the event of the claim and its amount, if the claim occurs. Actuaries term these the claims frequency and severity components, respectively. This is the traditional way of decomposing two-part data, where one can consider a zero as arising from a policy without a claim (Bowers et al., 1997, Chapter 2).