

Archaeological sampling decisions shape not only what we recover from the ground but also what we can confidently infer about past behavior. Yet despite its importance, sampling remains one of the most inconsistently practiced components of archaeological fieldwork (Banning Reference Banning2021). It is often treated as a matter of habit, logistics, or convention rather than as an integral part of deliberate research design and evaluation. This has serious implications across archaeological contexts, but it is particularly consequential in applications like spatial microrefuse analysis, in which labor-intensive recovery and analysis amplify the costs (both monetary and analytical) of poor sampling decisions.
Microrefuse analysis offers archaeologists a high-resolution means of studying long-term patterns in domestic space use through the material residues of daily life. These microremains are often more stable than larger artifacts in the face of cultural and natural disturbances and are typically abundant enough to support statistically meaningful interpretation (Dunnell and Stein Reference Dunnell and Stein1989). Yet this potential comes at a cost: the labor involved in collecting, processing, and analyzing microrefuse remains substantial. Although recent innovations, such as automated sorting (Eberl et al. Reference Eberl, Johnson and Aguila2022) and distributed counting systems (Ullah et al. Reference Ullah, Duffy and Banning2015), have improved postexcavation efficiency, the front-end problem of sampling design has received far less attention. This has perpetuated stereotypes that microrefuse analysis is too laborious.
This article addresses that gap by asking two important questions: (1) What are the most common ways that archaeologists sample for spatial microrefuse analysis? (2) How effective are these common microrefuse sampling strategies? To answer the first question, I review 27 published spatial microrefuse studies to determine trends in how archaeologists sample for this material. To answer the second question, I created the Archaeological Sampling Experiment Laboratory (tASEL) and use it to conduct a series of simulation experiments about current sampling methods. Simulation approaches, such as that provided by tASEL, enable users to iteratively evaluate different sampling strategies against realistic artifact distributions and to visualize the statistical consequences of their choices. Finally, I bring the literature review and simulation experiments together to examine how simulation modeling can improve both planning and pedagogy related to sampling in our discipline. Although the focus here is on spatial microrefuse analysis, the problems revealed by these analyses are broadly relevant to most aspects of archaeological sampling—as are the tools and techniques that I suggest can fix them. The goal is not only to support smarter sampling for microrefuse analysis but also to offer a practical framework for improving archaeological sampling literacy more generally.
How Are Microartifacts Sampled by Archaeologists?
Despite decades of research, no standardized field or laboratory methodology exists for microrefuse sampling. This lack of consistency undermines both the interpretive quality and comparability of analyses, making it difficult to identify spatial patterns or confidently reconstruct past behavior. To understand how archaeologists have been sampling for microrefuse, I compiled and reviewed a corpus of 27 published microrefuse studies conducted between 1982 and 2025, examining trends in unit size, sample volume, sampling strategy, and reporting (Tables 1–4). I created the sample set of studies using an advanced keyword search in Google Scholar with the search string “microrefuse OR micro-refuse OR microartifact OR microartifacts OR micro-artifact OR micro-artifacts OR microdebris OR micro-debris AND archaeology”; it enabled me to retrieve peer-reviewed journal articles, edited volume chapters, dissertations, and theses matching the search terms sorted by date. I assessed each item for initial relevance by reviewing its abstract, keeping those with a clear focus on spatial microrefuse sampling. The full text of these items was accessed via online electronic copies or hard copies in my university library, or they were retrieved by interlibrary loan. Less than five of the potentially relevant items could not be retrieved and were therefore excluded. Items not published in English or in sources not indexed by Google Scholar may also have been missed. I reviewed the full text of each document, including those that reported at least one of the relevant sampling dimensions—sample unit type, sampling strategy type, sample unit size, sampled volume, or number of samples—and recorded these values in a spreadsheet. When more than one published document referred to the same research (same sample or analysis), I used the most comprehensive or recent item as the main reference for that study.
Summary of Sampling Methods Reported in 27 Published Microrefuse Studies, 1982–2025.

Notes: Included are details on the size and shape of sampling units, sediment volumes collected, sampling coverage strategies, and the total number of processed samples. When more than one publication referred to the same analysis, I considered these to be the same study and used the earliest publication as the reference in the table.
Summary of Sample Gathering Methods Used in the 27 Reviewed Microrefuse Studies.

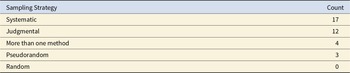
Summary of Sampling Strategies Reported in the 27 Reviewed Microrefuse Studies.

Note: Methods were counted for each occurrence, even if another method was used in the same study. The number of studies that used more than one method is reported as a separate line in the table.
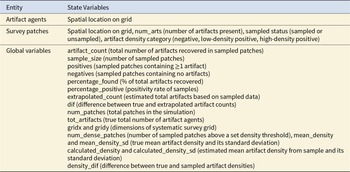
Model Entities and Their State Variables in tASEL.

I standardized the reported sample unit areas (cm2) and sediment volumes (mL) to enable direct comparison in Table 1 and plotted the sample area, sample volume, and number of samples processed in Figure 1A, 1B, and 1C, respectively. When sample sizes were reported in units of mass, I converted these to volumetric measures using a soil density of 1g/mL. In these cases, total sample volume must be considered approximate without direct knowledge of specific sediment densities. The distribution of these three sampling measures is extremely right-skewed, indicating the presence of a few large outliers such as Rainville’s (Reference Rainville2000, Reference Rainville2005) study (Figure 1). Because the distribution is skewed, median values are a more appropriate measure of central tendency than mean values, and the standard deviations are inflated. The median sample unit area across these studies is 2,500 cm2, which can be seen on a histogram illustrating sample unit areas (Figure 1A). This likely corresponds to the common use of 50 × 50 cm squares. Sample volumes also exhibited high variability, with a median value of 1,000 mL, with most studies using volumes of 2 L or less (Figure 1B). The median sample size is 48.5, although the histogram of sample counts shows no strong modal pattern (Figure 1C). This indicates that the sample count is the least standardized component of sampling practice across the different studies.
Summary of sampling methods from 27 published microrefuse studies (1982–2021), highlighting the variability and inconsistency in sampling practices. Shown are (A) sample unit areas, (B) sediment volumes collected per sample, and (C) the total number of samples processed.

Most studies used either square sampling grids or discrete square sampling units; others employed “pinch” samples (small-volume point samples) or irregularly shaped grids or sampling units, and some did not report their sampling methods (Table 2). Systematic (units selected at regular spatial intervals) and judgmental (units chosen based on expert assessment rather than probabilistic rules) sampling strategies were most common, distantly followed by pseudorandom (units placed using an ordered or partially randomized procedure that is not fully probabilistic) and mixed approaches (combinations of systematic, pseudorandom, or judgmental elements; see Table 3). Notably, no study applied true random sampling. This diversity reinforces the absence of shared methodological standards.
These patterns of sampling are consistent with the hypothesis that sampling strategies employed for microrefuse analyses are not purpose-specific. One likely possibility is that microrefuse sampling strategies tend to be inherited from broader excavation practice, with limited adjustment to the distinct spatial and volumetric characteristics of microartifacts. Sampling frames are commonly selected for logistical ease over statistical rigor, and the number of samples processed seems to reflect available field and laboratory labor, rather than any formal calculation of sampling sufficiency. These patterns echo Banning’s (Reference Banning2021) broader critique of archaeological sampling, which has largely moved away from probability-based approaches despite ongoing claims to representativeness. He notes that most archaeologists now rely on judgmental or convenience-based sampling without accounting for potential biases or spatial autocorrelation. The variability observed across microrefuse studies directly affects the reliability of spatial interpretations. Even rigorously collected datasets risk yielding biased or misleading conclusions when sample design is inconsistent or inadequately matched to the target distribution. This issue is particularly problematic given the labor-intensive nature of microrefuse sorting.
The consequences of these ad hoc approaches are compounded when microrefuse analyses are wrapped into wider interpretive frameworks such as “taskscapes” (Gruppuso and Whitehouse Reference Gruppuso and Whitehouse2020; Ingold Reference Ingold1993) or “habitus” (Arponen Reference Arponen, Kadrow and Müller2019; Bourdieu Reference Bourdieu1977). A taskscapes approach to microrefuse analysis aims to reconstruct spatially patterned domestic activity through microartifact distributions and to nest these patterns within larger models of landscape use over time (Antolín et al. Reference Antolín, Dimitrijević, Naumov, Sabanov and Soteras2021). Using microrefuse to understand habitus, in contrast, hinges on multitemporal analyses of microartifact distributions demonstrating habitual actions and how and when these change over long time spans (Ullah et al. Reference Ullah, Duffy and Banning2015). Achieving these or other wider or more theoretical goals with microrefuse data requires more than just high-resolution recovery methods; it also requires statistically grounded sampling strategies capable of capturing meaningful spatial structure. Banning (Reference Banning2021:55) identified training deficiencies as a major roadblock to this goal, suggesting that archaeologists should “encourage students to think critically about preventing their own preconceptions or vagaries of research from yielding biased characterizations of sites, artifacts, or assemblages, or inferences of dubious validity.” Tools such as tASEL offer a practical way forward by enabling archaeologists to simulate and refine their sampling strategies in advance, addressing what Banning describes as both a conceptual and pedagogical gap in current archaeological practice.
Overview of the tASEL Model
tASEL is an interactive spatial simulation model built in NetLogo (Wilensky Reference Wilensky1999). A complete model description follows the ODD (Overview, Design concepts, Details) protocol (Grimm et al. Reference Grimm, Berger, Bastiansen, Eliassen, Ginot, Giske and Goss-Custard2006, Reference Grimm, Berger, Donald, Polhill, Giske and Steven2010, Reference Grimm, Railsback, Vincenot, Berger, Gallagher, DeAngelis and Edmonds2020) and is provided in the COMSES model library alongside the peer-reviewed model code (Ullah Reference Ullah2022). This section summarizes that documentation using the guidelines proposed by Grimm and colleagues (Reference Grimm, Railsback, Vincenot, Berger, Gallagher, DeAngelis and Edmonds2020).
The model’s core purpose is to promote “sampling literacy” by allowing archaeologists to visually and statistically evaluate sampling strategies across a range of artifact distributions. It supports both quick experimentation with different sampling frames and systematic testing under varied spatial scenarios. tASEL helps explore how sampling strategies affect artifact recovery, density estimation, and sampling efficiency, especially in labor-intensive contexts like microrefuse analysis. To ensure it is fit for its purpose, it uses artifact distribution patterns (e.g., random, clustered, or mixed) commonly observed in archaeological contexts, allowing density and spatial scale to be adjusted to match field conditions.
The model includes artifact agents and survey patches as primary entities, with associated state variables summarized in Table 4. Global variables track model state across simulations. The model has no fixed spatial resolution, allowing users to envision patches corresponding to common archaeological sampling unit sizes (e.g., 1 × 1 m or 50 × 50 cm) and to set the NetLogo universe to any combination of x and y dimensions. Likewise, there is no fixed temporal resolution; each simulation represents a single sampling event or iteration series. The most important processes of the model include artifact distribution setup, sampling frame construction, and sampling for artifact counts.
An important design concept of tASEL is that it operates in two distinct modes: manual, for exploratory or instructional use, and iterative, for statistically robust experimentation. Other key design concepts include stochasticity in artifact distribution and sampling selection, statistical summary outputs, and an emphasis on real-time visualization. The model’s intuitive interface makes it especially effective in both classroom and planning contexts.
Simulations initialize with a blank NetLogo canvas patch-grid. tASEL requires no external input data, relying solely on user-defined configurations, although these can be saved and imported. Users configure artifact distributions and sampling strategies interactively. Individual distributions and sampling frames are constructed with the manual interface, and experimental ranges are defined in the iterative interface. Distributions and sampling frames (or ranges) can be saved and reused for consistency. Outputs from tASEL simulations include summary statistics such as the positivity rate (number of sample patches with at least one artifact), artifact density estimates, and extrapolated total artifact counts. These appear graphically in the interface and are also exported in comma-delimited files.
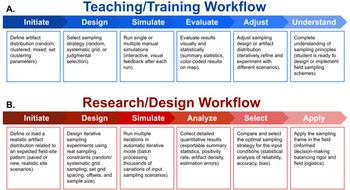
Several tools have been developed to assist archaeological sampling design. DIDI/DICI (Tabrett and Way Reference Tabrett and Way2020; Way and Tabrett Reference Way and Tabrett2018), DIGSS (Pestle et al. Reference Pestle, Hubbell and Hubbe2021), and SPACE (Banning et al. Reference Banning, Edwards and Ullah2024) offer statistically grounded methods for optimizing subsurface or pedestrian survey. DIDI/DICI was built in NetLogo, making it structurally similar to tASEL, whereas DIGSS and SPACE use R and Shiny. tASEL stands apart from these other tools in three ways: (1) tASEL’s user experience emphasizes interactive visualization and ease of use, (2) tASEL’s source code is peer reviewed and preserved in the COMSES repository, and (3) tASEL is designed for use in both educational settings and early-stage research planning. These attributes make tASEL particularly well suited to bridging classroom training and real-world application. To illustrate how tASEL supports this dual role, Figure 2 diagrams two common workflows.
Workflows supported by tASEL: (A) teaching and training workflow using Manual mode. Students define artifact distributions and apply sampling strategies interactively, observing results visually and statistically to understand bias, recovery, and estimation accuracy; (B) research and design workflow using Iterative mode. Practitioners define realistic artifact distributions and test candidate sampling strategies through automated batch simulations. Both workflows begin with shared stages (Initiate, Design, Simulate), facilitating smooth transitions between instructional and field planning contexts.

In teaching or training contexts (Figure 2A), instructors or learners configure distributions and sampling scenarios using the manual interface. Users then explore sampling decisions and their effects on recovery, accuracy, and bias, encouraging conceptual understanding of spatial sampling in “real time” with intuitive visual and numerical feedback about sampling decisions. In applied contexts (Figure 2B), archaeologists use the iterative interface to model realistic distributions (ones similar to those expected on site), to test sampling constraints, and to evaluate performance through repeated simulations. Summary outputs guide the selection of strategies that balance statistical rigor with logistical constraints. Because the “initiate,” “design,” and “simulate” phases are similar across both workflows, tASEL can transition seamlessly between pedagogical and planning use.
Evaluating Grid-Based Sampling with tASEL
I created two simulated artifact distributions in tASEL to evaluate the performance of grid-based sampling, which was commonly used by studies in the literature review, compared to a true random sampling strategy that did not appear at all in the sample. Artifact distributions were designed to approximate two typical archaeological conditions: (1) a uniformly random “background scatter” of artifacts and (2) a highly clustered distribution of artifacts. Both distributions were created with 2,500 artifacts distributed across a 50 × 50 grid of NetLogo patches (2,500 total patches), producing a total theoretical mean density of one artifact per patch within the sampling universe. The first distribution randomly distributed artifacts across the full sampling universe. The second divided the artifacts into 10 discrete clusters of 250 artifacts each. Cluster centers were randomly placed within the sampling universe and then spatially diffused using a random walk process to simulate overlapping activity areas.
Figures 3a and 3b show the resulting artifact and density patterns within the sampling universe for the clustered and random distributions, respectively. tASEL uses the square patches of the NetLogo universe grid as sampling locations, and although the model is scale free, the average density of artifacts in these simulated distributions aligns well with empirically defined microartifact densities from Late Neolithic house floors in Jordan (Ullah Reference Ullah2009, Reference Ullah, Parker and Foster2012; Ullah et al. Reference Ullah, Duffy and Banning2015).
Simulated artifact distributions with different sampling scenarios illustrating the effects of sampling strategy and artifact distribution on microrefuse recovery. The left column shows a clustered artifact distribution scenario, and the right column shows a random artifact distribution scenario. Sampling scenarios depicted in each row are full (100%) sampling results (a, b), systematic 7 × 7 grid-based sampling (c, d), and random sampling of 50 units (e, f). Artifacts are shown as black points, and sampled units are represented by colored squares. Negative samples are shown in red and positive samples are shown green or cyan, where green represents a sample with only one artifact present, and cyan represents a sample unit with two or more artifacts present.

To assess sampling performance, I iteratively applied variations of grid-based and random sampling frames across both distributions using tASEL’s Iterative mode to create a set of eight sampling experiments (Table 5). The first set of experiments (EXP-01, EXP-02, EXP-05, EXP-06) explored variation in sample size, intensity, and spatial arrangement. These included fully random sampling (EXP-01, EXP-05) and systematic grid sampling with variable spacing and offset (EXP-02, EXP-06), with coverage ranging from 0.04% to 100% (1–2,500 patches). Each of these experiments was run for 10,000 iterations, with sample size and locations (random or grid interval and offset) varied per run.
Experimental Design of Simulation Scenarios Conducted with tASEL.

Notes: The eight experiments (EXP-01 to EXP-08) compared four sampling strategies (random sampling units, systematic sampling units, random selection of 50 units, and systematic 7 × 7 grids) across two different artifact distribution scenarios (random and clustered). Each scenario was replicated either 10,000 or 1,000 times to assess the accuracy and precision of sampling methods in recovering artifact density and spatial patterns.
A second set of targeted experiments narrowed in on sampling designs at the ∼2% coverage level, approximating real-world practice as commonly reported in the reviewed studies. These included 50-patch random samples (EXP-04, EXP-08) and fixed 7 × 7 grids with variable origin offsets (EXP-03, EXP-07). These experiments were conducted over 1,000 iterations, using the same artifact distributions as described earlier. Each iteration either re-randomized a set of 50 sample patches or randomized a new grid offset, enabling evaluation of spatial sensitivity to sampling locations at ∼2% coverage.
Sampling performance was evaluated through summary statistics generated by tASEL during each iteration. These included the artifact recovery rate, positivity rate, and estimated artifact density, along with differences between sampled and actual values. Density difference was computed as the sampled density minus the true underlying density of the distribution, where density was defined as the proportion of sampled patches containing artifacts. All outputs were exported for further analysis using the Pandas and Seaborn statistical and plotting packages in Python. The experiment identifiers summarized in Table 5 (EXP-01 through EXP-08) are used throughout the results section to refer to specific configurations.
Results
Figure 3 provides an example of how spatial sampling experiment results can be visualized in tASEL. Complete (100%) sampling of clustered (3a) and random (3b) distributions provides a baseline. In a one-off set of sampling frames, systematic 7 × 7 (2%) grid sampling (3c, 3d) captures clusters well but produces spurious spatial patterns against a diffused backscatter. A one-off random 50-patch (2%) sample (3e, 3f) inconsistently captured some clusters but captured the uniformity of the random distribution well. When these experiments were repeated iteratively, altering the spatial configuration of the sampling frames at each iteration, a broader picture of sample frame quality emerged (Figure 4 and Figure 5).
Density difference distributions for four sampling strategies applied to a diffuse random artifact distribution. Plots show the relative deviation between sampled and true artifact densities. Subplots illustrate (A) 10,000 iterations of random sampling with different sample sizes and locations (n = 1 to 2,500), (B) 10,000 iterations of systematic grid sampling with different sample sizes and origin offsets (n = 1 to 2,500), (C) 1,000 iterations of random sampling with fixed sample size but varying locations (n = 50), and (D) 1,000 iterations of systematic sampling with a 7 × 7 grid, but variable origin offset (n = 49 to 56). Vertical dashed lines indicate the theoretical point where the mean of the sampled distribution is the same as the real distribution; black curves represent fitted normal distributions for comparison.

Density difference distributions for four sampling strategies applied to a clustered artifact distribution. Plots show the relative deviation between sampled and true artifact densities. Subplots illustrate (A) 10,000 iterations of random sampling with different sample sizes and locations (n = 1 to 2,500), (B) 10,000 iterations of systematic grid sampling with different sample sizes and origin offsets (n = 1 to 2,500), (C) 1,000 iterations of random sampling with fixed sample size but varying locations (n = 50), and (D) 1,000 iterations of systematic sampling with a 7 × 7 grid, but variable origin offset (n = 49, 53, or 65). Vertical dashed lines indicate the theoretical point where the mean of the sampled distribution is the same as the real distribution; black curves represent fitted normal distributions for comparison.

For the diffuse random artifact distribution (EXP-01 to EXP-04), random sampling outperformed systematic sampling. Both full-range (EXP-01) and fixed-n (EXP-04) random strategies yielded tight, symmetric distributions centered around the true value (Figure 4A and 4C). In contrast, systematic sampling showed more variation. Whereas EXP-02 (systematic full sweep) was broadly unbiased (μ = –0.06), EXP-03 (7 × 7 grids) introduced consistent negative bias (μ = –0.29), reflecting sensitivity to grid offset at low coverage (Figure 4B and 4D).
The clustered artifact distribution experiments (EXP-05 to EXP-08) produced different dynamics. All four strategies maintained distributions centered near zero (μ = 0.00 to 0.03) but with varying degrees of dispersion (Figure 5). Random strategies again performed best: EXP-05 and EXP-08 had lower variance (σ = 0.08, 0.19) than systematic counterparts. The 7 × 7 grid-based sampling frame (EXP-07) performed better than expected with this specific clustered artifact distribution (μ = 0.01, σ = 0.13), suggesting that grid-based sampling can still perform well under certain scenarios if cluster size, orientation, and density are sufficient and grid alignment is favorable.
When the number of sample patches was allowed to vary iteratively in a “full sweep” between 1 and 2,500 (EXP-01, EXP-02, EXP-05, and EXP-06), simulation results show that sampling accuracy and bias vary with both strategy and distribution type (Table 6). Figure 6 summarizes these full-sweep experiments by reporting mean absolute density differences across binned sample-size intervals. The binned results show the rapid decline in errors at low sampling intensities and the subsequent stabilization once sample sizes reach several dozen patches, providing a clearer view of the diminishing-returns pattern noted later. In general, density estimation improved with sample size, although benefits diminished beyond 50–75 patches (i.e., a ∼2%–3% sample).
Absolute mean density difference plotted across binned sample-size intervals for the four full-sweep experiments (EXP-01, EXP-02, EXP-05, EXP-06). Each curve shows the mean absolute density difference within each sample-size bin derived from 10,000 simulation iterations. Lines connect bin-centered values, and vertical gridlines mark bin boundaries. Missing points (most visibly in EXP-06) occur where no simulation runs produced sample sizes falling within those bins.

Summary of Results from Simulation Experiments EXP-01 to EXP-08.

Notes: Sampling strategies were qualitatively evaluated for accuracy, bias, and variance in recovering true artifact densities under random and clustered artifact distributions. Accuracy indicates overall success in approximating the true distribution, bias reflects systematic over- or underestimation tendencies, and variance indicates consistency of performance across iterations. Qualitative categories reflect natural breaks in the numerical results: accuracy is based on the absolute mean density difference (lower values = higher accuracy), bias on the signed mean density difference (values near zero = lower bias), and variance on the standard deviation of density difference (smaller values = lower variance).
Overall, random sampling (EXP-01, EXP-04, EXP-05, and EXP-08) offered consistent accuracy and low bias, as well as low variance across both distributions, especially at moderate to high sample sizes (Table 6). Systematic strategies were more sensitive to alignment effects and exhibited higher variance; yet they still performed reasonably well when coverage was high or grid placement was well aligned with spatial patterning. At low sample sizes, performance varied by context and frame configuration, with particularly poor results for grid-based samples when grid spacing was wide relative to the underlying spatial structure. The fixed 7 × 7 gridded sampling frame, which most closely mimics the most common practice in published microrefuse studies, performed moderately to poorly. Random sampling with a fixed sample size of 50 consistently outperformed the fixed 7 × 7 gridded sampling frames across both distributions, indicating that if the number of samples is limited due to logistical or other constraints, better accuracy can likely be obtained through random sampling than by using grid-based approaches. Given this, it is notable that none of the 27 published studies used true random sampling.
Discussion and Practical Guidance
The simulation experiments presented here (Figures 3–6, Tables 5 and 6) reinforce long-standing concerns and extend recommendations that were introduced in earlier work on spatial microrefuse analysis (Ullah et al. Reference Ullah, Duffy and Banning2015). That earlier study advocated shifting from exhaustive, labor-intensive enumeration toward scalable, statistically grounded methods attentive to spatial patterning and formation processes. Although that 2015 study did propose new workflows for field collection in addition to laboratory sorting and density estimation, colloquially it appears to have had more effect on those latter two areas; the meta-analysis of microartifact sampling practices summarized here clearly indicates that persistent limitations still exist in how archaeologists design and justify their field sampling frames, which is an issue also fully demonstrated by the sampling experiment results outlined earlier (Section 5).
By operationalizing core concepts from sampling theory within an interactive simulation environment, tools like tASEL enable archaeologists to evaluate the effects of different sampling designs before, during, and after field deployment. This contributes to a core goal of the study of Ullah and colleagues (Reference Ullah, Duffy and Banning2015): balancing interpretive resolution with logistical feasibility. The clustering of sampling unit sizes around 2,500 cm2 and volumes under 2,000 mL in the literature (Figure 1; Tables 1–3) reflects a tendency to prioritize convenience over statistical rigor. The results of the simulations (Figures 4–6) illustrate the consequences of misalignment between sampling strategy and artifact distribution, which is a problem frequently noted (Banning Reference Banning2021; Ullah et al. Reference Ullah, Duffy and Banning2015) but rarely tested. In particular, the results of these analyses showcase how true random sampling produces the most robust statistical results for spatial microrefuse analysis yet is essentially never employed by practitioners.
Demonstrating this finding by simulating thousands of sampling frames across plausible artifact distributions moves beyond critique to provide a replicable way for archaeologists to directly see the implications of their sampling choices. These contributions are particularly timely as wider theoretical frameworks like taskscapes or habitus gain traction in microrefuse work. Reconstructing spatially nuanced activity areas from microrefuse requires not only meticulous sorting but also sampling strategies designed to capture meaningful spatial structure from the outset. As Dunnell and Stein (Reference Dunnell and Stein1989) observed decades ago, microrefuse provides access to behaviorally meaningful residues that are otherwise invisible. But without rigorous field sampling designs informed by sampling theory or by simulations of the kind explored here, even the most meticulous lab work can produce misleading results.
This pedagogical value is especially important given Banning’s (Reference Banning2021) broader critique of how sampling is taught and practiced in archaeology. Rather than “cookbook” prescriptions or vague terminology, Banning calls for sampling to be taught as a practical, problem-oriented dimension of research design. He urges educators to help students think critically about how bias, sampling error, and design decisions shape archaeological inference and to distinguish between sampling using theory and casual or convenient usage. Improving sampling literacy in this way strengthens data quality across the entire research processfrom field collection to final interpretation. Simulation tools like tASEL offer a response to this call. They allow learners to explore “what if” scenarios, visualize the effects of design decisions, and develop an intuitive understanding of concepts that are otherwise taught abstractly. Because the model’s code is open-source, tASEL also supports democratization of spatial archaeology by making rigorous sampling design accessible to projects or educational settings with limited budgets or staffing. To work with tASEL, all one needs is a working Java environment, NetLogo 6.1.1 or higher, and the tASEL netlogo file, making installation simple, free, and cross-platform. To simplify use in classroom settings, the tASEL model can be exported from NetLogo as a fully self-contained html file that can run locally in any web browser or be hosted on a webserver for remote access (for example, https://isaacullah.github.io/models/tASEL.html).
To support this dual pedagogical and applied mission, tASEL includes two core modes (manual and iterative), which correspond to common instructional and field planning workflows. Figure 2 illustrates these workflows and highlights how the early stages of each (“initiate,” “design,” and “simulate”) are shared across both use cases, enabling smooth transitions from classroom exploration to research deployment.
In a teaching or training setting, instructors can follow the workflow shown in Figure 2A to teach sample design through manual experimentation. To enact this workflow in tASEL, students begin by launching the manual mode where they first interactively use the artifact distribution tools to easily create different types of distributions to experiment with (e.g., random, clustered, or mixed). Students can then experiment with different sampling strategies (random, systematic, or judgmental) by applying them interactively to those distributions. After running a simulation, results are displayed both visually (as color-coded sampled patches) and statistically (as summary metrics such as the positivity rate, density, and estimation error). Instructors may ask students to run side-by-side comparisons across sampling designs, identify sources of bias, or adjust their sampling frames based on performance. Because the process is visual and iterative, students can develop a grounded understanding of concepts such as sample size effects, spatial bias, and the challenges of recovering clustered patterns. Two sample undergraduate laboratory assignments that embody this workflow are provided in the supplementary materials (Supplementary Material 1 and 2): one is introductory, and the other is advanced. These exercises are designed to introduce students to spatial sampling through experimentation without requiring prior experience with simulation tools or the mathematics of sampling.
In applied fieldwork planning, researchers can follow the workflow shown in Figure 2B to directly create field sampling plans. To do so in tASEL, researchers first can use the manual mode tools to create artifact distributions resembling those expected on site; these can be saved and loaded later for replicability. At this point, the iterative mode in tASEL enables researchers to explore sampling choices using a rigorous experimental process. After defining sample size, grid spacing, and offset constraints (perhaps based on budget or other practical field constraints), users can run thousands of simulated sampling iterations to evaluate strategy performance. Summary statistics, such as extrapolated artifact counts, variance, and estimation bias, help determine which frame is most appropriate for a given context. The selected sampling frame can be exported to aid in field sample collection layout. This allows archaeologists to test sampling designs in advance, minimize wasted effort, and justify field strategies with empirical support. This approach is particularly valuable for projects with limited time or resources, where mistakes in sampling cannot be easily reversed. A downloadable field planning worksheet encapsulating this workflow is provided in the supplementary materials (Supplementary Material 3). This document guides researchers through the setup, execution, and evaluation of iterative sampling simulations using tASEL, with a template for recording results and justifying final sampling designs.
Together, these use cases underscore a strength of the simulation approach: its ability to foster critical sampling literacy while also enabling statistically grounded planning. Because the basic phases of “initiate,” “design,” and “simulate” are consistent across both workflows outlined in Figure 2, students can move easily from classroom experimentation to real-world application with the same tools. The goal of this pipeline is to help archaeologists across all sectors (applied or academic) make better decisions about how, where, and how much to sample, which are decisions that directly affect the quality of archaeological interpretations.
Conclusion
Microrefuse analysis offers exceptional potential for uncovering spatially persistent traces of domestic behavior, patterns often invisible through other archaeological proxies. Yet realizing this potential requires deliberate, informed, and consistent approaches to sampling. This study has found that archaeologists do not currently approach sampling in this way. This is particularly problematic in microrefuse studies, because the labor-intensive nature of microrefuse processing means that poorly designed sampling frames risk wasting effort or producing misleading results. This study demonstrates how simulation-based tools like tASEL can help archaeologists design statistically informed sampling strategies before data collection begins.
To further these goals, spatial sampling theory and methods training needs to be incorporated early and more explicitly in the archaeological curriculum. Simulations approaches offer a way for students to learn about sampling more intuitively and interactively, which may be especially helpful in North American archaeology programs where undergraduates often do not have to take advanced statistics or math (Killick and Goldberg Reference Killick and Goldberg2009). Because of that, I created tASEL with both pedagogy and professional practice in mind. Whether used in undergraduate instruction, graduate research design, or professional planning, simulation tools like tASEL enable practitioners to align sampling protocols with the spatial complexity of archaeological contexts in an efficient and empirically grounded way. If integrated into core archaeological curricula, simulation-based sampling approaches could help close the gap between methodological training and field application.
Although the experiments presented here highlight the benefits of simulation for improving sampling design, the current version of tASEL simplifies artifact distributions and does not yet incorporate features such as architectural boundaries or more complex spatial behaviors. Future development will expand the model’s realism, further enhancing its applicability. Likewise, empirical field validation through comparison between simulated expectations and observed distributions would strengthen the relevance of the simulation output.
As spatial microrefuse analysis continues to expand, the field would benefit from standardized guidelines for sampling frame design, volume selection, and reporting practices. This is also broadly applicable to many other types of archaeological research, from pedestrian survey design to excavation practices to laboratory sampling procedures and beyond. The simulation results presented here makes the cost-benefit trade-offs of sampling choices more transparent, but broader progress depends on community-wide efforts to define and adopt best practices. To achieve this, I strongly urge fellow practitioners to more explicitly publish—and justify—all aspects of sampling and analysis methodology and to make a more explicit move toward a shared methodological foundation that supports comparability, reproducibility, and confidence in spatial inference.
Acknowledgments
I thank Ted Banning and Steven Edwards for discussion, feedback, and assistance that improved this work; Phyllis Johnson and Marcus Eberl for organizing the 2022 SAA symposium where this work was first presented; and numerous students in ANTH 302 whose feedback and learning experiences have helped me create and improve tASEL. I thank COMSES.net and the anonymous peer-reviewers who reviewed the tASEL model code. I also thank the editors and anonymous reviewers for constructive comments that significantly strengthened this article.
Funding Statement
This research received no specific grant from any funding agency in the public, commercial, or not-for-profit sectors.
Data Availability Statement
tASEL (version 1.1.1) is available via the Computational Model Library at the CoMSES Network (Network for Computational Modeling in Social and Ecological Sciences) and has undergone peer review. The model, including its full source code and documentation, can be accessed at the following persistent URL: https://www.comses.net/codebases/addd3c54-d89a-4773-a639-8bf19bcf59ea/releases/1.1.1/. All simulation outputs, meta-analytic data, and analysis workflows used in this study are archived in a publicly accessible Zenodo repository. The archive contains the complete tASEL simulation results for all eight experiments, the compiled dataset of sampling strategies extracted from published microrefuse studies, all Python scripts used for data processing and visualization, and the statistical summary tables and intermediate figures generated during analysis. The repository is versioned and assigned a persistent DOI to ensure full transparency, reproducibility, and long-term accessibility of all materials associated with this article: it is available at the following persistent URL: https://doi.org/10.5281/zenodo.17873303.
Competing Interests
The author is a member of the editorial board of Advances in Archaeological Practice but recused himself from any editorial decision-making regarding this article.
Supplementary Material
The supplementary material for this article can be found at https://doi.org/10.1017/aap.2025.10146.
Supplementary Material 1. Introductory Sampling Strategies Lab Assignment (text).
Supplementary Material 2. Advanced Sampling Strategies Lab Assignment (text).
Supplementary Material 3. tASEL Field Planning Workbook (text).





 Open access

