


Explaining prehistoric colonization and migration events is a central research theme in American archaeology (e.g., Bell et al. Reference Bell, Currie, Irwin and Bradbury2015; Schwindt et al. Reference Schwindt, Kyle Bocinsky, Ortman, Glowacki, Varien and Kohler2016; Smallwood Reference Smallwood2012). Recent advances framed by behavioral ecology have drawn on the Ideal Free Distribution model (IFD; Fretwell and Lucas Reference Fretwell and Lucas1969) to explain population movements across continents (Codding and Jones Reference Codding and Jones2013; Hildebrandt et al. Reference Hildebrandt, McGuire and King2016; O'Connell and Allen Reference O'Connell and Allen2012; Prufer et al. Reference Prufer, Thompson, Meredith, Culleton, Jordan, Ebert, Winterhalder and Kennett2017) and islands (Giovas and Fitzpatrick Reference Giovas and Fitzpatrick2014; Jazwa et al. Reference Jazwa, Kennett, Winterhalder, Jazwa and Perry2013; Jazwa et al. Reference Jazwa, Kennett and Winterhalder2016; Kennett Reference Kennett2005; Winterhalder et al. Reference Winterhalder, Kennett, Grote and Bartruff2010; see Codding and Bird Reference Codding and Bird2015 for review). The IFD model makes the simple prediction that if individuals are free to choose where to make a living, they should distribute themselves across a varying landscape proportional to the suitability of the local environment. The result is an “ideal” settlement pattern in which more people competing in higher-quality areas and fewer people competing in lower-quality areas result in the same rate of economic yield per individual.
An advantage of the IFD model is that the basic framework is structured by individual decisions, but results in aggregate patterns that can be measured at scales amenable to the archaeological record. However, one problem with archaeological applications of the IFD model is that the aggregate outcome is imprecisely measured at coarse-grained scales without linking the individual decisions to broad patterns. While ethnographic studies show that the IFD model can predict short-term settlement patterns (Moritz et al. Reference Moritz, Hamilton, Chen and Scholte2014; Moritz et al. Reference Moritz, Hamilton, Yoak, Scholte, Cronley, Maddock and Pi2015), there are no empirical evaluations linking high-resolution data on the factors that structure settlement decisions to the resulting long-term, aggregate outcomes. The field needs such a test to validate assumptions in archaeological applications and relative proxies used to measure human populations and habitat suitability. Unlike archaeological and ethnographic data, historical data provide an ideal intermediate level of resolution and temporal scale. While such data are rarely used to evaluate predictions from behavioral ecological models, the few cases that exist help validate model assumptions and predictions (e.g., Glover Reference Glover2009), while also providing novel insights to interpretations of the recent past (Galle Reference Galle2010; Neiman Reference Neiman2008).
To further the study of population movements, we provide a novel test of IFD predictions with annual-scale diachronic data recording the settlement decisions of a natural fertility, agricultural population in Utah. The region was originally occupied by Native Americans, including the Ute, Shoshone, Southern Paiute, and Navajo, but beginning in the mid-nineteenth century, the region was inundated by homogeneous, small-scale, family-based farming communities associated with the Church of Latter-day Saints (Brown et al. Reference Brown, Cannon and Jackson1994; Jackson Reference Jackson1978; Malouf and Findlay Reference Malouf, Findlay, Azevedo and Sturtevant1986; Ricks Reference Ricks1930). Although historians have offered many proximate (sensu Tinbergen Reference Tinbergen1963) explanations for this settlement (Abruzzi Reference Abruzzi1987; Jackson Reference Jackson1978; Ricks Reference Ricks1930; Scarlett Reference Scarlett2006; Scarlett et al. Reference Scarlett, Speakman and Glascock2007; Smith Reference Smith2015), here we provide the first ultimate explanation informed by evolutionary theory. Based on the IFD model, we expect that individuals will initially settle in high-productivity environments, only moving into lower-quality areas as a result of demographic competition in the most suitable locations (Fretwell and Lucas Reference Fretwell and Lucas1969). As such, if Utah's settler-colonists sought to maximize agricultural productivity, then we expect to see a negative relationship between population density and the overall agricultural suitability of occupied habitats. To test this prediction, we develop novel proxies of agricultural suitability and evaluate how the suitability of occupied environments varies with quantitative demographic data. Before discussing the methods and results, we first present the details of the IFD model and the historical context for this colonization event.
The Ideal Free Distribution Model
The IFD model was developed by Fretwell and Lucas (Reference Fretwell and Lucas1969) to explain dispersal and territorial patterns relative to environmental variation and demographic competition. The basic model assumes that habitat suitability varies across the landscape, that individuals have perfect knowledge of their environment and are free (i.e., not excluded by competitors) to settle where they choose, and that habitat suitability is characterized by negative density dependence (meaning the suitability of a habitat declines as a function of increasing competition). The basic predictions for a simple, two-habitat scenario appear in Figure 1, using equation 1 from Greene and Stamps (Reference Greene and Stamps2001). If settlement decisions are structured by the goal of maximizing suitability (for example, per capita energetic return rates), then the first individual in an area should occupy the most suitable habitat (H1). As populations increase through migration or reproduction, the suitability of the best habitat declines as a result of increasing intra-habitat competition between conspecifics. When suitability declines in H1 to the maximum suitability of the second most suitable habitat (H2), incoming individuals should distribute themselves between the first and second most suitable habitats (H1 and H2). The result is an “ideal” distribution of individuals wherein all individuals receive the same rate of resource acquisition from the environment. If growth continues, populations will continue to expand in both habitats, further decreasing habitat suitability. The overall suitability experienced by individuals across all occupied habitats is then the average suitability of all occupied habitats, which declines in suitability with increasing populations (Figure 1, mean value).

Figure 1. Graphical representation of the basic Ideal Free Distribution model in a simple two-habitat scenario (following Greene and Stamps Reference Greene and Stamps2001 eq. 1). Populations should occupy only the most suitable habitat (H1) until the point (d1) at which demographic pressure lowers the per capita gains to be equal to what individuals would gain at lower densities in the next most suitable habitat (H2). The mean suitability of occupied habitats represents the aggregate outcomes of these individual settlement decisions.
Departures from the standard IFD model predictions often take two forms. The first, known as Allee's Principle, involves a violation of strict negative density dependence, wherein the suitability of a habitat initially increases due to the benefits individuals receive from more individuals interacting in that habitat (Fretwell and Lucas Reference Fretwell and Lucas1969). In this case, benefits can range from reducing the burden of vigilance to making resource acquisition more efficient through cooperative production or habitat modification, which will increase overall habitat suitability, and may cause individuals to stay longer in the most suitable habitats than would be predicted by the standard IFD model. The second, known as the Ideal Despotic Distribution (IDD) model, involves the violation of the “free” assumption, wherein some individuals or groups may exclude others from their optimal habitat through territorial behavior (Fretwell and Lucas Reference Fretwell and Lucas1969). Such exclusionary behaviors may lead individuals to settle in lower suitability habitats earlier than predicted by the IFD model (for a recent archaeological application, see Prufer et al. Reference Prufer, Thompson, Meredith, Culleton, Jordan, Ebert, Winterhalder and Kennett2017). Recent modeling also suggests that human despotism may have the opposite effect if a despot benefits from having more subservient individuals within their territory (Bell and Winterhalder Reference Bell and Winterhalder2014).
The Context
The first Euro-American settler-colonists of Utah were members of the Church of Jesus Christ of Latter-day Saints (LDS Church), also known as Mormons. Initial settler-colonists traveled 1,031 miles from Winter Quarters, Iowa, to the Great Salt Lake Valley, leaving the United States and entering what was then Mexico. Arriving at the Great Salt Lake Valley on July 22, 1847, they established a settlement at the canyon mouth of City Creek in what would become downtown Salt Lake City, and began diverting water from the small streams in the area to irrigate rye and other grain crops (Arrington and May Reference Arrington and May1975; Brown et al. Reference Brown, Cannon and Jackson1994; Ricks Reference Ricks1930). Populations grew through continued immigration and reproduction; by 1870, the Salt Lake Valley was home to 18,000 residents. Continued population growth led newcomers to establish more distant settlements beyond the Salt Lake Valley (Brown et al. Reference Brown, Cannon and Jackson1994; Ricks Reference Ricks1930; Scarlett Reference Scarlett2006; Scarlett et al. Reference Scarlett, Speakman and Glascock2007). The new settlements were designed to be self-sufficient farming communities that adopted both irrigated and non-irrigated farming techniques (Abruzzi Reference Abruzzi1987; Arrington and May Reference Arrington and May1975; Ricks Reference Ricks1930). The LDS Church, most notably its leader Brigham Young, was particularly involved in the directed settlement of the region, with the goal of establishing a Mormon “State of Deseret” (Anderson Reference Anderson1942; Arrington and May Reference Arrington and May1975; Brown et al. Reference Brown, Cannon and Jackson1994; Jackson Reference Jackson1978; Meinig Reference Meinig1965; Ricks Reference Ricks1930). While his vision never came to fruition, his attempts at establishing a broad distribution of Mormons throughout the West are seen in the historical record. Young sent scouting parties throughout the West in an attempt to secure strategic and productive locations for dispersing settler-colonists. Historical documents record the settlement of key areas identified for their agricultural potential for incoming settler-colonists (i.e., Brigham City, founded 1851; Manti, 1849; and Saint George, 1861; see Ricks Reference Ricks1930). The extent of the LDS Church's involvement in settlement appears to be limited to the initial decades of settlement, ending prior to 1880 as Mormon autonomy in the region declined due to federal oversight (Brown et al. Reference Brown, Cannon and Jackson1994; Lindell Reference Lindell2011; Meinig Reference Meinig1965; Ricks Reference Ricks1930).
The Mormon settlers were the first Euro-American group intent on permanently settling the region (Cuch Reference Cuch2000; Lindell Reference Lindell2011; Malouf and Findlay Reference Malouf, Findlay, Azevedo and Sturtevant1986). After the Mormons migrated west, their perceptions of Native Americans quickly changed from potential converts to competitors, scapegoats, and political pawns, with antagonistic interactions ranging from passive displacement to violent conflict (Blackhawk Reference Blackhawk2006; Cuch Reference Cuch2000; Lindell Reference Lindell2011). While the resulting conflicts decimated local Native Americans and their way of life, Euro-American settlement seems to have been only minimally impeded (Blackhawk Reference Blackhawk2006; Farmer Reference Farmer2008; Lindell Reference Lindell2011). Some argue that this asymmetrical result was in part due to the more intensive economy, lower mobility, stronger conceptions of ownership, and higher rates of population growth of the settler-colonists (Allen Reference Allen1991; Smaby Reference Smaby1975). Regardless, historians report that Euro-Americans displaced local Native Americans early in the process of colonization (Blackhawk Reference Blackhawk2006; Cuch Reference Cuch2000; Farmer Reference Farmer2008; Lindell Reference Lindell2011; for a detailed discussion on the history of Mormon-Native American interactions, see Lindel [Reference Lindell2011] and Cuch [Reference Cuch2000]).
There are 347 Euro-American settlements (including those abandoned) in Utah established between 1847 and 2013 (Barton Reference Barton1998; Carr Reference Carr1986; Thompson Reference Thompson1982; Utah Writers’ Project 1940). Historians largely attribute colonization decisions to direction of the LDS Church (Abruzzi Reference Abruzzi1987; Jackson Reference Jackson1978; Ricks Reference Ricks1930; Smith Reference Smith2015). Historical researchers assert that dispersion and settlement were the products of environmental perceptions of the group's leaders, whom LDS members perceived as divine, and who had centralized control over the population on matters ranging from ideology to economy (Abruzzi Reference Abruzzi1987; Jackson Reference Jackson1978; Ricks Reference Ricks1930; Smith Reference Smith2015). Although the settlement of Utah is often framed within this context of religious zeal, here we test the simpler prediction that it was guided by economic rationale.
Data and Methods
To test the IFD model prediction that population density and habitat suitability negatively covary, we combine settlement and population data with estimates of habitat suitability. The settlement data and population data used below are available on the Harvard Dataverse (Yaworsky Reference Yaworsky2017).
Settlement Data
Settlement Sample
We select 100 settlements at random from the 347 Utah settlements established between 1847 and 2013 (Barton Reference Barton1998; Carr Reference Carr1986; Thompson Reference Thompson1982; Utah Writers’ Project 1940). From the sample settlements, we exclude 16 due to settlement after 1950 (n = 2), conflicting settlement dates (n = 1), or lack of complete data needed for the analysis (n = 13). Settlement dates (interquartile range [IQR]: 1856–1878) are from a variety of sources (Barton Reference Barton1998; Carr Reference Carr1986; Fruit Heights City, Utah 2016; Jenson Reference Jenson1941; Leigh Reference Leigh1961; Steele Reference Steele1960; Thompson Reference Thompson1982; Torrey, Utah Reference Torrey2016; Utah Writers’ Project 1940; Van Cott Reference Van Cott1990; West Point, Utah 2016; White Reference White1994). Settlement locations are determined using Google Earth (2014) and GeoHack (Wikimedia Tool Labs Reference Labs2013; see Figure 2).
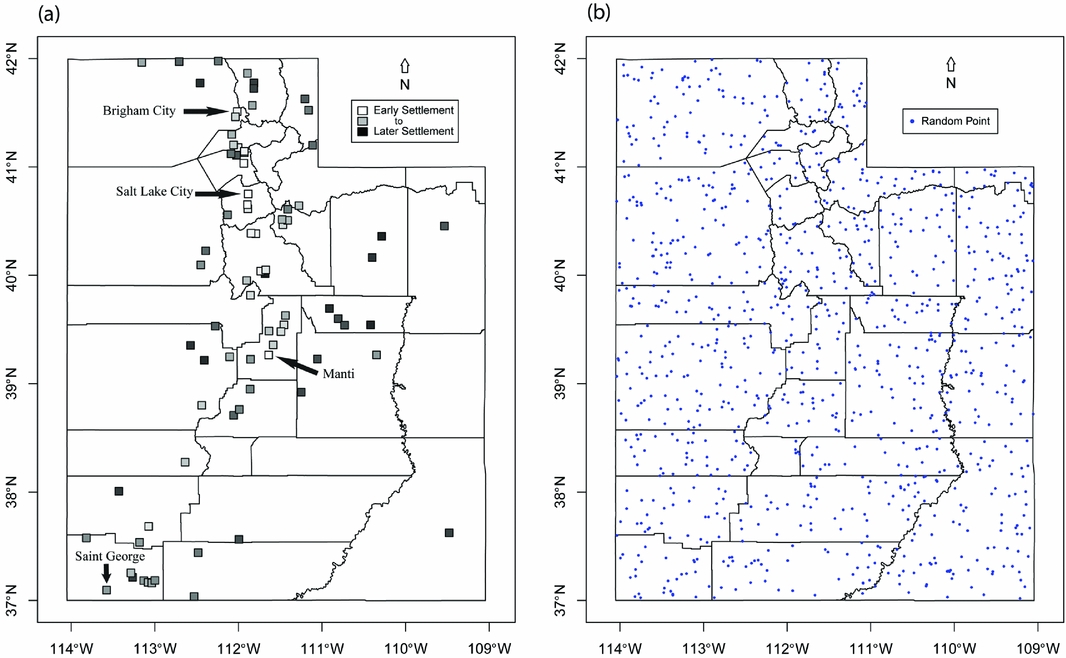
Figure 2. Map of Utah, USA, showing (a) settlement locations colored from older (lighter) to newer (darker), and (b) random point locations.
Census Data
Both statewide and individual settlement population data come from decadal United States census data from 1850 to 1950 (United States Census Bureau Administration and Customer Services 2016). These records generally indicate changes in place names, and such changes are cross-referenced for consistency (Carr Reference Carr1986; Thompson Reference Thompson1982; Utah Writers’ Project 1940). Annual population estimates between censuses are linearly interpolated using the decadal census data. Linear interpolation is also used for missing decadal census data.
Suitability Proxy Selection
Early Euro-American settler-colonists were agrarian focused (Abruzzi Reference Abruzzi1987; Arrington and May Reference Arrington and May1975; Dyal Reference Dyal1989; Jackson Reference Jackson1978; Smith Reference Smith2015). As such, evaluations of suitability are based on agricultural suitability. Other factors also influenced the settlement decisions of early Euro-Americans, including distance to major transportation corridors and established settlements, strategic locations, ease of irrigation, slope, area of cultivatable land, and the presence of locally available resources (e.g., timber, mineral resources, grazing; Meinig Reference Meinig1965; Ricks Reference Ricks1930). While these other factors likely affected the settlement decisions of early Euro-American settler-colonists, agricultural suitability was primary (Abruzzi Reference Abruzzi1987; Arrington and May Reference Arrington and May1975; Brown et al. Reference Brown, Cannon and Jackson1994; Dyal Reference Dyal1989; Meinig Reference Meinig1965; Malouf and Findlay Reference Malouf, Findlay, Azevedo and Sturtevant1986; Ricks Reference Ricks1930).
As a proxy for agricultural suitability, we draw on the work of Ramankutty and colleagues (Reference Ramankutty, Foley, Norman and McSweeney2002) to generate two local measures: Moisture Index (MI) and Probability of Cultivation (S). Given the arid nature of the American West, we assume water is the most limited resource necessary for agriculture. As such, MI alone may provide a reliable proxy for suitability. Because other factors such as soil chemistry and growing season also affect agricultural suitability, we include a second proxy for agricultural suitability, the Probability of Cultivation (S).
Moisture Index
The Moisture Index (MI) is calculated as:
 $$\begin{equation*}
MI = \frac{{E{T_{act}}}}{{PET}}
\end{equation*}$$
$$\begin{equation*}
MI = \frac{{E{T_{act}}}}{{PET}}
\end{equation*}$$
where ETact is the actual evapotranspiration and PET is the potential evapotranspiration. The normalization results in a zero to one index representing the abundance of water available to plants (Ramankutty et al. Reference Ramankutty, Foley, Norman and McSweeney2002).
We calculated MI for Utah using a raster of annual actual (ETact ) and potential (PET) evapotranspiration data from 2000 to 2013 derived from the MODIS 16 instrumentation (Mu et al. Reference Mu, Zhao and Running2011, Reference Mu, Zhao and Running2013; Numerical Terradynamic Simulation Group 2013). Using ArcMap 10.3.1 Raster Calculator (Spatial Analyst), we created a raster dataset with a resolution of 2.6 km2 containing values representative of the average Moisture Index for Utah over the 14-year period (ESRI 2015). These are remotely sensed data and as such represent reflective surfaces (e.g., urban areas, lakes, and the Utah Salt Flats) as null values in the dataset. Areas of null values that are not bodies of water are interpolated using Inverse Distance Weighting (3D Analyst) in ArcMap 10.3.1(ESRI 2015).
Suitability
The Probability of Cultivation (S) is calculated as a normalized product of growing degree days (GDD), available moisture (MI), soil carbon (Csoil), and soil pH (pHsoil). The equation is divided into two components:
 $$\begin{eqnarray*}
S = {\rm{S}}_{clim} \;^{*}\; {S_{soil}}
\end{eqnarray*}$$
$$\begin{eqnarray*}
S = {\rm{S}}_{clim} \;^{*}\; {S_{soil}}
\end{eqnarray*}$$
where
 $$\begin{eqnarray*}
{{\rm{S}}_{clim}} = \ {f_1}\left( {{\rm{GDD}}} \right){f_2}\left( {{\rm{MI}}} \right)
\end{eqnarray*}$$
$$\begin{eqnarray*}
{{\rm{S}}_{clim}} = \ {f_1}\left( {{\rm{GDD}}} \right){f_2}\left( {{\rm{MI}}} \right)
\end{eqnarray*}$$
and
 $$\begin{eqnarray*}
{S_{soil}} = \ {g_1}\left( {{C_{soil}}} \right){g_2}\left( {p{H_{soil}}} \right).
\end{eqnarray*}$$
$$\begin{eqnarray*}
{S_{soil}} = \ {g_1}\left( {{C_{soil}}} \right){g_2}\left( {p{H_{soil}}} \right).
\end{eqnarray*}$$
Climate suitability (Sclim) is calculated as a normalized probability density function of cropland area to growing degree days (f1 [GDD]) and a probability density function of cropland area to Moisture Index (f2 [MI]; Ramankutty et al. Reference Ramankutty, Foley, Norman and McSweeney2002). Soil suitability (Ssoil) is calculated using a sigmoidal function of the soil carbon density and soil acidity/alkalinity. The optimum soil carbon range is from 4 to 8 kg of C/m2 and the optimum range of soil pH is from 6 to 7 (Ramankutty et al. Reference Ramankutty, Foley, Norman and McSweeney2002). The resulting S value varies from zero to one indicating the probability of agricultural cultivation on a global scale.
To implement the equation for S, growing degree days (GDD) are calculated using the USPEST degree-day mapping calculator and PRISM climate maps with a minimum temperature threshold of 50°F (Coop Reference Coop2014; Daly et al. Reference Daly, Gibson, Taylor, Johnson and Pasteris2002; Willmott and Robeson Reference Willmott and Robeson1995). Moisture Index data are calculated as described above. To calculate overall climate suitability (Sclim ), existing functions are fit to the resulting raster datasets of growing degree days and Moisture Index and combined in ArcMap 10.3.1 using the Raster Calculator (Spatial Analyst) to create a climate suitability (Sclim ) raster dataset with a resolution of 2.6 km2 (ESRI 2015; Ramankutty et al. Reference Ramankutty, Foley, Norman and McSweeney2002). To calculate soil suitability, we apply the functions provided by Ramankutty and colleagues (Reference Ramankutty, Foley, Norman and McSweeney2002) to soil data derived from the SSURGO soil dataset compiled using NRCS Soil Data Viewer 6.1 to create thematic maps of average soil pH within the top and average carbon density within the top 30 cm (Soil Survey Staff, Natural Resources Conservation Service, United States Department of Agriculture 2015; United States Department of Agriculture, Natural Resource Conservation Service Soils 2015). Missing values in the SSURGO soil dataset result in datasets that use soil acidity/alkalinity to have null values in some areas of the state (Soil Survey Staff, Natural Resources Conservation Service, United States Department of Agriculture 2015). The resulting raster datasets of soil acidity/alkalinity and carbon density are combined in ArcMap 10.3.1 using the Raster Calculator (Spatial Analyst) to create a soil suitability (Ssoil ) raster dataset with a resolution of 9.2 km2 (ESRI 2015). The climate suitability raster dataset and soil suitability raster dataset are combined in ArcMap 10.3.1 using the Raster Calculator (Spatial Analyst) resulting in an S raster dataset with a resolution of 9.2 km2 (ESRI 2015).
The methods above result in two statewide raster datasets: The Moisture Index and the Probability of Cultivation. Because of missing values in the SSURGO data, some regions of the state lack Probability of Cultivation (S) values. These data are shown in Figure 3 and are available on the Harvard Dataverse (Yaworsky Reference Yaworsky2016a, Reference Yaworsky2016b).

Figure 3. Map of Utah, USA, showing (a) the Moisture Index (MI) and (b) Probability of Cultivation (S).
We extract MI and S values using ArcMap 10.3.1 with the Extract Multi Values to Points (Spatial Analyst) for settlements by averaging raster values within a 5 km radius around each settlement as a proxy for each settlement's suitability (ESRI 2015). We do not account for fluctuations in past S and MI values, as we assume that relative MI and S values between locations remained constant. That is, if suitability declined by an order of magnitude in one area, it also declined by a similar magnitude in other areas with the relative rankings between habitats remaining constant (following Codding and Jones Reference Codding and Jones2013).
Random Suitability Values
To determine if the settlement suitability values differed from background values, we generate 1,000 random points (see Figure 2) in ArcMap 10.3.1 using the Create Random Points function in the Data Management toolbox. We then extract S and MI values using Extract Multi Values to Points (Spatial Analyst) (ESRI 2015).
Statistical Analysis
Suitability
To calculate the overall agricultural suitability experienced annually by farmers, we compute median MI and S values across all occupied settlements. We report the median and the interquartile range (25%–75% of cases) for both the observed annual values and the random values.
Null Distribution Test
To determine if the observed settlement data are significantly different than random data, settlement MI and S values are compared with values of the random points. This serves as a test of a null model, where S or MI values do not guide settlement decisions. We use a Two-Sample Kolmogorov-Smirnov (KS) test and examine the result graphically as an empirical cumulative density function.
Spatial Autocorrelation
Settlement patterns may bias S and MI values if neighboring settlements are more likely to be settled at similar times. To test for such spatial autocorrelation, we rely on the Global (Paradis et al. Reference Paradis, Blomberg, Bolker, Claude, Cuong, Desper, Didier, Durand, Dutheil, Ewing, Gascuel, Heibl, Ives, Jones, Lawson, Lefort, Legendre, Lemon, McCloskey, Nylander, Opgen-Rhein, Popescu, Royer-Carenzi, Schliep, Strimmer and de Vienne2016) and the Local Moran's I (Giraudoux and Giraudoux Reference Giraudoux2016). Global Moran's I evaluates whether neighboring points across the entire study area have more similar or different settlement dates than would be expected by chance. Local Moran's I performs the same test, but over ranges of distances (or neighborhoods) to determine the spatial scale at which spatial autocorrelation may occur.
Settlement Date and Suitability
To assess the prediction that the earliest settlements should have higher suitability than later settlements, we examine how suitability (MI and S) varies as a function of settlement founding date using generalized additive models (GAMs). GAMs are nonparametric extensions of generalized linear models (GLMs) that incorporate smooth terms as penalized regression splines selected by a backfitting algorithm (Hastie and Tibshirani Reference Hastie and Tibshirani1999; Wood Reference Wood2012). While this allows the data to “speak for themselves” because the analyst does not need to specify a functional relationship, it can also lead to overfitting. To avoid this problem, we maximize parsimony by limiting degrees of freedom (knots) to the minimum possible for each model. Another benefit of GAMs is that they can control for the effects of spatial autocorrelation (if present, see above) by including paired point coordinates as an additional smoothed term (Wood Reference Wood2006). For each GAM, we report the r2 value for the whole model, and the estimated degrees of freedom, F value, and p-value for both the settlement founding date and coordinates.
Density Dependence
In order to test the prediction of negative density dependence quantitatively, we examine annual variation in median S and MI values as a function of the population using generalized additive mixed models (GAMMs; Wood Reference Wood2006, Reference Wood2011, Reference Wood2012). GAMMs are extensions of GAMs that incorporate a generalized additive model component with a linear mixed effect model component, which can be used to include a correlation structure to account for temporal autocorrelation (Wood Reference Wood2006, Reference Wood2012). This resolves the problem of non-independence that is often present in time series data. To implement this, we control for a first-order temporal correlation structure (corAR1) and assess the results with an autocorrelation function. Given that the dependent variables (MI and S) vary from zero to one, we specify a binomial distribution with a log link and quasi-likelihood estimation. Results report the estimated degrees of freedom of the smoothed term, the F value, the r2 value, and the p-value. We used the results of the fitted models to examine diachronic patterning in occupied habitat suitability.
Temporal Autocorrelation
In order to evaluate if temporal autocorrelation, the influence of neighboring points on one another, drives the pattern of density dependence, we examine the standardized residuals of the fitted GAMM using the autocorrelation function in R (R Core Team Reference Core Team2015), which determines how similar or different neighboring points are to one another. If temporal autocorrelation is detected, we report the lag (in years) over which neighboring points influence one another. All statistical analyses described above are run in the R environment (R Core Team Reference Core Team2015).
Results
Of the 100 randomly selected settlements, necessary data are available for 84. Overall, these 84 occupied settlements have a median Moisture Index (MI) value of 0.19 (IQR: 0.13–0.24) and a median Probability of Cultivation (S) value of 0.04 (IQR: 0.02–0.08). Of the 1,000 random points, 116 are excluded, as they were located in areas with null S and MI values. The remaining 884 points have a median Moisture Index value of 0.10 (IQR: 0.08–0.15) and a median Agricultural Suitability value of 0.022 (IQR: 0.014–0.04).
Does Settlement Suitability Differ from Random?
A comparison of the observed and random data reveals that Euro-American settlement patterns achieved S (D = 0.39; p < 0.0001) and MI (D = 0.46; p < 0.0001) values that are significantly higher than random. As shown in Figure 4, occupied settlement locations are biased toward areas of relatively high suitability, and the median annual suitability experienced by historical populations is higher than random, especially when considering available moisture. This indicates that settlement decisions were purposeful and biased toward higher suitability habitats.

Figure 4. Comparison of the observed (a) Probability of Cultivation (S) and (b) Moisture Index (MI) for occupied habitats to randomly distributed points on the landscape.
Do Neighboring Settlements Have Similar Founding Dates?
The Global Moran's I test indicates minor positive spatial autocorrelation of settlement year (I = 0.06; p < 0.01), indicating that neighboring settlements are more likely to have similar founding dates than would be expected by chance. The Local Moran's I test reveals that spatial autocorrelation occurs only up to a distance (lag) of 22.5 km (I = .27; p < 0.0001). This pattern of spatial autocorrelation disappears at distances greater than 22.5 km. This shows that only settlements within 22.5 km of one another are more likely to have been settled in similar years than would be expected at random, indicating that the correlations between settlement founding date and suitability may result from spatial autocorrelation. To account for this, we control for the coordinates of each settlement when examining the effect of settlement date on suitability.
Are Earlier Settlements in Higher Suitability Habitats?
Controlling for spatial autocorrelation, both the Moisture Index and Agricultural Suitability negatively vary with settlement date, revealing that earlier settlements were founded in higher suitability habitats than later settlements. Settlement date is a stronger predictor of MI (r2 = 0.67; year; edf = 1.7; F = 8.67; p = 0.0011; coordinates: edf = 4.36; F = 27.87; p < 0.0001), than S (r2 = 0.15; year: edf = 1; F = 3.34; p = 0.0713; coordinates: edf = 3.74; F = 3.61; p = 0.0094), with the latter relationship being significant only at the < 0.1 level. These models show that earlier settlements were established in higher suitability habitats, even when the local effects of spatial autocorrelation are removed, though only the effect of available moisture remains highly significant.
Does the Suitability of Occupied Habitats Decline with Increasing Populations?
The overall temporal trends reveal a pattern of decreasing habitat suitability coincident with increasing populations across the sampled settlements and the state as a whole (Figure 5). The total population occupying the sampled settlements increases from 1,539 to 280,785 and the overall state population increases from 2,845 to 688,862 over the observation period from 1847 to 1950. Median Agricultural Suitability (S) values decline from a high of 0.10 to 0.03 and median Moisture Index (MI) values decline from a high of 0.22 to 0.17. This suggests that the prediction of negative density dependence holds across this colonization event.

Figure 5. Summary of time-series data illustrating (a) the changes in the overall Probability of Cultivation (S) of occupied habitats, and (b) the overall Moisture Index (MI) of occupied habitats and (c) the trends in statewide and sampled settlement populations.
A quantitative evaluation of these trends confirms the IFD predictions (Figure 6). Median Agricultural Suitability (S) and Moisture Index (MI) values decline significantly with both settlement population size (S: edf = 1.97; F = 97; r2 = 0.74; p < 0.0001; MI: edf = 1.97; F = 93.34; r2 = 0.73; p < 0.0001) and total state population size (S: edf = 1.96; F = 56.36; r2 = 0.91; p < 0.0001; MI: edf = 1.96; F = 54.58; r2 = 0.91; p < 0.0001). Note that the subtle increase in S and MI at higher populations, around 175,000 (settlement) and 500,000 (state), is not statistically meaningful as the confidence interval has both positive and negative slope. The results suggest that populations adaptively respond to increasing competition by moving into lower-suitability habitats.

Figure 6. Results of generalized additive mixed models examining variation in annual median Probability of Cultivation (S) and Moisture Index (MI) values for occupied settlements as a function of the total settlement sample population (a and b) and total state population (c and d). Note that the subtle increase in S and MI at higher populations, around 175,000 (settlement) and 500,000 (state), is not statistically meaningful as the confidence interval has both positive and negative slope.
An examination of the standardized model residuals reveals that only minor temporal autocorrelation (up to a three-year lag) remains in the models examining S and MI as a function of settlement populations, indicating that variation in annual trends over a three-year moving window are partially explained by the influence of neighboring point values. However, no temporal autocorrelation remains in the models examining S and MI as a function of the statewide population.
Statewide population also explains much more of the deviance in S and MI, suggesting that state–rather than sample settlement–level competition drives variation in suitability. The shape of this model fit suggests that the effects of agricultural populations on habitat suitability follow an exponentially decreasing function: human populations deplete habitats more quickly than predicted by the basic mathematical model (see Figure 1; Greene and Stamps Reference Greene and Stamps2001). This may indicate a pattern of “despotic” rather than “free” distribution (Fretwell and Lucas Reference Fretwell and Lucas1969).
Discussion
Our results show that, as population grew, Euro-American settler-colonists began to occupy lower-suitability habitats. These findings suggest that individual settlement decisions were aimed at maximizing agricultural productivity. As a result, increasing competition within habitats led individuals to settle in locations with lower suitability to maintain equitable yields. These findings are consistent with IFD predictions, but as is common with archaeological and historical data, it is impossible to know if the observed pattern is a direct result of the decisions of Euro-American settlers-colonists to move elsewhere when the suitability of one habitat declined to that of the next most suitable habitat. However, our demonstration of the negative relationship between population and habitat suitability is consistent with predictions from IFD/IDD. These results have important implications for understanding this particular historical settlement event, future archaeological applications of the IFD model, and the utility of such models for understanding human behavior in general.
Insights into the Euro-American Settlement of Utah
While historians have offered many proximate explanations for the settlement of Utah (Abruzzi Reference Abruzzi1987; Jackson Reference Jackson1978; Ricks Reference Ricks1930; Smith Reference Smith2015), none link the dispersal to a broader theory of human behavior. The empirical evidence provided here is consistent with the conclusion that Euro-American settlers based settlement decisions on maximizing their agricultural output within demographic constraints. This is not surprising given the agricultural basis for this settler-colonist economy, and the necessity to provide not only for self and family, but also to the local theocratic government through tithing (Abruzzi Reference Abruzzi1987; Arrington and May Reference Arrington and May1975; Arrington Reference Arrington1954; Dyal Reference Dyal1989).
First, considering the need to provide for self and family, having a reliable income was necessary for a frontier population that experienced relatively high mortality resulting in risk-averse reproductive decisions (Jones and Bliege Bird Reference Jones and Bird2014). Moreover, beyond providing for existing family, male-headed households within this polygynous society may also have been motivated to excel economically in order to gain additional wives (Heath and Hadley Reference Heath and Hadley1998).
Second, considering the need to provide for the local theocratic government, settlers needed to be sufficiently productive to generate a significant surplus (Abruzzi Reference Abruzzi1987; Arrington and May Reference Arrington and May1975). This may have made settlers particularly sensitive to demography-driven declines in suitability, causing the rapid expansion into lower-suitability habitats. Alternatively, while we assume that the “free” condition was upheld in this context, our results (Figure 6) suggest that individuals expanded into lower-suitability habitats more rapidly than would be expected by the standard IFD model (compare Figure 1 and Figure 6; Fretwell and Lucas Reference Fretwell and Lucas1969; though see Bell and Winterhalder Reference Bell and Winterhalder2014). The rapid expansion into lower-suitability habitats may be a product of centralized leadership decisions that directed settlement. This provides an empirical result that may describe generally what results from a centrally directed frontier settlement strategy (i.e., a decelerating rather than an accelerating function), a finding that may prove useful for interpreting archaeological dispersions (see below). These trends also may have been influenced by regional knowledge obtained by Mormon scouting parties, presenting potentially interesting questions pertaining to the importance of the IFD model's assumption of complete information.
Implications for Archaeological Applications of the IFD Model
Our use of historical data to evaluate IFD predictions has three significant implications for archaeological tests of the IFD model. Specifically, this application provides (1) a validation of model assumptions, (2) novel proxies that archaeological case studies can use, and (3) insights into the empirical record that results from a rapidly dispersing population.
First, the findings support the main IFD prediction that habitat choice negatively covaries with population density over relatively long spans of time. While we measure changes in median overall suitability, not changes within each habitat, these results support the model assumption of negative density dependence and provide a justification for future archaeological applications to use aggregate estimates of population density and suitability. Second, our results help to validate two measures of agricultural suitability: The Moisture Index (MI) and the Probability of Cultivation (S). These two proxies can be used to assess the ideal distribution of settler-colonists worldwide (e.g., Timpson et al. Reference Timpson, Colledge and Crema2014; Shennan et al. Reference Shennan, Downey and Timpson2013). Finally, because these findings are linked to a detailed historical record that reveals the despotic structure underlying this dispersion, our empirical results provide an expectation for what such events may look like in the archaeological record, though additional modeling and empirical work are needed to validate this hypothesis.
Conclusion
Overall, these findings highlight the value of historical data for evaluating archaeologically applicable models from behavioral ecology. Implementation of the IFD model to date relies either on archaeologically derived, coarse-grained diachronic data, or ethnographically derived, fine-grained synchronic data. The former allows for long-term diachronic assessments of settlement patterns, but generally relies on untested proxies of population and suitability. The latter has the benefit of fine-grained population data and validated proxies of suitability, but lacks diachronic data to assess settlement decisions through time (e.g., Moritz et al. Reference Moritz, Hamilton, Chen and Scholte2014). The explanatory power of the IFD model demonstrated here uses historically derived data that are both fine-grained (annual scale) and diachronic (ca. 100 years), allowing for the observation of long-term aggregate trends of individual decision making. The intermediate level of resolution and temporal scale of historical data, relative to archaeologically derived and ethnographically derived data, allows us to assess suitability proxies and test IFD predictions concerning the relationship between population density and habitat suitability.
The negative relationship between population density and habitat suitability found in the historical settlement of Utah is consistent with IFD predictions, suggesting that early Euro-American settlers of Utah attempted to maximize agricultural productivity. These insights into the settlement dynamics that structured the historical colonization of Utah result from our use of a general theory of behavior (see Bird and O'Connell Reference Bird and O'Connell2006; Codding and Bird Reference Codding and Bird2015; O'Connell Reference O'Connell1995). The behavioral ecological approach simplifies real-world variation into the necessary components required to explain a particular phenomenon. This is one of the major benefits of adopting a formal theoretical approach guided by behavioral ecology. Our findings validate assumptions of the IFD model with the use of historical data, thus archaeologists can confidently expand archaeological application of IFD models to the investigation of prehistoric colonization events. The IFD model is a simple and quantitative approach, with the potential to address colonization and migration events throughout human history.
Acknowledgments
Many thanks are due to Isaac Hart for his assistance in developing suitability data for the State of Utah and to the University of Utah Archaeological Center, specifically Joan Brenner-Coltrain, Kate Magargal, Erik Martin, and Blake Vernon, for support and substantive comments on previous versions of this manuscript. We are also grateful for the detailed comments provided by three anonymous reviewers and Robert Kelly, who helped us improve this paper.
Data Availability Statement
The Moisture Index (MI) and Probability of Cultivation (S) data are available on the Harvard Dataverse (Yaworsky Reference Yaworsky2016a, Reference Yaworsky2016b). Supplemental material, including settlement data, population data, and suitability scores are available on the Harvard Dataverse (Yaworsky Reference Yaworsky2017).


