

Archaeologists suspect that changes in mobility are associated with or cause major transitions in prehistoric hunter-gatherer socioeconomic organization. Shifts in geographic ranges, for example, are frequently associated with changes in subsistence practices and territoriality; and a reduction in mobility is often associated with increased social complexity. Such arguments depend on the ability to make secure inferences about mobility from archaeological evidence.
Stone tools are often used to make inferences about past changes in mobility (Clarkson Reference Clarkson, David and Thomas2008). In arid Australia, the tula, a stout, semidiscoidal, unifacially flaked adze form with a pronounced percussion bulb and convexly retouched cutting edge (Moore Reference Moore2004), occurs in some assemblages dating from the mid- to late Holocene, and some use changes in the abundance of these artifacts to argue for changes in the mobility of human groups during this time (e.g., Veth et al. Reference Veth, Hiscock and Williams2011; Williams et al. Reference Williams, Ulm, Turney, Rohde and White2015). However, archaeologists disagree over what their appearance and increase indicate. From one perspective, tula are versatile, general-purpose tools forming part of a risk management strategy (sensu Hiscock Reference Hiscock1994) associated with more frequent residential movement at the onset of greater climatic variability due to El Niño–Southern Oscillation intensification (Veth et al. Reference Veth, Hiscock and Williams2011). Alternatively, tula, along with the wooden tool kit manufactured with these implements, may reflect part of a strategy to offset depletion of resources resulting from longer occupations and less frequent residential movement (Smith Reference Smith2013; Williams et al. Reference Williams, Ulm, Turney, Rohde and White2015).
These contrasting models have important implications for late Holocene human socioeconomic organization in arid Australia. Both are logically compelling, as they provide reasons why tula were generated by people in the past. But without knowing actual tool functions, or how those functions operated within broader ecological or social systems (Boyd Reference Boyd2006; Phillipps and Holdaway Reference Phillipps and Holdaway2016), arguments linking mobility to tool classes are difficult to defend without recourse to additional information. As demonstrated in the case of the tula, arguments based on tool function seemingly indicate both a risk-reduction strategy by nomadic foragers and maintenance of an expanding and specialized tool kit by logistical foragers. These constitute different explanatory “frameworks” (sensu Williams et al. Reference Williams, Ulm, Turney, Rohde and White2015), and tests are needed where the expectations for these different frameworks can discern between them.
One resolution is to use proxies that bear directly on occurrences of movement, where objects form patterns in artifact assemblage composition as they move across a landscape, regardless of their actual function (Clarkson Reference Clarkson, David and Thomas2008; Close Reference Close2000). For stone artifacts, this includes using geochemical sourcing to calculate distances between an artifact and its raw material source (e.g., Cochrane et al. Reference Cochrane, Webb, Doelman and Habgood2017; Nash et al. Reference Nash, Coulson, Staurset, Stewart Ullyott, Babutsi and Smith2016), refitting studies that reconnect the products of stone artifact reduction sequences back into original wholes (e.g., Close Reference Close2000; Spry Reference Spry2014), and techniques that use geometric attributes of artifacts to determine the presence or absence of expected reduction products within an assemblage (e.g., Douglass et al. Reference Douglass, Holdaway, Fanning and Shiner2008; Lin et al. Reference Lin, Douglass and Mackay2016; Phillipps and Holdaway Reference Phillipps and Holdaway2016). Each of these has its own advantages, but all measure archaeological patterns that are sensitive to the movement of the constituent objects.
Interpreting these proxies in terms of a model of mobility requires knowledge of how the organization of movements over time changes their patterning. This is not always straightforward, as patterning in the archaeological record often forms over spatial and temporal scales that are not directly related to individual generating mechanisms. Individual acts of making and moving artifacts, for example, are embedded within wider systems of resource exploitation strategies, social interactions, and geophysical formation processes that are not necessarily discernible from the archaeological residue of individual activities in isolation (Binford Reference Binford1979; Gifford-Gonzalez Reference Gifford-Gonzalez1991). The archaeological record, then, exhibits emergent qualities that are not captured by a study of proximate mechanical operations or individual instances of decision making (Bliege-Bird Reference Bliege-Bird2015; Dibble et al. Reference Dibble, Holdaway, Lin, Braun, Douglass, Iovita, McPherron, Olszewski and Sandgathe2017; Kuhn et al. Reference Kuhn, Raichlen and Clark2016). Showing how these interrelationships affect archaeological patterning is difficult, especially beyond ethnographic scales, and expressing them as verbal models leaves their influence open to different interpretations (Servedio et al. Reference Servedio, Brandvain, Dhole, Fitzpatrick, Goldberg, Stern, Van Cleve and Yeh2014).
This study explores how variations in artifact manufacture, transport, and discard combine to produce patterns within archaeological assemblages. Different movement configurations are assessed using the “cortex ratio,” a geometric measure used to show mobility through the subtraction of cortex from or addition of cortex to assemblages of stone artifacts (Dibble et al. Reference Dibble, Shurmans, Iovita and McLaughlin2005; Douglass et al. Reference Douglass, Holdaway, Fanning and Shiner2008). An experimental, agent-based computer simulation is used to evaluate how different kinds of movement impact the formation of assemblage-level cortex ratios, and these findings are used to contextualize patterning recorded in a landscape-scale case study from arid Australia.
The Cortex Ratio as an Indicator of Archaeological Mobility
Lithic assemblages produced through hard hammer percussion contain two primary components: cores and flakes. Flakes have a ventral surface where the flake split from its parent stone. Cores are the remnants of reduced nodules of stone, with negative scars from the flakes previously removed. Cores or flakes might be converted into tools through retouch. Stone found in exposed settings typically features an outer rind known as cortex, which forms through weathering or mechanical processes (Andrefsky Reference Andrefsky2005). Following lithic reduction, cores retain a percentage of their original cortical surface, while cortex will also be present on the dorsal surface of some flakes. Because percussive lithic reduction necessarily removes outer material first, the relative level of core reduction or the reduction stage at which a flake was removed relates to the amount of cortex present on it (Andrefsky Reference Andrefsky2005:103; Toth Reference Toth1985:114).
The cortex ratio measures the proportional relationship between the cortical surface area observed on artifacts in an assemblage and the cortical surface area expected for that assemblage. The surface area of a flake covered by cortex can be estimated by using the axial dimensions to approximate surface area and then multiplying this by the percentage of the surface covered in cortex (Dibble et al. Reference Dibble, Shurmans, Iovita and McLaughlin2005). The cortical surface area of cores can be approximated similarly by using the axial dimensions to calculate the surface area of a geometric proxy for the original nodule (such as a prism or spheroid) and then multiplying this by the percentage covered in cortex. The geometric attributes of the nodules used to produce the assemblage are represented by a theoretical average nodule (Dibble et al. Reference Dibble, Shurmans, Iovita and McLaughlin2005). Ideally, this theoretical nodule represents an average size and shape of nodules used to produce the flakes and cores in an assemblage, and several studies have focused on how to best estimate this given variability in raw material and reduction methods (e.g., Douglass and Holdaway Reference Douglass, Holdaway, Specht and Torrence2011; Lin et al. Reference Lin, Douglass, Holdaway and Floyd2010; Lin et al. Reference Lin, McPherron and Dibble2015).
The cortex ratio shows movement by estimating, in relative terms, how much cortical material was moved in or out of an assemblage given the difference from the amount of cortex expected. Flintknapping experiments have shown the sensitivity of the ratio to the removal or addition of flaked materials (Dibble et al. Reference Dibble, Shurmans, Iovita and McLaughlin2005; Douglass et al Reference Douglass, Holdaway, Fanning and Shiner2008; Lin et al. Reference Lin, McPherron and Dibble2015), and differences in ratios between spatially distinct archaeological assemblages are often explained by differences in the movements of mobile human groups between places (Holdaway et al. Reference Holdaway, Douglass, Fanning, Kluivig and Guttman-Bond2012:287).
Patterning in Cortex Ratios at Rutherfords Creek
The Rutherfords Creek study area in western New South Wales, Australia, is a 13 km long catchment area along the length of an ephemeral stream connected to Peery Lake in Paroo-Darling National Park (Figure 1). Surveys were conducted on exposures of indurated subsurface sediments known locally as “scalds,” on most of which rest artifacts that accumulated within the last few millennia (Fanning et al. Reference Fanning, Holdaway, Rhodes and Bryant2009). Previous research has shown that stone artifacts with a maximum dimension greater than 20 mm are unlikely to be moved by the eolian and fluvial processes that form the underlying scalds, resulting in lagged deposits of stone artifacts on the surface (Fanning and Holdaway Reference Fanning and Holdaway2001). A total of 25,388 stone artifacts were recorded from a random sample of 97 scalds, representing approximately 5.0% of exposed surfaces within the valley, or 1.3% of the total land area of the catchment. The dominant raw material was silcrete (89.4%), followed by quartzite (10.3%), with the remainder made up of several other lithologies. Attributes for each artifact were recorded in situ. A range of artifacts were recovered from Rutherfords Creek, but unretouched flakes and cores account for 93% of recorded flaked artifacts, a finding in line with other western New South Wales locations (Holdaway and Fanning Reference Holdaway and Fanning2014; Webb Reference Webb1994).

Figure 1. Map of western New South Wales, Australia, indicating Rutherfords Creek and other points of interest (drawn by Briar Sefton; originally published as Holdaway and Fanning Reference Holdaway and Fanning2014:Figure 1).
Geometric measures such as the cortex ratio have advantages for studying movement on landscapes such as Rutherfords Creek. Calculating cortex ratios only requires a few basic measurements that can be taken in the field (Dibble et al. Reference Dibble, Shurmans, Iovita and McLaughlin2005), and they can be applied wherever cortical stone cobbles were in use. Minimal training is needed to take the requisite measurements; these can be obtained quickly for large quantities of artifacts (reducing the effects of interobserver error; see Lin et al. Reference Lin, Douglass, Holdaway and Floyd2010), and no expensive or sensitive equipment is required. These features make geometric measures a nimble approach that is easily deployed over large, remote areas with surface lithic scatters.
Specific methods for calculating the cortex ratio have been described in detail elsewhere (e.g., Dibble et al. Reference Dibble, Shurmans, Iovita and McLaughlin2005; Douglass et al. Reference Douglass, Holdaway, Fanning and Shiner2008), and the method used in this study (after Lin et al. Reference Lin, Douglass and Mackay2016) is described in Supplemental Text 1. The distribution of values for Rutherfords Creek assemblages is shown in Figure 2. Overall, cortex ratios for the study area are low: all but two scalds produced cortex ratios lower than 1, and the average cortex ratio for the area is 0.53 ± 0.22. Holdaway and associates (Reference Holdaway, Douglass, Fanning, Kluivig and Guttman-Bond2012) argue that the depletion of cortex among surface scatters at Rutherfords Creek was caused by foragers transporting large cortical flakes away from the area.

Figure 2. Distribution of cortex ratios from assemblages (N = 97) recorded at Rutherfords Creek.
Connecting Assemblage-Level Patterns to Landscape-Scale Activities
The Rutherfords Creek case study shows how the cortex ratio is used to demonstrate movement. Cortex ratios that deviate from expected values reflect the physical separation of the components of reduction sequences, indicating that movement of components to or from locations beyond the scope of observation occurred. Phillipps (Reference Phillipps2012:241), for example, describes “loss” of either surface or volume from local assemblages in Egyptian study areas as movement within a larger space that includes those assemblages. Such inferences require that the depletion or accretion of cortex at one place is connected to its transport to or from others. As Lin and colleagues suggest, “The relationship between Cortex Ratio variability and the various facets of occupation and mobility, such as the regularity and duration of (re)occupation or the frequency, velocity, and linearity of movement need to be assessed” (Reference Lin, McPherron and Dibble2015:102).
It is difficult to replicate behaviors that produce landscape- or regional-scale patterns since assemblage accumulation occurs over potentially long periods of time and varies between locations (Stern Reference Stern1994). Understanding patterns at these scales is not simply a matter of doing many flintknapping experiments but, instead, requires consideration of how individual-level processes (e.g., reduction, selection, movement, discard) combine over time to produce patterns that emerge at and beyond the archaeologically recorded scale (Gifford-Gonzalez Reference Gifford-Gonzalez1991). If the goal of studies employing the cortex ratio and other geometric measures is to understand human mobility, then the values measured at the level of individual assemblages need to be contextualized within wider systems of movement and discard.
Cortex ratios are calculated from lithic assemblages formed through the accumulation of discarded artifacts over a span of time, spatially circumscribed by an observational window determined by the archaeologist. Over time, stone might be worked and discarded locally, or it might move in or out of an assemblage as either unworked raw material or reduction products (i.e., cores or flakes). Knell (Reference Knell2012) illustrates five possible scenarios:
1. Raw material is reduced and discarded in the local assemblage area.
2. Raw material is reduced in the assemblage area, and some products are removed from the assemblage.
3. Raw material is imported and worked in the assemblage area, potentially breaking and being discarded locally or being transported away as finished artifacts.
4. Finished artifacts are carried into the assemblage area, are maintained through retouch, and are then removed from the assemblage area.
5. Finished artifacts are carried into the assemblage area and discarded there.
This framework indicates processes that might generate an assemblage of stone artifacts at a given place. Calculations of the cortex ratio do not differentiate between maintenance and manufacturing products. Therefore, for the purposes of this study, scenarios 3 and 4 are collapsed into a single scenario where material is brought in and flaked locally and some component of that flaking event is transported away.
Within this framework, processes related to the formation of lithic assemblages are broken down into a series of mechanistic statements that make up a conceptual model. Cores and flakes are produced through the reduction of stone, with the number of flakes relative to cores roughly corresponding to the intensity of reduction. Some of the products of reduction events might enter an archaeological assemblage immediately, while others might be selected for transportation to other locations. Movement between selection and discard events with respect to a given window of observation will determine the character of the assemblage within that window by increasing or decreasing the number of opportunities for discard or manufacture while also serving to introduce additional objects from outside the window or remove flaked objects from it.
While this model imagines movement by an individual person, this “movement” is expressed archaeologically as linear displacement between discard events, an activity with an archaeologically visible residue. It is important to recognize this difference (see Pop Reference Pop2016) and that movements could (and by all reckoning did) occur that are not accounted for in the discard record (Close Reference Close2000). Such movements would leave no trace in the cortex ratio of an assemblage. While the cortex ratio shows the positive image created by the dispersal of lithic artifacts, the negative image of human movements between discards cannot be assessed directly using this proxy. It is therefore an assumption of studies using the cortex ratio (or any study that associates patterning in artifact discard with overall movement configurations) that the discard of archaeological artifacts is embedded to some extent in the overall movement patterns of individuals in the past (Binford Reference Binford1979; Nelson Reference Nelson1991). This study seeks to evaluate the kinds of patterning a system with these properties would produce. The formational processes considered here are less complex than those they purport to represent, but simplifications are made intentionally with the aim of exploring the resultant parameter space.
Simulating the Distribution of Cortex
Assemblage-generating simulations are often used to investigate how particular artifact assemblages emerge through repeated events that reflect the organization of activities (Barton and Riel-Salvatore Reference Barton and Riel-Salvatore2014; Brantingham Reference Brantingham2003, Reference Brantingham2006; Pop Reference Pop2016; Varien and Potter Reference Varien and Potter1997; Wandsnider Reference Wandsnider, Rossignol and Wandsnider1992). Here, an agent-based computer simulation based on the conceptual model described above evaluates changes in the spatial distribution of flakes and cores and, therefore, in the cortex ratio.
The simulation, called FMODEL, uses the NetLogo modeling platform (Wilensky Reference Wilensky1999) and begins with an n × n space of gridded cells as an observation window. During a simulation run, a computerized agent moves into the window following a set of movement rules and, given the parameter settings, may stop somewhere within the window. If the agent is carrying artifacts, then a stop results in a discard event. If the agent has no artifacts, then these are manufactured according to a set of reduction rules, and products of the reduction are either discarded or carried by the agent following a set of selection rules. The following descriptions illustrate how these processes are simplified and included within the simulation.
Simulating Lithic Reduction and Selection
Nodules of stone are modeled in the simulation as icosahedra (20-sided polygons), while flakes are modeled as triangular prisms. Each flake constitutes an equal portion of the surface area of a nodule (5%) and an arbitrary but constant volume equaling less than 5% of the original nodule volume so that some component remains as a reduced core. An icosahedron balances control over cortical surface reduction and mathematic simplicity. In reality, differences in flake and core morphology will influence the degrees of cortex removed during reduction (Douglass et al. Reference Douglass, Holdaway, Fanning and Shiner2008; Parker Reference Parker2012), and estimates of volume between assemblage contents and original nodules will influence cortex ratio calculations (Lin et al. Reference Lin, McPherron and Dibble2015; Phillipps and Holdaway Reference Phillipps and Holdaway2016). In the simulation, it is useful to hold this variability constant to explore the effects of spatial behavior on outcomes.
Douglass (Reference Douglass2010) uses preferential selection and transport of cortical flakes in his explanation of the distribution of cortex ratios for recorded assemblages at Rutherfords Creek. However, studies conducted elsewhere have explained cortex ratios in terms of the transport of cores (Phillipps Reference Phillipps2012), and core transport is not unknown elsewhere in the region (Webb Reference Webb1994). Because this study seeks to explore the influence of the parameters rather than to re-create a specific situation, it is not assumed a priori that flakes or cores were targeted. Instead, each parameter setting is explored for either flakes or cores as the desired product of reduction.
Lithic assemblages typically reflect a range of patterning in reduction. At Rutherfords Creek, for example, about three-quarters of recorded cores had more than 50% of their cortex removed. However, in the model, when an agent makes an artifact, it does so to a single, preset reduction level, given as a proportion of the cortical surface of a nodule (reduction_intensity). Following reduction, flakes are selected from the local assemblage as a proportion of the flakes generated in the preceding reduction (selection_intensity). Thus, with a reduction_intensity setting of 0.5 and a selection_intensity setting of 0.8, an agent will remove 10 of the 20 possible flakes from the nodule, leaving 10 of 20 possible flakes remaining on the core, and then select 8 of 10 removed flakes for transport. Alternatively, under simulation configurations where cores are the desired product of reduction, the core in a sequence is always selected, leaving behind the number of flakes produced from the knapping event as determined by the reduction_intensity setting. In the foregoing reduction scenario, an agent targeting cores would select the core for transport, leaving behind 10 flakes.
Low cortex ratios suggest that artifacts are leaving catchments and not returning; thus the capacity for objects to leave the window is a crucial component of this assemblage formation model. But it is also possible that an individual might enter the window already carrying objects that might become part of the local assemblage. A parameter called carry_in therefore gives a proportion of the total number of artifacts an agent carries in given the reduction_intensity and selection_intensity settings; in other words, the carry_in parameter defines where the agent is in its discard cycle when it enters the window of observation. Thus, if the parameter settings in the previous example were used along with a carry_in setting of 0.5, agents would enter with four flakes on hand. By including this parameter, the different scenarios outlined by Knell (Reference Knell2012) can be explored, from individuals who enter a window empty-handed to those carrying a complete kit and all points in between. Since the reduction_intensity, selection_intensity, and carry_in parameters are percentages, these are explored between 0 and 1 in increments of 0.1.
Simulating Agent Movement and Artifact Discard
The objective of the model is to compare outcomes of movement patterns between discard events, ranging between highly constrained and highly linear, within an observation window. To do this, an agent must enter the window, follow a path through it that may or may not involve discard events, and eventually, leave the window (Figure 3). Simple random walks, where there is equal probability of taking a step in any direction, offer a null model against which expectations can be compared (Brantingham Reference Brantingham2003; Pop Reference Pop2016). These walks can be altered to model less tortuous movement by changing the probability distribution from which step lengths or directional changes are drawn (Renshaw and Henderson Reference Renshaw and Henderson1981). A special instance of this is the Lévy walk, in which the length of the step is selected from a distribution determined by the equation
 $$\begin{equation*}
P\left( l \right){\rm{ }} = {l^ - }^\mu ,
\end{equation*}$$
$$\begin{equation*}
P\left( l \right){\rm{ }} = {l^ - }^\mu ,
\end{equation*}$$
where P(l) is the probability of selecting a value with length l (Tsallis Reference Tsallis1997). When μ is greater than or equal to 3, the likelihood of selecting step lengths greater than 1 becomes increasingly small, and movement is highly tortuous (Figure 3a). As μ approaches 1, the probability of longer step lengths (termed “Lévy flights”) becomes greater as the distribution develops a long tail (Figure 3b). In a study of raw material procurement in Paleolithic societies, Brantingham (Reference Brantingham2006) used Lévy walks as part of a neutral model of hunter-gatherer mobility, arguing that patterning in modeled spatial distributions of discarded artifacts using different values of μ can assess forager planning depth.
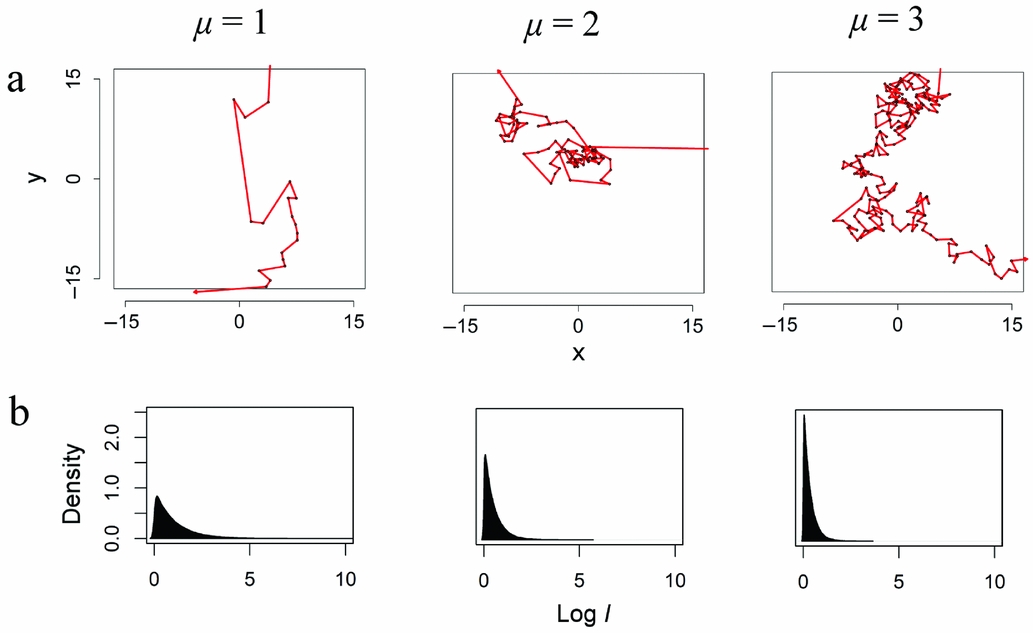
Figure 3. (a) Random walks on a two-dimensional surface, with step lengths drawn from the Lévy equation; (b) probability densities of drawing steps of length l corresponding to each of the walks above. Note that step length l is log-transformed in the density plots.
For this study, step direction is random, but the relative frequencies of short and long-distance movements produced by the equation are used to model the intensity with which an agent occupies the window of observation, with low values of μ increasing the likelihood of the agent stepping outside the window. At each stop, the agent discards one of the items in its kit, contributing to the local archaeological assemblage. This parameter, levy_mu, is explored in the model at values of 1.0, 1.5, 2.0, 2.5, and 3.0. If a step takes the agent outside of the window, the agent and any artifacts it carries are removed from the model and a new agent begins the process again. Each simulation consists of 100 iterations of this process, and each simulation is run 1,000 times to account for variation between runs. The four variables used here—reduction_intensity, selection_intensity, carry_in, and levy_mu—capture essential characteristics of the conceptual model described in the preceding section, and the combinations of their settings constitute the parameter space to be explored.
The Effects of Reduction, Selection, and Transport on Local Assemblage Cortex Ratios
Figure 4 illustrates the distributed cortex ratios of all simulation runs in which flakes were the targeted products. Cortex ratios at the lowest settings for the levy_mu parameter (that is, low tortuosity/high linearity of movement) are the most variable, becoming less so with increasing values of levy_mu. Some cortex ratios produced under the levy_mu = 1 setting are several times higher than the highest empirical values recorded for assemblages at Rutherfords Creek. But despite these disparities between low and high tortuosity outcomes, simulated cortex ratios are spread on either side of a mean value of 1.
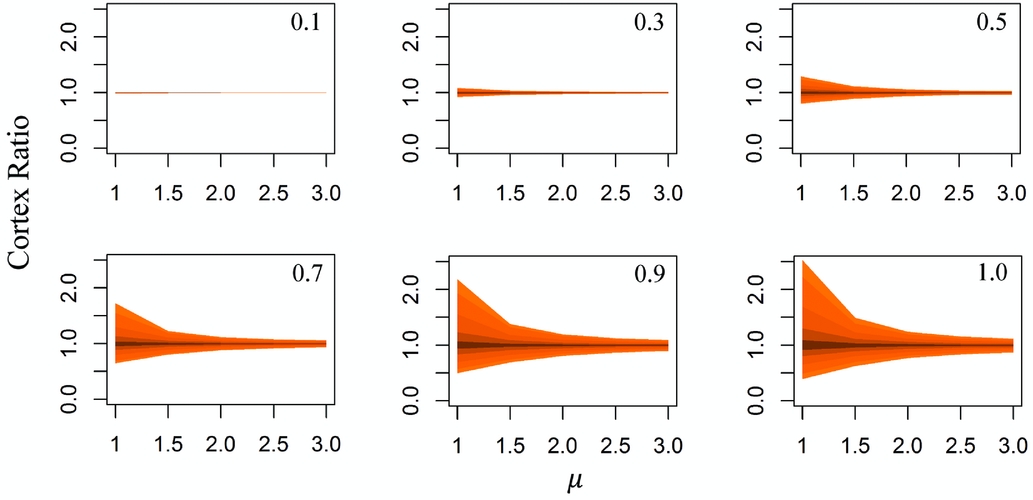
Figure 4. Ninety-five percent confidence envelopes for cortex ratios obtained from simulations using varying degrees of reduction_intensity (shown in the upper right corner of each plot) and selection_intensity (low to high = darker to lighter, outermost envelope showing selection_intensity = 1) when flakes are the objects being selected.
The degree of nodule reduction controls the amount of cortex remaining on cores relative to that present on detached flakes. At lower values of reduction_intensity, fewer flakes are produced, meaning that if flakes are the object being targeted, most of the cortex remains on the cores, and there is a greater chance that most of the flakes produced from the reduction event are discarded locally before the agent either leaves the window or runs out of flakes. At a low reduction_intensity setting of 0.1, for instance, each event produces only two flakes and therefore two discard events. At this level, the local discard of complete reduction sets strongly outweighs the impact of material being imported or exported from the observation window. At higher levels of reduction_intensity, more flakes are removed from cores and thus become available for transport, and the time between flaking events becomes longer. At a reduction_intensity setting of 1, or complete removal of the cortical surface, each event produces 20 flakes, meaning that 20 discard events occur between manufacturing events, presenting more opportunity for the agent to depart the window with a portion of the products of reduction.
Breaking these curves down according to selection_intensity settings shows how the process of artifact selection can influence cortex ratios (Figure 4). Selection itself is constrained by reduction, so the effects of differential selection are only apparent when reduction is sufficient. Under such cases, greater degrees of selection allow for greater variability in ratio values as the number of candidate flakes that potentially might be separated from cores grows. This result is corroborated by the simulation work of Parker (Reference Parker2012), who has estimated that at least 25% of the longest (and therefore, in this model, most cortical) flakes at Rutherfords Creek would need to be selected to account for the observed cortex ratios.
Similar patterning is visible in the case of cores, where greater variability is associated with lower levels of tortuosity of movement (Figure 5). This coincides with greater levels of core reduction since more cortex might remain behind in an assemblage either within the window coinciding with a higher ratio closer to 1 or beyond it in cases where carry_in is high. However, the variability in ratios for all settings is muted when cores are selected, which can be attributed to agents only carrying one core at a time. Because of this, each discard event under this setting is immediately followed by a manufacturing event and vice versa, keeping most products of reduction within the observation window and thus maintaining cortex ratios close to 1. As originally configured, only one core can ever enter or leave the window of observation in a movement sequence. Lower settings of levy_mu mean less time spent inside the window, making the impact of adding or subtracting a single core on cortex ratio values more substantial, while higher settings are more likely to leave greater numbers of complete reduction sets within the window, thereby reducing the effect of core movement.

Figure 5. Ninety-five percent confidence envelopes for cortex ratios obtained from simulations using varying degrees of reduction_intensity when cores are the objects being selected. Line styles indicate “overproduction” settings of 1× (solid), 5× (dashed), and 20× (dotted).
Relaxing the single core assumption by allowing agents to “overproduce” cores shows how a system based on greater use of cores would likewise be affected by movement as the amount of cortex capable of being carried in or left behind increases (Figure 5, dotted and dashed lines). This has a basis in previous archaeological studies: in places where stone is not readily available, core transport creates raw material sources (Webb Reference Webb1994). The effect of such “overproducing” may be mitigated to some extent by the logistical constraints imposed by moving rock as cores (Kuhn Reference Kuhn1994); from the formational standpoint presented in the model, it is easier to create imbalances with flakes than it is with cores.
When reduction_intensity is held constant at 1 (full reduction), further trends can be observed by varying the carry_in parameter. The distribution of cortex ratios shifts from below 1 to above 1 as carry_in is increased (Figure 6). This is most pronounced when the items being targeted are flakes and the tortuosity of movement is low. For example, when levy_mu and selection_intensity are set to 1 and the carry_in setting is 0, the outcomes have a mean cortex ratio of 0.38 (Figure 6, top row, black dots), shifting to a mean cortex ratio of 2.46 with a carry_in setting of 1 (Figure 6, top row, gray dots). The distributions of results for these two groups of settings do not include 1, making them distinguishable from a situation where no flaked material was moved at all.

Figure 6. Cortex ratios obtained from simulations using variable settings for carry_in (black = 0; gray = 1). Top row: simulation outcomes when flakes are the objects being selected, with degree of selection indicated in the upper right corner; bottom row: outcomes when cores are the objects being selected, with the degree of “overproduction” indicated in the upper right corner. Note that y-axis values are on a logarithmic scale.
When tortuosity is high (levy_mu = 3), a similar distribution of cortex ratios is observed, albeit with significantly reduced variability. Low levels of carry_in still produce cortex ratios lower than 1, but the mean cortex ratio is around 0.86 for simulation runs with a carry_in of 0, indicating that less of the locally produced cortex is leaving the window of observation at this setting than at the lower tortuosity setting. When the carry_in parameter is increased to 1, the influence of imported materials is offset by more frequent local production.
When cores are targeted (Figure 6, bottom row), the shift is once again less pronounced but displays the opposite trend. A carry_in of 0 produces cortex ratios higher than 1 (Figure 6, bottom row, gray dots), decreasing with greater movement tortuosity, while a carry_in value of 1 produces cortex ratios lower than 1, increasing with greater movement tortuosity. Removing cores through transport reduces the estimated number of nodules used to calculate the cortex ratio, decreasing the number of cores relative to flakes and thereby producing higher cortex ratios (cf. Phillipps and Holdaway Reference Phillipps and Holdaway2016). Adding cores increases the estimated nodules, resulting in decreased cortex ratios. The reduced variability when compared with flake-targeted assemblages is also a product of the regular cycling of reduction sets using the original settings for the model, keeping most outcomes close to 1.
Discussion
This exploratory exercise shows how cortex ratios are affected by the movement of artifact-carrying individuals as described by the model. While cortex ratios lower than 1 might be comfortably associated with higher mobility, an inverse assumption that high cortex ratios are indicative of lower levels of mobility would be false. Instead, cortex ratios lower or higher than 1 are two sides of the same coin, depending primarily on where the agent is in its discard cycle at the time it moves into the window of observation (modeled using the carry_in parameter). In the logic of the model, overall movement does not specify the value of the cortex ratio above or below 1 but, rather, controls the magnitude of variability around a mean value. If core reduction and flake or core selection are sufficient to permit such variability to emerge, low-tortuosity movement limits time spent in an observational window and thus provides fewer opportunities for discard and/or manufacture. When sufficient quantities of flakes are carried in, low-tortuosity movements result in greater proportions of discard coming from imported materials rather than local ones, inflating cortex ratios. High-tortuosity movements, on the other hand, deflate this variability by permitting more frequent cycling through local reduction sets while remaining inside of the window.
In FMODEL, to explain the localized depletion of cortex in terms of the high velocity of movement, the amount of flaked material being transported into an observational window must be substantially less than the amount of material being taken away. If quantities of cortical flakes and/or cores are brought in from outside the observation window, then depleting cortex becomes more difficult. Increasing or decreasing the number of iterations would change the overall variability between levy_mu settings, but the relationships between them would be preserved.
Archaeological discussions of changes in mobility regimes often focus on the extent to which populations were residentially or logistically mobile, and Australia's desert regions are no exception (Douglass et al. Reference Douglass, Holdaway, Fanning and Shiner2008; Smith Reference Smith2013; Smith and Ross Reference Smith and Ross2008; Veth et al. Reference Veth, Hiscock and Williams2011; Williams et al. Reference Williams, Ulm, Turney, Rohde and White2015). Defining these concepts is made complex by the relationships between the act of movement and material expressions of this movement, but both can be simply expressed by the frequency with which individuals returned to a base residence. Areas around a residential “base” feature a good deal of short, redundant moves such as those seen in higher settings of the levy_mu parameter in FMODEL, while more linear forays to and from an outlying “periphery” made for the purpose of exploiting resources resemble lower settings of levy_mu. In Australia, movement around a residential base in this way is often associated with more intensive use of resources to support higher populations (Smith and Ross Reference Smith and Ross2008:384). This contrasts with a residential foraging scheme, where distinctions between base and peripheral areas are less important, as most areas are used in similar ways. These configurations should be considered as points along a continuum. At one end, there are groups that make very few logistical forays from a base at which they are mostly resident, while at the other end, groups virtually never stop moving (Lourandos Reference Lourandos1997:20; Perreault and Brantingham Reference Perreault and Brantingham2011).
The cortex ratio was chosen as a measure of mobility in this study as it indicates movement by considering the physical separation of constituent parts of a lithic reduction sequence (Dibble et al. Reference Dibble, Shurmans, Iovita and McLaughlin2005; Douglass et al. Reference Douglass, Holdaway, Fanning and Shiner2008). Cortex ratio values at Rutherfords Creek are mostly distributed around a value of 0.53. This kind of patterning might be expected from either the removal of cortical flakes or the addition of reduced cores. At Rutherfords Creek, raw material is abundant in creek beds, stony desert pavements, and boulder-mantled outcroppings (Douglass and Holdaway Reference Douglass, Holdaway, Specht and Torrence2011). Nearly all the material encountered in surface scatters is indiscernible from local sources (Barker Reference Barker2009) and is of a size consistent with locally available raw material (Douglass and Holdaway Reference Douglass, Holdaway, Specht and Torrence2011), begging the question of why equivalent material would be brought from a distance. This suggests that patterning within the catchment is not due to the addition of exotic reduced cores but, rather, to the transport of cortical flakes away from the valley floor.
In the context of FMODEL, foragers targeting flakes and concentrating activity within a single catchment would be expected to produce a range of assemblages featuring different cortex ratios, collectively distributed around a value of 1. The extent of that variation would be determined largely by the degree of redundancy in local discard locations, described in FMODEL by the tortuosity of movements between discard events (Figure 3), and this could be used to characterize areas as more “base-like” or “periphery-like.” But if carry-in and carry-out behaviors were not significantly different between areas, the distributions of cortex ratios in both areas should still fall around 1.
The extent to which assemblages in a base vs. a peripheral area exhibit cortex ratios that are distributed around a value that is above or below 1, then, could be explained by differences in the transport and discard of stone between places. For example, if cortical flakes were regularly being carried from peripheral areas into a base, such as in a scenario where lithic resources were located at a distance from the base, then cortex ratios would highlight this imbalance by falling below 1 in peripheral assemblages and above 1 in base assemblages while also reflecting differences in variability associated with the different tortuosity models that might represent base vs. peripheral use of space. On the other hand, if the manufacture of flakes occurred within the base areas for use in the periphery, say, for an extractive task, then the opposite patterning might be expected, with cortex ratios inflated at the periphery and depressed at the base. Finally, if there were no substantial differences in the redundancy of place use but the amount of stone carried in vs. carried out differed between places, then this would generate imbalances in cortex ratios as well; however, as long as redundancy in movement patterns between discards is similar across the landscape, variability should be more or less consistent between locations. Each of these is a conceptual model that provides some expectations about assemblage cortex ratios if mobility and procurement were organized in a given way.
All the scenarios described above suggest that the spatial distribution of raw material in the landscape has the potential to influence patterning in cortex ratios, as the availability of raw material will influence whether stone can be carried out of a location and into another and vice versa. As mobile foragers moved through the landscape, reprovisioning at places with stone would have provided them with the material needed to create a mobile tool kit sometime in the future (Kuhn Reference Kuhn1992). If there is a ready supply of stone spread evenly through the landscape, foragers might generate a range of assemblage-level cortex ratios that are distributed around a value of 1. Eventually, foragers carrying stone from material-rich places might have reached places where raw material availability was diminished. This would restrict the foragers from replenishing a kit with new implements while potentially involving the discard of imported material into local assemblages as artifacts became worn or broken. If the behavior continued, imported flaked objects would build up over time without comparable export from local sources through replenishment. In FMODEL, this would be akin to a high carry-in/low carry-out situation. These same foragers, faced with a dwindling kit in a place with limited stone resources, might have returned to places where stone resources were more readily accessible, replenishing their kit upon arrival and continuing to forage. This would be akin to the inverse in FMODEL: a low carry-in/high carry-out situation.
The effect of differential raw material access can be illustrated using the FMODEL framework. As in the original configuration, agents move through the world following a Lévy walk, discarding artifacts, manufacturing them when they have an empty tool kit according to a set level of reduction, and adding them to their mobile tool kit according to a preset selection level. However, instead of modeling the movement paths of multiple individuals through a window, the world is wrapped as a torus, such that the left side of the world is connected to the right and the bottom is connected to the top, mimicking a continuous space. Because the agent never leaves this world, the need for the carry_in parameter is eliminated. In this model, agents move through an environment that is divided into equal areas of high and low raw material availability and high and low tortuosity of movement (Supplemental Figure 1; Supplemental Text 2). Any cell within the world can be a raw material source, but the frequency of these raw material cells on each side of the model world is determined as a percentage of the total number of cells (by variables called left_abundance and right_abundance, respectively; Supplemental Figure 1a and 1b). Unlike in the previous incarnation of FMODEL, an agent cannot replenish its kit until it encounters a raw material source. Finally, the mobility of the agents can be differentiated between the two abundance areas by using different settings of μ for the two sides of the world (left_mu and right_mu), allowing the model to simulate differences in tortuosity between core (high-μ) and periphery (low-μ) areas (Supplemental Figure 1c and 1d). Simulations were run using reduction_intensity and selection_intensity settings of 1, as well as the parameter configurations in Table 1. Each simulation was run until 100 reductions had occurred, and cortex ratios were calculated for assemblages on the left and right sides.
Table 1. Parameter Settings for Alternative Configurations of FMODEL.

When this model is explored (Figure 7), settings with no difference in abundance between the two sides (“Logistic [Even]” and “Residential [Even]”) produce cortex ratios distributed around 1. Where the tortuosity of movement differs between the two sides, cortex ratios are more variable in areas of lower tortuosity. However, changing the abundances in raw material availability pushes distributions away from 1, creating distinctions between the two modeled regions. Cortex ratios decrease where raw material is more abundant and increase where it is scarcer (“Residential [Uneven]”). The disparity between stone-rich and stone-poor areas becomes more exaggerated as the difference in tortuosity of movement between them becomes greater (“Stone-Poor Base” and “Stone-Rich Base”).

Figure 7. Influence of raw material distribution on assemblage cortex ratios in FMODEL. Top row: residential-type mobility configurations; bottom row: logistic-type mobility configurations.
These simulations use settings aimed to demonstrate differences but show that while the carry-in and carry-out components are the proximate determinants of the degree of deviation in assemblage-level cortex ratios, these components can be imposed on a forager moving randomly across space and gearing up as needed by introducing disparities in the availability of raw material within the landscape. It could be that the empirical results obtained for the cortex ratios at Rutherfords Creek are influenced by the availability of raw stone material. Stone resources may not have attracted people to Rutherfords Creek specifically, as these resources can be found in great abundances throughout the area surrounding Peery Lake and at many points beyond in the wider region (Holdaway and Fanning Reference Holdaway and Fanning2014). But Rutherfords Creek and these other areas do differ from places with limited stone resources. Stone-poor areas can be found beyond the Rutherfords Creek catchment, in several directions at distances measured in tens to hundreds of kilometers (e.g., lunettes within the Paroo Overflow lakes, Darling River floodplains). If foraging took people through Rutherfords Creek and on into areas without stone, those areas could have absorbed transported flakes as low-density scatters that are difficult to detect in a conventional archaeological survey intent on finding concentrations of artifacts.
Under this scenario, differences in cortex ratios between places rich and poor in raw material could be determined by the relative value of the places as foraging environments. In areas with high degrees of overlap between abundant raw material and similarly abundant subsistence resources, the shift in the mean of cortex ratios might not be substantial, as the local cycling of manufacture and discard would be expected to outweigh the overall loss of material to areas with poor economic and raw material resources. The result would be cortex ratios that are marginally depressed at the base but inflated and highly variable at the periphery (the “Stone-Rich Base” configuration in Figure 7). Given their broad distribution around a mean value considerably lower than 1, the cortex ratios from Rutherfords Creek do not match this pattern. Instead, the Rutherfords Creek assemblages might be better described by low-tortuosity movement patterns such as those in a model that puts the stone-rich creek at the periphery (the “Stone-Poor Base” configuration in Figure 7) or a model where the zones for resource extraction and stone availability are of different sizes, prompting disproportionate loss of cortical stone from stone-rich areas to stone-poor ones.
This brings up an important consideration regarding how these results should be interpreted with respect to cortex ratios recorded in the field. Because the spatial definition of assemblages affects how the ratios are calculated, finding patterns elsewhere that make sense in terms of mobility will require careful consideration of survey methods. For example, if assemblages are targeted for survey in areas immediately adjacent to visible cores, then these might demonstrate deflated cortex ratios when in fact inflated ratios are present at a wider spatial scale. This is an example of the “modifiable areal unit problem” in geography (Bevan and Conolly Reference Bevan and Conolly2009; Openshaw Reference Openshaw1983). At Rutherfords Creek, surveys were conducted on 97 randomly chosen exposures of varying sizes, ranging from 10 m2 to more than 5,000 m2; area calculations exist for 94 of these. Among the sampled exposures, there is no linear relationship between exposure size and cortex ratio (p = 0.838; adjusted R 2 = −0.01041; Figure 8), indicating that the recorded cortex ratios are not directionally biased with respect to the size of the areal units.

Figure 8. Relationship between scald area and cortex ratio (n = 94).
This exercise demonstrates how combining movement-sensitive proxies with exploratory modeling can generate tests for contrasting interpretations of past mobility. The cortex ratio is particularly useful in this case because it can be used with comparative ease to characterize collections of stone artifacts numbering in the tens of thousands. Methods such as lithic sourcing and refitting are advantageous in other ways (Clarkson Reference Clarkson, David and Thomas2008), but these also require contextualization to go beyond what Close describes as “someone once walked from A to B” (2000:72).
The models presented here provide context for asking new questions about mobility in terms of the formation of archaeological patterning. If existing ideas about logistical and residential foraging such as those proposed for arid Australia can be bounded within the spectrum of greater or lesser movement linearity at different places within the landscape (Lourandos Reference Lourandos1997:20), these models can be connected to expectations about the formation of patterning in proxies such as the cortex ratio that are sensitive to the frequent separation of their constituent parts through time. While the reasoning behind such movement behavior is still open to explanation (Kuhn et al. Reference Kuhn, Raichlen and Clark2016:90; Nathan Reference Nathan2008), these interpretations carry with them predictions about the kinds of patterning that should be encountered were they in operation, with the aim of using existing and future field data to test those predictions.
Conclusions
This study presents a simple model of the formation of archaeological patterning through the manufacture, transport, and discard of flaked-stone implements across a spectrum of movement. Simulations allow archaeologists to experiment with the kinds of behaviors that cannot be undertaken in a laboratory setting, such as the movements of people over long time periods. The model and simulations presented here are not definitive reconstructions of past human activity at Rutherfords Creek or anywhere else but are instead tools with which to think about the formation of archaeological patterning that empirical studies indicate.
The patterning in cortex ratios at Rutherfords Creek is consistent with some of the parameter settings used in the simulations presented here, prompting some expectations about the record elsewhere, assuming the analogical relationship between the model and the world holds. Results suggest that maintaining a distribution of cortex ratios with a mean value significantly lower than expected is consistent with a model that assumes people moved away frequently carrying cortical flakes while also acknowledging that these low cortex ratios indicate only one side of such a movement pattern. The model suggests that patterning should vary when movements took people across zones with limited raw material access, something that occurred in places around Rutherfords Creek. Whether these expectations will be borne out in future studies remains to be seen, but surveys aimed at testing the model should be designed with model outcomes in mind.
More broadly, these results are significant because they support warnings that the material correlates across the logistical-to-residential mobility spectrum need to be carefully considered (Kelly Reference Kelly2013). Despite the temptation to interpret the presence of certain types of stone artifacts such as the tula adze or the intensity of nodule reduction as diagnostic of forms of residential mobility, more certainty is needed about the ultimate causes of stone artifact assemblage variability before drawing inferences about changes in the organization of Holocene Aboriginal society. The kinds of patterning that are diagnostic of such changes are unlikely to be seen in individual record components and require datasets and models that explicitly engage with the emergent properties of the wider formational systems under investigation.
Acknowledgments
We acknowledge the Barkinji people as the traditional owners of country around Rutherfords Creek, and their permission to conduct research there is greatly appreciated. This article benefited from discussions with David O'Sullivan, Daniel Parker, and Jonathan Reeves, while Matthew Douglass provided helpful commentary on an earlier draft. Karolyn Buhring and Oscar Toro Bardecci prepared the Spanish abstract. Funding was provided by an Australian Research Council Discovery Project Grant (DP0557439), Macquarie and University of Auckland research grants to Fanning and Holdaway, and a University of Auckland Doctoral Scholarship to Davies. Briar Sefton drew the original map in Figure 1.
Data Availability Statement
NetLogo simulation files, lithics data, and the R code used to generate the graphics can be found at https://github.com/b-davies/FMODEL.
Supplemental Materials
For supplementary material accompanying this article, visit https://doi.org/10.1017/aaq.2018.23.
Supplemental Text 1. Modeling Relationships between Space, Movement, and Lithic Geometric Attributes
Supplemental Text 2. Supplemental Figure 1 Caption
Supplemental Figure 1. (a–d) Illustrations of different parameter settings for alternative configurations of FMODEL.


