

Implications
To reduce our dependency on phosphate rock, the finite resource for mineral P, insight is needed in the effect of prevention and recycling mineral P waste, and in changes in the level of animal protein in human diets. Recycling of human excreta showed most potential to reduce P waste from our hypothetical food system, followed by prevention and finally recycling of agricultural waste, such as animal meal. Recycling of these is currently hindered by technical challenges (human excreta) and legislation (animal meal). Reducing consumption of animal protein in developed countries, moreover, resulted in reduced use of mineral phosphorus.
Introduction
Sustainable food security has become a prominent research topic (West et al., Reference West, Gerber, Engstrom, Mueller, Brauman, Carlson, Cassidy, Johnston, MacDonald, Ray and Siebert2014). The urge to produce safe and nutritious food in a sustainable way is mainly driven by two challenges: feeding a growing and more prosperous world population, and reducing the environmental impact of food production. The current food production system largely depends on supplies of mineral phosphorus (P). Mineral P is derived from rock phosphate, which is a finite resource. Mineral P is an essential nutrient for crop and grass growth, and, hence, is essential for food security (Smil, Reference Smil2000). However, use of P in the global food system is rather inefficient, and sustainable food security requires a more sustainable use of mineral P (Cordell and White, Reference Cordell and White2015). This can be achieved by preventing waste of crop and animal products, disposal of industrial processing water and human excreta, and leaching and run-off from agricultural land (Cordell et al., Reference Cordell, Drangert and White2009; Smit et al., Reference Smit, van Middelkoop, van Dijk and van Reuler2015), and also by changing human consumption patterns towards diets that contain less animal-source food (ASF) (Schmid Neset et al., Reference Schmid Neset, Bader, Scheidegger and Lohm2008; Bai et al., Reference Bai, Ma, Ma, Qin, Velthof, Oenema and Zhang2016).
The aim of our modelling exercise was to assess the potential of preventing and recycling P waste in a food system, in order to reduce the dependency on phosphate rock. To this end, we modelled a hypothetical food system designed to produce sufficient food for a fixed population with a minimum requirement of mineral P input. This model included representative crop and animal production systems, and was parameterised using data from the Netherlands. We assumed no import or export of feed and food. We furthermore assumed small P soil losses from run-off and leaching and no net P accumulation in soils, which is typical for northwest European conditions nowadays (Sattari et al., Reference Sattari, Bouwman, Giller and van Ittersum2012). We also explored the effect of this assumption. We assessed mineral P input for a baseline situation and six alternative situations. These alternative situations were designed to assess the effect of (1) preventing waste of crop and animal products, (2) fully recycling waste of crop products, (3) fully recycling waste of animal products, (4) fully recycling human excreta and industrial processing water, (5) a combination of prevention and recycling as applied in alternative situations 1 and 4, and (6) a combination of recycling as applied in alternative situations 2, 3 and 4. Within each situation, we moreover studied the impact of consumption of protein from animals (PA) on P input requirement of the food system.
Material and methods
We compared mineral P input requirements between a baseline situation and six alternative situations. Within each situation, we also studied the impact of consumption of ASF (meat and milk), by varying PA from 0% to 80%. To quantify the use of mineral P in each situation, we extended the optimisation model developed by (Van Kernebeek et al., Reference Van Kernebeek, Oosting, Van Ittersum, Bikker and De Boer2016). This extended model had the objective function to minimise mineral P input from feed additive for all animal types k, and mineral fertiliser for all crop rotations i on all land types l (equation (1)), while producing sufficient food for a fixed population. The crop and animal production system were parameterised using data from the Netherlands. The related constraints of the model are land availability, crop rotation (i=1 … 7), land type (j=1 … 3), and type of livestock (k=1, 2) (see sections on crop production system and animal production system for further details).
 $${\rm Min}\left( {\mathop \sum\limits_{k{\equals}1}^2 P_{{{\rm Feed}\,{\rm additive},\,{\rm }k}} {\plus}\mathop \sum\limits_{i{\equals}1}^7 \mathop \sum\limits_{j{\equals}1}^3 P_{{{\rm Mineral}\,{\rm fertiliser},\,i,\,\,j}} } \right){\rm }$$
We first describe key features of this extended model, and then define the baseline situation and alternative situations. Finally, we describe the extended model in more detail.
System definition
Our hypothetical food system comprises the following processes: crop cultivation, post-harvest crop storage, feed processing, food processing, animal husbandry, processing of animals and their products (slaughtering, pasteurisation of milk, etc.), manure storage, human consumption and waste water treatment (Figure 1). The purpose of the system was to produce enough nutritional energy and protein to feed a population of 17 million people, which is approximately the current population size in the Netherlands. Daily per capita nutritional requirements were defined as 2000 kcal and 57 g protein (EFSA, 2009 and 2012). Total sugar intake was limited to the maximum recommended intake level of 32.9 kg per capita per year (EFSA, 2009). Crop products available for human consumption (Supplementary Material S1) could be consumed without any further restrictions. In addition to crop products, humans could consume milk and beef from dairy cows, and pork from pigs. The selection of crop and animal products resulted in a hypothetical and sober diet. We computed energy, protein, sugar and P intake based on nutrient contents presented by the Dutch nutrient database NEVO (RIVM, 2013). We assumed that all P consumed was excreted. Waste of P (Efflux; (E) in Figure 1) occurred through losses and waste of crop and animal products (including animal meal), human excreta, waste water from industrial processing of crops, and through leaching and run-off of P from cropland. To simplify our writing, we refer to waste for all above-mentioned losses and waste, except for P loss through leaching and run-off, as these were fixed, and not considered for prevention or recycling.
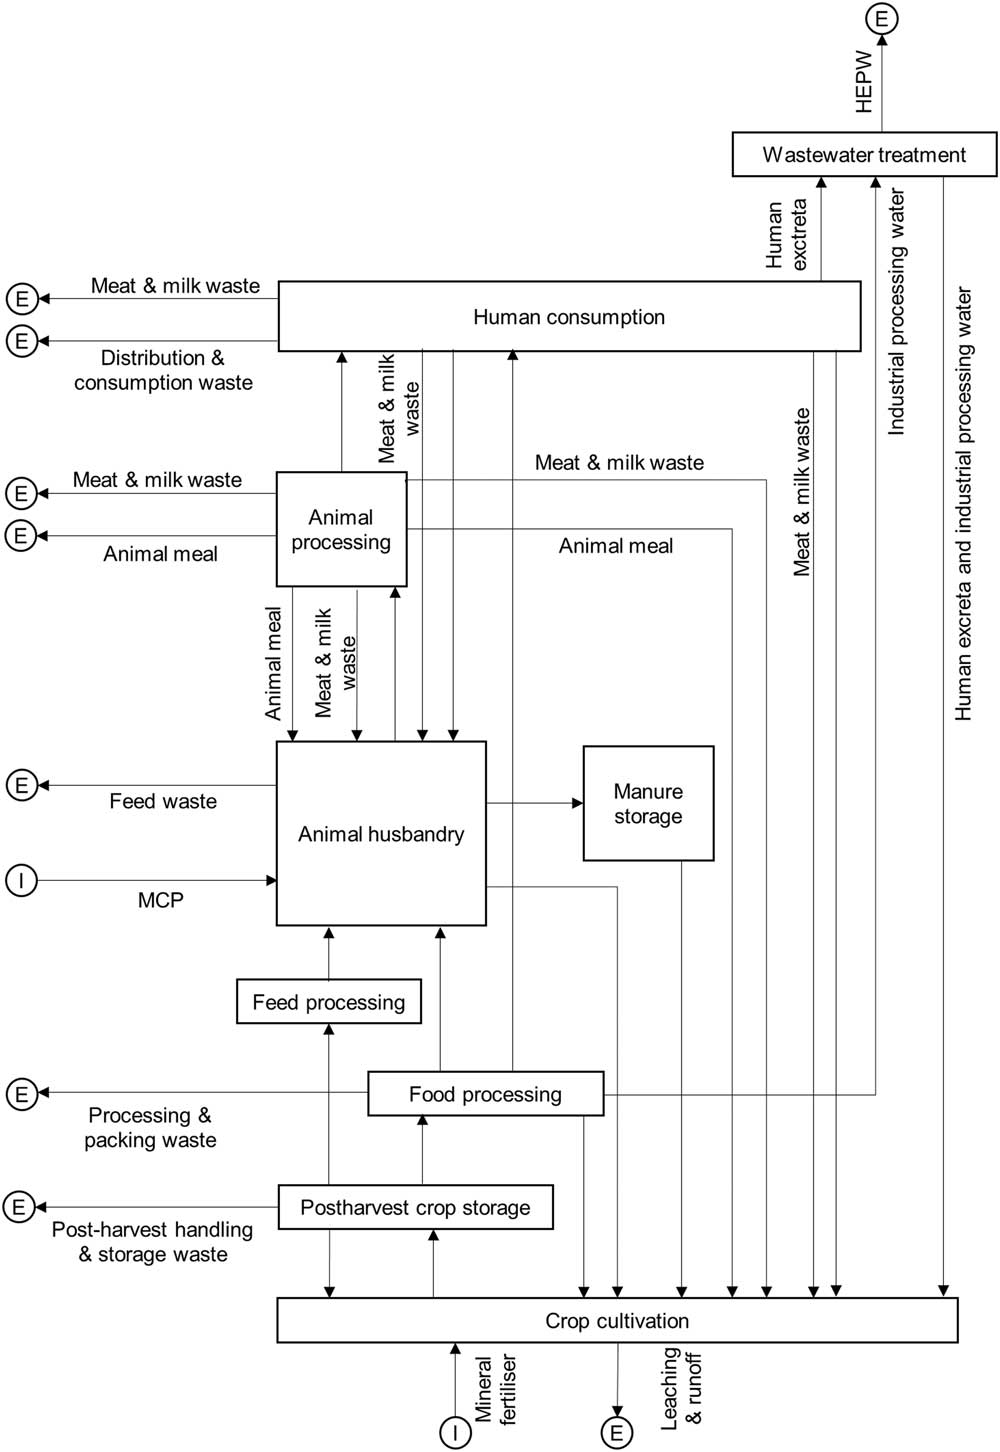
Figure 1 Phosphorus input (I), output (E), and flows through the system. P flows are incorporated in crops or crop products, unless specified otherwise. MCP=monocalcium phosphate; HEPW=human excreta and industrial processing water.
Depending on the situation (i.e. baseline or alternative situation), we allowed for recycling of wasted P. When recycled, we assumed that waste of crop and animal products could be converted into animal feed or crop fertiliser, and that human excreta and industrial processing water could be converted into crop fertiliser only (Figure 1). Inputs of mineral P in the system included monocalcium phosphate (MCP) as feed additive, and mineral fertiliser P.
Prevention and recycling of wasted phosphorus to close the phosphorus cycle
In the baseline situation, we assumed that at most 42% of waste of crop products could potentially be recycled (Soethoudt and Timmermans (Reference Soethoudt and Timmermans2013) and Supplementary Material S2). Animal wastes, including slaughterhouse wastes (i.e. animal meal), were not recycled, as this is restricted by EU legislation (European Commission, 2009). We furthermore assumed no recycling of P from human excreta and industrial processing water, as sewage sludge from communal processing water treatment plants is currently not reused in agriculture, and sewage sludge from industrial processing water treatment plants is only reused in agriculture to a limited extent (10%) (Smit et al., Reference Smit, van Middelkoop, van Dijk and van Reuler2015; CBS, 2016b).
We subsequently explored the impact of prevention and recycling of wasted P in six alternative situations (Table 1). In the first alternative situation (P_Waste_Crop_Animal) we explored the impact of prevention of all waste of crop and animal products, including the full utilisation of animal meal. If waste of crop and animal products cannot be prevented, than the most promising strategy to reduce food waste according to the food waste hierarchy was recycling into feed or fertiliser (Papargyropoulou et al., Reference Papargyropoulou, Lozano, Steinberger, Wright and Ujang2014). In the second and third alternative situation (R_Waste_Crop and R_Waste_Animal), therefore, we assumed that waste of respectively crop and animal products (meat, milk and animal meal) were fully recycled. In the fourth alternative situation (R_Humexc_ProcWater), we explored the impact of fully recycling human excreta and industrial processing water. This situation was chosen given the substantial waste of P from sewage sludge in the Netherlands (Smit et al., Reference Smit, van Middelkoop, van Dijk and van Reuler2015), as human excreta, in particular urine, is rich in phosphorus, and, hence, recycling human excreta can substantially reduce the use of mineral P fertiliser (Jönsson et al., Reference Jönsson, Stinzing, Vinneras and Salomon2004). In the fifth and sixth alternative situation, we explored the impacts of a combination of prevention and recycling as applied in alternative situations 1 and 4 (Combi_1), and the impacts of a combination of recycling as applied in alternative situations 2, 3 and 4 (Combi_2).
Table 1 Characteristics of the baseline situation and alternative situations
ASF=animal-source food; HEPW=human excreta and processing water; P=prevention; R=recycling, Humexc_ProcWater=Human excreta and processing water.
Crop products, animal products and HEPW can be recycled as feed or fertiliser.
Crop production system
Production of crops and forage were limited by the current Dutch agricultural areas of clay soils (839×103 ha), sandy soils (779×103 ha) and peat soils (224×103 ha) (Lesschen et al., Reference Lesschen, Heesmans, Mol-Dijkstra, van Doorn, Verkaik, van den Wyngaert and Kuikman2012). We assumed that clay and sandy soils can be used for cultivation of crops and forage, whereas peat soils were assumed suitable only for cultivation of grass (Van Kernebeek et al., Reference Van Kernebeek, Oosting, Van Ittersum, Bikker and De Boer2016). Crops in our model included wheat, potato, sugar beets, rapeseed and brown beans (Van Kernebeek et al., Reference Van Kernebeek, Oosting, Van Ittersum, Bikker and De Boer2016). In addition to crops, we considered production of maize and grass silage, and fresh grass as forage for dairy cattle. Crops were cultivated in rotations (Van Kernebeek et al., Reference Van Kernebeek, Oosting, Van Ittersum, Bikker and De Boer2016). We considered all above-ground biomass of the crops as potential food and/or feed ingredients, except for wheat and maize stubble, potato haulms, sugar beet leaves and bean straw. These parts of the crops were assumed to stay behind on the field as source of soil organic carbon, and as such also contributed to fertilisation with P. In the following section, we briefly describe crop fertilisation with P. We assumed nitrogen and potassium fertilisation such that P can be used efficiently by the crops and grassland. More details on fertilisation with P are provided in Supplementary Material S3.
Crop fertilisation
We assumed long-term stable P contents of soils and, hence, no net accumulation of P in soils. We consider this assumption justified and feasible for the situation in the Netherlands with large soil stocks of P (Verloop et al., Reference Verloop, Oenema, Burgers, Aarts and van Keulen2010; Sattari et al., Reference Sattari, Bouwman, Giller and van Ittersum2012). The effect of this assumption will be assessed in the results section for the baseline situation. Total amount of P required per ha for each crop rotation was computed from the P content of all crops in that rotation and unavoidable losses through leaching and run-off (Supplementary Material S3). The latter was assumed 2.2 kg P/ha on all soil types and crop rotations.
The required P was provided by variable sources, that is mineral fertiliser, animal manure, variable crop residues (defined here as co-products that could either be left on the field or be harvested as feed, that is wheat straw, sugar beet tops and tails, and rapeseed straw), crop products returned back to the land (either or not after they are wasted), human excreta and industrial processing water, wasted ASF and animal meal (Supplementary Material S3). For all recycled and organic fertiliser sources, we assumed a P fertiliser replacement value relative to mineral fertiliser of 100% (De Haan and Van Geel, Reference De Haan and Van Geel2013; Severin et al., Reference Severin, Breuer, Rex, Stemann, Adam, Van den Weghe and Kücke2014). Availability of these resources depended, logically, on the situation explored and PA%.
Animal production system
We included two animal production systems with contrasting abilities to use marginal land : pig production as representative for monogastrics, who generally consume feed from land suitable for cultivation of crops, and dairy production as representative for ruminants, who can value marginal grassland. The dairy production system was a non-grazing system, as to avoid grass uptake inherent to grazing. We modelled dairy and pig production based on animal production units (PUs). One pig PU consisted of 3.3 fattening pigs, 0.12 sows and 0.07 gilts, and produced 171 kg pork/year (Van Kernebeek et al., Reference Van Kernebeek, Oosting, Van Ittersum, Bikker and De Boer2016). One cow PU consisted of a dairy cow and its replacement stock, i.e. 0.31 replacement heifers aged 1 to 2 years, and 0.34 replacement calves aged 0 to 1 year (Van Kernebeek et al., Reference Van Kernebeek, Oosting, Van Ittersum, Bikker and De Boer2016). We assumed that surplus calves were slaughtered directly after birth. One cow PU produced 8502 kg fat-and-protein-corrected-milk (FPCM) and 74 kg meat/year, both derived only from the milking cow (Van Kernebeek et al., Reference Van Kernebeek, Oosting, Van Ittersum, Bikker and De Boer2016). Dietary requirements and intake restrictions of each PU are provided in Supplementary Material S4. As our feed ingredients contained relatively low digestible-P contents for pigs, we included a mineral source of phosphorus as potential P additive in the pig ration, to better enable a positive P balance in pigs. To treat cows and pigs equally, we also allowed this P additive in rations of cows. We chose MCP as P additive, with P digestibility of 83% for pigs (PDV, 2011) and 100% for cows. In situations where animal meal was recycled, animal meal could be consumed by animals with P digestibility of 74% for pigs (PDV, 2011) and 100% for cows.
Phosphorus excretion by animals and phosphorus retention in animal products
We computed P excretion by animals as the difference between P intake and P retention in animals and their products (excluding P retained in milk consumed by replacement calves, which eventually ends up in manure). P retention per animal PU was computed from P concentrations in body tissue and milk, and animal production data (Table 2 and Supplementary Material S5). We distinguished between P retained in ASF, which is either eaten or wasted, and in non-edible animal products. P retained in ASF that is consumed by humans (i.e. non-wasted ASF) finally ends up in human excreta, and is wasted in case human excreta are not recycled. P retained in wasted ASF was lost in situations where animal products were not recycled. Besides bones, organs, blood, etc., non-edible products also included the bodies of surplus calves, as we assumed that these were eliminated after birth, and of dead animals. We assumed that all non-edible products from animals were converted into animal meal. P retained in animal meal was lost in situations where animal products were not recycled. Moreover, in situations where waste of ASF is prevented (P_Waste_Crop_Animal and Combi_1), more HEP per PU is available for human consumption (Table 2).
Table 2 Production of human edible protein (HEP) per year for a pig and a cow production unit (PU) (kg HEP/year), P retention in non-edible products, wasted ASF, and in non-wasted ASF (kg P/kg HEP), and P waste (kg P/kg HEP) for the baseline situation and alternative situations
PU=production unit, HEP=human edible protein, ASF=animal-source food.
aHEP available for consumption was computed from meat and milk production, N-content of meat and milk, and fractions of meat and milk waste along the chain.
Crop processing
Harvested crops were assigned to industrial food processing or industrial feed processing, or were ensilaged (maize and grass silage) (Supplementary Material S1). We defined industrial food processing as resulting in multiple crops products, of which at least one is edible for humans (Van Kernebeek et al., Reference Van Kernebeek, Oosting, Van Ittersum, Bikker and De Boer2016), whereas industrial feed processing resulted in a crop product that is edible for animals only. We assured closed P balances in industrial food processing; P content of harvested crop was equal to P content in the sum of output products (including waste) plus P content of processing water (Supplementary Material S6). In those cases where the P content in the sum of output products was lower than in the harvested crop, we assumed that the remaining P were dissolved in processing water. This was the case for potato and sugar beet processing.
Waste of crop and animal products
To account for waste of crop products and ASF, we applied waste fractions as estimated by Gustavsson et al. (Reference Gustavsson, Cederberg, Sonesson and Emanuelsson2013) and Remmelink et al. (Reference Remmelink, Blanken, Van Middelkoop, Ouweltjes and Wemmenhove2012). Waste of various crops and crop products during post-harvest handling and storage ranged between 1% and 9% of dry matter (DM), during food processing and packing between 5% and 15% of DM, during distribution and human consumption between 5% and 27%, and during feeding between 2% and 29%. Waste of meat and milk during post-harvest handling and storage ranged between 0.5% and 0.7%, during processing and packing between 1.2% and 5%, during distribution and human consumption between 0.7% and 14.5% (Supplementary Material S2).
Results
Baseline situation
Figure 2 shows the P flows through the food system in the baseline situation, in which at most 42% of crop waste was recycled, and diets contained 60% PA (the current average PA% in the Dutch diet (RIVM, 2009)). The external input of mineral P into this food system was 16 103 ton per year, all in the form of mineral fertiliser. The amount of mineral P input equalled the sum of all wasted P in the food system, and P lost through leaching and run-off, as we assumed no accumulation of P in soils. The majority of the wasted P in the food system resulted from wasting valuable P in human excreta (8509 ton), followed by P loss through leaching and run-off (2773 ton), P waste along the crop production chain (2660 ton), or the animal production chain (1824 ton), and P waste in industrial processing water (337 ton). Recycling of P in human excreta in the food system, therefore, shows great potential to save mineral P.
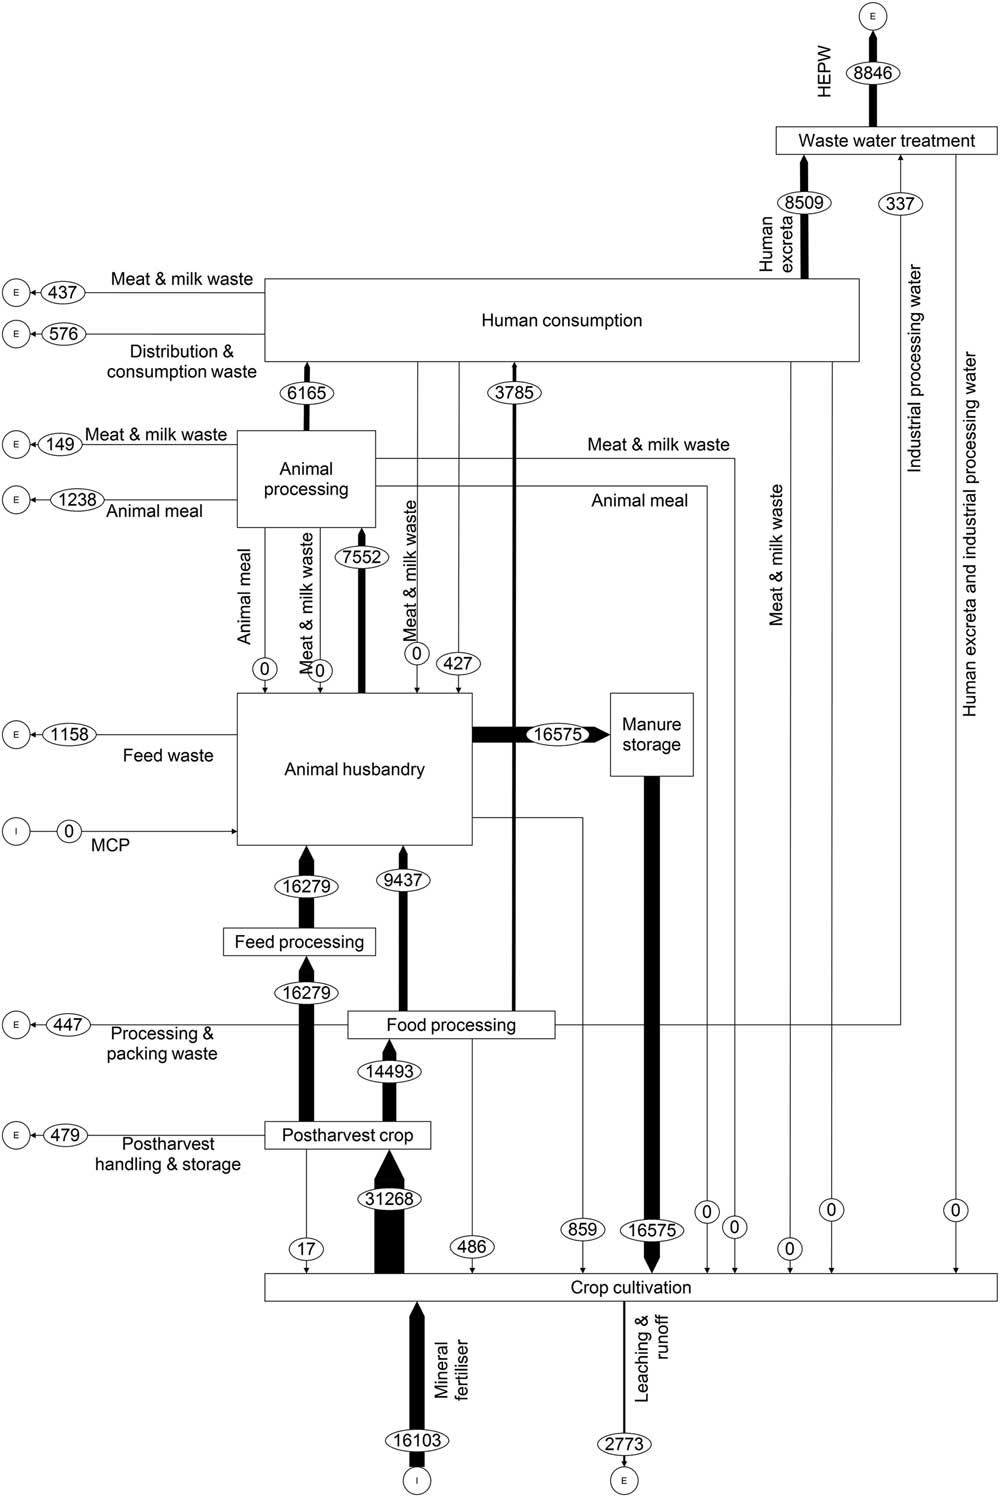
Figure 2 Phosphorus input (I), output (E), and flows through the system (ton P) in the baseline situation with 60% protein from animals. P flows are incorporated in crops or crop products, unless specified otherwise. MCP=monocalcium phosphate, HEPW=human excreta and industrial processing water.
When the %PA was increased in the baseline situation, the input of mineral P into the food system also increased (Figures 3 and 4). To unravel the observed relation between %PA and mineral P input, we present key parameters describing the P flow in the food system (Figure 2), for varying %PA in Table 3. We do this in two steps; first we explain the difference in P flows between a diet with 0% PA (i.e. a vegan diet) and a diet with 10% PA. Second, we explain the difference in P flows between a diet with 10% PA and one with 60% PA. The increase in P waste from a diet that contained 0% PA to a diet that contained 10% PA is a result of two opposite effects. On the one hand, a diet with 10% PA required less land, and therefore had lower associated P losses through leaching and run-off, than a diet with 0% PA (Table 3). The lower land use of a diet with about 10% PA is in agreement with results of Van Kernebeek et al. (Reference Van Kernebeek, Oosting, Van Ittersum, Bikker and De Boer2016), who demonstrated that land use was most efficient if people would consume a small amount of ASF derived from so-called default livestock (Fairlie, Reference Fairlie2010). Default livestock converts co-products from crop production that are inedible for humans, such as wheat straw and sugar beet pulp, into protein-rich meat and milk. In a vegan diet, these human inedible co-products are not used for food production, and, hence, additional cropland is required to meet the energy and protein requirements of the population. A vegan diet, furthermore, results in higher P waste from processing and human consumption of crop products than a diet with 10% PA, in which crop products are partly displaced by animal products. On the other hand, a diet with 10% PA resulted in higher P waste during post-harvest storage of crop products used for feed, and higher feeding wastes. This can be explained as follows. In a vegan diet, co-products from crop production, such as wheat straw, were not harvested from the land, but, instead, were left on the field as source of P. Harvesting these co-products to feed the animals, therefore, resulted in higher wastes during storage and during the feeding process on the farm. Logically, a diet with 10% PA also resulted in higher waste of animal products during processing of animals and their products, and higher waste of ASF during human consumption than a vegan diet. Finally, P waste through human excretion increased as the %PA increased. This increase in P waste has two causes. First, milk, being the main source of animal protein in a diet with 10% PA, has a higher P : N ratio than crop products. Second, human excreta were wasted in the baseline situation, implying that a diet with ASF resulted in a larger waste through human excreta than a vegan diet.
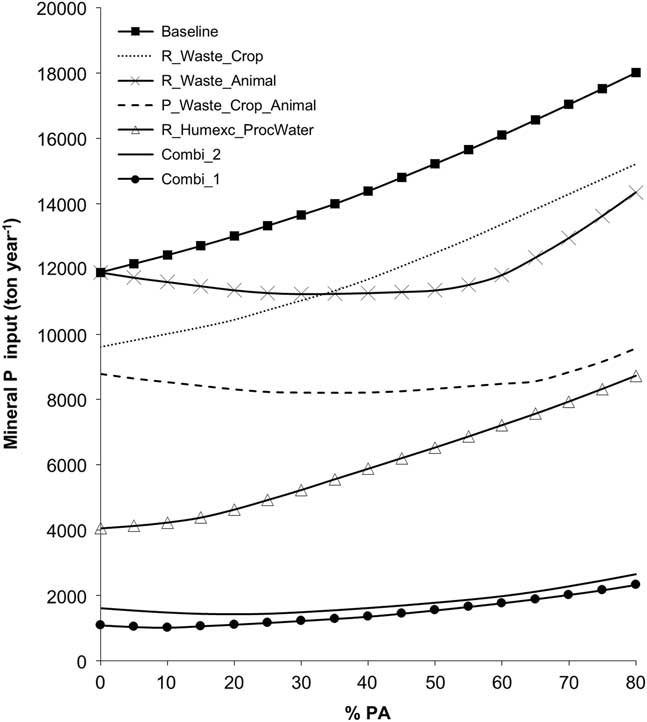
Figure 3 Mineral phosphorus (P) input (ton/year) for the baseline situation and the alternative situations, for diets varying in their contribution of protein from animals (%PA). See Table 1 for description of the alternative situations.
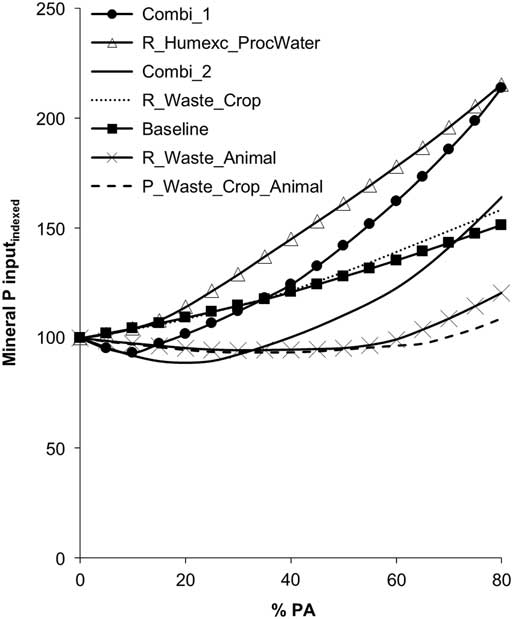
Figure 4 Mineral phosphorus (P) input (indexed) for the baseline situation and the alternative situations, for diets varying in their contribution of protein from animals (%PA). See Table 1 for description of the alternative situations.
Table 3 Mineral P input requirement (ton), P input (ton), P waste (ton), number of cow and pig production units (PU) (1000 PU), and land use (1000 ha) in the baseline situation for diets varying in percentage of protein from animals (%PA)
%PA=percentage of protein from animals; MCP=monocalcium phosphate; PU=production unit.
Overall, the mineral P input requirement of the food system increased from 0% to 10% PA, because the positive effects of a lower land use (i.e. lower P losses through leaching and run-off) and reduced processing and human consumption of crop products, were outweighed by the negative effects of producing and consuming ASF.
When increasing PA from 10% to 60%, the same trends in P waste were observed, except for P losses through leaching and run-off. These P losses increased as the demand for animal protein exceeded the amount that can be obtained from default livestock (Van Kernebeek et al., Reference Van Kernebeek, Oosting, Van Ittersum, Bikker and De Boer2016). Unlike in a diet with 10% PA, where default livestock is fed merely on co-products from food production and processing, a diet with 60% PA required specific cultivation of feed crops to feed the animals (Van Kernebeek et al., Reference Van Kernebeek, Oosting, Van Ittersum, Bikker and De Boer2016).
Cows appeared more P efficient than pigs in the baseline situation, explaining why milk and associated beef were the main source of animal protein in the human diet (Supplementary Material S7). This higher P efficiency of cows had two causes. First, cows were better able to convert available co-products, such as wheat straw, into protein-rich milk and meat (Van Kernebeek et al., Reference Van Kernebeek, Oosting, Van Ittersum, Bikker and De Boer2016). Second, P waste via cows was lower than via pigs in the baseline situation, because P retained in animal products (non-edible products, wasted ASF and non-wasted ASF) were not recycled. The amount of P retained in the sum of these products per kg of animal protein was lower for cows than for pigs (Table 2).
The above-mentioned results hold for a situation with small P losses through leaching and run-off (2.2. kg P/ha per year). The mineral P input requirement would have increased with up to a factor two (67% to 105%) if we would have assumed leaching and run-off, or equivalent enhanced accumulation of P in soils, of 13 kg P/ha per year (Supplementary Material S8). In that case, moreover, mineral P input was relatively constant between 0% and 20% PA, with a minimum at 10% PA, and subsequently increased with increasing PA%. In this situation, minimum mineral P input for a given PA% was achieved by minimising land use (Supplementary Material S7).
Alternative situations: impacts of prevention and recycling phosphorus waste
Figure 3 shows the mineral P input in the food system of prevention and recycling P waste to reduce the dependency on phosphate rock. We first describe the effect of prevention and recycling individually. Thereafter, we describe the effect of combinations of prevention and recycling. As expected based on results of the baseline situation (Figure 2; Table 3), recycling of P in human excreta and in processing water (R_Humexc_ProcWater) had greatest potential to reduce mineral P input requirement (Figure 3). Recycling of human excreta implied that P retained in edible plant products and ASF was not lost, but instead could be used to fertilise crops. In this situation, cows were more P efficient than pigs, and, hence, milk and associated beef were consumed as the source of animal protein (Supplementary Material S7). The higher P efficiency of cows followed from the fact that only the P retained in human non-edible products of animals and wasted ASF were lost. The amount of P retained in the sum of these products per kg edible protein was lower in cows than in pigs (Table 2). The increase in P input with increasing PA% was mainly due to increased losses of P through leaching and run-off, and animal and feeding wastes.
The second most promising option was prevention of waste along the crop and animal supply chain (P_Waste_Crop_Animal) (Figure 3). Because in this situation no wastes of crop products occurred, less feed crops were needed to meet nutritional requirements of animals than in the baseline situation. Similarly, less crops and ASF were required to meet nutritional requirements of the human population. In this situation, pigs appeared more P efficient than cows, and, hence, pork was consumed as the source of animal protein (Supplementary Material S7). This higher P efficiency of pigs had two causes. First, P retention in non-wasted ASF from cows was higher than from pigs. Second, P retained in non-wasted ASF was not recycled, and, thus, lost through human excreta. In this situation, mineral P input to the system decreased in the range from 0% to 35% PA, and subsequently increased (Figures 3 and 4). Over the full PA-range, mineral P input to the system was mainly determined by two opposite effects. On the one hand, when increasing PA%, P consumption by humans decreased. The decrease in P consumption was due to the increased displacement of crop products by pork; pork has a low P : N ratio compared with the P : N ratio of the human edible crop products included in our model. As a result of decreased P consumption by humans, P waste through human excreta also decreased. On the other hand, land use increased from a PA% of 20 upwards, and, consequently, P loss through leaching and run-off increased.
When recycling waste of all animal products (R_Waste_Animal), mineral P input by the system decreased for diets in the range from 0% to 30% PA, and subsequently increased. We will discuss mineral P input first for diets in the range from 0% to 60% PA, and subsequently for the range from 65% to 80% PA. For diets in the range from 0% to 60% PA, two opposite effects resulted in a relatively constant mineral P input. On the one hand, pigs were more efficient than cows (see P_Waste_Crop_Animal for explanation) (Supplementary Material S7), and, hence, pork was consumed as the source of animal protein. As a result, P waste through human excreta decreased due to decreased P consumption by humans (see P_Waste_Crop_Animal). On the other hand, P loss through leaching and run-off increased due to increased demand for feed. For diets in the range from 65% to 80% PA, mineral P input increased. In this range, pigs were still more P efficient than cows. However, from 65% PA upward, not enough cropland was available for sufficient production of feed for pigs. Due to this scarcity of cropland, pigs were partly displaced by cows, as cows can value grassland on peat soils (Van Kernebeek et al., Reference Van Kernebeek, Oosting, Van Ittersum, Bikker and De Boer2016). Consequently, P loss through leaching and run-off increased only very slightly. However, following from the production of cows, milk and beef were included in the human diet. Consumption of milk resulted in relatively high P waste through human excretion, as milk has a high P : N ratio compared with other edible products. The increase in P input for diets in the range 60% to 80% PA was mainly caused by increased waste of P through human excretion.
The greatest potential for reducing mineral P input was when prevention of waste of crop and animal products and recycling of human excreta and processing water were combined (Combi_1) (Figure 3). This result is in line with the waste hierarchy (Papargyropoulou et al., Reference Papargyropoulou, Lozano, Steinberger, Wright and Ujang2014). When applying this combination of prevention and recycling, leaching and run-off was the only source of P loss, and, hence, mineral P input was only determined by land use. Combi_2, the combination of recycling of waste of crop products, waste of animal products, and human excreta and processing water, was less efficient than Combi_1; in Combi_2 waste of crop and animal products were recycled while these were prevented in Combi_1. Because these wastes were available for livestock in Combi_2, the default livestock diet was at higher PA% (20%) compared with the default livestock diet in Combi_1 (10%) (Figure 4).
Discussion
Strategies to lowering phosphorus input requirements
We assessed mineral P input requirement in the food system using an optimisation model. As our model minimised the mineral P input in a hypothetical food system, P input for our diets was lower, and P use efficiency higher, compared with estimates found in other studies. Metson et al. (Reference Metson, Bennett and Elser2012), for example, estimated a mineral P input of 5 kg P/cap per year for the production of the average diet in the Netherlands, whereas we found P inputs ranging from 0.7 to 1.0 kg P/cap per year. Metson et al. (Reference Metson, Bennett and Elser2012), however, assumed that the P required by the system was provided by mineral P only, and excluded P provisioning by manure. The P input into our baseline food system would have been 2 kg P/cap per year in case we would have excluded P recycling by manure. Recycling of manure was accounted for by most studies that estimated P efficiency of national food systems. P use efficiencies ranged from 6% in China (Bai et al., Reference Bai, Ma, Ma, Qin, Velthof, Oenema and Zhang2016) to 14% to 29% in the US and west-European countries (Suh and Yee, Reference Suh and Yee2011; Jedelhauser and Binder, Reference Jedelhauser and Binder2015). In our baseline situation with 60% PA, our food system yielded a P use efficiency of about 50%. An important explanatory factor for this relatively high P use efficiency was our assumption of small P losses through leaching and run-off (2.2 kg P/ha per year). The P use efficiency in our baseline food system would have ranged between 27% and 38%, depending on the %PA, in case we would have assumed that leaching and run-off, or equivalent enhanced accumulation of P in soils, was 13 kg/ha per year.
Our modelling exercise of a hypothetical food system provided valuable insights into the potential of prevention and recycling to reduce mineral P input requirements of the food system. In our baseline situation, in which waste of crop products was recycled to a limited extent, and P in waste of animal products, human excreta and processing water were not recycled, a vegan diet had lower P input compared with diets that contained PA. Recycling P from human excreta and industrial processing water showed most potential to reduce mineral P input requirements of the food system. By recycling human excreta and industrial processing water, mineral P requirements could be reduced by ~55% to 65%, depending on the %PA. This reduction potential was mainly due to the high waste of P through human excreta compared with other P waste of the system. When combining prevention of waste of crop and animal products with recycling of human excreta, mineral P input requirements were reduced by ~90%. We also demonstrated that, within our baseline situation, reducing animal protein consumption from the current rate of 60% towards a vegan diet (0% PA) reduced mineral P input requirements by ~25%. A vegan diet was, however, not most P use efficient in situations that included full prevention or recycling of animal products.
We demonstrated that P use efficiency was determined not only by the wastes and recycling rates, but also by P : N ratios in human edible products, and by the ability of animals to convert human inedible crop products. For example, in the alternative situation in which we recycled animal products, pig production was preferred in the 0% to 60% range for animal protein. At higher animal protein percentages, cows partly displaced pigs, as cows can value grassland on peat soils. As a result, P waste of the system increased because of the high P content in milk. If no waste of crop and animal products, and no waste through human excreta occurred, that is P was lost only by leaching and run-off, P loss was minimised by minimising land use.
Implications of a hypothetical food system
Insights gained from our modelling exercise are that both preventing and recycling wasted P, and changing consumption of animal protein can reduce mineral P input to a system. Another insight gained is that the optimal (in terms of P input) consumption level of animal protein depends on the applied (combination of) prevention and recycling of P. Furthermore, we gained insight into the effect of prevention and recycling of P waste on the efficiency of animal production and consumption. We acknowledge that other food systems are bounded to other constraints, resulting from for instance differences in climatic and soil conditions, in different shares of land that can only be used as grassland, in farming practices, in representative types of crops and animals, and in population densities. These differences may lead to other P use efficiencies of crop and animal production systems, and may affect the optimal consumption level of animal protein and the (relative) importance of prevention and recycling to reduce mineral P input. The principles included in our model, however, also hold for other food systems. To illustrate this, we modelled P input for a system with higher P surpluses or P accumulation in the soils, and we concluded that in this situation mineral P input, as well as the optimal (in terms of P input) consumption level of animal protein, were higher compared with our baseline situation. We furthermore acknowledge that human diets in our system were constrained only by their energy, protein and sugar content, and were composed of a specific selection of crop and animal products. We included, for example, pigs as representative for monogastrics, assuming that poultry would behave similar to pigs in terms of P use. Inclusion of micronutrients and a wider range of crop and animal products would be required to conclude on P use efficiency of a system providing healthy and socially acceptable diets.
Other factors that determine phosphorus waste in food systems
The aim of this paper was to assess the potential of prevention and recycling P waste in the food system, in order to reduce the dependency on phosphate rock. To this end, our alternative situations included full prevention or full recycling of P waste. We did not account for the (technical) feasibility, legal aspects, and social acceptance of full prevention or recycling of these wastes. In comparison, the UN Sustainable Development Goal is to reduce waste by 50% by 2030, while the current P recovery rate from municipality processing water treatment plants in the Netherlands is over 80% (CBS, 2016a). Recovered P from municipality processing water treatment plants ends up mostly in building material such as asphalt (Luesink et al., Reference Luesink, Broens, Van Galen, De Buisonje and Georgiev2013). Use of recycled and recovered P from these sources in the food system is restricted by legislation (LNV/VROM, 1997). Moreover, the use of animal meal in feed for farmed animals is banned by European Union regulation as a measure to prevent, amongst others, the spread of Transmissible Spongiform Encephalopathies (TSE). Novel enzyme-based methods to destroy prion infectivity in animal meal have shown potential in degrading infectious prion proteins (Gupta et al., Reference Gupta, Rajput, Sharma and Gupta2013; Okoroma et al., Reference Okoroma, Purchase, Garelick, Morris, Neale, Windl and Abiola2013). The potential to reduce mineral P input by recycling animal meal should be weighed against the (perceived) risk of the occurrence of TSE.
Acknowledgements
The authors thank colleagues from Wageningen University & Research Bert Rijk and Marcel Lubbers (Plant Production Systems Group), and Argyris Kanellopoulos (Operational Research and Logistics Group) for their contributions to crop fertilisation. They also thank Jantine van Middelkoop (Livestock Research) and Jan Weijma (Agrotechnology and Food Sciences) for their insights in phosphorus recycling through human excreta and processing water.
Declaration of interest
The authors do not have conflict of interest with the subject matter of this manuscript.
Ethics statement
No statement.
Software and data repository resources
Data and model used for the purpose of this study are not deposited in an official repository.
Supplementary Material
To view supplementary material for this article, please visit https://doi.org/10.1017/S1751731118001039


