


Introduction
Small alpine glaciers have shown a more-or-less continuous retreat during the 20th century due to increasing temperatures (Reference Dyurgerov and MeierDyurgerov and Meier, 2000). While studies in the Northern and Central Rocky Mountains of North America have shown pronounced glacier retreat as a response to regional climate warming (Reference Marston, Pochop, Kerr, Varuska and VeryzerMarston and others, 1991; Reference Key, Fagre, Menicke, Williams and FerrignoKey and others, 2002), an alpine climate record in the Southern Rocky Mountains of Colorado, USA, shows surface cooling at elevations above 3000 m, despite increases in free-air temperatures (Reference Pepin and LoslebenPepin and Losleben, 2002). This discrepancy between mountain and regional climate trends makes the Front Range an important location for monitoring glacier change. According to United States Geological Survey (USGS) topographic maps based on aerial photographs taken between 1951 and 1958, the Front Range contains 48 ice bodies covering a total area of 2.1 km2 (Reference Fountain, Hoffman, Jackson, Basagic, Nylen and PercyFountain and others, in press). Some of the Front Range glaciers were studied during the 1960s and 1970s (Reference WaldropWaldrop, 1964; Reference Outcalt and MacPhailOutcalt and MacPhail, 1965; Reference CoferCofer, 1972; Reference AlfordAlford, 1973; Reference JohnsonJohnson, 1979), and there are long-term mass-balance records for Arapaho and Arikaree Glaciers (Reference DyurgerovDyurgerov, 2002), but little research has been published on glacier area change since the 1970s.
Established in 1915, Rocky Mountain National Park (RMNP), ~100 km northwest of Denver, CO, covers 1075 km2 and has over three million visitors annually. Located in the northern Front Range, RMNP contains 30 of the glaciers mapped by the USGS, including eight named glaciers (Fig. 1). Nine additional glaciers are located to the north and south of the park. The mapped glaciers range in size from 0.59 to 12.66 ha, with an average size of 3.38 ha. Though aerial photographs and field observations clearly indicate these features contain massive ice, the movement of smaller glacierets is unknown; we apply the term ‘glacier’ to include all perennial ice features that are formed by the accumulation of snow and refrozen meltwater and that are free of debris cover, regardless of size and whether they are thick enough to deform under their own weight. The regional treeline is approximately 3500 m, and glaciers in and near the park occupy elevations between 3416 and 4068 m (average elevation 3663 m). Most of the glaciers of RMNP occupy north- to east-facing cirques eroded by Pleistocene glaciers on the east side of the Continental Divide (Reference MadoleMadole, 1976).

Fig. 1. Map of glaciers and glacierets in RMNP. Climate stations and nearby towns are also indicated.
All of the RMNP glaciers lie below the regional equilibrium-line altitude and can be considered ‘drift’ glaciers. Accumulation is dominantly from snow redistributed by wind and avalanching. Based on measurements from 1962, accumulation on Andrews Glacier was eight times the regional snow accumulation, and on Tyndall Glacier four times (Reference Outcalt and MacPhailOutcalt and MacPhail, 1965). Winter prevailing winds have a strong westerly component that redistributes snow from broad, unglaciated peneplain surfaces above treeline into the east-facing cirques (Reference Outcalt and MacPhailOutcalt and MacPhail, 1965; Reference Winstral, Elder and DavisWinstral and others, 2002). Ablation is strongly controlled by local topographic shading and reductions in albedo due to seasonal dust content, resulting in highly irregular ablation–altitude gradients (Reference Outcalt and MacPhailOutcalt and MacPhail, 1965; Reference JohnsonJohnson, 1979). Aerial photographs show that the late-summer snowline for a given year can be above or below a glacier. Additionally, many Front Range glaciers terminate under a debris cover or merge into rock glaciers. Because of the difficulty in determining the extent, activity and connectivity of the debris-covered areas, it is possible that the exposed ice partly contributes to the mass balance of these features (Reference Outcalt and MacPhailOutcalt and MacPhail, 1965). Small cirque glaciers have generally been considered inappropriate for climatological analysis because of these complexities due to local topography (Reference KuhnKuhn, 1995).
Methods
We assess glacier change throughout the park using the 1 : 24 000 scale USGS maps (based on aerial photographs taken in 1953–58) as our baseline glacier coverage (Reference Fountain, Hoffman, Jackson, Basagic, Nylen and PercyFountain and others, in press). Some of the features mapped on USGS topographic maps have significant errors, but for the most part their location, shape and extent appear reliable. Glacier extents from different time periods were digitized in a Geographic Information System (GIS) from late summer aerial orthophotographs taken in 1990, 1999 and 2001. We defined glacier extent as all exposed contiguous ice, firn and snow. We did not include debris-covered areas in glacier outlines, because it is very difficult to distinguish between debris-covered glacial ice and rock glaciers. While this may incorrectly delineate the total area of a massive ice body, it does correctly delineate the area that responds directly to variations in climate.
Because the glaciers in RMNP are small and we used a number of different sources, clearly defining the uncertainty in our area measurements is important. Many published articles detailing GIS analysis fail to discuss sources and magnitudes of error even though error magnitudes may be significant (Reference Abbaspour, Delavar, Batouli, Virrantaus and TveiteAbbaspour and others, 2003). Though digitization of glacier outlines and calculation of area are relatively straightforward tasks, we face potential errors due to orthorectification of the source image or map, and delineation errors due to shadows, debris or late-season snow. We have some estimate of error for each source. USGS topographic map standards require that <10% of well-defined points have an error greater than 72 ft (22 m), and aerial photos we used have documented positional errors ranging from 1.34 to 11 m. We assume for most cases that errors in delineation due to shadows, debris or late-season snow are small compared to positional uncertainty, and we ignore such errors in our error analysis.
Though we have a good understanding of positional uncertainty in each of our data sources, there is no widely used method appropriate for propagation of positional error into area error. A GIS ‘buffer’ command, which defines the width of a zone around the perimeter, can be used to quantify area uncertainty (e.g. Reference NylenNylen, 2004; Reference Granshaw and FountainGranshaw and Fountain, 2006); however, this computation assumes complete correlation of the errors in all vertices of a polygon, which can lead to unnecessarily large uncertainty values. For applications where the uncertainty is small relative to the change in area being measured, the buffer technique is useful. For the glaciers in RMNP, the buffer technique produces uncertainty values that make changes in area insignificant.
Monte Carlo simulation and associated use of fuzzy set theory has emerged as a useful tool for dealing with error propagation accurately in GIS (Reference HeuvelinkHeuvelink, 1998). However, the technique is still computationally intensive and there are no standard tools available to perform the calculations. An alternative approach to error propagation is to analyze the uncertainty of the area by using the coordinate method of calculating area if the covariance of the error in the vertices is known (Reference GhilaniGhilani, 2000). Reference GhilaniGhilani (2000) describes a simplified technique to calculate the area uncertainty for a polygon by calculating the area uncertainty in an equivalent-area square. Though this approach ignores the shape of the polygon and the covariance of the error between vertices, it produces uncertainty values that are simple to calculate and are of the same order of magnitude as more rigorous techniques (Reference GhilaniGhilani, 2000). Also, the uncertainty values are independent of the quantity of vertices used to digitize a polygon. Trials of the technique with Andrews Glacier found the equivalent-area square method produced uncertainty values between those expected for completely correlated and completely independent vertices. We applied this method to all glacier outlines and used information on position uncertainty to calculate area uncertainty values at the 95% confidence level for each polygon.
In addition to the orthophotographs, we used non-rectified aerial photographs and historic maps (Reference Outcalt and MacPhailOutcalt and MacPhail, 1965) for seven glaciers: Andrews, ‘Icefield’, Moomaw, Rowe, St Vrain, Sprague and Tyndall. The aerial photographs were rectified to the 2001 orthophotographs. For Andrews, Rowe, Sprague and Tyndall Glaciers, we also used a total of 62 late-summer ground-based photographs taken between 1888 and 2005. The RMNP personnel annually monitored Andrews and Tyndall Glaciers from 1934 through 1955, which included repeat photography, providing the most complete photographic record in the park. We resumed annual photographs in 2000 and confirmed the existence of additional perennial ice patches not shown on USGS maps while in the field. The wealth of ground-based photos was used to interpolate glacier area for those times in between the aerial photography and to extrapolate glacier area for dates prior to the aerial photographs.
However, we found large uncertainty in using the ground-based photos because of changes in camera perspective. To minimize this problem, we compared the ground-based photographs from years in which we had calculated area from aerial photos or maps. This subset of ground-based photographs spanned a large range of glacier areas in the record. We used this subset to categorize the perceived size of the glacier in each of the remaining photographs and applied the corresponding area calculated from the maps or aerial photographs. The uncertainty of this estimate was arbitrarily increased to 50% greater than the aerial photos they derived from. The arbitrary value of 50% seemed appropriate based on comparison of many aerial and ground-based photos.
Six of the ground photos, which predate aerial photography, showed extents larger than that of any of the later years. We estimated their extent on aerial photos using permanent landscape features as a guide. The area uncertainty of these features is determined as the root mean square of the positional uncertainty of the aerial photo and our estimate of the positional uncertainty of our digitization, based on clearly identifiable landscape features.
Results
Our calculation of glacier area for 1953, 1990, 1999 and 2001 includes the 30 glaciers in the park shown on USGS topographic maps, as well as the 3 glaciers adjacent to the park in the north near Comanche Peak, and the 6 St Vrain glaciers adjacent to the park in the south (Fig. 1). Total area for the 39 glaciers increased between 1953 (1.32±0.04 km2), 1990 (1.48±0.05km2) and 1999 (1.63±0.05km2), then decreased to 2001 (1.16±0.02km2). The shrinkage between 1999 and 2001 shows that glacier change at RMNP can occur rapidly. Aerial-photograph analysis and field verification revealed many additional ice masses of equal and smaller areas that are not mapped on USGS topographic maps.
The seven individual glaciers studied in more detail all show similar general trends, although the details vary between glaciers (Table 1; Fig. 2). Generally, glacier extent was largest at the end of the 19th and during the first decades of the 20th century, followed by recession to small areas in the mid-1940s. An increase in area occurred during the 1960s–90s, although significant data gaps occur in the 1970s and 1980s. Most of the glaciers exhibit a marked recession since 1999. The photographs show that most of these glaciers do not have a well-defined equilibrium line, and at the end of the ablation season in many years the entire glacier surface may be completely covered in snow or be completely exposed ice. As such, the glacier boundaries can vary significantly from year to year even at the terminus; glacier advance may result from the accumulation of new firn at the terminus rather than from ice flow.

Fig. 2. Change in area of (a) Andrews and Tyndall and (b) Rowe and Sprague Glaciers. Dark squares are from aerial photos and maps; light circles are estimated from ground photos. Grey bars are 90% confidence limits.
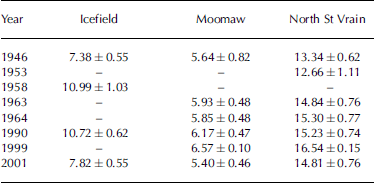
Table 1. Area (ha) of Icefield, Moomaw and North St Vrain Glaciers
Meteorological Trends
No long-term climate stations exist within RMNP, but four National Weather Service stations are located nearby at lower elevations. Of these four, Reference Outcalt and MacPhailOutcalt and MacPhail (1965) determined that temperature and precipitation measurements at Grand Lake (Grand Lake 6 SSW; 2527 ma.s.l.), located 19 km southwest of Andrews Glacier,
were most highly correlated to the 7 years (1957–64) of mass-balance measurements at the glacier. Additionally, the Institute of Arctic and Alpine Research, University of Colorado, has maintained an alpine meteorological station (Niwot Ridge D-1) in the Front Range since 1952 at 3739ma.s.l., 26km south of Andrews Glacier. We compared the Niwot Ridge station and Grand Lake station temperature and precipitation values to those at the USGS station located at Loch Vale (3150ma.s.l.; 1.5 km east of Andrews Glacier) in RMNP from 1983 to 2002. We had anticipated that Niwot station would provide a better correlation because it is at a similar elevation to Loch Vale (and to Andrews Glacier). Using the Loch Vale record from 1983 to 2002, the average summer (May–September) temperatures are strongly correlated with those at Grand Lake (r = 0.91, p = 0.002) and at Niwot Ridge (r = 0.84, p = 0.009). The stronger correlation of Loch Vale to Grand Lake suggests Grand Lake is a better long-term climate record for RMNP than Niwot Ridge.
To determine the controlling climatic factors on RMNP glaciers, we calculated the correlation between the annual mass-balance measurements of Andrews Glacier (1957–64; n = 7 years) and various meteorological measurements at both Grand Lake and Niwot Ridge. Reference Outcalt and MacPhailOutcalt and MacPhail (1965) calculated similar correlations for Grand Lake using four different climate indices, but we added Niwot Ridge and considered all monthly values and seasonal combinations of average temperature and total precipitation. Annual temperature at either station does not significantly (p < 0.05) correlate with Andrews Glacier mass balance; however, temperatures in May (r = –0.84) and September (r = –0.74) at Grand Lake, and in May (r = –0.80) and October (r = –0.70) at Niwot Ridge, do correlate (p < 0.05). The most significant (p < 0.05) combinations of monthly temperature are the average of May–October (r = –0.93) and May–September (r = –0.92) at Grand Lake and the average of May, September and October (r = –0.81) and May–October (r = –0.77) at Niwot Ridge. The only single month of precipitation that has a significant (p < 0.05) correlation is May at Niwot Ridge (r = +0.75), but the total precipitation from April through June at Grand Lake (r = +0.79) is also significant. Summer temperatures at Grand Lake have the highest correlation with Andrews Glacier mass-balance measurements, of all of the climate indicators tested.
In addition to temperature and precipitation, wind also affects the mass balance of Andrews Glacier. Reference Outcalt and MacPhailOutcalt and MacPhail (1965) describe wind effects on both accumulation and ablation. A simple model of wind erosion and deposition based only on slope angle explained 65% of the variation in snow accumulation during winter 1962/63 (Reference Outcalt and MacPhailOutcalt and MacPhail, 1965). Additionally, accumulated wind travel measured at Niwot Ridge explained over 99% of the variation in accumulated ablation at Andrews Glacier measured six times during summer 1962 (Reference Outcalt and MacPhailOutcalt and MacPhail, 1965).
Five years (1969–73) of mass-balance measurements of Arapaho and Arikaree Glaciers (29 and 27km south of Andrews Glacier) showed that the net annual mass balances were controlled by variable ablation rather than accumulation (Reference JohnsonJohnson, 1979). Winter snow accumulation did not vary as much as summer ablation, because winter wind redistribution of snow onto the glaciers made up for any deficits in direct snowfall or blowing-off of excess snow. Variations that did occur were a result of heavy, wet, late-spring snowfalls. If spring snowstorms were lacking, local sediment sources reduced the snow albedo early in the ablation season, which dramatically increased ablation (Johnson, 1979). While the processes observed by Reference JohnsonJohnson (1979) explain the high correlations between Andrews Glacier mass balance and summer temperature and spring snowfall, one needs to be cautious about considering Andrews Glacier representative of Front Range glaciers. Andrews Glacier had the highest mean specific winter balance (470 cmw.e.) of 13 Front Range glaciers measured during the 1969/70 season (average 356cmw.e.) (Reference AlfordAlford, 1973). While most Front Range glaciers depend on a mix of wind-blown snow and avalanching to augment direct snowfall, Andrews Glacier is considered an extreme example that is totally dependent on wind-blown snow (Reference Outcalt and MacPhailOutcalt and MacPhail, 1965; Reference AlfordAlford, 1973). However, generalizing based on the available data, the small alpine glaciers of the Front Range are insensitive to variations in winter snowfall, due to the important addition of wind-transported snow to the glaciers, but are sensitive to variations in summer ablation through variations in summer air temperature and early-spring dust loading.
The temporal trend of summer (May–September) temperature at Grand Lake reveals a significant (p < 0.001) increase of 0.020˚Ca–1 for the entire record of 1950–2005 (Fig. 3). For the first 25 years (1950–75) no significant trend existed, but the following 29 years (1976–2005) exhibited rapid temperature increase of 0.037˚Ca–1 (p = 0.003). This change in temperature trend in 1976 is consistent with the presence of a Pacific Decadal Oscillation signal in the Front Range as recognized by Reference Pepin and LoslebenPepin and Losleben (2002). This change is also consistent with the timing of rapid increases in Northern Hemisphere and global surface temperature records (Reference Jones, New, Parker, Martin and RigorJones and others, 1999) and with a shift to more rapid ice loss by mountain glaciers globally (Reference Dyurgerov and MeierDyurgerov and Meier, 2000).

Fig. 3. Average summer (May–September) temperature at Grand Lake, Loch Vale and Niwot Ridge.
Reference Outcalt and MacPhailOutcalt and MacPhail (1965) showed that average summer (May–September) temperature at Grand Lake could estimate Andrews Glacier mass balance using a regression model with a standard error of ±0.62m (p < 0.01).We found that addition of either winter (November–April) or spring (April–June) precipitation to the regression model did not improve the correlation or reduce the error. Using the original regression equation of Reference Outcalt and MacPhailOutcalt and MacPhail (1965), we estimated 55 years of cumulative mass balance for Andrews Glacier (Fig. 4). A total of 14 of the 55 years are based on temperatures outside of the range of values used in the regression model. From 1950 to 1960 the balance decreased, then increased until about 1977, after which it dropped but then held steady through the late 1980s. Starting in the early 1990s, the balance started to drop, continuing through 2006.

Fig. 4. Cumulative mass balance for Andrews Glacier as predicted by the Reference Outcalt and MacPhailOutcalt and MacPhail (1965) model. White points are years based on temperatures beyond the range of values used to create the model. Vertical lines are 90% confidence limits. Light gray line is Arikaree Glacier mass balance (personal communication from N. Caine, 2006). Inset shows a linear relation between mass balance and change in glacier area for the three points available.
As seen in Figure 4, the cumulative mass-balance curve of Andrews Glacier matches very closely with a cumulative mass-balance curve of Arikaree Glacier covering 1964–2006 (personal communication from N. Caine, 2006). Though the Arikaree Glacier record is partially reconstructed from Niwot Ridge D-1 temperature and precipitation data, it includes seasonal or net mass-balance values measured in 31 out of the 55 years. The long-term mass-balance record at nearby Arapaho Glacier is very similar to that at Arikaree Glacier, though slightly more negative (Reference DyurgerovDyurgerov, 2002). The predicted cumulative mass-balance curve for Andrews Glacier also clearly reflects the global shift in glacier volume-change trend since the late 1970s reported by Reference Dyurgerov and MeierDyurgerov and Meier (2000).
Discussion
Although there have been no further mass-balance measurements on Andrews Glacier, our record of area change can be used to test the cumulative mass balance in a general way. The glaciers in RMNP are so small that they do not have accumulation and ablation zones in the traditional sense. Positive mass-balance years often increase mass across the entire glacier, and increase the area along the edges with new snow and firn, while negative years may expose ice across the entire surface, with no accumulation area. Though the larger RMNP glaciers have bergschrunds and crevasses, movement is very small, so mass transfer down-glacier is probably not a significant cause of glacier advance. These characteristics cause the glaciers to respond immediately to variations in summer climate. Though the relation between mass balance and area change contains too few points to draw conclusions (Fig. 4 inset), it suggests a linear relationship.
The variations in area of Andrews Glacier roughly match variations in estimated cumulative mass balance (Figs 2 and 4). The record of glacier change of Andrews Glacier shows a less dramatic retreat than suggested by the predicted cumulative mass-balance curve. This may be due to a nonlinear response in area change caused by the filling or emptying of steep-sided topographic basins (Reference KuhnKuhn, 1995), despite the linear relationship suggested by the three points in the Figure 4 inset. Perhaps the prediction of mass balance by summer temperature alone breaks down over longer time periods. Increased accumulation could also potentially explain the lower than expected retreat of Andrews Glacier. However, snowpack telemetry (SNOTEL) data at Niwot Ridge show no significant change in snow water equivalent since 1980 (Reference Pepin and LoslebenPepin and Losleben, 2002). Furthermore, as previously mentioned, Front Range glaciers are relatively insensitive to changes in winter accumulation (Reference Outcalt and MacPhailOutcalt and MacPhail, 1965; Reference JohnsonJohnson, 1979). Changes in wind could also affect accumulation. However, the Niwot Ridge record shows no trends in wind speed (Reference Pepin and LoslebenPepin and Losleben, 2002).
Solar radiation may be the controlling factor in ablation of glaciers in the relatively low-latitude Front Range (Reference CoferCofer, 1972; Reference JohnsonJohnson, 1979). Incoming shortwave radiation at Niwot Ridge has decreased significantly since records began in 1971, suggesting increased daytime cloud cover (Reference Williams, Losleben, Caine and GreenlandWilliams and others, 1996). This explanation for the lack of expected glacier change supports the notion of strengthening lapse rate at Niwot Ridge shown by cooling at high elevations relative to lower elevations (Reference Pepin and LoslebenPepin and Losleben, 2002). Unfortunately, solar radiation measurements at high elevations did not start until well after the mass-balance studies were completed and there are no systematic historic records of cloud cover.
Conclusion
Small cirque glaciers owe their existence to topographic effects that enhance accumulation and reduce ablation (Reference KuhnKuhn, 1995), and the RMNP glaciers are consistent with this model. Changes in glacier area respond to summer temperatures and to spring snowfall. The latter is more important for increasing surface albedo than for adding significant mass. The changes in glacier area broadly follow a linear regression model of cumulative mass balance. The changes are similar to glacier variations elsewhere in the American West (e.g. Reference Marston, Pochop, Kerr, Varuska and VeryzerMarston and others, 1991; Reference Key, Fagre, Menicke, Williams and FerrignoKey and others, 2002; Reference NylenNylen, 2004; Reference Granshaw and FountainGranshaw and Fountain, 2006; Reference Jackson and FountainJackson and Fountain, 2007). The glaciers shrank in the early part of the 20th century, enlarged during the 1950s through late 1970s, and started to shrink again at an increasing rate during the 1990s. Though glacier size in RMNP since 1999 is comparable to the minimum of the 1940s, bison remains that were discovered melting out of nearby Front Range glacierets were radiocarbon-dated to over 2000 BP (Reference Lee, Benedict and LeeLee and others, 2006). Their high degree of preservation suggests they have been exposed very little since burial (Reference Lee, Benedict and LeeLee and others, 2006). Glacier recession in the Front Range at present may be greater than at any other time in the historic record.
In the past, cirque glaciers have been considered either insensitive to climatic variations or highly sensitive. We show that cirque glaciers in northern Colorado do respond, albeit in unique ways, to changes in climate, primarily summer temperature. Given the small glacier size and slow movement, we infer that the year-to-year changes in glacier area are due to the formation or ablation of firn or ice around the perimeter of the glacier. Because this creates large interannual variations in area, monitoring these small cirque glaciers is more complicated than for larger glaciers with clearly defined ablation zones. A single observation during a decade may be inadequate to capture the typical glacier size over that time period. Despite these complications, the significance of monitoring small cirque glaciers and glacierets is that they often exist in alpine regions that lack both larger glaciers and climate records. They may be valuable indicators of high-elevation surface temperature, as the relative warming of the surface and of free air in mountainous regions is apparently more complicated than many general circulation models assume (Reference Pepin, Losleben, Hartman, Comrie, Lemos, Hughes and OverpeckPepin and others, 2003).
Acknowledgements
This work was supported by funding from the Rocky Mountain National Park, US National Science Foundation (NSF) grant BCS-0351004 and NASA grant NNGO4GJ41G. Data were provided by the NSF-supported Niwot Ridge Long-Term Ecological Research project and the University of Colorado Mountain Research Station. Data were provided by the Loch Vale Watershed Research Project conducted by the USGS and the Natural Resource Ecology Laboratory at Colorado State University. Aerial photographs were provided by University of Colorado Map Library. Photographs were provided by RMNParchives and the US National Snow and Ice Data Center Glacier Photography Database. We thank N. Caine, M. Losleben and T. Ackerman for providing unpublished data, and A. Barry for aiding in data collection and analysis


