


Introduction

Fig. 1. Hubbard Glacier, Russell Fiord, Alaska, and the potential flood-hazard zone on an abandoned flood plain near Yakutat. Extent of flood plain (hatched) interpreted from false-color infra-red aerial photographs. Heavy arrows indicate direction of ice flow. Broken lines indicate terminal moraines resulting from older advances.
Hubbard Glacier is the largest tide-water glacier in North America. It is about 3400 km2 in area, 122 km long, and flows from a height of 5800 m a.s.l. near the summit of Mount Logan, Canada’s highest peak, to enter the sea at the mouth of Russell Fiord on the southern coast of Alaska (Fig. I). The glacier flows through part of the Wrangell–St. Elias National Park and Preserve to its boundary with the Tongass National Forest. Because it is large and receives

Fig. 2. Speeds of Valerie and Hubbard Glaciers in 1986 and 1987, as functions of time. Speed measurements made by microwave distance surveys of small radio-tracking beacons on the ice. Valerie Glacier site is near ice-radar station (Fig. 4) with glacier bed height of 94 m; Hubbard Glacier site is near ice-radar station with bed height of − 260 m.
2–6 m of precipitation each year (National Weather Service, 1973), the glacier is very active and flows at speeds of 1–5 km a−1 (Fig. 2; Reference Krimmel and SikoniaKrimmel and Sikonia, 1986). During the spring and summer of 1986, the advance of Hubbard Glacier was unusually rapid and as a result temporarily converted Russell Fiord, with an area of 195 km2, into the largest modern glacier-dammed lake known.
Although this blockage of Russell Fiord and its conversion into a lake had already been predicted (Reference Post and MayoPost and Mayo, 1971), the exact timing of the event could not be determined in advance. Residents of Yakutat, a nearby Alaskan community, observed and photographed the fiord closure taking place in April and May 1986 and reported the event.
History
On several occasions in the past, Russell Fiord has been the site of a glacier-dammed lake. Two varved lake deposits along the shores of Russell Fiord that contain buried wood and interbedded stream gravels and glacial till have been dated as being 6310 ± 110 years old and 4890 ± 100 years old, respectively (personal communication from G. Plarker, U.S. Geological Survey, 1987). Reference Plafker and MillerPlafker and Miller (1958) dated two terminal moraines from advances of Hubbard Glacier that would have blocked Russell Fiord in 1130 A.D. ± 130 and again in 1700 A.D. (Fig. 1), Ethnographic history indicates that the last episode in which Russell Fiord was a glacier-dammed lake ended in about 1860 A.D., at which time Tlingit Indians witnessed the sudden drainage of the lake (Reference De Lagunade Laguna, 1972).
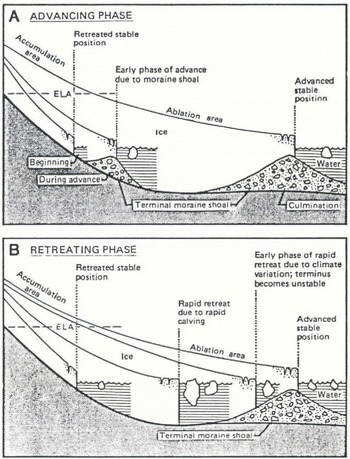
Fig. 3. Cyclical process of advance and retreat of a temperate tide-water glacier. Equilibrium-line altitude, ELA, is the position on the glacier where annual snow accumulation equals annual ablation. Retreating phase could be initiated by any process that causes terminus recession; climate variation is an example of such process.
Cause of Glacier Advance
The present understanding of the processes that cause major asynchronous fluctuations of tide-water glaciers was developed primarily by Reference PostPost (1975). He deduced that glaciers ending in tide waters can advance great distances, as Hubbard Glacier is doing, if they terminate on a protective submarine moraine that is moved by the glacier (Fig. 3a). After a period of advance, a tide-water glacier can become unstable and retreat rapidly when the terminus retreats only a small distance from its moraine (Fig. 3b), as Columbia Glacier did recently (Reference Meier, Rasmussen and MillerMeier and others, 1985).
Hubbard Glacier has been advancing into the entrance to Russell Fiord since 1895, when it was mapped by the British Commission of 1895 (1904). Fiord and glacier-bottom profiles across the terminus of Hubbard Glacier obtained by sonic depth-sounding and ice-radar techniques in August 1986, and the direct observation by the author of a small exposure of moraine at sea-level at the glacier terminus, indicate the presence of a large submarine terminal moraine that is 300 m high and crests at a depth of only 0–50 m b.s.l. (Fig. 4). The calving ice face was near the moraine crest at the time of the survey. The moraine crest was probably also at the terminus in 1895, otherwise the glacier would have retreated rapidly at that time. The fiord bottom at that position is now 320 m b.s.l.; thus, the glacier terminus appears to be moving forward with the moraine crest, and its advance is thought to be controlled by the glacial re-working of the submarine moraine deposit. These observations at Hubbard Glacier support the theory developed by Reference PostPost (1975).
The growth of Hubbard Glacier is caused by annual new firn accumulation on 95% of the glacier area, an AAR of 0.95, and by the presence of the protective submarine moraine which reduces the calving rate at the terminus. The unusually high AAR indicates that the glacier probably is in the early phase of a major new advance (Reference Mayo, Galloway and HamiltonMayo, 1988). Ice

Fig. 4. Floor of Disenchantment Bay and Russell Fiord near terminus of Hubbard Glacier, and bed of the lower glacier. Sonic depth-soundings and ice-radar measurements made by author and D.C. Trabant. Terminus of Hubbard Glacier mapped in 1895 by International Boundary Commission (1952); and in 1961 by U.S. Geological Survey topographic mapping.
loss from Hubbard Glacier is primarily by calving, and relatively little is due to ice melt. A major retreat of Hubbard Glacier in the near future, similar to the recent occurrence at Columbia Glacier (Reference Meier, Rasmussen and MillerMeier and others, 1985), is unlikely because the AAR of Hubbard Glacier is unusually high. Columbia Glacier began its retreat at an average AAR of only 0.57, and substantial ice losses were taking place simultaneously both through ice melting from a large ablation area and because of a similar amount of ice loss caused by calving.
The 1986 Fast Advance
A weak surge in Valerie Glacier, a tributary of Hubbard Glacier, produced wrench faults in the ice near its margins, high ice velocity (Fig. 2), moderately intense crevassing, and extrusion of mud and silty water from the edges of Valerie Glacier, which were observed in June 1986. An increase in the velocity of Hubbard Glacier at the same time is indicated by the rapid advance of Hubbard Glacier into Russell Fiord. This rapid advance caused marine sediments at the glacier terminus to be pushed above sea-level by the near-vertical ice front where it approached the shallow entrance to Russell Fiord. The emergent push moraine, which was photographed by residents of Yakutat in April and May, halted ice calving along about 600 m of the terminus, further increasing the rate of advance there. During those 2 months, Hubbard Glacier advanced 600–700 m across the entrance to the fiord, which produced a relatively narrow, 500 m wide, ice dam with a moraine that finally blocked the entrance of Russell Fiord on 29 May 1986.
The Ice-Dammed Lake
As soon as Russell Fiord was blocked, Russell Lake filled rapidly with fresh water to a height of 25.51 m and inundated about 34 km2 of forest land. This water then burst out on 8 October 1986 (Table I; Reference Seitz, Thomas and TomlinsonSeitz and others, 1986).
Failure of the ice dam initially may have been caused by a submarine landslide from the moraine near the ice dam. The occurrence of such a slide or series of slides is suspected because a localized 300 m recession of the terminus immediately west of the ice dam during August 1986 produced a wide, semi-circular embayment in the glacier terminus but, in this case, all other parts of the terminus advanced at the same time. In late August, soon after the embayment formed, pressure from melt water that was ponded to a height of 30 m a.s.l. in crevasses in the dam produced lateral spreading and lowering of the ice and rapid calving of the dam into Disenchantment Bay.
The day before the outburst of Russell Lake the ice dam was only 150 m wide, and at that time water began passing through the maze of crevasses. The lake reached its maximum height between 22.15 and 22.45 h Alaska Standard Time on 7 October 1986 (Fig. 5). During that time, outflow through the ice dam equalled stream flow into the Fiord. During the ensuing outburst, primarily on 8 October 1986. 5.41 km3 of water were released in about 30 h.
The rate of lake-volume change at any time, Vt, can be calculated from lake-height observations (Table I) and from lake-surface areas measured from topographic maps. The volume-change rate is evaluated for 1 h periods using the following relationship:
Table I. Height, volume, and discharge of russell lake

1. Datum corrected to mean sea-level.
2. Lake volume change + average inflow (340 m3s−1) → average discharge rate for preceding hour.
3. − sign indicates flow into lake before ice-dam failure.
4. Inflow variability due to inability of gauge to measure accurately small changes in water height.

Fig. 5. Height of Russell Lake on 7 October 1986, at beginning of outburst. Dots indicate heights measured by manometer; circles show heights reported by Reference Seitz, Thomas and TomlinsonSeitz and others (1986). Measurements corrected to sea-level datum. Accuracy of manometer is approximately ±0.003 m.

where ḣt is the rate of water height change, ht is the average height during the evaluation period, h60 is the lake height of 60 m, A0 is the initial lake area at sea-level (195 km2), and A60 is the lake area at 60 m (275 km2).
The lake-discharge rate at any time, Qt, is equal to the lake-volume change plus the much smaller inflow rate, I, of 340ms−1, which is estimated to have been equal to the average inflow rate immediately before the outburst (Table I), so that
The ice-dam failure produced a peak discharge, averaged over 1 h, of 105 000 m3s−1. This may be the largest known outburst in the past century. By comparison, the discharge rate of the 1934 Grimsvátn, Iceland, jökulhlaup was 50 000 m3s−1 (Reference ThorarinssonThorarinsson, 1957). The measured peak flow of Alaska’s largest river, the Yukon, is 29 000 m3 s−1. Thörbjorn Karlsson (Reference JonssonJónsson, 1982) estimated from a large debris flow of pumice, ice, and mud during an eruption of the ice-clad Katla Volcano in Iceland in 1918 that discharge was 1.5 × 10⁶ m3 s−1. This event was not an outburst of stored water, however, and only a fraction of the total flow was water.
The water rushing from Russell Lake in 1986 caused 500 m of glacier retreat at the dam site as ice blocks calved from Hubbard Glacier into one side of the widening channel. Shore erosion, determined by re-mapping from photographs, ranged from about 50 to 300 m on the other side. As much as 50 m of erosion occurred in highly jointed slate, argillite, and graywacke (Reference Plafker and MillerPlafker and Miller, 1957). On Osier Island, where the graywacke is not well-jointed, an estimated 2–3 m of bedrock erosion took place. Small roots were still present in joints in the rock after the outburst. The southern tip of Osier Island began as a bedrock pinnacle with glacial till and beach gravel surrounding it, forming a connection to the main part of the island. Only a small remnant of this bedrock survived the outburst. An alluvial fan deposit of cobbles, coarse gravel, and sand that had extended from Gilbert Point towards Osier Island was completely removed. The fan had extended 200–300 m from bedrock into the Fiord. The outburst plume entered

Fig. 6. Rate of change in speed of decline of Russell Lake. Rate of change for each 15 min shown at the end of that period. Solid line is linear regression line for the data. Broken line shows an exponential rate of change during the first 45 min of outburst.
Disenchantment Bay at its measured surface speeds at the center of flow of 11.0 ms−1 at 06.22 h and 9.8 ms−1 at 08.12 h. The water had sufficient momentum to carry it 6 km across the bay as a highly turbulent river-at-sea that washed against the terminus of Turner Glacier.
The water speed was measured by two methods. In the first, timed horizontal and vertical theodolite angle readings on large turbulent cells were observed from a geodetic control monument located on Gilbert Point looking over the outburst channel from Osier Island into Disenchantment Bay (Fig. 4). In the second, distances of travel to a stationary microwave transponder located in the direction of outburst flow were measured using automatic distance-measuring equipment attached to a helicopter that followed the flowing water, and travel times were noted.
The lake level (Table I) was monitored during the outburst (Reference Seitz, Thomas and TomlinsonSeitz and others, 1986). During the first 2 h, the discharge increased rapidly as the ice dam calved into the widening channel. As a result, the lake decline accelerated (Fig. 4) at the rate of about 0.8 m h−1 each hour (Fig. 6). An exponential increase in discharge is common for outbursts from glacier-dammed lakes and usually continues until the lake is nearly emptied (Reference Post and MayoPost and Mayo, 1971; Reference ClarkeClarke, 1982). The outburst from Russell Lake did not follow the usual pattern, because the flow from the lake was controlled by a bedrock channel between Osier Island and Gilbert Point after the relatively small ice dam, together with the alluvial fan, had been swept away during the first few hours of the outburst. After the initial exponential increase during dam failure, the lake flowed out at a nearly constant rate of about 100 000 m3s−1 for about 5 h (Table I ; Fig. 7).
This remarkably steady peak discharge of long duration can be explained by a gradual shift in the control of discharge during that time from the disintegrating ice dam and eroding alluvial fan to a more stable bedrock channel at Osier Island. When the outburst could first be seen, at 05.00 h on 8 October, the ice dam, its push moraine, and the alluvial fan were gone. The flow of water at that time was being controlled primarily by the bedrock channel and the lake height. This control mechanism was indicated by a zone across the channel where the water slope steepened abruptly and the water speed increased. After the 5 h long period of peak flow, and about 7 h after the outburst began, the flow began to decrease exponentially as the reservoir simply drained through an outlet of nearly constant shape.
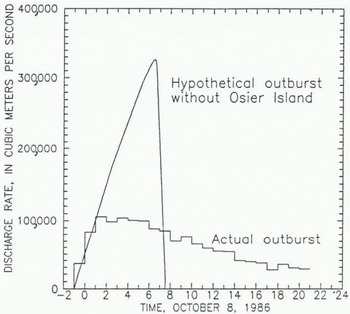
Fig. 7. Discharge hydrograph for 8 October 1986, showing outburst of Russell River from Russell Lake, Alaska. Discharge rate calculated from lake-height measurements (Table I). Estimate of hypothetical outburst if Osier Island had not controlled the flow of most of the water from the lake.

Fig. 8. Terminal positions of Hubbard Glacier between 1961 and June 1987. Glacier position in 1961 from U.S. Geological Survey topographic maps; position in 1978 from Reference Krimmel and SikoniaKrimmel and Sikonia (1986). Shoreline position shown is that before the events of 1986. Bedrock controlling outburst was located in channel between Osier Island and Gilbert Point.
During the last few days before the outburst, the rising lake water began to float parts of the terminus of Hubbard Glacier immediately north of Osier Island and large masses of this ice rotated bottom-outward into the lake. Had this unusually rapid calving process continued for a longer time, the outburst might have taken place on the northern side of the island and the peak discharge from such an outburst would have been greater than it was. In this case, the entire outburst would have been controlled only by the progressive brittle failure of Hubbard Glacier and the flow of water would have increased until the lake was drained. A conservative method of estimating what the discharge rate would have been, if Osier Island had not been present, is to assume that the decline in lake level continued to increase at a rate equal to, but not greater than, the linear rate observed during the first 2 h of the outburst (Fig. 6). In a hypothetical situation (Fig. 7), discharge would not increase linearly, even for long because the decrease in lake area would tend to compensate for the increasing decline rate. If this method of estimation is proved valid, then a peak discharge greater than 300 000 m3 s−1 might have been possible.
Future Events
The present general advance of Hubbard Glacier has been neither halted nor reversed by the outburst described (Fig. 8), which indicates that the protective submarine moraine at the terminus of the glacier was not disturbed in any major way. Sonic depth soundings in the channel after the outburst show that it was eroded to a depth of only 20 m, thus it is predicted that Hubbard Glacier will close Russell Fiord again in a few years time and that it may continue to advance towards the Gulf of Alaska for centuries to come. This advance probably will not be altered to any great extent by moderate climatic variations or by glacier-speed pulses or surges because the position of the terminus at any time is linked closely to the position of the slowly advancing submarine moraine, and the AAR value of 0.95 indicates a strongly positive mass balance for the glacier.
If Hubbard Glacier does continue to advance and blocks Russell Fiord again, either the lake could burst out again or it could overflow at the southern end of the fiord as it did prior to about 1860 (Reference De Lagunade Laguna, 1972). If an outburst were to open a channel through the ice north of Osier Island, a large amount of ice could be eroded and the discharge rate could be very large indeed. Such an event could erode part of the protective submarine moraine and threaten the stability of the calving terminus of Hubbard Glacier.
A simple glacier run-off model (Reference Mayo and KaneMayo, 1986) applied to the Russell Fiord basin estimates that an average of about 7.1 km3 a−1 of run-off, equal to 220 m3 s−1, would be produced. At such a rate, Russell Lake would fill to an overflow site at 39 m a.s.l. at the southern end of Russell Fiord if an outburst did not occur, and would store about 8.6 km3 of water in 1.5 years, the exact time depending on the season of the year in which the lake begins to fill. If the ice dam were sufficiently strong, the lake would not burst out, and the fiord then would become a stratified lake with fresh water overlying residual sea-water. This stratification would alter significantly the water circulation, chemistry, and temperature of the fiord, and thus its viability as a habitat (Reference Reeburgh, Muench and CooneyReeburgh and others, 1976). The lake would inundate about 60 km2 of forest land adjacent to Russell Fiord before it overflowed into the Situk River near Yakutat (Fig. 1). Overflow would re-activate a forested river channel in a wide abandoned flood plain that was active before the lake drained in about 1860. The overflow would be added to that of the present small clear Situk River, which now has an average discharge of between 10 and 15 m3 s−1. This could be expected to produce a large turbid river with an annual average flow of about 230 m3s−1. A flow of this magnitude would flood and erode forest lands and productive fish habitats as well as an airfield for small aircraft, sections of two roads, subsistence fishing camps, and archaeological sites in down-stream areas (Fig. 1).
More detailed accounts of the advance of Hubbard Glacier and its effects on Russell Fiord and the Yakutat area have been described elsewhere by Reference Mayo, Galloway and HamiltonMayo (1988).
Acknowledgements
This study was made possible during the rapidly progressing event by co-operation of two bureaus of the U.S. Department of Interior, the U.S. Geological Survey and the National Park Service, and the Forest Service agency of the U.S. Department of Agriculture. I thank A. Post, J.E. Costa, and T.D. Hamilton of the U.S. Geological Survey, H. Clough of the Forest Service, and anonymous referees for significantly improving the paper by making helpful review comments.


