

Introduction
Powder-snow avalanches occur when some external force such as the wind initially acts to suspend non-cohesive powder snow on a steep mountain slope. The snow particles suspended by the turbulent motion of air are then impelled by gravity toward the steepest direction, thus leading to the formation of a powder-snow avalanche. The powder-snow avalanche rapidly grows as increasing quantity of snow particles is suspended from the dry-snow layer below. Thus, the entrainment of dry snow particles from the bed is essential to avalanche development. The turbulence of the air-snow mixture itself acts to create new turbulence. However, if the intensity of turbulence is not strong enough to keep snow particles in suspension, the avalanche runs out with resulting deposition of the initially suspended snow particle.
Recently, the avalanche dynamic has been a subject of considerable study (Reference HopfingerHopfinger, 1983; Reference Hutter and NohguchiHutter and Nohguchi, 1990). Most of these studies, however, are restricted to stream avalanches. It is clear that studies of power-snow avalanches are warranted.Reference Fukushima Fukushima (1986) and Reference Fukushima and ParkerFukushima and Parker (1990) developed the fluid-dynamical theory of self-accelerating powder-snow avalanches and applied it to the Maseguchi avalanche, which occurred at Maseguchi, Niigata Prefecture, Japan, on 26 January 1986. The results of their numerical simulation of the powder snow avalanche are quite reasonable. The model of Reference Fukushima and ParkerFukushima and Parker (1990) cannot, however, predict the running course of the avalanche, as it is an input to the model. From the engineering point of view, it is desirable that the running course can be estimated by a simulation model based on the known topography of the mountain slope.
In the new model presented here, the running course is simulated along with other dynamical quantities. The model can take into account the three-dimensional topography of mountain slopes. It consists of the two-dimensional treatment of momentum balance, the mass conservation equations of air and snow, and an approximate equation of conservation of turbulent energy.
Topography of the Slope and its Modeling
Generally, the topography of the mountainous areas where avalanches occur is complicated. As a result, some kind of modeling of topography is needed. In our investigation, ground topography is discretized in terms of triangular elements. The positions and the elevations are given at the nodal points of each element. The elevation is taken to vary linearly within a given element, so that the slope is constant. The total coordinates are described by (X, Y, Z) and the local coordinates on the element are described by (x,y,z). The horizontal distance on the (X,Y) plane is S and the local distance in the inclined plane is s. The vector normal to the slope is expressed by in and its components are defined by (inx, iny, inz ).
The direction angle of the steepest slope ϕ and the slope angle θ0 , as shown in Figure 1, are related to the normal vector as follows:
and
The angles of inclination in the x and y directions arë obtained from ϕ and θ0 as shown in Figure 1, as follows:

and

The direction of the running course and the direction of the steepest slopes are not generally identical. As shown in Figure 1, the direction angle of the running course defined relative to the x axis is denoted by ψ. The slope angle θ along the running course can thus be expressed in terms of the geometric relation between the direction angle of the avalanche ϕ, the direction angle of the steepest slope ϕ, and the angle of the steepest slope θ0 and the angle γ as follows:
and
Insofar as the three-dimensional topographical data is given, the direction of the steepest slope θ0 and the maximum slope angle ϕ can be obtained from Equations (1) and (2). The slope angles in the x and y directions, as well as θx and θy, are calculated from Equations (3) and (4).

Fig. 1. Angles of directions of the maximum downward slope and running course of the avalanche.
Theory of Powder Snow Avalanches
Basic Equations
An important characteristic of powder-snow avalanches is that the total buoyancy of the avalanche varies with time and location via erosion or deposition of the surface snow layer. The modeled shape of a powder-snow avalanche is shown in Figure 2 in which ρ and pa are the densities of the avalanche and the air, respectively. Pb and Pi are the lengths of the bottom and the interface between air and the avalanche, respectively, θ is the slope angle, h is the height, t is time, A is the area of the avalanche in the transverse direction, C is the mean volume concentration of snow, and Κ is the mean turbulent intensity in the avalanche. U and V are velocity components in the x and y directions, respectively, and Uabs is the absolute velocity of the avalanche. It is assumed that the shape of the avalanche is uniform in the transverse direction to the flow. The basic equations of motion are the mass conservation equations of air and snow, the momentum equations in the x and y directions, and an approximate equation of conservation of turbulent kinetic energy (Reference FukushimaFukushima, 1986). The mass conservation equation for air may be written as

The mass conservation equation of snow particles is expected to be

The momentum equation in the x-direction takes the form

The momentum equation in the y direction takes the form

The equation of the level of turbulence can be expressed as

The absolute avalanche speed, Uabs is described as


Fig. 2. Schematic view of a modeled powder-snow avalanche.
In Equations (7)-(11), vs is the terminal velocity of snow particles in air and kv is the added mass coefficient, β is a non-dimensional coefficient related to the viscous dissipation rate of turbulent energy in the avalanche, and ξ A, ξ t, ξ b) and ξ p are shape factors (described below). Ea and Es are coefficients describing the entrainment of air from above and snow particles from below. The location of the avalanche is obtained from the integration of the following two equations:
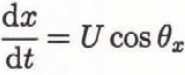
and
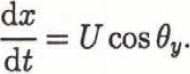
Here x and y are the local coordinates in an element. The direction of the running course is calculated by the relation

In order to solve Equations (7)-(14), it is necessary to specify several constitutive relations. The shear stresses acting on the bottom τb and the interface τi are taken to obey the following respective relationships:
and
Here, α is a non-dimensional coefficient which must be determined with reference to experimental data, ρb the mean bottom density of avalanche, and ρa the density of air. These are given in terms of the following relations where ρ denotes the overall density of avalanche:
and
Hence, cb is the near-bottom volume concentration of snow in the avalanche, and R = (ρ − ρa)/ρa is the effective specific gravity of snow immersed in air.
The entrainment coefficients of air and snow, Ea and Es , are expressed by the following relations, respectively (Reference Escudier and MaxworthyEscudier and Maxworthy, 1973; Reference Beghin, Hopfinger and BritterBeghin and others, 1981; Reference Akiyama and FukushimaAkiyama and Fukushima, 1984):
where θ is measured in degrees (°), and
for Zc < Z < Zm . For Ζ > Zm, Es = 0.3; and Es = 0 for Ζ < Zc, in which the lower limit of Z, Zc = 5, and the maximum limit of Z, Zm = 13.2. In Equation (21)),

The above relation is obtained based on the analogy to the concentration distribution for open-channel suspensions flow expressed by the Rouse equation. Equation (22)) was introduced by Reference ParkerParker (1982) in order to simulate turbidity currents in the ocean. The shape of the avalanche is described by
and
where the shape factors ξP , ξA , ξb and ξi are expressed below assuming that the shape of an avalanche is half an ellipse:

Equation (30)) is estimated from the experimental results of Beghin and others (1981), as analyzed by the present authors.
The rate of lowering of the elevation of the surface snow layer η b, is expressed by a form of the Exner relation for sediment continuity (Reference Fukushima and ParkerFukushima and Parker, 1990) as

where λ is the porosity of the snow layer.
Finally, the functional relationship for β as determined by Reference FukushimaFukushima (1986) and Reference Fukushima and ParkerFukushima and Parker (1990) takes the form

Here, c D is the friction coefficient which must be determined by reference to data. In Equation (32)) the various shape factors are functions of slope angle. It thus follows that the coefficient β is also a function of the slope angle.
Methodology of the Numerical Simulation
In order to simulate a powder-snow avalanche, the topographic domain of interest is discretized in terms of a triangular mesh. All points on the mesh are given three-dimensional topographical data, such as the elevation of the nodal point. In the model, the geometrical location of the mass center of each triangular element is stored in array form. The simulation is carried out by the integration of Equations (7)-(14) with the aid of Equations (12)-(32). As mentioned earlier, the shape of the avalanche varies with slope angle; thus the volume of the avalanche continuously varies. The unknown variables are A, U, V, C and K, and the height of the avalanche is calculated from Equation (23)).
Application to Maseguchi Avalanche
The properties of snow particles are known to vary with meteorological conditions. We assume that the diameter of the snow particles Ds = 0.15 mm, and the effective specific gravity of snow R = 710 (same value as for pure ice). The corresponding fall velocity in air vs =0.45 m s−1. The initial height of the avalanche A0 =10 m. The initial area A0 is calculated by Equation (23)). The drag coefficient c D and the non-dimensional coefficient α are taken to be 0.02 and 0.1, respectively. The initial values of the speed of the avalanche and the concentration are given by the condition that the avalanche just barely begins to self-accelerate.
Figure 3 shows the running course of the avalanche as simulated by the present model. Three locations are chosen as starting points for avalanches. The avalanche starting from the southeast slope of Mount Gongen is seen to turn strongly to the left as it runs out. The avalanches starting from the two eastern points tend to curve to the right, thus approaching Maseguchi village. These running courses are very close to the one observed by Reference Fukushima and ParkerFukushima and Parker (1990) andReference Kobayashi and Izumi Kobayashi and Izumi, (1988). They indicated an avalanche width of 200 m. The results of the present simulation indicate that the avalanche reaches Maseguchi village. The model thus predicts the disaster of 1986 in which 11 houses were destroyed and 13 people were killed.

Fig. 3. Running course of the avalanche simulated by the present model.
The results of the numerical simulation of an avalanche reaching Maseguchi are shown in Figures 4–8. Figure 4 indicates the variation of the elevation along the running course of an avalanche in which the abscissa is the horizontal distance of the running course. As shown in Figure 5, the height of the avalanche increases until the avalanche has moved 600 m downslope of its starting point. Subsequently the avalanche height remains constant. As the avalanche reaches from 0 to 600 m, the slope is quite large (Fig. 4) and the entrainment of air (equ.20) becomes large. Thus, the rapid increase of the height occurs. Figure 6 indicates that the speed of the avalanche is continuously changing dependent on the local slope angle. These results are nearly identical to those of the previous model (of Fukushima and Parker). The volume concentration of snow particles rapidly increases on the steep slope of the east side of Mount Gongen, and then varies mildly with the slope angle as shown in Figure 7. Figure 8 indicates that the level of turbulence,

Fig. 4. Elevation along the running course of the avalanche. The abscissa corresponds to the horizontal distance along the running course.

Fig. 5. Variation of the height of the avalanche. The abscissa is the same as that of Fig. 4.

Fig. 6. Variation of the speed of the avalanche.

Fig. 7. Variation of the volume concentration of snow in the avalanche.

Fig. 8. Variation of the level of turbulence in the avalanche along the flow direction.
The advantage of the present model over the previous model is that an estimated running course of the avalanche can be computed using three-dimensional topographical data. Some problems, however, still remain. For example, the present model is assumed to be two-dimensional in the transverse direction, and the snow entrainment coefficient Es is only crudely estimated based on an analogy to open-channel suspensions. We are presently conducting experiments on three-dimensional thermals in order to understand further the dynamic behavior of three-dimensional powder-snow avalanches. The results of the latter experimental data should help develop a theory of three-dimensional powder-snow avalanches.
Conclusions
A theory of self-reinforcing powder-snow avalanches which takes into account arbitrary three-dimensional surface topography has been developed. The theory is applied to the Maseguchi avalanche which occurred in 1986, in Niigata, Japan. The advantage of the present model is that the running course can be computed using three-dimensional topographical data. The present avalanche theory can also predict the variations of height, speed, volume concentration of snow particles, avalanche volume, and the rate of erosion from or deposition onto the bed surface. The results of the numerical simulation of the Maseguchi avalanche are satisfactory.
The present model is essentially two-dimensional in nature. That is, the internal structure of the avalanche is not described. The snow entrainment function represented only a rough estimate based on a loose analogy to the open-channel suspensions. These points should be refined in future.
Acknowledgement
Funding from the Japan National Science Foundation (grant no. 04201210) is gratefully acknowledged.


