


Introduction
During sea-ice formation, ice crystals aggregate in a solid matrix, and the rejected liquid brine, containing 60−70% of the dissolved and particulate constituents of sea water, is expelled in a network of interconnected channels approximately 200 μm to 1cm in diameter (Reference Weeks and AckleyWeeks and Ackley, 1982; Reference Weissenberger, Dieckmann, Gradinger and SpindlerWeissenberger and others, 1992). The brine-containing interstices and pockets found in the sea ice host a variety of organisms, including bacteria, autotrophic and heterotrophic protists, microalgae and metazoa (Reference Palmisano, Garrison and FriedmannPalmisano and Garrison, 1993). Contained within the brine is also dissolved organic matter (DOM): the in situ product of biogenic processes such as algal and bacterial exudation, viral lysis, grazing and excretion by-products (Reference Baines and PaceBarnes and Pace, 1991; Reference Hygum, Petersen and SondergaardHygum and others, 1997).
Organic matter is the energetic substrate for microbial heterotrophic growth and development. The supply of DOM has been argued to be the key factor in regulating bacterial growth rate, more than temperature per se in both the marine and sea-ice environment (Reference Thingstaad and MartinussenThingstaad and Martinussen, 1991; Reference GrossmannGrossmann, 1994; Reference Helmke and WeylandHelmke and Weyland, 1995). DOM is therefore central for the fuelling of the microbial loop and remineralization processes within the sea ice, with bacterial community production contributing up to 20% of primary production (Reference Kottmeier and SullivanKottmeier and Sullivan, 1990). Field studies by Reference Smith, Gosselin, Kudoh, Robineau and TaguchiSmith and others (1997) measured a high correlation between dissolved organic carbon (DOC) and chlorophyll abundance, although this relationship is not always so straightforward (Reference Thomas, Lara, Eicken, Kattner and SkoogThomas and others, 1995,Reference Thomas, Lizotte and Arrigo1998, Reference Thomas2001a, Reference Thomas, Kennedy, Kattner, Gerdes, Gough and Dieckmannb).
Relatively few studies have been conducted into the production and fate of DOM in sea ice, although evidently DOM is enriched in sea ice, at times to very high concentrations (Reference ThomasThomas and others, 2001a). A study of DOC in cores from Arctic multi-year ice measured DOC concentrations of 50−100μM, with peaks of >600μM in bottom ice (Reference Thomas, Lara, Eicken, Kattner and SkoogThomas and others, 1995). DOC concentrations of 0−2000 μM have been measured in ice cores from the Antarctic perennial pack ice (Reference Thomas, Lizotte and ArrigoThomas and others, 1998, Reference Thomas2001a). Sea-ice brines were particularly enriched with DOC, up to 870 μM where biological activity was apparently low, although estimated brine concentrations up to 23 mM were recorded. In contrast, in bottom layers of first-year sea ice in the Canadian sub-Arctic, DOC concentrations (50 to > 200μM) exceeded those in the underlying sea water and were strongly correlated to bacterial abundance and production (Reference Bunch and HarlandBunch and Harland, 1990). DOC concentrations in platelet ice from a Weddell Sea (Antarctica) coastal inlet have been observed to be 100−200 μM, double the open-water values measured in the area (Reference Thomas, Kennedy, Kattner, Gerdes, Gough and DieckmannThomas and others, 2001b).
Experimental work and analyses of field samples have shown that the initial concentration and distribution of inorganic nutrients within sea-ice cores is determined by the salinity of the ice and that nutrients are proportional to the brine salts rejected (Reference Clarke and AckleyClarke and Ackley 1984; Reference CotaCota and others, 1987; Reference Garrison, Close and GordonGarrison and others, 1990). However, no investigation has been conducted into the effects of ice formation and growth on dissolved organic constituents contained in surface sea water. One of the major problems with such investigations is to separate biological influences from the physical and chemical processes, as well as being able to follow temporal developments. These factors can only be satisfactorily considered by experimentation with laboratory-controlled production of sea ice (Reference Grossmann and GleitzGrossmann and Gleitz 1993; Reference Weissenberger and GrossmannWeissenberger and Grossmann, 1998; Reference HaasHaas and others, 1999). This paper describes a tank experiment designed to elucidate the behaviour of DOM and nutrients during sea-ice formation under controlled, quasi-abiotic conditions. Changes in DOM concentration in ice, brine and underlying water were studied in comparison to salinity and inorganic nutrients during a 5 day freezing period.
Methods
The study was conducted in the Arctic Environmental Test Basin at the Hamburg Ship Model Basin, Germany (HSVA), in November 1998. Three polyethylene 1 m3 tanks, placed in a sea-water-filled indoor (30 m × 6 m × 1 m) basin, were filled with 1000 L of synthetic sea water made using Instant Ocean salts (Aquarium Systems Ltd). The initial surface salinity was approximately 33 in each tank (Table 1). The tanks were placed in the calm area of the basin, where no current action was generated. Differing amounts of DOM were added to the enclosures prior to freezing and mixed in order to obtain a homogeneous solution (initial concentrations of DOC: tank A = 180 μM; tank B = 320 μM; tank C = 448 μM).
Table 1. Mean daily water salinity of the three tanks over the whole experimental freezing phase

In an effort to simulate a realistic composition of DOM, microalgal-extracted DOM was used from harvested cultures of the diatom skeletonema costatum maintained in non-axenic conditions. This source ensured that a wide range of organic compounds would be present, representing a wide spectrum of biological lability. The diatom cells were separated from the sea-water medium by reverse filtration and ruptured to release internal cellular DOM contents by a rapid change in temperature from ambient to −70°C (personal communication from K. Flynn, 1998). Algal medium extracts were filtered through GF/F filters (pre-combusted at 500°C for 3 h) and the filtrate preserved at −20°C until use.
Experimental formation of sea ice was obtained by cooling the air above the basin to approximately −15°C. Ice-crystal fog was sprayed on the surface of the water to act as nuclei for the initiation of ice growth (Reference Evers and JochmannEvers and Jochmann, 1993). Sampling devices were positioned in each tank so that water could be vacuum-pumped (∼600psi) from directly under the developing ice sheet (surface water), from 50 cm depth (middle) and 90 cm depth (bottom) (Fig. 1). The upper tube could be moved vertically to avoid freezing into the growing ice cover. Water samples were collected through Teflon tubing (4 mm internal diameter), to which a waterproof, 50 V heating cable was tied to prevent freezing. The Teflon tubes and heating cables were supported within watertight supporting tubes that were shaped to ensure sampling depths could be maintained. Sampling and support tubes exposed to the air were further encased within insulating tubing (Fig. 1).

Fig. 1. Cross-section diagram of the sampling apparatus used in each of the tanks for collecting water samples from under the solid ice sheet, from 50 cm depth (middle) and 90 cm depth (bottom). note that the uppermost tube was adjusted during the experiment to sample water immediately below the growing ice cover.
Ice growth lasted for a total period of 5 days. Consolidated ice thickness in each tank was recorded daily. At the end of the experiment, nine ice cores were taken from each tank using a titanium corer (8 cm internal diameter), with minimal handling and care to prevent brine drainage and contamination. Individual cores from each tank were cut in 5 cm sections, and brine from each section centrifuged for 3−4 min from the ice matrix at 900 rpm at −2°C (Reference Weissenberger, Dieckmann, Gradinger and SpindlerWeissenberger and others, 1992; Reference Grossmann and GleitzGrossmann and Gleitz, 1993). Subsequently, centrifuged ice-core sections and brines were pooled. The ice was melted at 4°C. The volumes of both the extracted brines and melted ice sections were measured, and salinities were also measured using a digital conductivity probe (WTW, Weilheim, Germany, precision of ±0.2 %).
Before filtration, 20 mL subsamples for bacterial abundance were preserved with 2 mL of 20% buffered formalin (final concentration 1%). Bacterial cells were enumerated by epifluorescence microscopy following DAPI staining and standard methodologies (Reference Porter and FeigPorter and Feig, 1980).
Further subsamples were filtered through precombusted GF/F filters for later determination of nutrients and DOC. Nutrient samples were stored in 50 mL polyethylene bottles and preserved at −20° C. Nitrate and phosphate were measured using a standard Technicon autoanalyzer with relative errors of between ± 2% and ± 5% (Reference Kattner and BeckerKattner and Becker, 1991). Standards and blanks were made up using salinities approximating those of the samples. Hence brine, ice and water samples were analyzed separately. DOC samples were flame-sealed in 30 mL precombusted glass ampoules and preserved at −20°C until analysis by high-temperature oxidation on an MQ1001 total organic carbon analyzer (Reference Qian and MopperQian and Mopper, 1996).
Results and Discussion
Air temperatures recorded from thermistors 1.5 m above the ice surface averaged −14.4±0.6°C throughout the experimental period (Reference HaasHaas and others, 1999). After 120 h of freezing, the ice was 10.7 ± 0.9 cm thick, corresponding to a growth rate of 2 ±0.5 cm d-1. Below a thin layer of granular ice, the ice had a columnar crystal texture typical for young ice grown under calm conditions (Reference Weeks and AckleyWeeks and Ackley, 1982). A typical pore structure consisting of brine channels and interlinked brine layers had developed (Reference HaasHaas and others, 1999). At the end of the experiment, the tank-water salinity had increased by a mean across all three tanks of 3.7 (by 3.6 in tank A, by 3.5 in tank B and by 4.0 in tank C) due to brine expulsion from the growing ice sheet into the water (Table 1).
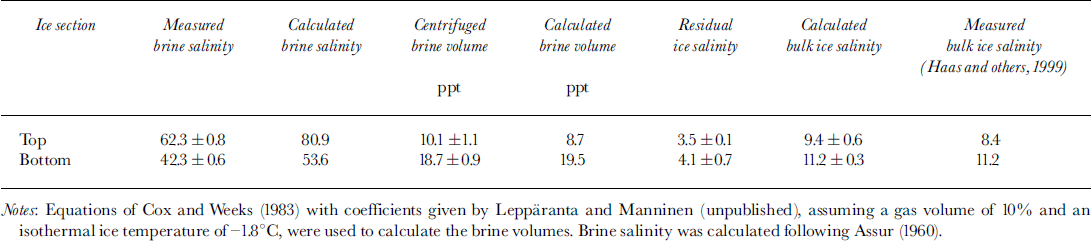
The ice had a C-shaped salinity profile typical for young ice growth (Reference Weeks and AckleyWeeks and Ackley, 1982), with raised salinities of 11−15 in the top and bottom centimetres and lower salinities of 6−8 in the middle (Reference HaasHaas and others, 1999). Due to the colder ice temperatures, measured salinities of the obtained brines were 62.3 in the top compared to 42.3 in the bottom sections (Table 2), in rough agreement with values calculated from empirical equations (Reference AssurAssur, 1960). The obtained brines amounted to 10.1% and 18.7% of the total sample volume (Table 2), also in close agreement with theoretical values calculated from bulk ice salinity and temperature (Reference Cox and WeeksCox and Weeks, 1983). Centrifuged ice samples still had residual salinities of 3.5−4.1, showing that not all brine could be centrifuged out of the ice. This confirms the results of Reference Weissenberger, Dieckmann, Gradinger and SpindlerWeissenberger and others (1992), who showed that brine may remain isolated in channels and cannot be released by centrifugation alone at the temperature at which the ice is kept. The salinities and volumes of centrifuged ice and brine samples were combined to calculate the bulk salinity of the ice. Values are in good agreement with direct measurements of bulk ice salinity (Reference HaasHaas and others, 1999; Table 2). Thus, Table 2 gives an impression of the accuracy which could be achieved with our experiments.
Table 2. Comparison of measured and calculated mean ice and brine properties at the end of the experimental period in top and bottom sections of the ice
Nitrate and phosphate generally co-varied with salinity (Fig. 2a and b) and were approximately within the range predicted by the dilution lines, extrapolated from water values measured at the beginning of the experiment. However, at salinity > 40, nitrate in tanks A and B was found to be in excess of the predicted dilution line. Dilution lines provide a measure of the conservative behaviour of the sea-water constituents in question. If nutrients and/or the DOM are concentrated or expelled due to purely physico-chemical processes during ice formation, concentrations should be a direct function of the salinity. This is true for the underlying water into which brine has been introduced from the developing ice cover. The dilution lines were different in the three tanks for phosphate and DOC (Fig. 3) due to different starting concentrations between tanks. In contrast, because the starting concentrations of nitrate were virtually the same in all three tanks, the dilution lines for each tank were indistinguishable at a resolution beyond the analytical error.

Fig. 2. Nitrate (a) and phosphate ( b) plots as a function of salinity of water and brine and centrifuged ice ( m circles). the solid lines represent the dilution lines extrapolated from surface water nitrate and phosphate values at the start of the experiment. the three dilution lines for phosphate result from there being significantly different starting concentrations between the three tanks. this was not the case for nitrate where starting concentrations were the same for all three tanks. linear regression analysis of the nitrate data gives the following relationship: y = 0.89x-2.84; r2= 0.89, n = 48, p < 0.001. linear regression analysis of the pooled phosphate data gives the following relationship: y = 0.061× - 0.11; + r2 = 0.98, n = 43, p<0.001.

Fig. 3. Doc concentrations of the three experimental enclosures as a function of salinity of water and brine and centrifuged ice (in circles). dilution lines are drawn for tanks a-c and are derived from different initial surface water doc values at the start of the experiment (see text for values).
The results are as expected, showing the conservative behaviour of nutrients during ice growth and brine rejection. Physical forcing on nutrient incorporation in newly formed sea ice is consistent with field studies on young sea-ice cores (Reference Dieckmann, Lange, Ackley and JenningsDieckmann and others, 1991). There was a significant enrichment of nitrate in the brines collected from tanks A and B above that predicted from the dilution line (Fig. 2), which was not evident in the phosphate measurements.
Bacteria were consistently found in concentrations of 1−8 × 10⁶ cells L−1 in ice, water and brine during the experiment. There was no evidence that bacteria were being differentially distributed between water, ice and brine. Bacterial densities were not correlated in any way with nutrients or DOC, suggesting that they do not have any influence on the measurable nutrient or DOC dynamics in the system.
DOC in tank A had an initial concentration of 180 μM, whereas tanks B and C had values of 320 and 448 μM, respectively. Over the experimental period there was a homogeneous distribution of DOM in the waters of tanks A and B at all depths, in contrast to tank G. In the brine of the top section of the consolidated ice there was a characteristic and substantial enrichment of DOC with maximum concentrations (tank A = 578 μM; tank B = 923 μM; tank C >1158 μM). These values were up to 10 times larger than those in centrifuged ice, and 3 times larger than those in water (Fig. 3). The brine from the top section was always more enriched in DOC than the bottom and less saline section. DOC was found to be up to four times higher in brine than in the underlying water, which indicates a general basic agreement of our experimental findings with field samplings (Reference ThomasThomas and others, 2001a).
DOC distributions in ice, water and brine are more scattered relative to the dilution line than both nitrate and phosphate (see Figs 2 and 3). DOC in tanks B and C was concentrated within the brine, reaching concentrations up to 200−300 μM higher than values expected from dilution-line predictions (Fig. 3). DOC in the brine of tank C, where it was particularly highly concentrated, showed a maximum difference from the dilution line of 500 μM enrichment. The partially large differences to the dilution line may indicate a potential selective retention of DOC in the brine interstices. However, due to the limited dataset it is clear that further experiments are needed to verify these findings.
The implication for natural conditions is that DOC is initially physically constrained into the ice interstices in relatively large quantities and available to the organisms entrapped. In the natural environment these DOC values will be modified by biological activities to either a further enrichment, due to release and decaying cells, or depletion due to heterotrophic action.
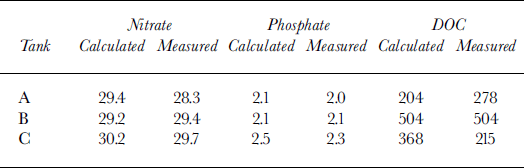
Nutrient and DOC budgets were calculated on the basis of water volumes and measured salinity in each tank and compared with the actual measurements (Table 3). Measured and calculated levels of nitrate and phosphate in all surface waters are within the same range, differences being within the analytical error. DOC measured values for tank A were in excess of the calculated value by 74 μM; tank B shows a value exact to the predicted value; and in tank C 153 μM are unaccounted for (Table 3). This gives a further indication of the excess DOC found in brine compared to water.
Table 3. Measured nitrate, phosphate and doc contents (μm) ofthe water under the ice in the three experimental tanks, compared with the predicted values on the basis of conservative behaviour of these (based on water volumes and measured salinity in each tank)
These first results using experimental tanks in simulated polar conditions, and excluding biological processes, reflect the evidence for conservative behaviour of nutrients in the brine pockets of sea ice. However, findings indicate that DOC may be more concentrated within the brine than inorganic nutrients, and the pattern of incorporation might be different in the highly saline interstices of the ice. Future investigation of DOM in experimental ice studies such as the determination of individual organic compounds may further elucidate the DOC incorporation into brine and ice.
Acknowledgements
We are grateful to K.-U. Evers and the staff at the HSVA for their support and hospitality. We thank M. Stürcken-Rodenwald of the Alfred Wegener Institute, Bremerhaven, for the nutrient analysis, and M. Budd and the mechanical workshop staff at the University of Wales, Bangor, for their help. The study was sponsored by the European Commission Training and Mobility of Researchers Program (contract No. ERBFMGECT950081). Partial funding was provided by the British Council/Deutscher Akademischer Austauschdienst (Academic Research Collaboration Programme), the Natural Environment Research Council (grant Nos. GT9/2894, GR9/3309), the Nuffield Foundation and the University of Wales, Bangor.


